minnesota oral health data book children and youth -...
TRANSCRIPT

Minnesota Oral Health Data Book Children and Youth
October 2006
Division of Community & Family Health

Minnesota Oral Health Data Book Children and Youth
October 2006
If you require this document in another format, such as large print, Braille or cassette tape, call:
Community and Family Health Division P.O. Box 64882 St. Paul, MN 55164-0882 651-201-3760 PHONE 651-201-5797 TDD/TYY www.health.state.mn.us www.health.state.mn.us/divs/cfh/oralhealth/

MN Oral Health Data Book, Minnesota Department of Health 1
Acknowledgements
Mildred Hottmann Roesch, RDH, MPH Project Director
Minnesota Department of Health Division of Community and Family Health
Clare E. Larkin, RDH, BA Project Contractor
Normandale Community College Faculty in Dental Hygiene
Marilyn J. Kennedy, PhD, MSW Data Consultant
Minnesota Department of Health Division of Community and Family Health
Photos Used With Written Permission
Funded by United States Department of Health and Human Services
Health Resources and Services Administration Grant Number H47MC02019

MN Oral Health Data Book, Minnesota Department of Health 2
Table of Contents
Acknowledgements 1 Table of Contents 2 Introduction 3 Factors Influencing or Affecting Dental Caries 4 Children/Youth Beverage Consumption 5 Community Water Fluoridation 6 Dental Sealant 7 Factors Influencing or Affected by Periodontal Diseases 8 Diabetes: Effects on the Oral Health of Children and Youth 9 Periodontal Diseases as Risk Factors for Pre-term or Low Birthweight Babies 10 Youth Tobacco Use in Minnesota 11 Youth Daily Cigarette and Smokeless/Spit/Chewing Tobacco Use 12 Factors Influencing or Affecting Access to Oral Health Care 13 Child Health and Development Programs
Early Periodic Screening, Diagnosis, and Treatment Services/Child and Teen Checkups 14 Head Start/Early Head Start 15 Oral Health Care for Children and Youth with Special Health Care Needs 16
Oral Health Care Centers 17 Medical/Dental Insurance 18 School-Related Oral Health Services and Activities 19 Socioeconomic Factors The Oral Health of Children: A Portrait of Minnesota and the Nation 20 Low Income/Poverty 21 Minnesota Free and Reduced Price Meals 22 Workforce Ability to Find Dentists in Southeast Minnesota - Wilder Research Study 23 Health Professional Shortage Areas/Dental Designation 24 Pediatric Dentistry 25 Summary 26 Reference 27 - 31 Additional Resources 32 - 34

MN Oral Health Data Book, Minnesota Department of Health 3
Introduction
Optimal oral health is fundamental to an individual’s overall physical, social and emotional well-being. Sound oral health contributes to an individual’s quality of life, including self-image and self-esteem, which plays a role in social and educational interactions as well as employment marketability. However, despite a high percentage of fluoridated community water supplies, multiple successful treatment options and expanded opportunities for the provision of oral health services, preventable oral diseases continue to affect Minnesota children and youth.1
Many Minnesota children and youth now enjoy better oral health than did their parents. However, certain segments of the population, such as, those who are poor, have special health care needs, or are members of racial or ethnic minority groups, still have severe tooth decay, much of which remains untreated.2
Scientific research has provided a clear understanding that tooth decay is an infectious, transmissible, destructive disease caused by acid-forming bacteria. Data from recent national surveys reaffirm that dental caries is the single most prevalent chronic disease of childhood. Tooth decay is closely linked to socioeconomic levels, with children from low-income families being more likely to develop dental caries (tooth decay) despite their regular exposure to fluoridated water. Children affected with dental caries frequently have problems with school attendance and performance.3
Emerging evidence suggests a relationship between periodontal health and overall general health. Of particular concern is the rising rate of children with Type II diabetes who are showing risk factors for periodontal diseases at an earlier age than once known. Preventable oral health conditions that go untreated adversely affect the United States health care system. Difficulty in accessing oral health care by certain populations has resulted in increased visits to hospital emergency rooms by children and youth for non-traumatic dental care. The cost of palliative care in emergency rooms is substantially higher than in private practice dental offices and is often incomplete.4 Although the emergency room physician can prescribe antibiotics and pain medications, s/he can not address the underlying problem(s) as a dentist.
The goal of the Minnesota Oral Health Data Book Children and Youth is to gather data from numerous sources into a single document, thereby, providing an overview of the status of the oral health of Minnesota’s children and youth and the oral healthcare delivery systems available to them. Hopefully, this landscape of Minnesota-specific oral health data can be used to foster a greater understanding of the importance of addressing and developing statewide oral health promotion and disease prevention activities, services and policies.

MN Oral Health Data Book, Minnesota Department of Health 4
Factors Influencing or Affecting Dental Caries
Included in this section:
• Children/Youth Beverage Consumption
• Community Water Fluoridation
• Dental Sealants

MN Oral Health Data Book, Minnesota Department of Health 5
Factors Influencing or Affecting Dental Caries (Children/Youth Beverage Consumption):
Children/Youth Beverage Consumption Milk: Calcium contained in milk contributes to the formation of healthy teeth and bones. One 8 ounce glass of milk contains 300 mg. of calcium. Data from the Minnesota Student Survey indicates that 45-52% of students reported drinking 1 to 2 glasses of milk per day. This contributes only 300 mg. to 600 mg. calcium to the recommended daily intake of 1300 mg. calcium for children and youth 9 – 18 years of age.5 Water: Sanitary drinking water in the form of tap water, well water or bottled water is essential for maintaining a healthy body. In Minnesota more than 98% of municipal water systems contain optimal fluoride levels (0.9 to 1.5 parts per million (ppm) to prevent dental caries in children. Well water may contain sub-optimal levels of fluoride and should be tested to assure adequate fluoride levels for families with children. Increasingly, people are choosing to drink bottled water for reasons which include convenience, taste, and a perception of safety. Most bottled waters contain only small amounts of natural fluoride. Furthermore, bottled waters must indicate fluoride levels on the label only if fluoride is added during processing.7 In addition, home water filters may remove fluoride. Therefore, it is important to determine how much fluoride is present in the bottled product or consumed in other forms to assure adequate fluoride intake to prevent tooth decay. Fruit Juice/Soda Pop/Sports Drinks: Children and youth are increasingly consuming soda pop and fruit juices, thereby, replacing milk and water as daily beverages. A typical non-diet soda pop contains approximately nine teaspoons of sugar and a high level of acidity that is associated with increased dental caries in children and youth.8 Although sports drinks and fruit-based drinks may contain some vitamins and minerals, they contribute to dental caries if consumed frequently or in large amounts.
Source: Minnesota Student Survey, 2004

MN Oral Health Data Book, Minnesota Department of Health 6
Factors Influencing or Affecting Dental Caries (Community Water Fluoridation):
Community Water Fluoridation
Community water fluoridation continues to be the most cost-effective and equitable means to provide protection from tooth decay. Income level or social status does not affect a person’s ability to receive the benefits of water fluoridation.10
• Minnesota ranks third in the nation, behind Kentucky and Illinois, for percentage of the state population on public water systems receiving fluoridated water.11
• About 75% of Minnesotans have access to municipal water supplies which are virtually all fluoridated (98%) compared with an average of only 66% of the U.S. population on fluoridated public water systems. About 25% of the state’s population live in rural areas with private wells that probably do not have the optimal amount of fluoride to prevent tooth decay in children.
• The amount of optimally fluoridated water needed daily for children and youth for dental caries prevention is calculated on an age-specific basis using the baseline adult recommendation of 1 part per million fluoride per liter water per day.13
• Minnesota’s high percentage of community water fluoridation addresses the U.S. Healthy People 2010 Oral Health Objective: Increase the proportion of the U.S. population served by community water systems with optimally fluoridated water.12
Source: Centers for Disease Control and Prevention, 2006 14 Source: Centers for Disease Control and Prevention, 2006 15

MN Oral Health Data Book, Minnesota Department of Health 7
Factors Influencing or Affecting Dental Caries (Dental Sealants):
Dental Sealants A dental sealant, also called a pit and fissure sealant, is a plastic material that is professionally applied to the chewing surfaces of back teeth (molars) to prevent cavities. Decay-producing bacteria cannot invade the pits and fissures on chewing surfaces due to the physical barrier provided by the sealant. The likelihood of developing pit and fissure decay begins early in life with children between the ages of 5 and 15 receiving the most benefit from sealants. Appropriate use of dental sealants will reduce morbidity and thus save time and money and the discomfort associated with dental treatment procedures.16 Nationally, during 1999-2002, an average of 32% of all U.S. children ages 6-19 years received dental sealants.17 Because there are no statewide oral health surveys or oral health surveillance systems, dental sealant data for Minnesota are limited to information provided by the Minnesota Department of Human Services for children enrolled in Minnesota Public Health Care Programs (Medicaid and MinnesotaCare). • During 1998 – 2004, an average of 11% of MN children ages 6 to 12 years who were eligible for public health programs actually
received dental sealants; a very slight increase (10.4% to 12.0%) in sealant use was noted during these years. • Despite this slight increase, the vast majority of eligible children (88%) did not receive dental sealants through Minnesota Public
Health Care Programs. The U.S. Healthy People 2010 Oral Health Objective: Increase the proportion of children who have received dental sealants on their molar teeth.18
Source: Minnesota Department of Human Services: 2003, 2004 19
Dental Sealant Utilization for MN Children Ages 6-12 Enrolled in Public
Health Programs, SFY 2004
12%
88%
Eligible children who received sealants on one or more molars N = 14,794 Eligible children who did not receive sealants N = 108,162
Dental Sealant Utilization for MN Children Ages 6-12 Enrolled in Public Health
Programs, 1998-2004
11,626
12,357 10,65
3 14,794
122,956
111,816
111,624
114,050
0 20,000
40,000
60,000
80,000
100,000
120,000
140,000
1998
2000
2002
2004
Eligible children
Eligible children who received sealants on one or more molar teeth
Elig
ible
chi
ldre
n
Total enrollment = 122,956

MN Oral Health Data Book, Minnesota Department of Health 8
Factors Influencing or Affected by Periodontal Diseases Included in this section:
• Diabetes: Effects on the Oral Health of Children and Youth
• Periodontal Diseases as Risk Factors for Pre-term or Low Birthweight Babies
• Youth Tobacco Use in Minnesota
• Youth Daily Cigarette and Smokeless/Spit/Chewing Tobacco Use

MN Oral Health Data Book, Minnesota Department of Health 9
0 2 4 6 8 10 12 14
Number of affected teeth
0
20
4
0
60
8
0
Number of affected teeth
Factors Influencing or Affected by Periodontal Diseases (Diabetes: Effects on the Oral Health of Children and Youth):
Diabetes: Effects on the Oral Health of Children and Youth
Persons with diabetes have a higher incidence of periodontal diseases with more severe forms contributing to impaired oral health. Conversely, severe untreated periodontal diseases often make control of blood sugar more difficult putting diabetics at risk for health complications.20 Regular dental visits, including dental cleanings, provide opportunities for prevention, early detection and treatment of periodontal diseases which has been found to improve glycemic load (blood glucose) in patients with poorly-controlled diabetes. 21
• One in 10 Minnesotans either has diabetes or is at high risk of developing it.22 • 281,000 Minnesotans have diabetes; of that total, 200,000 know they have this health problem and 81,000 are unaware of it.23 • In children and teens with diabetes, tooth and gum diseases appear to begin around puberty and worsen with age.24 • Children with diabetes frequently have much higher plaque and gingivitis levels and other serious dental problems than
non-diabetic children.25 • Improving the gingival health of children and youth with diabetes addresses the U.S. Healthy People 2010 Oral Health
Objective: Reduce periodontal disease.26
A recent study (2006) conducted at Columbia University Medical Center found that children with diabetes develop gum diseases earlier in life than those without diabetes. Children participating in the study also had more plaque and gingival inflammation and, therefore, greater periodontal destruction than non-diabetic children. Number of teeth with more than 2mm attachment loss was significantly higher in diabetic children, as seen below.27
0 2 4 6 8 10 12 14
0
20
4
0
6
0
80
% o
f Stu
dy C
hild
ren
Diabetic Children and Periodontal Tooth Destruction Ages 12-18 years (n=94)
Non-Diabetic Children and Periodontal Tooth Destruction Ages 12-18 years (n=61)
% o
f Stu
dy C
hild
ren
MN Oral Health Data Book, Minnesota Department of Health 10
Low Birthweight (<2500 gms.) over time, by race and ethnicity of mother
6.2 6.5 6.1 5.8 7.2 7.7
6.6 6.8 5.6 5.6
4.9 3.8
8.5
6.2 6.3 4.8
4.1
13.4
11.5
4
6
8
10
12
14
16
African American American Indian Asian Hispanic White
Race / Ethnicity
% o
f All
Live
Birt
hs
US 1989-1993 US 2000-2004 MN 1989-1993 MN 2000-2004
13.3
Factors Influencing or Affected by Periodontal Diseases (Periodontal Diseases as Risk Factors for Pre-term or Low Birthweight Babies):
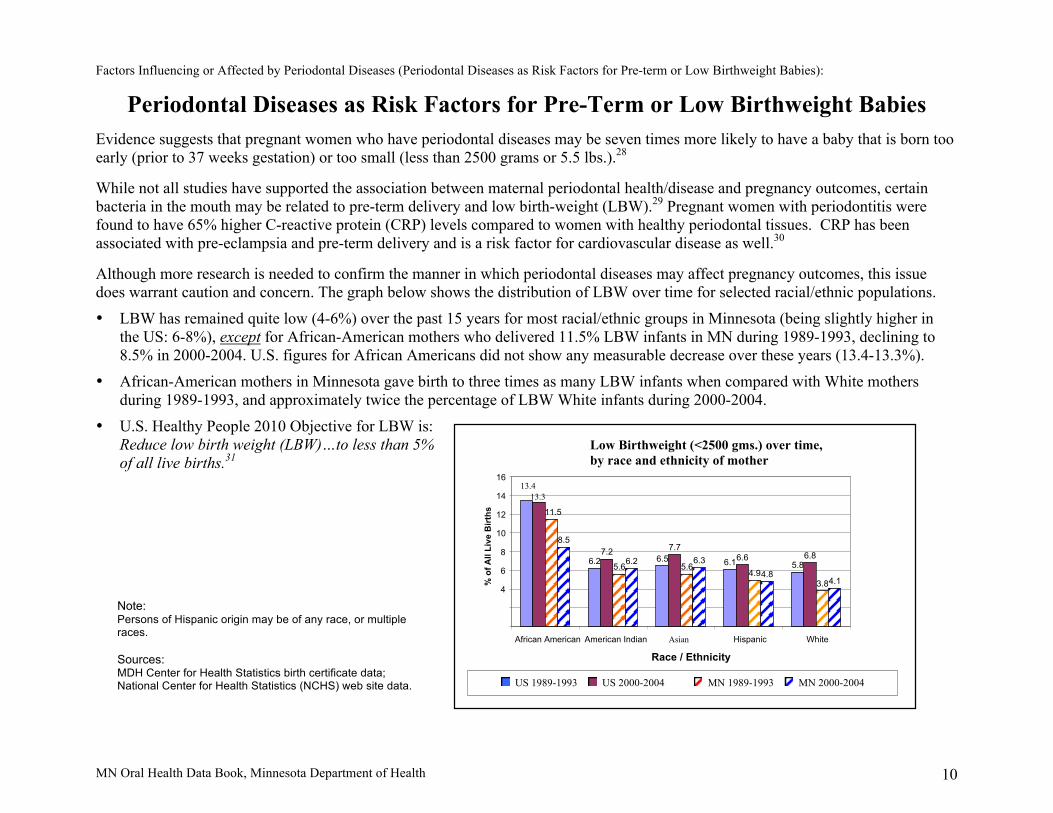
Periodontal Diseases as Risk Factors for Pre-Term or Low Birthweight Babies Evidence suggests that pregnant women who have periodontal diseases may be seven times more likely to have a baby that is born too early (prior to 37 weeks gestation) or too small (less than 2500 grams or 5.5 lbs.).28 While not all studies have supported the association between maternal periodontal health/disease and pregnancy outcomes, certain bacteria in the mouth may be related to pre-term delivery and low birth-weight (LBW).29 Pregnant women with periodontitis were found to have 65% higher C-reactive protein (CRP) levels compared to women with healthy periodontal tissues. CRP has been associated with pre-eclampsia and pre-term delivery and is a risk factor for cardiovascular disease as well.30
Although more research is needed to confirm the manner in which periodontal diseases may affect pregnancy outcomes, this issue does warrant caution and concern. The graph below shows the distribution of LBW over time for selected racial/ethnic populations.
• LBW has remained quite low (4-6%) over the past 15 years for most racial/ethnic groups in Minnesota (being slightly higher in the US: 6-8%), except for African-American mothers who delivered 11.5% LBW infants in MN during 1989-1993, declining to 8.5% in 2000-2004. U.S. figures for African Americans did not show any measurable decrease over these years (13.4-13.3%).
• African-American mothers in Minnesota gave birth to three times as many LBW infants when compared with White mothers during 1989-1993, and approximately twice the percentage of LBW White infants during 2000-2004.
• U.S. Healthy People 2010 Objective for LBW is: Reduce low birth weight (LBW)…to less than 5% of all live births.31
Note: Persons of Hispanic origin may be of any race, or multiple races. Sources: MDH Center for Health Statistics birth certificate data; National Center for Health Statistics (NCHS) web site data.

MN Oral Health Data Book, Minnesota Department of Health 11
Factors Influencing or Affected by Periodontal Diseases (Youth Tobacco Use in Minnesota):
Youth Tobacco Use in Minnesota
Although rates are currently declining, the use of cigarettes, smokeless tobacco, and cigars among youth suggests that the risk for nicotine addiction and subsequent health problems caused by tobacco, in particular the effects on the oral cavity, continue to be issues of concern. Smokers have seven times the risk of developing gum diseases when compared with non-smokers.32 Smokeless tobacco can cause gums to recede and increases the likelihood of losing bone that holds teeth in place.33 Youth are most likely to try smoking and using smokeless tobacco during the ages of 11-15 years, or sixth through tenth grade.34 As reported by MN students responding to the Minnesota Student Survey:
• During the years 2000-2005, tobacco use by middle school students in the 30 days prior to each survey has steadily decreased in both MN and U.S.
• In addition, usage by MN middle school students was slightly lower than the national average for each of these years. • While also declining, tobacco use by MN high school students in the 30 days prior to each survey was slightly higher than the
national average at each measurement point.
Footnote: 2004 U.S. only; 2005 MN only Source: Minnesota Department of Health, Center for Health Statistics, December 2005 35
High School Students (9-12) Using Any Tobacco in
Previous 30 Days
27.4
29.3
38.7
34.4
28.4
34.5
0 5
10
15
20
25
30
35
40
45
2000
2002
2004
2005
% o
f all
stud
ents
su
rvey
ed
Middle School Students (Grades 6-8) Using Any Tobacco in Previous 30 Days
9.5
11.2
12.6
15.1 13.
3 11.8
0 2 4 6 8
10
12
14
16
2000
2002
2004
2005
% o
f all
stud
ents
su
rvey
ed
MN Oral Health Data Book, Minnesota Department of Health 12
Factors Influencing or Affected by Periodontal Diseases (Youth Daily Cigarette and Smokeless/Spit/Chewing Tobacco Use):
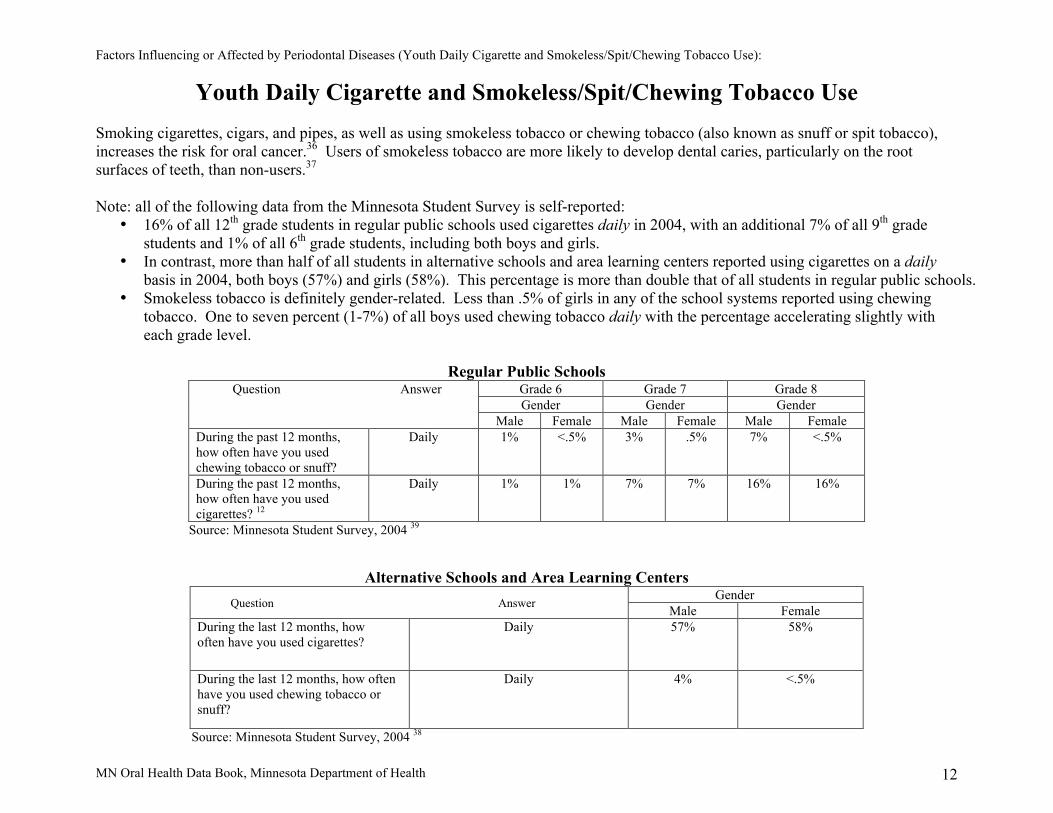
Youth Daily Cigarette and Smokeless/Spit/Chewing Tobacco Use Smoking cigarettes, cigars, and pipes, as well as using smokeless tobacco or chewing tobacco (also known as snuff or spit tobacco), increases the risk for oral cancer.36 Users of smokeless tobacco are more likely to develop dental caries, particularly on the root surfaces of teeth, than non-users.37 Note: all of the following data from the Minnesota Student Survey is self-reported:
• 16% of all 12th grade students in regular public schools used cigarettes daily in 2004, with an additional 7% of all 9th grade students and 1% of all 6th grade students, including both boys and girls.
• In contrast, more than half of all students in alternative schools and area learning centers reported using cigarettes on a daily basis in 2004, both boys (57%) and girls (58%). This percentage is more than double that of all students in regular public schools.
• Smokeless tobacco is definitely gender-related. Less than .5% of girls in any of the school systems reported using chewing tobacco. One to seven percent (1-7%) of all boys used chewing tobacco daily with the percentage accelerating slightly with each grade level.
Regular Public Schools
Grade 6 Grade 7 Grade 8 Gender Gender Gender
Question Answer
Male Female Male Female Male Female During the past 12 months, how often have you used chewing tobacco or snuff?
Daily 1% <.5% 3% .5% 7% <.5%
During the past 12 months, how often have you used cigarettes? 12
Daily 1% 1% 7% 7% 16% 16%
Source: Minnesota Student Survey, 2004 39
Alternative Schools and Area Learning Centers Gender
Question Answer Male Female During the last 12 months, how often have you used cigarettes?
Daily 57% 58%
During the last 12 months, how often have you used chewing tobacco or snuff?
Daily 4% <.5%
Source: Minnesota Student Survey, 2004 38

MN Oral Health Data Book, Minnesota Department of Health 13
Factors Influencing or Affecting Access to Oral Health Care
Included in this Section: • Child Health and Development Programs
Early Periodic Screening, Diagnosis, and Treatment Services/Child and Teen Checkups Head Start/Early Head Start Oral Health Care for Children and Youth with Special Health Care Needs
• Dental Health Care Centers
• Medical/Dental Insurance
• School Oral Health Services and Activities
• Socioeconomic Factors The Oral Health of Children Low Income/Poverty Minnesota Free and Reduced Price Meals
• Workforce Ability to Find Dentists in Southeast Minnesota- Wilder Research Study Health Professional Shortage Area/Dental Designation Pediatric Dentistry

MN Oral Health Data Book, Minnesota Department of Health 14
Factors Influencing or Affecting Access to Oral Health Care (Child Health and Development Programs):
Early Periodic Screening, Diagnosis and Treatment Services/Child and Teen Checkups Early Periodic Screening, Diagnosis and Treatment (EPSDT) is the federal package of Medicaid benefits for children and youth. Under EPSDT requirements, states must provide comprehensive health and development screenings, as well as vision, dental, and hearing services to children and youth up to age 21.39 The program does not define which specific dental services must be provided. However, at a minimum, dental benefits must include relief of pain and infection, restoration of teeth, and maintenance of dental health. Oral assessment as well as direct dental referral is required for every child in accordance with the periodicity schedule set by the state.40
Child and Teen Checkups (C&TC) is the name given to Minnesota’s EPSDT program. MN C&TC is a comprehensive child health program provided to children (newborn through age 20) who are enrolled in Medical Assistance or MinnesotaCare.41
• In fiscal year (FY) 2005, eligible children ages 6-14 received the most dental services (54%) compared with other age groups. • During the years 2001-2005, the number of eligible children ages 6-9 receiving any dental services increased from 41% to 48%.
Source: Minnesota Department of Human Services Source: Minnesota Department of Health C&TC Participation Report, 2006 42 Health Systems Capacity Measure #07B, 2006 43
C&TC eligible children receiving any dental services, by age group
age group
Age
FY 2005 N =138,306
39,562
26,284
9,260 2,666
24,806
35,728
0 5,000
10,000 15,000 20,000 25,000 30,000 35,000 40,000 45,000
0-2
3-5
6-9
10-14
15-18
19-20
# C
hild
ren
C&TC eligible children ages 6-9 receiving any dental services during the year
2001-2005
65,746
69,788
26,454
27,107
35,728 33,47
9 32,063
73,680 71,68
1 63,831
0 10,000 20,000 30,000 40,000 50,000 60,000 70,000 80,000
2001 200
2 2003 200
4 2005
Children receiving any dental services
Eligible children
# C
hild
ren
MN Oral Health Data Book, Minnesota Department of Health 15
Minnesota Early Head Start Dental Report (ages 0 & 3) 2004-2005 Program Year
890
1,424
Percent of children (0-17) living in households with incomes above/
Received dental exam
Received dental screening
Total annual enrollment *
0 500 1,000 1,500
# Children
400
Minnesota Head Start Dental Report (ages 3 & 4) 2004-2005 Program Year
10,300
15,549
6,940
3,135
2,528
Received dental treatment (as result of dental exam)
Received preventive dental care (as result of dental exam)
Received dental exam **
Total annual enrollment *
Diagnosed as needing dental treatment (result of dental exam)
0 5,000 10,000 15,000 20,000
# Children
Factors Influencing or Affecting Access to Oral Health Care (Child Health and Development Programs):
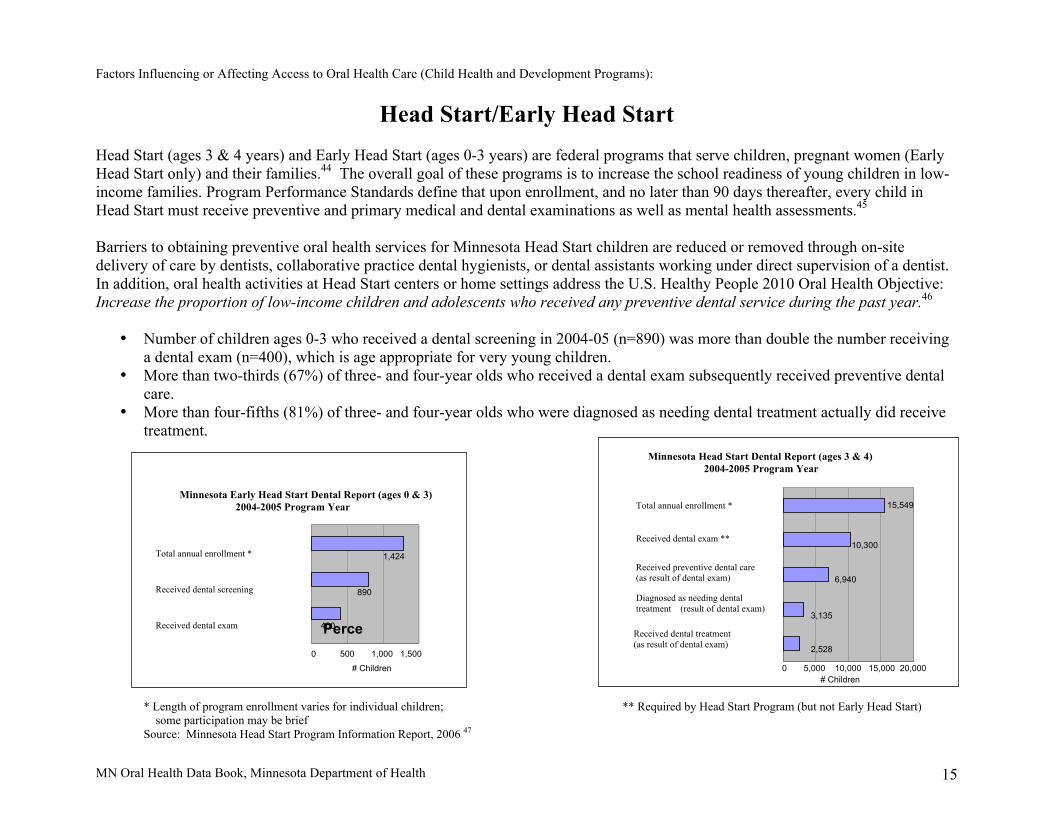
Head Start/Early Head Start Head Start (ages 3 & 4 years) and Early Head Start (ages 0-3 years) are federal programs that serve children, pregnant women (Early Head Start only) and their families.44 The overall goal of these programs is to increase the school readiness of young children in low-income families. Program Performance Standards define that upon enrollment, and no later than 90 days thereafter, every child in Head Start must receive preventive and primary medical and dental examinations as well as mental health assessments.45 Barriers to obtaining preventive oral health services for Minnesota Head Start children are reduced or removed through on-site delivery of care by dentists, collaborative practice dental hygienists, or dental assistants working under direct supervision of a dentist. In addition, oral health activities at Head Start centers or home settings address the U.S. Healthy People 2010 Oral Health Objective: Increase the proportion of low-income children and adolescents who received any preventive dental service during the past year.46
• Number of children ages 0-3 who received a dental screening in 2004-05 (n=890) was more than double the number receiving a dental exam (n=400), which is age appropriate for very young children.
• More than two-thirds (67%) of three- and four-year olds who received a dental exam subsequently received preventive dental care.
• More than four-fifths (81%) of three- and four-year olds who were diagnosed as needing dental treatment actually did receive treatment.
* Length of program enrollment varies for individual children; ** Required by Head Start Program (but not Early Head Start) some participation may be brief
Source: Minnesota Head Start Program Information Report, 2006 47

MN Oral Health Data Book, Minnesota Department of Health 16
Factors Influencing or Affecting Access to Oral Health Care (Child Health and Development Programs):
Oral Health Care for Children and Youth with Special Health Care Needs Children and Youth With Special Health Care Needs (CYSHCN) are defined by the federal Maternal and Child Health Bureau as "those children (from birth to age 21) who have, or are at increased risk for a chronic physical, developmental, behavioral, or emotional condition and who also require health and related services of a type or amount beyond that required by children generally." 48
Oral health care is the most prevalent unmet health need among U.S. children and youth with special health care needs.49 Children with
disabilities are at increased risk for oral infections, delayed tooth eruption, periodontal diseases, enamel irregularities and moderate-to-severe malocclusion. Certain medications and therapies, special diets and difficulty in maintaining adequate daily oral health care are contributing factors to adverse oral health.50
• There are an estimated 160,946 CYSHCN in Minnesota.51 • Approximately 36,000 CYSHCN in Minnesota did not receive preventive dental care or complete restorative dental care in 2001.52 • Lack of dental insurance coverage is one reason that over 50% of respondents to the National Survey of Children with Special Health Care
Needs indicated cost as the most important reason that CYSHCN did not receive all needed dental care.53
Reasons Minnesota CYSHCN Did Not Receive All Needed Dental Care
in Ranked Order (n = 10, 525 children not receiving needed care)
# Respondents % Respondents Cost 5394 51.53 Health Plan Problem 3088 29.50 Difficulty Getting an Appointment 1224 11.69 Other Reason 1131 10.80 No Insurance 845 8.08 Not Available in Area 701 6.69 Couldn’t Find Someone 638 6.10 Not Convenient Times 558 5.33 Doctor Did Not Know How to Treat 360 3.44 Child Refused to Go 145 1.38
Source: Minnesota Department of Health Fact Sheet, Children with Special Health Needs-Oral Health, 2004 54

MN Oral Health Data Book, Minnesota Department of Health 17
Factors Influencing or Affecting Access to Oral Health Care (Dental Health Care Centers):
Minnesota Federally Qualified Health Centers Minnesota’s Federally Qualified Health Centers (FQHCs) serve medically underserved urban, rural, tribal, homeless and migrant farm-worker populations. They provide directly or by referral, primary and preventive over all health care, as well as, mental health services, dental services, transportation and translation services.55 56 The majority of patients served by FQHC clinics are low-income and uninsured.
The Minnesota Association of Community Health Centers is a non-profit association of FQHCs and other providers that offer comprehensive preventive and primary health care services to all individuals regardless of their ability to pay. Minnesota FQHC clinics address the U.S. Healthy People 2010 Oral Health Objective: Increase the proportion of local health departments and community-based health centers, including community, migrant, and homeless health centers that have an oral health component.57
Minnesota Association of Community Health Centers statistics:58
• Minnesota FQHC clinics provide dental services on-site (10 clinics) or through referrals to outside clinics (6 clinics). • From 2000 to 2004, the number of dental patients seen at Minnesota FQHCs has increased roughly 70 percent. • In 2005, 28,000 people received dental care through Minnesota FQHCs. • 34% of Minnesota FQHC patients are less than 19 years of age.
Federally Qualified Health Centers in Minnesota, 2006
FQHC Clinics (16) ● on-site dental clinic (9) ● dental services referred (7)
Source: Minnesota Association of
Community Health Centers, 2006 59

MN Oral Health Data Book, Minnesota Department of Health 18
Factors Influencing or Affecting Access to Oral Health Care (Medical/Dental Insurance):
Medical and Dental Insurance
• Minnesota has consistently had one of the lowest rates of persons without medical and dental insurance in the country. • In 2004, an estimated 68,000 Minnesota children lacked medical insurance.60 • For every child without medical insurance, there are 2.6 children without dental insurance.61 • Minnesota in 2002, 21% of all children over age three were without dental coverage; dental coverage was much lower in
greater Minnesota than the Twin Cities area.62 • Minnesota children with no medical insurance coverage receive substantially less medical and dental preventive care than do
children covered by medical insurance.63 • Lowest rates of uninsured (4.4%) are in the 7-county metro area as well as the east central region of Minnesota. • Highest uninsured rates are in northern Minnesota (northeast 9.7%; northwest 8.1%).
Source: National Survey of Children’s Health, 2003 64 Source: Children’s Defense Fund, The Road Not Traveled: Universal Children’s Health Care Coverage in Minnesota, April 2006 65
Minnesota

MN Oral Health Data Book, Minnesota Department of Health 19
Factors Influencing or Affecting Access to Oral Health Care (School Oral Health Services and Activities):
School Oral Health Services and Activities
Schools can be ideal locations to provide primary oral health services to targeted populations. School-based services essentially eliminate the issues of reliable transportation as well as concern for a parent’s loss of work time to keep a dental appointment. Medicaid may reimburse for covered dental services when provided to Medicaid enrolled children and adolescents seen in school-based health clinics. However, commitment of school funding, staff, space and valuable class time must be dedicated to provide school-based oral health care programs. In addition, there can be substantial financial costs when dental professionals choose to set up a non-traditional dental practice School-based dental services address Healthy People 2010 Oral Health Objectives:66 71
Increase the proportion of children and adults who use the oral health care system each year. Increase the proportion of school-based health centers with an oral health component. On-site dental clinics/services are offered at a limited number of elementary and middle schools in Minneapolis and St. Paul as well as in Greater Minnesota. As of May 2006, the list includes but may not be limited to:
Minnesota School-based Direct Services Name of Providers (Listed in Alphabetical Order)
Portable (P); Stationary/ On-site Dental Equipment (S); or Mobile Vehicle (M)
Number Elementary or Middle School Sites
Children’s Dental Services (Minneapolis/St. Paul) P and S Elem = 9 Middle = 1 Lakes Area Mobile Smiles * (Deer River) M Elem = 6 Middle = 1 Normandale Community College - (Bloomington) Dental Hygiene Program Faculty and Students
P Elem = 5
Red Lake Indian Health Service * (Red Lake) P Elem = 4 Middle = 2 * Program administered by a Minnesota licensed collaborative practice dental hygienist Source: Personal communication, 2006 67
Minnesota School-based/School-linked Activities and Findings
In January 2006, an email questionnaire was sent state-wide to Minnesota school nurses (n = 342) regarding oral health in their schools. Responses (n = 110) offer actual versus anecdotal insight into activities carried out and issues identified by school nurses.68
• Ten nurses reported increasing difficulty in locating dentists who would accept referrals of students experiencing dental pain. • Six nurses reported that oral health screening is routinely provided on-site. • One nurse reported that the district utilized a dental hygienist at Early Childhood Screening “when available” • Ninety nurses reported offering some form of oral health education; the majority of the education was presented by the school
nurse or classroom teachers and most often during February Children’s Dental Health Month. • Ten nurses reported offering a district-wide, school-based fluoride mouth-rinse program. • Eleven nurses reported offering dental cards but stated that return rate is low with little, if any, time available to tally gathered
information.
MN Oral Health Data Book, Minnesota Department of Health 20
Factors Influencing or Affecting Access to Oral Health Care (Socioeconomic Factors):
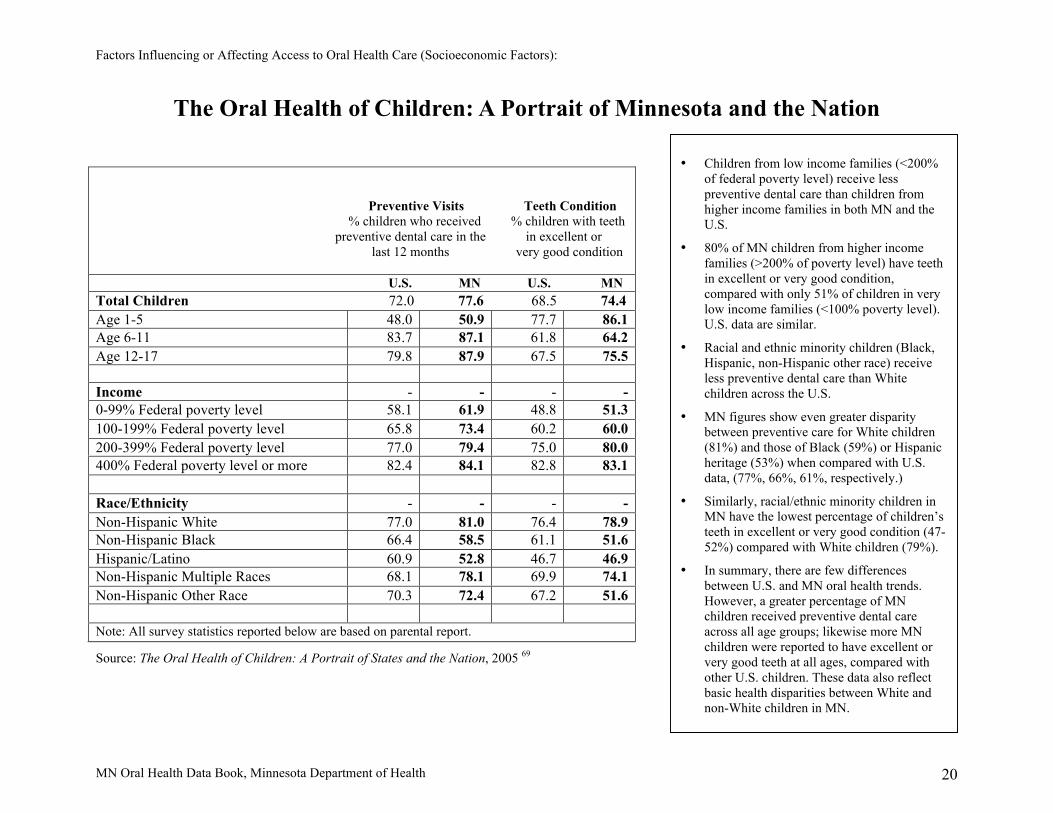
The Oral Health of Children: A Portrait of Minnesota and the Nation
Preventive Visits Teeth Condition % children who received % children with teeth preventive dental care in the in excellent or last 12 months very good condition U.S. MN U.S. MN Total Children 72.0 77.6 68.5 74.4 Age 1-5 48.0 50.9 77.7 86.1 Age 6-11 83.7 87.1 61.8 64.2 Age 12-17 79.8 87.9 67.5 75.5 Income - - - - 0-99% Federal poverty level 58.1 61.9 48.8 51.3 100-199% Federal poverty level 65.8 73.4 60.2 60.0 200-399% Federal poverty level 77.0 79.4 75.0 80.0 400% Federal poverty level or more 82.4 84.1 82.8 83.1 Race/Ethnicity - - - - Non-Hispanic White 77.0 81.0 76.4 78.9 Non-Hispanic Black 66.4 58.5 61.1 51.6 Hispanic/Latino 60.9 52.8 46.7 46.9 Non-Hispanic Multiple Races 68.1 78.1 69.9 74.1 Non-Hispanic Other Race 70.3 72.4 67.2 51.6 Note: All survey statistics reported below are based on parental report.
Source: The Oral Health of Children: A Portrait of States and the Nation, 2005 69
• Children from low income families (<200% of federal poverty level) receive less preventive dental care than children from higher income families in both MN and the U.S.
• 80% of MN children from higher income families (>200% of poverty level) have teeth in excellent or very good condition, compared with only 51% of children in very low income families (<100% poverty level). U.S. data are similar.
• Racial and ethnic minority children (Black, Hispanic, non-Hispanic other race) receive less preventive dental care than White children across the U.S.
• MN figures show even greater disparity between preventive care for White children (81%) and those of Black (59%) or Hispanic heritage (53%) when compared with U.S. data, (77%, 66%, 61%, respectively.)
• Similarly, racial/ethnic minority children in MN have the lowest percentage of children’s teeth in excellent or very good condition (47-52%) compared with White children (79%).
• In summary, there are few differences between U.S. and MN oral health trends. However, a greater percentage of MN children received preventive dental care across all age groups; likewise more MN children were reported to have excellent or very good teeth at all ages, compared with other U.S. children. These data also reflect basic health disparities between White and non-White children in MN.

MN Oral Health Data Book, Minnesota Department of Health 21
Factors Influencing or Affecting Access to Oral Health Care (Socioeconomic Factors):
Low Income/Poverty Low income is a known risk factor for several oral diseases, including dental caries.70 Individuals in low socio-economic groups may be at greater risk of oral diseases due to improper feeding practices, poor nutrition, lack of parental education and dental knowledge, inadequate oral hygiene, and difficulty accessing professional oral health care.71
• Income levels for both U.S. and MN children follow a similar pattern, with the largest percentage of households (MN, 39%;
US, 33%) falling between 200-399% of the federal poverty level (FPL), commonly termed “middle class.” • More MN children live in households with incomes greater than 400% FPL than other U.S. children, 32.5% and
26.7%, respectively. • Fewer MN children (28.5%) live in low-income families (<200% FPL) than other U.S. children (40.6%). • Fewer MN children (9.0%) live in very low-income households (<100% FPL) than other U.S. children (17.8%).
In addition, fewer MN children (5.3%) live in households classified as “working poor” than other U.S. children (12.4%)
(Working poor is a subset of very low-income households in which one or both parents are employed full time but are still below 100% FPL.) 72
Source: National Survey of Children’s Health, 2005 73
Percent of children (0-17) living in households with incomes above/below Federal Poverty Level (FPL),
2003
17.8
32.5
39.0
9.0
19.5
26.7
32.6
22.8
0 5
10
15
20
25
30
35
40
45
Household income 0-99% FPL
n=106 (MN); n= 1,307 (US)
Household income 100-199% FPL
n=247 (MN); n=18,850 (US)
Household income 200-299% FPL n= 668 (MN); n=33,540 (US)
Household income 400% > FPL
n= 686 (MN); n= 29,242 (US)
Minnesota US
% c
hild
ren

MN Oral Health Data Book, Minnesota Department of Health 22
Factors Influencing or Affecting Access to Oral Health Care (Socioeconomic Factors):
Minnesota Free and Reduced Price Meals
Minnesota Free and Reduced Price (F/RP) Meals is a component of the National School Lunch Program. Every school day, nearly 100,000 public and private schools and residential child-care facilities participate in this federally-assisted meal program serving more than 28 million children throughout the United States.74 Access to affordable, nutritionally balanced meals is an important key to learning and good health. Eligibility for the free or reduced-price lunch program is based on family size and income. “Low income … populations continue to have high levels of dental disease” 75 and, therefore, a school district’s free and reduced lunch rate is frequently used as a target measurement when planning an oral health program.
• Income eligibility guidelines for free lunch are 130% Federal Poverty Level (FPL) or $25,000 annual income for a family of four.76
• Income eligibility guidelines for reduced lunch are 180% FPL or $36,000 annual income for a family of four.77 • The number of Minnesota students receiving Free and Reduced Price Meals rose by more than 6,000 students between the
2004 to 2005 (245,637) and 2005 to 2006 (251,832) school years.78
Source: Minnesota Department of Education, 2006 79
MINNESOTA
Free and
Reduced Price Meals
School Year Student Count
Student Percentage
Eligible
2004-2005 245,637 29.69
Eligible
2005-2006 251,832 30.43
Not Eligible
2004-2005 581,693 70.31
Not Eligible
2005-2006 575,778 69.57
MN Oral Health Data Book, Minnesota Department of Health 23
Factors Influencing or Affecting Access to Oral Health Care (Workforce):
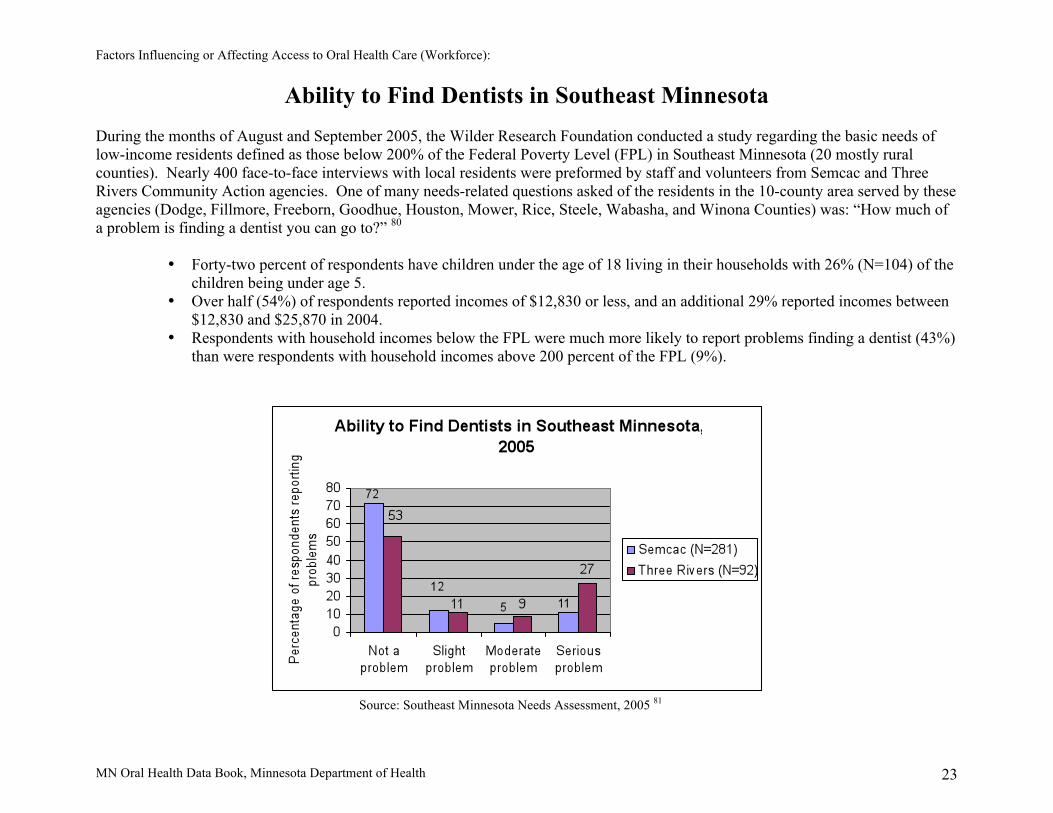
Ability to Find Dentists in Southeast Minnesota
During the months of August and September 2005, the Wilder Research Foundation conducted a study regarding the basic needs of low-income residents defined as those below 200% of the Federal Poverty Level (FPL) in Southeast Minnesota (20 mostly rural counties). Nearly 400 face-to-face interviews with local residents were preformed by staff and volunteers from Semcac and Three Rivers Community Action agencies. One of many needs-related questions asked of the residents in the 10-county area served by these agencies (Dodge, Fillmore, Freeborn, Goodhue, Houston, Mower, Rice, Steele, Wabasha, and Winona Counties) was: “How much of a problem is finding a dentist you can go to?” 80
• Forty-two percent of respondents have children under the age of 18 living in their households with 26% (N=104) of the
children being under age 5. • Over half (54%) of respondents reported incomes of $12,830 or less, and an additional 29% reported incomes between
$12,830 and $25,870 in 2004. • Respondents with household incomes below the FPL were much more likely to report problems finding a dentist (43%)
than were respondents with household incomes above 200 percent of the FPL (9%).
Source: Southeast Minnesota Needs Assessment, 2005 81

MN Oral Health Data Book, Minnesota Department of Health 24
Factors Influencing or Affecting Access to Oral Health Care (Workforce):
Health Professional/Dental Professional Shortage Designation
Health Professional Shortage Areas (HPSAs) are regions designated by the federal government which have shortages of primary medical, dental or mental health providers. HPSAs may be geographic (full, partial, multi-county or service regions), demographic (low-income population clusters; Indian Tribal Reservations) or institutional (rural or community health centers; correctional facilities).82
Criteria for Dental Shortage Designation:
1) Area is a rational area for delivery of dental services. 2) One of these conditions prevails in the area: (a) area has population to full-time-equivalent (FTE) dentist ratio of at least
5000:1, or (b) population to FTE dentist ratio of less than 5000:1 but greater than 4000:1 and has unusually high needs for dental services or insufficient capacity of existing dental providers.
3) Dental professionals in contiguous areas are over-utilized, excessively distant, or inaccessible to the population.83
• HPSA designation serves as a pre-requisite for areas/facilities to qualify for important and useful government programs, e.g., Minnesota Professional Loan Repayment Program and the National Health Service Corps.84
• In 2006, there are a total of 71 Dental Health Professional Shortage Area designations in Minnesota. • Of these designations, 45 are geographic areas (38 rural; 7 urban) and 21 are facilities (10 rural; 11 urban).85 • The majority of dental designated HPSAs are located in western Minnesota and the Twin Cities metro area.
Rural designation map, 2006 Urban designation map, 2004
Source: Minnesota Department of Health, Office of Rural Health and Primary Care 86
MN Oral Health Data Book, Minnesota Department of Health 25
Factors Influencing or Affecting Access to Oral Health Care (Workforce):
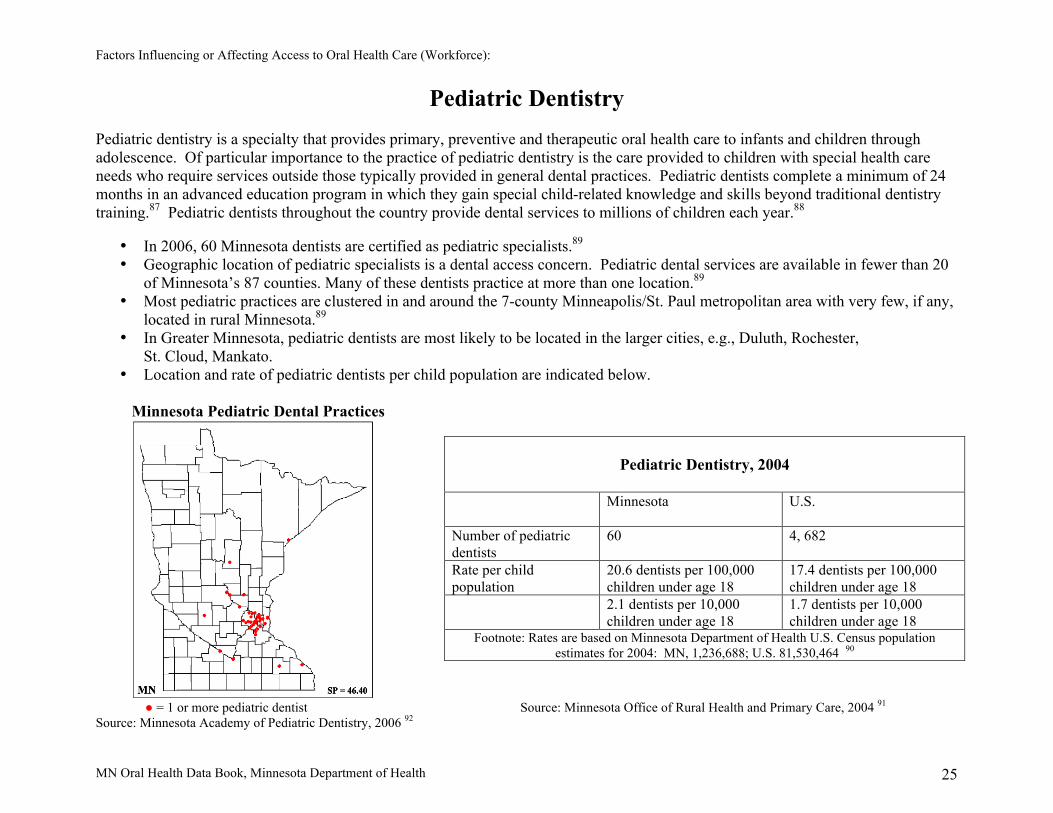
Pediatric Dentistry
Pediatric dentistry is a specialty that provides primary, preventive and therapeutic oral health care to infants and children through adolescence. Of particular importance to the practice of pediatric dentistry is the care provided to children with special health care needs who require services outside those typically provided in general dental practices. Pediatric dentists complete a minimum of 24 months in an advanced education program in which they gain special child-related knowledge and skills beyond traditional dentistry training.87 Pediatric dentists throughout the country provide dental services to millions of children each year.88
• In 2006, 60 Minnesota dentists are certified as pediatric specialists.89 • Geographic location of pediatric specialists is a dental access concern. Pediatric dental services are available in fewer than 20
of Minnesota’s 87 counties. Many of these dentists practice at more than one location.89 • Most pediatric practices are clustered in and around the 7-county Minneapolis/St. Paul metropolitan area with very few, if any,
located in rural Minnesota.89 • In Greater Minnesota, pediatric dentists are most likely to be located in the larger cities, e.g., Duluth, Rochester, St. Cloud, Mankato. • Location and rate of pediatric dentists per child population are indicated below.
Minnesota Pediatric Dental Practices
● = 1 or more pediatric dentist Source: Minnesota Office of Rural Health and Primary Care, 2004 91
Source: Minnesota Academy of Pediatric Dentistry, 2006 92
Pediatric Dentistry, 2004
Minnesota U.S.
Number of pediatric dentists
60 4, 682
Rate per child population
20.6 dentists per 100,000 children under age 18
17.4 dentists per 100,000 children under age 18
2.1 dentists per 10,000 children under age 18
1.7 dentists per 10,000 children under age 18
Footnote: Rates are based on Minnesota Department of Health U.S. Census population estimates for 2004: MN, 1,236,688; U.S. 81,530,464 90

MN Oral Health Data Book, Minnesota Department of Health 26
Summary
The Minnesota Oral Health Data Book Children and Youth provides information about oral health factors, such as beverage consumption, diabetes, tobacco use, poverty and other issues that influence or affect the oral health of Minnesota’s children and youth. Risk factors for negative oral health conditions also include conditions that for various reasons (perhaps lack of data) are not addressed in this report; for example, the use/non-use of helmets to protect the mouth and jaw when bicycle/motorcycle riding and mouth guards use/non-use to protect the teeth in contact sports activities. It is readily acknowledged that oral diseases/conditions and their corresponding treatment needs are multi-factorial. This report identifies many oral health care efforts currently in place in Minnesota which address these needs and their effect on the oral health of children and youth. For example, the Minnesota Student Survey, through its extensive data sets, offers oral health professionals supporting data to promote a reduction or elimination of tobacco use by children and youth. In comparison to other states, Minnesota continues to have a high rate of insured children and youth. Despite Minnesota’s high health insurance rates, however, health disparities continue to exist for persons living in low-income households and struggling with poverty. These individuals continue to experience greater than average levels of oral diseases across all age levels. The Minnesota Oral Health Data Book Children and Youth is a work in progress - dynamic with openness for updates and expansion.

MN Oral Health Data Book, Minnesota Department of Health 27
References
1. Minnesota Department of Health, Healthy Minnesotans: Public Health Improvement Goals 2004, page 61. http://www.health.state.mn.us/strategies/chronic.pdf
2. Centers for Disease Control and Prevention, CDC Fact Sheet, Preventing Dental Caries with Community Programs, August 2005. http://www.cdc.gov/Oralhealth/factsheets/dental_caries.htm
3. The National Survey of Children’s Health 2005, U.S. Department of Health and Human Services, Health Resources and Services Administration, Maternal and Child Health Bureau, Rockville, MD. http://www.mchb.hrsa.gov/oralhealth/pdf/state/minnesota.pdf
4. Graham D.B., Webb M.N., Seale N.S., Pediatric Emergency Room Visits For Non-traumatic Dental Disease. American Academy of Pediatric Dentistry. http://www.aapd.org/searcharticles/article.asp?ARTICLE_ID=336
5. National Institutes of Health, National Institute of Child Health and Human Development, Milk Matters For Your Child’s Healthy Mouth. http://www.nichd.nih.gov/milk/book0188/index.htm
6. American Dental Association. The Facts About Bottled Water. http://www.ada.org/prof/resources/pubs/jada/patient/patient_30.pdf
7. American Dental Association. The facts about bottled water. http://www.ada.org/prof/resources/pubs/jada/patient/patient_30.pdf
8. American Dental Association. Sip All Day Get Decay. http://www.mndental.org/dental_health/sip_decay/ 9. Minnesota Department of Human Services. Minnesota Student Survey 2004. Statewide Tables. Nutrition Table 18.
http://www.dhs.state.mn.us/main/groups/healthcare/documents/pub/dhs_id_049112.pdf 10. Centers for Disease Control and Prevention, Water Fluoridation. Surgeon General’s statement on community water
fluoridation 2005. http://www.cdc.gov/fluoridation/fact_sheets/sg04.htm 11. Centers for Disease Control and Prevention, CDC fluoridation statistics 2002: Status of Water Fluoridation by State.
http://www.cdc.gov/oralhealth/waterfluoridation/fact_sheets/states_stats2002.htm 12. Healthy People 2010 Oral Health Objectives. http://www.healthypeople.gov/Document/HTML/Volume2/21Oral.htm 13. American Dental Association, Fluoride and Fluoridation. http://www.ada.org/public/topics/fluoride/index.asp 14. Centers for Disease Control and Prevention, CDC fluoridation statistics 2002: Status of Water Fluoridation by State.
http://www.cdc.gov/oralhealth/waterfluoridation/fact_sheets/states_stats2002.htm 15. Centers for Disease Control and Prevention, CDC fluoridation statistics 2002: Status of Water Fluoridation by State.
http://www.cdc.gov/oralhealth/waterfluoridation/fact_sheets/states_stats2002.htm 16. Centers for Disease Control and Prevention, Oral Health Resources. Frequently Asked Questions. Dental Sealants.
http://www.cdc.gov/oralhealth/factsheets/sealants-faq.htm 17. Centers for Disease Control and Prevention, Oral Health Resources. Key findings from NHANES 1999-2002. Surveillance for
Dental Caries, Dental Sealants, Tooth Retention, Edentulism and Enamel Fluorosis - United States, 1988-1994 and 1999-2002. http://www.cdc.gov/oralhealth/factsheets/nhanes_findings.htm
18. Healthy People 2010 Oral Health Objectives. http://www.healthypeople.gov/Document/HTML/Volume2/21Oral.htm

MN Oral Health Data Book, Minnesota Department of Health 28
19. Minnesota Department of Human Services. Data report. 20. American Academy of Periodontology. Diabetes: the Mouth Body Connection.
http://www.perio.org/consumer/mbc.diabetes.htm 21. Lalla, E., Cheng. B., Lal, S., Tucker, S., Greenberg, E., Goland, R., Lamster, I.B. 2006. Periodontal Changes in Children and
Adolescents With Diabetes. Diabetes Care 29:295-299. http://care.diabetesjournals.org/cgi/content/full/29/2/295 22. Lalla, E., Cheng. B., Lal, S., Tucker, S., Greenberg, E., Goland, R., Lamster, I.B. 2006. Periodontal Changes in Children and
Adolescents With Diabetes. Diabetes Care 29:295-299. http://care.diabetesjournals.org/cgi/content/full/29/2/295 23. Lalla, E., Cheng. B., Lal, S., Tucker, S., Greenberg, E., Goland, R., Lamster, I.B. 2006. Periodontal Changes in Children and
Adolescents With Diabetes. Diabetes Care 29:295-299. http://care.diabetesjournals.org/cgi/content/full/29/2/295 24. MMWR Weekly, November 25, 2005, 54(46); 1181-1183, Dental Visits Among Dentate Adults With Diabetes—United
States, 1999 and 2004. http://www.cdc.gov/mmwr/preview/mmwrhtml/mm5446a3.htm 25. MMWR Weekly, November 25, 2005, 54(46); 1181-1183, Dental Visits Among Dentate Adults With Diabetes—United
States, 1999 and 2004. http://www.cdc.gov/mmwr/preview/mmwrhtml/mm5446a3.htm 26. Healthy People 2010 Oral Health Objectives. http://www.healthypeople.gov/Document/HTML/Volume2/21Oral.htm 27. Lalla, E., Cheng. B., Lal, S., Tucker, S., Greenberg, E., Goland, R., Lamster, I.B. 2006. Periodontal Changes in Children and
Adolescents With Diabetes. Diabetes Care 29:295-299. http://care.diabetesjournals.org/cgi/content/full/29/2/295. 28. Case Western Reserve University. April 5, 2006. First Link of Oral Bacteria and Preterm Birth Found in Human. Science
Daily. http://www.sciencedaily.com/releases/2006/04/060405175108.htm 29. American Dental Association. Periodontal Disease as a Risk Factor For Adverse Pregnancy Outcomes: Summary of a
Systematic Review. 2003. http://www.ada.org/prof/resources/topics/topics_evidencebased_periodontaldisease.pdf 30. American Academy of Periodontology. Periodontitis May Increase C-reactive Protein Levels in Pregnancy. May 2006.
http://www.perio.org/consumer/crp-levels.htm 31. Healthy People 2010 Maternal, Infant and Child Health Objectives.
http://www.healthypeople.gov/document/HTML/Volume2/16MICH.htm 32. Centers for Disease Control and Prevention. 2001. Oral Health Resources Fact Sheet. Oral Health for Adults.
http://www.cdc.gov/oralhealth/factsheets/adult.htm 33. American Academy of Periodontology. Tobacco Use and Periodontal Disease. 2004.
http://www.perio.org/consumer/smoking.htm 34. Minnesota Department of Health, Center for Health Statistics. Changes in Tobacco Use by Minnesota Youth, 2000-2005.
Results from the Minnesota Youth Tobacco Survey. http://www.health.state.mn.us/divs/hpcd/tpc/pdf/05youthreport.pdf 35. Minnesota Department of Health, Center for Health Statistics. Changes in Tobacco Use by Minnesota Youth, 2000-2005.
Results from the Minnesota Youth Tobacco Survey. http://www.health.state.mn.us/divs/hpcd/tpc/pdf/05youthreport.pdf 36. Centers for Disease Control and Prevention. 2001. Oral Health Resources Fact Sheet. Oral Health for Adults.
http://www.cdc.gov/oralhealth/factsheets/adult.htm 37. National Institutes of Health. November 1999. Chewing Tobacco Use Linked to Dental Caries.
http://www.nih.gov/news/pr/nov99/nidcr-08.htm 38. Minnesota Department of Human Services. Minnesota Student Survey 2004. Statewide Tables. Tables 28 and 29.
http://www.dhs.state.mn.us/main/groups/healthcare/documents/pub/dhs_id_049112.pdf

MN Oral Health Data Book, Minnesota Department of Health 29
39. Kaiser Medicaid Facts EPSDT. October 2005. http://www.kff.org/medicaid/upload/Early-and-Periodic-Screening-Diagnostic-and-Treatment-Services-Fact-Sheet.pdf
40. Kaiser Medicaid Facts EPSDT. October 2005. http://www.kff.org/medicaid/upload/Early-and-Periodic-Screening-Diagnostic-and-Treatment-Services-Fact-Sheet.pdf
41. Minnesota Department of Human Services. Health Care. Child and Teen Checkups Program. http://www.dhs.state.mn.us/main/groups/healthcare/documents/pub/DHS_id_006270.hcsp
42. Minnesota Department of Human Services Medicaid Management Information Systems (MMIS). Minnesota CMS-416 Child and Teen Checkup Participation Report - Federal Fiscal Year 2005, 10-01-04 through 09-30-05. http://www.dhs.state.mn.us/main/groups/county_access/documents/pub/dhs_id_057234.pdf
43. Minnesota Department of Health. Health Systems Capacity Measure #07B, 2006 44. Administration for Children and Families. Office of Head Start. http://www.acf.hhs.gov/programs/hsb/about/index.htm 45. Head Start Program Performance Standards and Other Regulations. Child Health and Development Services. Part 1304.20.
http://a257.g.akamaitech.net/7/257/2422/09nov20051500/edocket.access.gpo.gov/cfr_2005/octqtr/pdf/45cfr1304.20.pdf 46. Healthy People 2010 Oral Health Objectives. http://www.healthypeople.gov/Document/HTML/Volume2/21Oral.htm 47. Minnesota Head Start Association. Program Information Report, 2006. Personal communication. 48. Maternal and Child Health Bureau. Division of Services for Children with Special Health Care Needs.
ftp://ftp.hrsa.gov/mchb/factsheets/dschsn.pdf 49. Newacheck, P.W., McManus, M., Fox, H.B., Hung, Y.Y., Halfon, N. 2000. Access to Health Care For Children With Special
Health Care Needs. Pediatrics 105 (4 Pt. 1): 760-766. 50. National Health Interview Survey of Children with Special Health Care Needs. National Institutes of Health 2001, as reported
in Minnesota Department of Health Fact Sheet, Children with Special Health Care Needs, Oral Health, Summer 2004. http://www.health.state.mn.us/cfh/na/factsheets/oralhealth.pdf
51. Minnesota Department of Health. Minnesota Title V Needs Assessment Fact Sheets. Children With Special Health Needs. Population Overview. 2004. http://www.health.state.mn.us/cfh/na/factsheets/mcshn/popoverview.html
52. National Institutes of Health. National Health Interview Survey of Children with Special Health Needs, as reported in Minnesota Department of Health Fact Sheet, Children With Special Health Care Needs, Summer 2004. http://www.health.state.mn.us/cfh/na/factsheets/oralhealth.pdf
53. National Institutes of Health. National Health Interview Survey of Children With Special Health Needs, as reported in Minnesota Department of Health Fact Sheet, Children with Special Health Care Needs, Summer 2004. http://www.health.state.mn.us/cfh/na/factsheets/oralhealth.pdf
54. National Institutes of Health. National Health Interview Survey of Children With Special Health Needs, as reported in Minnesota Department of Health Fact Sheet, Children With Special Health Care Needs, Summer 2004. http://www.health.state.mn.us/cfh/na/factsheets/oralhealth.pdf
55. Minnesota Department of Health. Federally Qualified Health Centers. http://www.health.state.mn.us/divs/chs/fqhcsection330.htm#housing
56. Minnesota Association of Community Health Centers. http://www.mnpca.nonprofitoffice.com 57. Healthy People 2010 Oral Health Objectives. http://www.healthypeople.gov/Document/HTML/Volume2/21Oral.htm 58. Minnesota Association of Community Health Centers. http://www.mnpca.nonprofitoffice.com 59. Minnesota Association of Community Health Centers. http://www.mnpca.nonprofitoffice.com

MN Oral Health Data Book, Minnesota Department of Health 30
60. Children’s Defense Fund, The Road Not Traveled: Universal Children’s Health Care Coverage in Minnesota, April 2006. http://www.cdf-mn.org/PDF/Road_Not_Traveled_06.pdf
61. Centers for Disease Control and Prevention. Oral Health Resources Fact Sheet: Children’s Oral Health. May 2000. http://www.cdc.gov/OralHealth/factsheets/sgr2000-fs3.htm
62. Children’s Defense Fund, Minnesota Kids: Focus on Health, 2005 Data Book. http://www.cdf-mn.org/PDF/KidsCountData_05/Databook_2005.pdf
63. Data reported on National Survey of Children’s Health. 64. U.S. Department of Health and Human Services, Health Resources and Services Administration, Maternal and Child Health
Bureau. The National Survey of Children’s Health 2005. http://mchb.hrsa.gov/oralhealth/pdf/state/minnesota.pdf 65. Children’s Defense Fund, The Road Not Traveled: Universal Children’s Health Care Coverage in Minnesota, April 2006.
http://www.cdf-mn.org/PDF/Road_Not_Traveled_06.pdf 66. Healthy People 2010 Oral Health Objectives. http://www.healthypeople.gov/Document/HTML/Volume2/21Oral.htm 67. Chart data. Personal communication. 2006 68. Nurses responses. Personal communication. 2006 69. U.S. Department of Health and Human Services, Health Resources and Services Administration, Maternal and Child Health
Bureau. The National Survey of Children’s Health 2005. http://mchb.hrsa.gov/oralhealth/states/minnesota.htm 70. United States General Accounting Office, Oral Health, Factors Contributing to Low Use of Dental Services by Low-Income
Populations, page 5, September 2000. http://www.gao.gov/archive/2000/he00149.pdf 71. National Institute of Dental and Cranio-facial Research. The Burden of Oral Diseases.
http://www.nidcr.nih.gov/AboutNIDCR/StrategicPlan/BurdenOralDiseases.htm 72. U.S. Department of Health and Human Services, Health Resources and Services Administration, Maternal and Child Health
Bureau. The National Survey of Children’s Health 2005. http://mchb.hrsa.gov/oralhealth/pdf/state/minnesota.pdf 73. U.S. Department of Health and Human Services, Health Resources and Services Administration, Maternal and Child Health
Bureau. The National Survey of Children’s Health 2005. http://mchb.hrsa.gov/oralhealth/pdf/state/minnesota.pdf 74. United States Department of Agriculture, Nutrition Program Facts, Food and Nutrition Service. 75. http://www.fns.usda.gov/cnd/lunch/AboutLunch/NSLPFactSheet.pdf 76. United States General Accounting Office, Oral Health, Dental Disease is a Chronic Problem Among Low-Income Populations,
April 2000. http://www.gao.gov/archive/2000/he00072.pdf 77. Minnesota Department of Education, Household Income Guidelines and Application for Educational Benefits. 2006.
http://education.state.mn.us/MDE/static/06-04-242006-07SNPIncomeGuidelinesAppEdBenefits.doc 78. Minnesota Department of Education, Household Income Guidelines and Application for Educational Benefits. 2006.
http://education.state.mn.us/MDE/static/06-04-242006-07SNPIncomeGuidelinesAppEdBenefits.doc 79. Minnesota Department of Education, 2005. Minnesota State Free and Reduced Price Meals, K-12.
http://www.education.state.mn.us/CLASS/marssGraphs.do?Key= 80. Minnesota Department of Education, 2005. Minnesota State Free and Reduced Price Meals, K-12.
http://www.education.state.mn.us/CLASS/marssGraphs.do?Key 81. Martin, N., Pittman, B., Owen, G., Wilder Research, December 2005. Southeast Minnesota Needs Assessment: A Profile of the
Characteristics and Service Needs of the Region’s Residents. St. Paul, Minnesota. http://www.wilder.org/download.0.html?report=1886

MN Oral Health Data Book, Minnesota Department of Health 31
82. Martin, N., Pittman, B., Owen, G., Wilder Research, December 2005. Southeast Minnesota Needs Assessment: A Profile of the Characteristics and Service Needs of the Region’s Residents. St. Paul, Minnesota. http://www.wilder.org/download.0.html?report=1886
83. Minnesota Department of Health, Office of Rural Health and Primary Care. 2006. Personal communication. 84. Minnesota Department of Health, Office of Rural Health and Primary Care. 2006. Personal communication. 85. Minnesota Department of Health, Office of Rural Health and Primary Care. 2006. Personal communication. 86. Minnesota Department of Health, Office of Rural Health and Primary Care. 2006. Personal communication. 87. Minnesota Department of Health, Office of Rural Health and Primary Care, Health Professional Shortage Areas - Dental
Designations, 2006. http://www.health.state.mn.us/divs/chs/denthpsarural.htm 88. American Academy of Pediatric Dentistry, Reference Manual 2005-2006, Introduction. http://www.aapd.org 89. Minnesota Department of Health, Office of Rural Health and Primary Care, Minnesota Dentists Facts and Data, 2005.
http://www.health.state.mn.us/divs/chs/dentwkfc05.htm 90. Minnesota Academy of Pediatric Dentistry, Map data source: personal communication, 2006. 91. Minnesota Department of Health, U.S. Population Estimates for 2004 and Minnesota Department of Health, Office of Rural
Health and Primary Care, Minnesota Dentists Facts and Data, 2005. http://www.health.state.mn.us/divs/chs/dentwkfc05.htm 92. Minnesota Department of Health, Office of Rural Health and Primary Care, Minnesota Dentists Facts and Data, 2005.
http://www.health.state.mn.us/divs/chs/dentwkfc05.htm

MN Oral Health Data Book, Minnesota Department of Health 32
Additional Resources/Websites
Publications: A National Call to Action to Promote Oral Health – May 2003 http://www.nidcr.nih.gov/AboutNIDCR/SurgeonGeneral/NationalCallToAction.htm Healthy Minnesotans: Public Health Improvement Goals 2004 http://www.health.state.mn.us/divs/chs/phg/goals.html Healthy People 2010 Oral Health Objectives http://www.healthypeople.gov/document/HTML/Volume2/21Oral.htm Oral Health in America: A Report of the Surgeon General – May 2000 http://www.surgeongeneral.gov/library/oralhealth/ Websites: American Academy of Pediatric Dentistry (AAPD) http://www.aapd.org/ American Association of Public Health Dentistry (AAPHD) http://www.aaphd.org/ American Dental Assistants’ Association (ADAA) http://www.dentalassistant.org/ American Dental Association (ADA) http://www.ada.org/ American Dental Education Association (ADEA) http://www.adea.org/ American Dental Hygienists’ Association (ADHA) http://www.adha.org/

MN Oral Health Data Book, Minnesota Department of Health 33
Association of State and Territorial Dental Directors (ASTDD) http://www.astdd.org/ Centers for Disease Control and Prevention (CDC) – Oral Health http://www.cdc.gov/OralHealth/index.htm Centers for Medicare and Medicaid (CMS) http://www.cms.hhs.gov/ Children’s Defense Fund Minnesota (CDF-MN) http://www.cdf-mn.org/ Children’s Dental Health Project (CDHP) http://www.cdhp.org/ Collaborative Practice Dental Hygiene – MN Statute 150A.10 Normandale Community College Website: www.normandale.edu/dental/ Health Resources and Services Administration (HRSA) – United States Department of Health and Human Services (DHHS) http://www.hrsa.gov/ Indian Health Service (IHS) http://www.ihs.gov/ Maternal and Child Health Bureau (MCHB) – Oral Health http://www.ask.hrsa.gov/OralHealth.cfm Minnesota Association of Community Health Centers (MNACHC) http://www.mnpca.nonprofitoffice.com/index.asp?Type=NONE&SEC={B86C3FF5-E020-4E3A-BF07-39641B838688} Minnesota Board of Dentistry (BOD) http://www.dentalboard.state.mn.us/ Minnesota Dental Association (MDA) http://www.mndental.org/ Minnesota Dental Hygienists’ Association (MDHA) http://www.mndha.com/
MN Oral Health Data Book, Minnesota Department of Health 34
Minnesota Department of Education (DOE) http://education.state.mn.us/mde/index.html Minnesota Department of Human Services (DHS) – Health Care http://www.dhs.state.mn.us/main/groups/healthcare/documents/pub/dhs_Health_Care.hcsp Minnesota Head Start Association (MHSA) http://www.mnheadstart.org/ National Head Start Oral Health Resource Center http://www.mchoralhealth.org/HeadStart/index.html National Institute of Dental and Craniofacial Research (NIDCR) http://www.nidcr.nih.gov/ National Institutes of Health (NIH) http://health.nih.gov/ National Maternal and Child Health Oral Health Resource Center http://www.mchoralhealth.org/default.html Oral Health America (OHA) http://www.oralhealthamerica.org/ Special Care Dentistry (SCD) http://www.scdonline.org/ United Way (Minnesota) http://national.unitedway.org/myuw/browseCities.cfm?abbr=MN&app=

If you require this document in another format, such as large print, Braille or cassette tape, call:
Community and Family Health Division P.O. Box 64882 St. Paul, MN 55164-0882 651-201-3760 PHONE 651-201-5797 TDD/TYY www.health.state.mn.us
10/06