minnesota manufactured homes characterization and
TRANSCRIPT

COMM-20140512-087861 | October 20, 2016
MINNESOTA MANUFACTURED HOMES CHARACTERIZATION AND PERFORMANCE
BASELINE SURVEY
Conservation Applied Research & Development (CARD) FINAL REPORT
Prepared for: Minnesota Department of Commerce, Division of Energy Resources
Prepared by: Seventhwave

Prepared by:
Scott Pigg Jeannette LeZaks Dan Cautley
Seventhwave 749 University Row, Suite 320 Madison, WI 53705 608-210-7100 www.ecw.org
© 2016 Seventhwave. All rights reserved.
Contract Number: 87861
Prepared for Minnesota Department of Commerce, Division of Energy Resources Mike Rothman, Commissioner, Department of Commerce Bill Grant, Deputy Commissioner, Department of Commerce, Division of Energy Resources Laura Silver, Project Manager Phone 651.539.1873 Email [email protected]
ACKNOWLEDGEMENTS This project was supported by a grant from the Minnesota Department of Commerce, Division of Energy Resources, through the Conservation Applied Research and Development (CARD) program, which is funded by Minnesota ratepayers.
The authors would also like to acknowledge Bruce Stahlberg (Affordable Energy Solutions) and the team at Leede Research for their valuable contributions to this study.
DISCLAIMER This report does not necessarily represent the view(s), opinion(s), or position(s) of the Minnesota Department of Commerce (Commerce), its employees or the State of Minnesota (State). When applicable, the State will evaluate the results of this research for inclusion in Conservation Improvement Program (CIP) portfolios and communicate its recommendations in separate document(s).
Commerce, the State, its employees, contractors, subcontractors, project participants, the organizations listed herein, or any person on behalf of any of the organizations mentioned herein make no warranty, express or implied, with respect to the use of any information, apparatus, method, or process disclosed in this document. Furthermore, the aforementioned parties assume no liability for the information in this report with respect to the use of, or damages resulting from the use of, any information, apparatus, method, or process disclosed in this document; nor does any party represent that the use of this information will not infringe upon privately owned rights.

i
Abstract This study characterizes energy-related aspects of manufactured homes (sometimes referred to as “mobile homes”) in Minnesota, based mainly on a large telephone survey of people living in this homes and site visits to 99 such homes. There are about 80,000 manufactured homes in the state, about half of which are located in manufactured-home parks and half on private property, mainly in rural areas. About half of households in manufactured homes are income-qualified for low-income weatherization services. Sixty percent of manufactured homes in the state are heated with natural gas, and 30 percent have propane heat. Very few are factory-configured for electric heat, but about 40 percent of households use portable space heaters. The average household faces annual energy costs of about $2,000. Through cost-effective retrofits, equipment upgrades and behavior modifications, there is theoretical potential for about 25 percent savings on annual energy costs in this housing stock.

ii
Table of Contents
Abstract......................................................................................................................................................... i
Executive Summary ................................................................................................................................... 1
Introduction ................................................................................................................................................ 3
What is a “manufactured home?” ....................................................................................................... 3
Study purpose......................................................................................................................................... 6
Study approach ...................................................................................................................................... 6
Report organization ............................................................................................................................... 9
Case Studies .............................................................................................................................................. 10
Household #1........................................................................................................................................ 10
Household #2........................................................................................................................................ 11
Household #3........................................................................................................................................ 12
Household #4........................................................................................................................................ 13
Overview of Manufactured Homes in Minnesota............................................................................... 14
Population ............................................................................................................................................. 14
Key characteristics of Minnesota manufactured homes ................................................................. 17
The Minnesota market for manufactured homes ............................................................................ 19
Household Demographics, Attitudes, Behaviors and Comfort ........................................................ 20
Demographics ....................................................................................................................................... 20
Attitudes ................................................................................................................................................ 21
Behaviors ............................................................................................................................................... 23
Comfort .................................................................................................................................................. 26
Energy Consumption and Costs ............................................................................................................ 27
Energy-saving opportunities .................................................................................................................. 30
Literature and interviews .................................................................................................................... 30
Identified energy-saving opportunities from site visits ................................................................. 31
Detailed Characteristics .......................................................................................................................... 37
Building envelope ................................................................................................................................ 37
Heating systems ................................................................................................................................... 53
Cooling systems ................................................................................................................................... 57
Duct leakage .......................................................................................................................................... 60
Water Heating ....................................................................................................................................... 63
Lighting ................................................................................................................................................. 66

iii
Appliances and electronics ................................................................................................................. 69
Plumbing heat tape .............................................................................................................................. 73
Repair, health and safety issues ......................................................................................................... 76
Conclusions and Recommendations ..................................................................................................... 84
References ................................................................................................................................................. 86
Appendix A – Sample design and weighting ...................................................................................... 88
Appendix B — Telephone survey instrument ..................................................................................... 93
Appendix C — On-site data collection instrument ........................................................................... 115
Appendix D — Interview guides ......................................................................................................... 127
Manufactured-Home Park Owner or Manager ............................................................................. 127
Manufactured-Home Dealer ............................................................................................................ 127
Manufactured-Home Manufacturer ................................................................................................ 128
Appendix E —Energy-Saving Measure Details ................................................................................. 129
Approach ............................................................................................................................................. 129
Detailed Measure Results.................................................................................................................. 139
Appendix F — Weather Normalization of Consumption Histories ............................................... 147

iv
List of Figures
Figure 1. A typical Minnesota manufactured home. ............................................................................ 3
Figure 2. HUD certification label. ............................................................................................................ 4
Figure 3. Modular homes like this one are not included in the study. ............................................... 4
Figure 4. A "mobile home" built in 1955—the oldest (and smallest) home in the study. ............... 5
Figure 5. A manufactured home with a heated addition. .................................................................... 5
Figure 6: Case-study Home #1. .............................................................................................................. 10
Figure 7: Case-study Home #2 ............................................................................................................... 11
Figure 8: Case-study Home #3 ............................................................................................................... 12
Figure 9: Case-study Home #4 ............................................................................................................... 13
Figure 10. Manufactured housing as a percent of all Minnesota housing units. ............................ 14
Figure 11. Manufactured home parks in Minnesota. .......................................................................... 15
Figure 12. Reported level of comfort for summer and winter seasons (telephone-survey data). 26
Figure 13. This manufactured home is in a park with a propane sub-metering arrangement (inset photo). ............................................................................................................................................. 28
Figure 14. Mean energy-cost savings per home, by measure and measure type. .......................... 32
Figure 15. Examples of the three types of roofs for manufactured homes. ..................................... 40
Figure 16. A manufactured home with a separate roof structure built over it. .............................. 41
Figure 17. Examples of additions. .......................................................................................................... 43
Figure 18. HUD thermal zone map. ...................................................................................................... 44
Figure 19. One of two homes in the study carrying a data plate indicating that it is meant to be located in a warmer climate zone. ......................................................................................................... 45
Figure 20. HUD-plate listed insulation levels, by year built. ............................................................. 45
Figure 21. Evidence of air sealing of electrical penetrations by local weatherization agency in a site-visit home. .......................................................................................................................................... 52
Figure 22. Significant air leakage at the marriage joint of the two halves of this double-wide manufactured home is evident in the cold (dark) areas in an infrared photo. ............................... 52
Figure 23. Example of duct leaks. .......................................................................................................... 61
Figure 24. Example of a water heater in an exterior closet................................................................. 63
Figure 25. Faucet left running in the winter to prevent frozen water lines. ................................... 74
Figure 26. Heat tape installed under pipe insulation. ........................................................................ 74

v
Figure 27. Total heat-tape and heat-rod power draw, by site............................................................ 75
Figure 28. Deteriorated ceiling area. These are often due to water damage. ................................. 76
Figure 29. This manufactured home has standing water on its flat roof, and a large section of fallen ceiling. ............................................................................................................................................. 77
Figure 30. Ceiling damage from roof leaks. ......................................................................................... 77
Figure 31. Example of deteriorated exterior. ........................................................................................ 78
Figure 32. Tight skirting is needed to keep animals out of the belly area, where they can otherwise do significant damage to insulation. ................................................................................... 79
Figure 33. Water damage around a bath fan, likely due to improper venting into the attic area. 81
Figure 34. A quiet, continuously-operating bath fan installed by local weatherization agency to meet ventilation requirements. .............................................................................................................. 81
Figure 35. Older furnaces, like this 1988 model, may pose a safety hazard if the heat exchanger is cracked. .................................................................................................................................................. 82
Figure 36. Disconnected water-heater venting. ................................................................................... 82
Figure 37. Fire damage from a wood-burning stove in a manufactured-home addition. ............. 83
Figure 38. Geographic strata for the study. .......................................................................................... 89
Figure 39. Observed versus MHEA-predicted space heating and cooling consumption. ........... 137

vi
List of Tables
Table 1. Key characteristics of manufactured homes. ......................................................................... 15
Table 2. Estimated number of manufactured homes by electric utility type and for selected utilities. ...................................................................................................................................................... 16
Table 3. Estimated number of manufactured homes with natural gas service, by utility. ............ 16
Table 4. Key characteristics of manufactured homes. ......................................................................... 17
Table 5. Year constructed. ....................................................................................................................... 18
Table 6. Household size, income and poverty level for Minnesota households, by housing type. .................................................................................................................................................................... 20
Table 7. Tenure and housing costs for Minnesota households, by housing type. .......................... 21
Table 8. Willingness to save energy (telephone-survey data). .......................................................... 22
Table 9. Willingness and ability to take energy saving steps. ........................................................... 23
Table 10. Self-reported energy saving actions taken. .......................................................................... 23
Table 11. Winter set-back practices........................................................................................................ 24
Table 12. Summer set-up practices (households with central air conditioning). ............................ 25
Table 13. Billing arrangements for utility payments. .......................................................................... 27
Table 14. Mean weather-normalized electricity and natural-gas consumption. ............................. 29
Table 15. Estimated annual energy costs of Minnesota manufactured homes, by heating fuel. .. 29
Table 16. Mean energy-cost savings from identified opportunities. ................................................ 33
Table 17. Top electric opportunities. ..................................................................................................... 34
Table 18. Top natural-gas savings opportunities................................................................................. 35
Table 19. Distribution of aggregate potential energy-cost savings by household willingness and ability to address opportunities. ............................................................................................................ 36
Table 20. Foundation enclosure type, not including additions. ........................................................ 37
Table 21. Belly condition and crawl space ground cover, Excludes additions and homes on basements. ................................................................................................................................................. 38
Table 22. Manufactured home wall framing, excluding additions. .................................................. 39
Table 23. Wall framing size by decade of manufacture. ..................................................................... 39
Table 24. Roof structure type, not including additions. ..................................................................... 41
Table 25. Roof condition. ......................................................................................................................... 42
Table 26. Heated addition types and floor area. .................................................................................. 42

vii
Table 27. Foundation types for heated additions. ............................................................................... 43
Table 28. Wall and floor framing in heated additions. ....................................................................... 43
Table 29. Mean insulation levels from HUD data-plate values, by building component. ............ 46
Table 30. Envelope insulation R-values for manufactured homes, not including additions. ....... 46
Table 31. Insulation levels in heated additions. ................................................................................... 48
Table 32. Door types and characteristics. Includes additions. ........................................................... 49
Table 33. Window type and area (including additions). .................................................................... 50
Table 34. Blower-door measured air leakage. ...................................................................................... 50
Table 35. Air leakage by home vintage. ................................................................................................ 51
Table 36. Primary heating fuel, heating system type, and thermostat type. ................................... 53
Table 37. Primary heating system characteristics. ............................................................................... 54
Table 38. Filters in forced-air systems. .................................................................................................. 55
Table 39. Supplemental heating sources used in home. ..................................................................... 56
Table 40. Cooling equipment types. ...................................................................................................... 58
Table 41. Characteristics of central air conditioners. .......................................................................... 58
Table 42. Characteristics of room air conditioners. ............................................................................. 59
Table 43. Duct leakage. ............................................................................................................................ 62
Table 44. Duct leakage by home vintage (site-visit data). .................................................................. 62
Table 45. Water heater characteristics. .................................................................................................. 63
Table 46. Hot water characteristics. ....................................................................................................... 65
Table 47. Water heater tank and pipe insulation. ................................................................................ 66
Table 48. Mean bulbs per home, by room type (including additions and garages). ...................... 67
Table 49. Percent of bulbs and estimated lighting electricity consumption, by bulb type. ........... 67
Table 50. Installed lighting wattage, bulbs and estimated energy use. Includes additions. ......... 68
Table 51. Characteristics of primary refrigerators. .............................................................................. 69
Table 52. Number and type of secondary refrigerators. ..................................................................... 70
Table 53. Number and type of freezers. ................................................................................................ 70
Table 54. Humidifier and dehumidifier presence and use................................................................. 71
Table 55. Televisions and peripherals. .................................................................................................. 72
Table 56: Computers and monitors ....................................................................................................... 73

viii
Table 57. Kitchen and bath exhaust-fan presence and use. ................................................................ 80
Table 58. Estimated population proportions used in sample planning. .......................................... 90
Table 59. Park-operator survey based adjustments to the Housing Justice Center list of Manufactured home parks. .................................................................................................................... 91
Table 60. Final estimates of occupied manufactured homes, by region and park/non-park status. ......................................................................................................................................................... 91
Table 61. Case weights for the telephone survey sample (n=633), by stratum. .............................. 92
Table 62. Case weights for on-site sample (n=99), by stratum. ......................................................... 92
Table 63. Measure applicability, savings and cost details. ............................................................... 130
Table 64. Estimated typical lighting hours of operation, by room type. ........................................ 135
Table 65. Detailed measure results. ..................................................................................................... 140

Minnesota Manufactured Homes Survey COMM- 087861 | October 20, 2016 Seventhwave 1 | P a g e
Executive Summary This study is intended to better characterize manufactured housing in Minnesota so that utility Conservation Improvement Programs (CIPs) can better target this housing type. The core of the study is a large (n=633) telephone survey of residents of manufactured homes, combined with site-visit data gathered for a subsample (n=99). We use this information to characterize the households and homes, gauge the nature and extent of energy-saving opportunities and provide recommendations for how Minnesota CIPs can enhance their engagement with manufactured housing.
For the purposes of this study, a manufactured home is one that is built entirely in an off-site factory, and transported to the site on a permanent chassis in one or more sections. All such homes constructed after mid-1976 are subject to federal HUD code requirements. Pre-HUD-code homes that share the same features are included in this study, as are manufactured homes that have been placed on basements or have been modified with heated additions after placement.
Key findings from the study are as follows:
• There are about 80,000 manufactured homes in Minnesota, about half of which are located in a manufactured-home park, and half on individually-owned private property (pg. 14).
• More than half of manufactured homes are located in the service territory of an electric cooperative (pg. 16).
• About sixty percent of Minnesota manufactured homes are heated with natural gas, but 30 percent are heated with propane—and propane is the dominant heating fuel among non-park homes. Only a small percentage use electricity as the primary heating fuel. Nearly all have some form of air conditioning. (pg. 16)
• One in three manufactured homes on private property has a heated addition (such as an entryway or bedroom), compared to only about one in ten homes in a manufactured-home park (pg. 16).
• Interviews and industry data support the notion that the vast majority of manufactured homes are not moved from their original location. Fewer than 1,000 new manufactured homes are placed in Minnesota annually. (pg. 19)
• With a median annual income of $35,000, nearly half of households living in a manufactured home in Minnesota are eligible for low-income weatherization services (pg. 20).

Minnesota Manufactured Homes Survey COMM- 087861 | October 20, 2016 Seventhwave 2 | P a g e
• Based on interviews with site-visit participants about two-thirds of households have positive attitudes toward saving energy and are willing to take steps to do so. However, a third of households have low ability to do so, mainly due to financial constraints. (pg. 21)
• About half of households in this population practice some form of thermostat setback during the winter, be it manually or by using a programmable thermostat (pg. 23).
• Most households pay their own energy bills directly to a utility or supplier; a small proportion of park residents are billed by the park operator (pg. 27).
• The average manufactured home uses about 8,000 kwh per year for electricity. Those with natural gas service, use an average of 675 therms per year. Extrapolated to all heating fuels, overall annual energy costs faced by households in manufactured homes average about $2,000 per year. (pg. 27).
• The use of portable electric space heaters is common among residents of manufactured homes: about 40 percent report using them (pg. 56), and utility consumption records suggest an average of about 3,000 kWh per year of consumption when used (pg. 29).
• Among the 30 energy-saving opportunities that we examined, we found cost-effective opportunities worth an average of about $480 per year per home, or about 25 percent of typical household energy bills. Key opportunities that are readily amenable to utility programs include furnace upgrades, lighting retrofits, duct sealing and air sealing. Other opportunities with significant cost-effective potential include reducing or eliminating the use of electric space heaters (which may require addressing other underlying thermal issues), thermostat setback and managing the use of plumbing heat tape (pg. 31).
• The ability for programs to upgrade insulation levels in manufactured homes is limited both by their construction and Minnesota regulations, which prohibit alterations to the original structure of a manufactured home (pg. 48).
• Minnesota utilities could achieve additional savings in this housing stock by working closely with the Weatherization Assistance Program, identifying manufactured homes on private property (which tend to be older and in worse shape), creating “blitz” type programs for manufactured-home parks, developing approaches that result in less space-heater use, and incorporating ENERGY STAR manufactured homes into new construction programs (pg. 84).

Minnesota Manufactured Homes Survey COMM- 087861 | October 20, 2016 Seventhwave 3 | P a g e
Introduction
What is a “manufactured home?” This report seeks to provide information about energy-related characteristics of manufactured homes in Minnesota. But what exactly is a manufactured home? For many people, this term may be synonymous with “mobile home” or even “trailer,” and conjures an image like that shown in Figure 1.
Figure 1. A typical Minnesota manufactured home.
But the federal government and the manufactured-home industry have a precise definition:
“Manufactured home means a structure, transportable in one or more sections, which in the traveling mode, is eight body feet or more in width or forty body feet or more in length, or, when erected on site, is three hundred twenty or more square feet, and which is built on a permanent chassis and designed to be used as a dwelling with or without a permanent foundation when connected to the required utilities, and includes the plumbing, heating, air conditioning, and electrical systems contained therein.” (CFR 24 3280.2)
Dwellings that meet this definition are built to the federal Manufactured Home Construction and Safety Standards code administered by the U.S. Department of Housing and Urban Development (HUD). All manufactured homes built to this standard carry a permanently-affixed certification label as evidence of compliance with the federal HUD code (Figure 2).
Note that modular homes, like the one shown in Figure 3, are constructed to meet local building codes rather than the HUD requirements, and are not considered manufactured homes, even though they are also factory built. Similarly, travel trailers and other recreational vehicles are not considered to be manufactured homes, because they are not designed as permanent dwellings, and they often do not meet the minimum size requirements of the HUD code. Modular homes, travel trailers and other recreational vehicles are excluded from this study.

Minnesota Manufactured Homes Survey COMM- 087861 | October 20, 2016 Seventhwave 4 | P a g e
Figure 2. HUD certification label.
Figure 3. Modular homes like this one are not included in the study.
The federal HUD code went into effect on June 15, 1976. Many in the industry reserve the term “manufactured home” for homes built after this date, and refer to older homes that otherwise share the characteristics of the HUD-code definition as “mobile homes.” We include pre-1976 homes in this study (Figure 4), but for convenience, we simply refer to all such homes as “manufactured homes.”

Minnesota Manufactured Homes Survey COMM- 087861 | October 20, 2016 Seventhwave 5 | P a g e
Figure 4. A "mobile home" built in 1955—the oldest (and smallest) home in the study.
The U.S. Census Bureau compiles various statistics on manufactured homes (though Census continues to refer to these as mobile homes). However, if a homeowner builds a heated addition to their manufactured home (Figure 5), the Census Bureau classifies it instead as a single-family, detached home, and does not include it in Census statistics for manufactured homes. To be clear, such homes are included in this study, and make up more than 20 percent of our sample.
Figure 5. A manufactured home with a heated addition.

Minnesota Manufactured Homes Survey COMM- 087861 | October 20, 2016 Seventhwave 6 | P a g e
Study purpose The overall purpose of this study is to provide basic information and insights on characteristics of manufactured homes in Minnesota that may be of interest to utilities and others who implement energy efficiency programs in the state. Funding for the project came from the State’s Conservation Applied Research and Development (CARD) program, and thus the emphasis of the study is on energy-related aspects of manufactured housing—though we do provide demographics and other information that is not directly related to energy use or savings opportunities.
Specific objectives of the project include:
1. Characterizing the existing manufactured housing stock in Minnesota 2. Characterizing the occupants of existing manufactured homes in the state 3. Characterizing energy-use patterns for occupants of manufactured homes in Minnesota 4. Characterizing the new manufactured-home market in Minnesota 5. Measuring and analyzing energy use in Minnesota manufactured homes; determining if
specific factors relate to increased or reduced energy use; and, developing a benchmark for manufactured homes in the state
6. Conducting blower door and duct leakage tests and analyzing results 7. Investigating the barriers and motivations for investing in efficiency in manufactured
homes for both retrofit and new construction 8. Surveying and evaluating the efficiency opportunities that will help utilities target new
and existing manufactured homes with CIP offerings
Study approach We relied on two key sources of data for the study: a large telephone survey of households living in manufactured homes in Minnesota and site-visits to a subset of survey respondents.
First, project-team member Leede Research implemented a telephone survey of 633 manufactured-home households in the state to gather demographic and other information for a large sample of households.1 This survey was stratified both geographically, and in terms of homes in manufactured-home parks versus individual manufactured homes on private property.2 The survey sample came from two sources: (1) a purchased list of manufactured homes from a commercial data aggregator; and, (2) lists of manufactured homes appearing in property-tax records for sampled counties in the state.
From the pool of survey respondents, we then recruited 100 households for on-site data collection—though we later dropped one home after it was determined to be a modular home rather than a manufactured home. For the field visits, staff from project-team member Affordable Energy Solutions visited the home to gather more-detailed information about the characteristics of the home and its appliances, as well as to conduct an interview with the
1 Appendix B contains the complete survey instrument 2 See Appendix A for more details about the sample design.

Minnesota Manufactured Homes Survey COMM- 087861 | October 20, 2016 Seventhwave 7 | P a g e
household.3 In addition to gathering basic data, we assessed each home for energy-saving opportunities; later, we used the site-visit data to estimate the applicability, potential energy savings and cost for 30 specific retrofit, upgrade and behavioral opportunities.4
As part of the effort, we sought permission from all survey and on-site participants to obtain electricity, natural gas and propane usage data from suppliers of these fuels. However, response rates for this request were low, and some suppliers were unable to provide the requested data. Ultimately, we received usable electricity data for 103 homes, natural-gas data for 30 and propane data for 9.
To help characterize the market for manufactured homes in Minnesota, we also conducted interviews with five manufacturers of manufactured homes, six manufactured home dealers, and 30 manufactured-home park operators.5
In addition to these primary data-collection activities, this study also makes use of several secondary sources of information, including: (a) U.S. Census Bureau data on manufactured homes and demographics of the households that reside in them; and, (b) a comprehensive listing of manufactured-home parks in Minnesota compiled by the Housing Justice Center (formerly the Housing Preservation Project).
3 Appendix C provides more detail about the site-visit data collection. 4 Appendix E provides more detail about the opportunities that we included in the study. 5 Appendix D contains the interview guides for these.

Minnesota Manufactured Homes Survey COMM- 087861 | October 20, 2016 Seventhwave 8 | P a g e
Error margins for the telephone-survey and on-site samples The telephone survey gathered responses from 633 households, and has an overall margin of sampling error of ±5 percentage-points at a 95 percent confidence interval. For example, the proportion of manufactured homes in the survey with natural-gas space heat is 59 percent in the survey: we can thus be 95 percent confident that if we could somehow gather this data for all manufactured homes in the state, the actual population proportion of homes with natural-gas space heat would fall somewhere between 54 and 64 percent.
Many tables in this report break out results for manufactured homes in parks versus those not in parks (i.e. located on individual, privately-owned property), as well as for low-income and non-low-income households. Because these involve sub-samples of the overall telephone survey with fewer respondents, they have somewhat larger margins of error: about ±7 percentage points for each.
The on-site sample of 99 homes is considerably smaller than the telephone survey, and thus has a margin of error of about ±13 percentage points. The key subgroups of park/non-park and low-income/non-low-income have margins of error in the on-site data of about ±17 percentage points.
Note that the above error margins apply to proportions that are close to 50 percent, such as the percent of homes with natural-gas heat above. For smaller (or larger) point estimates, the error margins are smaller. For example, the proportion of homes in the survey sample reporting propane heat is 30 percent, with a margin of error of ±4 percentage points, and the proportion with electric heat is 3 ±1 percent.
Finally, it should be noted that these margins of error account only for random sampling error, and do not include non-random biases in the sample. We have endeavored to minimize these. However, one notable way that the study telephone-survey and site-visit samples differ from the population is that our samples contain fewer renters: Census data indicate that 14 percent of households living in manufactured homes are renters (or occupy the home without rent). In contrast, on a weighted basis, our telephone-survey sample comprises only about 2 percent renters—and only one of the 99 households in the on-site sample is a renter.

Minnesota Manufactured Homes Survey COMM- 087861 | October 20, 2016 Seventhwave 9 | P a g e
Report organization The remainder of this report provides our findings, which are presented as follows:
• We begin with four short case studies intended to give the reader a sense of the range of homes and households that we encountered in the site visits.
• Next, starting on Page 14, we provide a general overview of the population of manufactured homes in the state (i.e. the overall number of homes in the state, how these map into manufactured-home parks versus private-property units, and utility service providers). This section also provides statistics on some key attributes of the housing stock, such as square footage and heating fuel, and summarizes what we learned from manufacturers and dealers of manufactured homes.
• Beginning on Page 20, we delve into the demographics of households living in manufactured homes, and discuss what we learned about their attitudes, behaviors and perceptions of comfort in their homes.
• Starting on Page 27, we examine energy costs faced by residents of Minnesota manufactured homes, based on the electricity and natural-gas consumption histories that we collected, extrapolated to other fuels as well.
• The section starting on Page 30 summarizes the nature and magnitude of energy-saving opportunities that we identified in our site visits, as well as discussing what we learned from park operators, dealers and manufacturers in terms of engagement on energy efficiency.
• Then, starting on Page 37, we provide a series of sections that go into more detail about various aspects of this housing stock, from insulation levels and air leakage, to heating and cooling systems, to water heating systems, to appliances and more.
• Finally, we provide some conclusions and recommendations for Minnesota utility programs to enhance their engagement with manufactured housing in the state (Page 84).
In addition to the main body of the report, a series of appendices (starting on Page 88) provides additional details about the study and our methods.

Minnesota Manufactured Homes Survey COMM- 087861 | October 20, 2016 Seventhwave 10 | P a g e
Case Studies We begin with four brief case studies of households and their homes, selected from our site-visit sample of 99 households. These case studies exemplify many of the key findings from the study, and provide a useful starting point for a portrait of this population.
Household #1 Figure 6: Case-study Home #1.
This manufactured home sits on a ½ acre lot in an exurban development. The two occupants of the home, an older woman who lives with her son, are not on any disability or income-related programs. However, the woman has a head injury that limits her mobility. The home, which is heated with natural gas and has central air conditioning, was manufactured in 1984 and has been maintained very well. The family has lived in the home for about 13 years. Four years after moving in, they put on a new roof and replaced some of the windows.
Our site visit revealed about $400 per year worth of energy savings opportunities, a third of which are for replacing incandescent lighting with efficient LED bulbs. Upgrading the furnace to a high-efficiency model, sealing the ductwork and upgrading the home’s primary refrigerator and upright freezer account for another quarter of the potential savings.
Money did not come up as a particular barrier to addressing the energy-saving opportunities we found in the home. However, the head of the household did not consider her utility costs to be high, and does not perceive energy costs as being an issue for her.

Minnesota Manufactured Homes Survey COMM- 087861 | October 20, 2016 Seventhwave 11 | P a g e
Household #2 Figure 7: Case-study Home #2
This retired couple downsized from a farm with the purchase of this foreclosed manufactured home for $2,000 that is located in a manufactured-home park. They have since made a number of upgrades to the home, including new plumbing piping, a partial floor replacement, roof replacement, a new water heater and a new furnace. They consider their natural gas bills to be reasonable but think that their electric bills are high. The home has an electric dryer, range and water heater, but more importantly, the couple gives their home low marks for comfort in the winter, and uses several electric space heaters for additional warmth. They also put plastic on all the windows—and two of the home’s three doors—in the winter.
We found air-sealing and duct-sealing opportunities, as well as belly-area repair issues. If addressed, these could improve winter comfort levels, and perhaps allow the couple to reduce the use of space heaters—which we estimate to use about $250 worth of electricity annually—and rely more on the natural-gas furnace. This couple was very interested in the energy-audit process and seemed very motivated to try the recommendations.

Minnesota Manufactured Homes Survey COMM- 087861 | October 20, 2016 Seventhwave 12 | P a g e
Household #3 Figure 8: Case-study Home #3
This home, with five adults and one child, sits in a rural setting near three other manufactured homes, though not in a manufactured-home park. It is a crowded household, with five adults, one baby, two cats and six dogs. The home had roof leaks, apparently caused by strains placed on the structure when it was moved to its current site (a relatively uncommon occurrence for manufactured homes).
The household member we interviewed told us said that her utility bills were “not bad,” but she noted that they frequently filled the propane tank and they use an electric space heater almost continuously in the winter. The belly of the home was in very poor shape, particularly in one area under the bathroom, where a large section of belly liner and insulation had dropped down and left ductwork exposed and the bathroom plumbing lines vulnerable to freezing. The family had attempted to counter this by constructing a makeshift perimeter structure around the area, and by using an electric space heater to keep the area warm.
In addition to these belly- and floor-repair issues, we found significant air- and duct-sealing opportunities in this home. In addition, we measured the hot-water temperature at the kitchen sink at 161F, the highest reading of any home in the study. While reducing the water heater set point would potentially provide electricity savings (as well as reduce the risk of scalding) it is unlikely that this household would implement this measure, since it is likely set this high to stretch the amount of hot water available for showering and other uses in this high-occupancy household.
Household income is a limiting factor in maintaining and repairing this home, and while the homeowner expressed some willingness in implementing the energy efficiency measures we identified, they would be limited by both capital to invest as well as health issues and ability to do the work themselves. From the words of our field researcher, “It is their castle and provides, at least at some level, protection from the elements of nature. It cannot however shelter them from the storms that life can bring each of us.”

Minnesota Manufactured Homes Survey COMM- 087861 | October 20, 2016 Seventhwave 13 | P a g e
Household #4 Figure 9: Case-study Home #4
This home, which is located in a manufactured-home park, is occupied by two adults, both of whom suffer from health issues that limit their ability to work. Both require oxygen machines; one occupant is confined to a wheelchair and requires assistance to move. Because of these issues, they rarely leave their home.
The home itself was manufactured in 1977, just after the federal HUD code for manufactured housing came into play. The owners added an electrically-heated entryway in 2000, though they rarely heat the space. Though the home has a central air conditioner, it is non-functional.
The home was recently weatherized under the federal Weatherization Assistance Program, which, among other things installed a quiet bath exhaust fan for continuous ventilation (though the occupants have since converted it to be switch-operated). Lighting retrofits are the largest energy-saving opportunities that we identified for this home: these could offer about $50 of annual energy savings.
Health issues and a lack of disposable income both restrict the ability of this household to implement energy improvements for their home—although the householder we interviewed expressed a willingness to implement lower-cost items that he could do himself.

Minnesota Manufactured Homes Survey COMM- 087861 | October 20, 2016 Seventhwave 14 | P a g e
Overview of Manufactured Homes in Minnesota
Population Based on a combination of data sources, we estimate that there are about 80,000 manufactured homes in the state of Minnesota that are occupied year round, representing about 3.5 percent of all housing units in the state.6 Note that this estimate includes manufactured homes with heated additions, which the Census Bureau classifies instead as single-family detached homes. Nonetheless, Census data are useful in revealing that, after growth through the 1990s, manufactured housing has declined as a fraction of all Minnesota housing.
Figure 10. Manufactured housing as a percent of all Minnesota housing units.
We make a fundamental distinction here between units located in manufactured-home parks —also known as land-lease communities—versus those on private property. We estimate that the population of manufactured homes is nearly evenly divided between these two groups, with about 40,700 manufactured homes in parks, and 38,400 not in parks.
The Minnesota Housing Justice Center (HJC) has compiled a census of manufactured-home parks, which shows that there are nearly 900 parks in Minnesota, with at least one park in nearly every county of the state (Figure 11).
6 Appendix A provides more detail about how we arrived at this—and other—estimates regarding the population of manufactured homes in the state.
Source: U.S. Census Bureau (does not include manufactured homes with heated additions)

Minnesota Manufactured Homes Survey COMM- 087861 | October 20, 2016 Seventhwave 15 | P a g e
Figure 11. Manufactured home parks in Minnesota.
Advocates for affordable housing have decried the fact that the number of parks has been shrinking over time, particularly in suburban areas around the Twin Cities—and efforts are being made to preserve this housing option (Prather, 2016). Perhaps because of this trend, nationally, two-thirds of new manufactured homes shipped in 2015 were placed on private property rather than in a park (Census, 2015).
As one might expect, non-park manufactured homes are mostly located in rural areas, while park homes are more likely to be found in cities, towns and suburbs (Table 1).
Table 1. Key characteristics of manufactured homes.
(telephone-survey data) Overall In MH Park
Not in MH park
Location
City 27% 43% 10%
Town 18% 26% 9%
Suburb 7% 11% 2%
Rural 48% 20% 79%

Minnesota Manufactured Homes Survey COMM- 087861 | October 20, 2016 Seventhwave 16 | P a g e
Manufactured homes in utility service territories Table 2 provides estimates of the number of manufactured homes by Minnesota electric utility service territory. We derived the estimate of the number of units in parks intersecting the HJC list of parks with Geographic Information System (GIS) data for electric-utility service territories. The number of non-park units comes from our county-level estimates of non-park manufactured homes allocated to utilities in proportion to the fraction of the land area covered by each utility in that county. Most notably, more than half of the population (58%) is served by electric cooperatives in the state, and most of these homes (71%) are on private property.
Table 2. Estimated number of manufactured homes by electric utility type and for selected utilities.
Utility type Utility Overall In MH Park
Not in MH park
Investor-owned Xcel Energy 19,100 15,620 3,480
Minnesota Power 3,440 1,820 1,620
Otter Tail Power 1,980 1,710 270
Cooperative Great River Energy 28,420 9,300 19,120
Other 17,260 3,900 13,360
Municipal 8,900 8,350 550
Total 79,100 40,700 38,400
Because adequate GIS data for natural gas utilities in Minnesota were not available, we first estimated the total statewide number of park and non-park manufactured homes with natural gas service from our survey data, and then allocated these to Minnesota natural gas utilities by assuming that each utility’s share of the overall manufactured-home population is the same as its proportion of statewide, residential-sector sales volume (Table 3).
Table 3. Estimated number of manufactured homes with natural gas service, by utility.
Utility Overall In MH Park Not in MH
park
Centerpoint Energy (51%) a 23,850 19,180 4,670
Xcel Energy (28%) 12,930 10,400 2,530
Minnesota Energy Resources (14%) 6,340 5,100 1,240
All others (75) 3,550 2,850 700
Total 46,670 37,530 9,140
aValues in parentheses are utility’s fraction of statewide residential natural gas sales (source: EIA 2014).

Minnesota Manufactured Homes Survey COMM- 087861 | October 20, 2016 Seventhwave 17 | P a g e
Key characteristics of Minnesota manufactured homes Table 4 summarizes some of the key characteristics on Minnesota manufactured homes, based on the telephone survey and site visits we conducted for the study. Overall, about 60 percent of homes are single-wide models, and 40 percent are double-wide models, which are transported in two halves, and then joined on site.
Table 4. Key characteristics of manufactured homes.
Overall In MH Park
Not in MH park
Low-income
household
Non low-income household
Type (telephone-survey data)
Single-wide 61% 75% 45% 72% 52%
Double-wide 39% 25% 54% 28% 47%
Triple-wide <1% <1% <1% <1% 1%
Has heated addition to original structure
(telephone-survey data) 21% 11% 33% 22% 21%
Has unheated addition to original structure (site-visit data)
32% 28% 36% 33% 31%
Mean heated floor area (ft2) (site-visit data)
1,254 1,115 1,425 1,193 1,300
Primary heating fuel (telephone-survey data)
Natural gas 59% 91% 24% 58% 60%
Propane 30% 7% 56% 31% 29%
Fuel oil 4% 0% 8% 3% 4%
Electricity 3% 2% 4% 4% 2%
Wood 4% 0% 9% 4% 5%
Has air conditioning (telephone survey data) 90% 93% 85% 86% 92%

Minnesota Manufactured Homes Survey COMM- 087861 | October 20, 2016 Seventhwave 18 | P a g e
Non-park homes are about three times as likely to have a heated addition. Combined with the fact that non-park homes are more likely to be double-wide models, non-park homes are, on average, nearly 30 percent larger than homes in manufactured-home parks.
Natural gas is the dominant heating fuel among park homes, but propane is the most prevalent fuel among non-park homes—no doubt because the latter are much more likely to located in a rural setting. (Manufactured homes have the highest propane saturation of any housing type in the state.) Also, it is notable that about 60 percent of manufactured homes nationally are electrically heated, due to a large proportion of such homes in the South.
Our survey data suggest that nearly all manufactured homes have some form of air conditioning.
While old units certainly exist in Minnesota, more than half were constructed in 1990 or later (Table 5). The age distribution of park and non-park homes is similar, but homes occupied by low-income households skew towards older units. We estimate that about 80 percent of manufactured homes in Minnesota were built to either the federal HUD code or the Minnesota code that was in existence for four years before the 1976 implementation of the federal code that superseded it.
Table 5. Year constructed.
(telephone-survey data) Overall In MH Park
Not in MH park
Low-income
household
Non low-income household
Year constructed
Before 1950 <1% 0% <1% <1% 0%
1950-1959 <1% 1% <1% 1% 0%
1960-1969 6% 6% 5% 6% 6%
1970-1979 22% 24% 20% 34% 13%
1980-1989 16% 17% 16% 16% 16%
1990-1999 31% 28% 34% 26% 34%
2000-2009 23% 22% 23% 16% 27%
2010+ 2% 2% 1% 1% 3%

Minnesota Manufactured Homes Survey COMM- 087861 | October 20, 2016 Seventhwave 19 | P a g e
The Minnesota market for manufactured homes Because manufactured homes are required to be certified under the federal HUD code, data on the manufacture and sales of new units are readily available, and can be found on the websites of the Manufactured Housing Institute and the U.S. Census Bureau Manufactured Housing Survey.7 According to these sources:
• As of 2012, there were 45 corporations producing manufactured homes at 123 plants around the country.8
• Manufactured homes are produced in Minnesota, but the state is not a major producer on either a national or regional basis.9 The roughly 900 units produced in Minnesota in 2015 represent only about one percent of the national total. Among Midwestern states, only Minnesota and Indiana produce manufactured homes, but Indiana produces almost 90 percent of the regional total (6,200 units).
• In 2015, the average sales price of a new single-wide manufactured home in Minnesota was $53,800; the average price of a double-wide unit was $86,300.10
We interviewed three manufacturers and five dealers who sell manufactured homes in the Minnesota market. These individuals described the Minnesota market for new and used manufactured homes in varied terms: manufacturers said that the market for new homes was still anemic in the wake of the recent recession but slowly rising. Dealers—who generally sell within 100 miles of their location—reported that sales volume for used manufactured homes varied with the local economy. Those in the western part of the state noted the oil boom in the Dakotas and the strong demand for housing that it created there, leading to most of their sales being out-of-state for a period of time. A dealer in the southeastern part of the state said that sales of both new and used units was strong in that region.
Census data and our interviews with Minnesota dealers and park operators generally support the notion that manufactured homes are rarely moved. Nationally, 80 percent of manufactured homes are located on the site where they were placed when new.11
7 United States Census Bureau, Manufactured Housing Survey (http://www.census.gov/programs-surveys/mhs.html). Last accessed September 2016. 8Manufactured Housing Institute. “Manufactured Home Corporations And Plants (1990-2012)” (http://www.manufacturedhousing.org/webdocs/Manufactured%20Home%20Corporations%20And%20Plants%20(1990%20-%202012).pdf). Last accessed September 2016. 9 Manufactured Housing Institute. “Manufactured Home Shipments by State (1990 - 2015), (http://www.manufacturedhousing.org/lib/forcedownload.asp?filepath=/admin/template/subbrochures/390temp.pdf). Last accessed September 2016. 10 United States Census Bureau. “Average Sales Price of New Manufactued Homes Placed: by Size of Home State (2015),” (http://www2.census.gov/programs-surveys/mhs/tables/2015/stavg15.xls). Last accessed September 2016. 11 American Housing Survey 2013 National tables, Table C-01-AO.

Minnesota Manufactured Homes Survey COMM- 087861 | October 20, 2016 Seventhwave 20 | P a g e
Household Demographics, Attitudes, Behaviors and Comfort
Demographics Residents of manufactured homes occupy a demographic position that in some ways is intermediate between those living in site-built, single-family homes and those who live in apartments or condominiums.
Table 6. Household size, income and poverty level for Minnesota households, by housing type.
(Census data) Manufactured
home
Single-family
Site-built
Small multifamily (2-4 units)
Large multifamily
(5+ units)
Household size (people)
1 34% 21% 39% 58%
2 32% 38% 31% 26%
3 14% 15% 13% 8%
4 10% 15% 9% 5%
5+ 10% 11% 8% 3%
Median annual household income $35,000 $70,000 $31,900 $27,900
Household income as % of Federal Poverty Guideline
<100 16% 6% 23% 24%
100-149 16% 5% 13% 14%
150-199 12% 7% 11% 11%
200-299 24% 15% 18% 17%
300+ 32% 67% 35% 34%
At or below 200% of FPG 45% 18% 47% 49%
Source: American Community Survey 2010-2014 Public-Use Microdata

Minnesota Manufactured Homes Survey COMM- 087861 | October 20, 2016 Seventhwave 21 | P a g e
In particular, manufactured-home residents more closely resemble single-family homeowners in terms of household size, but are more akin to apartment dwellers in terms of income and poverty level, with nearly half of manufactured-home households falling at or below 200 percent of the Federal Poverty Guideline, which is the threshold for receiving low-income weatherization services and other utility low-income programs (Table 6).
Like occupants of traditional site-built homes, most residents of manufactured homes own their home—though not necessarily the land on which it sits (Unlike other homeowners, however, more than half of households in manufactured homes do not carry a mortgage).
Manufactured-home park residents do face lot-rental costs and personal property taxes on their home (which average about $220 per month), and are more likely to have difficulty securing financing to purchase a manufactured home, since these are generally considered personal property rather than real estate. Nonetheless, living in a manufactured home in Minnesota is considerably less expensive than living in a traditional home or renting an apartment (Table 7).
Table 7. Tenure and housing costs for Minnesota households, by housing type.
(Census data) Manufactured
home
Single-family
Site-built
Small multifamily (2-4 units)
Large multifamily
(5+ units)
Tenure
Owned with mortgage or loan 31% 63% 13% 6%
Owned free and clear 55% 27% 6% 4%
Rented 11% 9% 80% 89%
Occupied without rent 3% 1% 1% 1%
Average monthly housing costs (rent, mortgage payments, taxes, insurance)
$420 $1,120 $840 $790
as a % of household income 12% 16% 27% 28%
Source: American Community Survey 2010-2014 Public-Use Microdata
Attitudes On our telephone survey of households living in manufactured homes, we asked respondents about their willingness to take steps to save energy around the home (Table 8). Nearly a third of respondents stated that they would not do anything differently to save energy, but at the same time, more than a third were willing to at least put up with a little inconvenience—if not go out of their way—to save energy. Moreover, the survey data reflect people’s off-the-cuff response to a generic query about willingness to save energy. For a more context-sensitive

Minnesota Manufactured Homes Survey COMM- 087861 | October 20, 2016 Seventhwave 22 | P a g e
assessment of interest and ability related to energy-saving actions, we discussed selected opportunities with the 99 households that participated in the on-site data collection for the study. The opportunities that were discussed varied by household, and were specific to that household based on those that had been identified during the site visit. We used these data—and our overall assessment of each household’s living situation—to categorize each household within a matrix of interest and ability related to pursuing energy savings.
Table 8. Willingness to save energy (telephone-survey data).
Which of the following best describes how far your household is willing to go to save energy if it means saving some money too? Would you...? Overall
In MH Park
Not in MH park
Low-income
household
Non low-income household
…not do anything differently to reduce your energy
consumption 29% 30% 29% 30% 30%
…reduce consumption only if the cost savings are very high 11% 10% 12% 11% 11%
…reduce consumption only when it is convenient 11% 11% 11% 10% 12%
…put up with a little inconvenience to reduce your
consumption 29% 28% 30% 27% 31%
…go out of your way to cut down your energy
consumption 19% 20% 16% 21% 17%
…other: I have already done what I can [coded] <1% 1% <1% 1% 0%
…Other [uncategorized] <1% 0% <1% 0% <1%
“Don’t know” and “Refused” omitted
The result of this analysis (“Don’t’ know and “Refused” omitted Table 9) suggest higher willingness to implement measures than suggested by the survey data, but also indicate that fully a third of households have low ability to do so: this mostly has to do with limited income and associated constraints with investing in energy efficiency.

Minnesota Manufactured Homes Survey COMM- 087861 | October 20, 2016 Seventhwave 23 | P a g e
Table 9. Willingness and ability to take energy saving steps.
Ability Low Medium High Total
Not willing 1% <1% 0% 2%
Somewhat willing 16% 14% <1% 30%
Willing 15% 17% 11% 43%
Very willing 1% 4% 20% 25%
Total 33% 36% 31% 100%
(Categorization derived from on-site participant interviews.)
Behaviors We asked survey participants about various energy-saving actions (Table 10). A large majority of respondents reported having installed energy-efficiency lighting, and half or more of households say they have taken relatively low-cost steps like caulking and weather-stripping, installing low-flow showerheads and wrapping hot water pipes.
Table 10. Self-reported energy saving actions taken.
(telephone-survey data) Overall In MH Park
Not in MH park
Low-income household
Non low-income household
Energy saving actions taken
installed efficient light bulbs 84% 81% 86% 84% 83%
wrapped hot water pipes 64% 71% 57% 66% 62%
added caulking/ weather-stripping 60% 58% 61% 66% 55%
installed low-flow showerhead 51% 54% 48% 53% 50%
put plastic on windows 44% 45% 43% 54% 36%
added insulation 35% 31% 39% 37% 33%
installed faucet aerators 34% 36% 32% 36% 33%
wrapped water heater 21% 26% 17% 24% 19%
“Don’t know” and “Refused” omitted

Minnesota Manufactured Homes Survey COMM- 087861 | October 20, 2016 Seventhwave 24 | P a g e
In terms of day-to-day behavior, we asked respondents to report their heating and cooling temperature set points during the winter and summer months. We asked about the temperature settings for when they were home, away, and asleep at night. Results from the survey show that in winter months, while about half maintain a constant temperature, a third set back the thermostat by at least three degrees at night (Table 11). In the summer months, around two-thirds of respondents said they maintain a constant temperature setting—and about one in five report lower temperature settings at night (Table 12). About 40 percent of survey respondents report having a programmable thermostat.
Table 11. Winter set-back practices.
(telephone-survey data) Overall In MH Park
Not in MH park
Low-income
household
Non low-income household
Temperature set-back when away during the day
higher (any amount) 1% 0% 1% 1% 1%
no difference 50% 50% 50% 54% 47%
lower by 1-2 degrees 8% 7% 9% 8% 8%
lower by 3+ degrees 41% 43% 40% 37% 44%
Temperature set-back at night
higher (any amount) 2% 2% 1% 2% 1%
no difference 55% 55% 55% 60% 51%
lower by 1-2 degrees 12% 12% 13% 11% 13%
lower by 3+ degrees 31% 31% 31% 27% 34%

Minnesota Manufactured Homes Survey COMM- 087861 | October 20, 2016 Seventhwave 25 | P a g e
Table 12. Summer set-up practices (households with central air conditioning).
(telephone-survey data) Overall In MH Park
Not in MH park
Low-income
household
Non low-income household
Temperature set-up when away during the day
lower (any amount) 8% 6% 10% 9% 7%
no difference 63% 64% 63% 68% 61%
higher by 1-2 degrees 6% 5% 8% 3% 8%
higher by 3+ degrees 23% 25% 20% 21% 24%
Temperature set-up at night
lower (any amount) 21% 19% 23% 18% 22%
no difference 70% 74% 65% 72% 69%
higher by 1-2 degrees 6% 4% 8% 7% 5%
higher by 3+ degrees 3% 3% 3% 4% 3%

Minnesota Manufactured Homes Survey COMM- 087861 | October 20, 2016 Seventhwave 26 | P a g e
Comfort The majority of survey respondents expressed positive levels of comfort for both summer and winter seasons (Figure 12). The number of households who feel their home is uncomfortable is small, though low-income households express slightly lower comfort levels than non-low-income households.
Figure 12. Reported level of comfort for summer and winter seasons (telephone-survey data).
Uncomfortable Comfortable
0 20 40 60 80 100percent
Win
ter
Sum
mer
not low-income
low-income
not in park
in park
overall
not low-income
low-income
not in park
in park
overall
Very uncomfortable
Somewhat uncomfortable
Neither uncomfortable or comfortable
Somewhat comfortable
Very comfortable

Minnesota Manufactured Homes Survey COMM- 087861 | October 20, 2016 Seventhwave 27 | P a g e
Energy Consumption and Costs Residents of manufactured homes who responded to our telephone-survey overwhelmingly reported that they pay their energy bills directly to their utility or provider (Table 13), though rarely, some of these services are paid through a park operator (Figure 13).
Table 13. Billing arrangements for utility payments.
(telephone-survey data) Overall In MH Park
Not in MH park
Low-income
household
Non low-income household
Electricity bills are paid…
…directly to the utility 99.2% 99% 100% 99% 99%
…through park operator or landlord 1% 1% 0% 1% 1%
Natural gas bills are paid…
…directly to the utility 96.7% 93% 100% 97% 96%
…through park operator or landlord 3% 7% 0% 3% 4%
Propane bills are paid… (survey)
…directly to the provider 99.6% 97% 100% 100% 99%
…through park operator or landlord 0% 3% 0% 0% 1%
Fuel-oil bills are paid…
…directly to the provider 100% 100% 100% 100% 100%
…through park operator or landlord 0% 0% 0% 0% 0%
Among the 30 manufactured-home park operators we interviewed, most also reported that residents take care of their own energy bills. About one in five did report that they paid a master bill to the utility (or propane supplier), and then billed the tenants individually. (In two of these cases, this arrangement applied only to an older part of the park). In all of cases where park operators were collecting money for energy bills, operators reported that park staff read individual meters and bill residents for their actual consumption (by law, park operators must either bill tenants for their actual usage or charge everyone the same amount). In contrast,

Minnesota Manufactured Homes Survey COMM- 087861 | October 20, 2016 Seventhwave 28 | P a g e
nearly all park operators appear to include water and sewer charges in their monthly lot-rental fee.
Figure 13. This manufactured home is in a park with a propane sub-metering arrangement (inset photo).
We asked telephone-survey and site-visit participants for permission to obtain energy-usage histories from their energy providers. Ultimately, we were able to obtain usable electricity consumption histories for 103 homes, along with natural gas histories for 30 and propane records for nine.12 Typically, we received two years’ worth of consumption records.
To analyze the energy consumption data, we merged the consumption data with temperature data from nearby weather stations, and ran algorithms intended to disaggregate space-heating and cooling consumption from other end uses—as well as normalize each household’s usage to 30-year weather norms (see Appendix F for details and Table 14 for a summary). In the electric consumption data, we could identify a cooling signature in 65 homes and—though none of the homes has primary electric heat, we detected a signature consistent with supplemental electric heating in 27 homes. There may be additional homes that use electricity for cooling or heating, but at too low a level to be detectable by our methods.
12 Due to the small number of cases, propane results are not presented here.

Minnesota Manufactured Homes Survey COMM- 087861 | October 20, 2016 Seventhwave 29 | P a g e
Table 14. Mean weather-normalized electricity and natural-gas consumption.
Mean Usage Overall In MH Park
Not in MH park
Low-income
household
Non low-income household
Natural-gas (therms/year) Space-heating* 574 548 652 514 640
Non-space-heating* 121 116 134 121 123
Overall 674 638 786 631 722
Electricity usage (kWh/year) Space-heating (supplemental)* 3,173 2,381 3,770 2,812 4,029
Space-cooling* 1,056 1,038 1,085 1,102 1,016
Non-space-conditioning 6,666 5,841 7,490 6,697 6,638
Overall 8,059 7,136 8,981 8,339 7,809
*Mean of cases where the end-use could be statistically disaggregated from other end-uses based on consumption patterns.
Extrapolating these results to other fuels—and using statewide average fuel costs—we estimate that the residents of the average Minnesota manufactured home face about $2,000 in annual energy bills.13 However, this estimated annual value varies depending on the heating fuel (Table 15).
Table 15. Estimated annual energy costs of Minnesota manufactured homes, by heating fuel.
Percent of homes
(survey) Annual total energy
costs*
Heating fuel Natural gas 59% $1,860
Electricity 3% $2,930
Propane 30% $2,330
Fuel oil 4% $2,280
Wood 4% $1,930
Weighted average 100% $2,050
Includes heating fuel, electricity and utility monthly fixed charges.
13 We used the following values for statewide average costs: electricity, 13.05 cents per kW; natural gas, 84.9 cents per therm; propane $1.55 per gallon; fuel oil, $2.31 per gallon; wood, $225 per (20 million BTU) cord.

Minnesota Manufactured Homes Survey COMM- 087861 | October 20, 2016 Seventhwave 30 | P a g e
Energy-saving opportunities
Literature and interviews Manufacturers and dealers generally described energy efficiency as a second-tier area of interest for many buyers. Manufacturers may offer upgrade packages that include higher levels of insulation, and some buyers are interested in these.
The federal Environmental Protection Agency has a program for factory certification of new ENERGY STAR manufactured homes. (Homes can also be certified after purchase and site placement in a process similar to that for site-built homes.) Nationally, three utilities and one state housing corporation (none in Minnesota) currently offer manufacturers incentives of $1,000 to $2,000 for constructing and siting ENERGY STAR manufactured homes in their territories.14 . Federal tax credits of up to $2,000 for these homes are also available through the end of 2016. However, the potential for energy savings from new manufactured homes in Minnesota is limited by the fact that fewer than 1,000 new manufactured homes are sold in Minnesota annually, according to Census data.
The American Council for an Energy Efficient Economy produced a report on the potential for energy savings in the manufactured-housing sector that projected potential for 40 percent electricity savings and 30 percent natural gas savings, of which a quarter was related to improvements in the efficiency of new units (Talbot, 2012). However, that study had a national perspective, which skews toward electrically-heated homes in the southern part of the country.
The federal Weatherization Assistance Program (WAP) treats manufactured homes occupied by low-income households throughout the country. A recent national impact evaluation of the program found that for homes in cold climates like Minnesota’s, the program achieved an average of about 100 therms/year (12.5%) savings on natural gas and 700 kwh/year (9%)—at an average cost of about $5,000 per home (Blasnik et al., 2015).
In our interviews, dealers of used manufactured homes generally said that they do not make energy improvements or upgrades to the used units that they sell, though they do make repairs to damaged bellies and other areas that could have an energy impact. When dealers replace appliances, it tends to be with similar models.
The park operators we interviewed reported low engagement with residents on the topic of energy usage or bills, because most residents of parks are responsible for their own energy bills. Park operators also appear to have only a passing understanding of utility programs. However, when asked whether they would share utility-program information with their residents, nearly all replied that they would be happy to do so—and some responded with considerable enthusiasm to this idea. Several mentioned monthly newsletters and community bulletin boards.
14 Systems Building Research Alliance. “Incentives for Energy Star Manufactured Homes,”available at: http://www.research-alliance.org/pages/es_hud_incentives.htm.

Minnesota Manufactured Homes Survey COMM- 087861 | October 20, 2016 Seventhwave 31 | P a g e
Identified energy-saving opportunities from site visits We used the data for the 99 site-visit homes to assess the prevalence and magnitude of 30 individual energy-efficiency and energy-conservation opportunities.15 These constitute a mix of retrofit measures, upgrade-at-time-of-replacement opportunities and low- or no-cost behavioral measures:
Retrofit measures
• Insulation • Air-sealing • Duct sealing • Window and door replacement • Showerheads and faucet aerators • Lighting
Upgrade measures (at time of replacement)
• Heating/cooling system • Primary refrigerator • Clothes washer
Behavioral measures (low/no-cost)
• Thermostat settings • Furnace-fan settings • Use of portable space heaters • Use of electronics • Water heater set point • Use of secondary refrigerators/freezers • Use of plumbing heat tape
Our analysis considered secondary space-conditioning impacts, such as the effect of reduced electricity consumption for efficient lighting on space-heating loads. We did not, however, attempt to calculate fully-interacted savings —in the sense that, for example, simultaneous installation of insulation and a more efficient heating system produces less savings than the sum of the savings for either measure installed individually. Approximation of these effects suggest that they have only a minor impact on the values reported here.
Altogether, we identified an average of about $480 worth of consumer annual energy savings per home for measures that would be cost effective for homeowners to install on a discounted, life-cycle basis (Table 16), or about 25 percent of the energy bills for the typical manufactured home. Homes that are not in manufactured-home parks appear to have considerably more savings opportunities than those that are in parks. This is partly a reflection of the fact that non-park homes tend to be older and in worse shape than park homes, but also that non-park households are more likely to use portable space heaters, have less efficient lighting, and are
15 The details for how we did this are provided in Appendix E.

Minnesota Manufactured Homes Survey COMM- 087861 | October 20, 2016 Seventhwave 32 | P a g e
more likely to have secondary refrigerators and freezers that are candidates for being taken out of service.
On a statewide basis, estimated potential savings from cost-effective measures in manufactured homes total:
• 240 million kWh of electricity • 4.5 million therms of natural gas • 1.7 million gallons of propane • 310,000 gallons of fuel oil
Figure 14 shows how the savings potential breaks down by measure type and measure. Keep in mind that the values shown are averages over all homes, and thus reflect both the incidence of the opportunity and potential impact on energy costs when applicable. Thus water heater pipe insulation accounts for about the same potential as floor insulation; the latter saves far more when implemented, but has a much lower incidence in the population.
Figure 14. Mean energy-cost savings per home, by measure and measure type.
$88
Lightingretrofits
$35
Ductsealing
$21
Airsealing
$20
Pipeinsulation
$18
Floorinsulation
$15
Ceilinginsulation
$14
Showerhead
$10
Waterheaterwrap
$9
Otherretrofit
Retrofit opportunities ($231/home)
$41
Furnace
$13
Air-sourceheat pump
$13
CentralA/C
$8
Refrigerator/freezer
$8
Otherupgrade
Upgrade opportunities ($84/home)
$81
Portablespace heater
$28
Plumbingheat tape
$22
Winterthermostat
setback
$8
Waterheater
setpoint
$6
Computerpower
management
$7
Summerthermostat
setback$6
Refrigerator/Freezerunplug
$6
Furnacefan
Otherbehavioral
$2
Behavioral opportunities ($166/home)

Minnesota Manufactured Homes Survey COMM- 087861 | October 20, 2016 Seventhwave 33 | P a g e
Table 16. Mean energy-cost savings from identified opportunities.
Average identified energy savings opportunities per home ($/yr.) Overall
In MH Park
Not in MH park
Low-income
household
Non low-income household
All opportunities $505 $384 $654 $511 $501
Cost-effective opportunities* $480 $357 $632 $493 $471
By measure type
Retrofit $231 $162 $315 $265 $205
Upgrade at time of replacement
$84 $67 $105 $80 $87
Behavioral $166 $127 $213 $148 $179
By end-use category
Building shell $56 $19 $102 $75 $42
Space-heating/cooling $219 $165 $285 $210 $225
Water heating $56 $47 $68 $62 $52
Refrigeration $17 $11 $25 $20 $15
Lighting $91 $72 $115 $88 $94
Laundry $5 $5 $4 $6 $3
Electronics $7 $9 $4 $6 $7
Other $29 $29 $28 $24 $33
By fuel**
Electricity $388 $280 $521 $377 $396
Natural gas $49 $72 $19 $66 $35
Propane $33 $5 $68 $48 $21
Fuel oil $9 $0 $20 $1 $15
Wood $2 $0 $4 $0 $3
*Cost effective on a discounted, life-cycle basis. See Appendix E for details. **Averaged over all homes, including those that do not use the fuel in question.

Minnesota Manufactured Homes Survey COMM- 087861 | October 20, 2016 Seventhwave 34 | P a g e
Top cost-effective electric measures include eliminating portable space heaters, retrofitting lighting with LED bulbs and unplugging plumbing heat tape during warm weather (Table 17).
Some of these measures are more amenable to CIPs than others. Nearly 40 percent of manufactured-home households use portable electric heaters during the winter: while some do so out of (the often mistaken) belief that this is a less-expensive way to heat their home, for many electric space heaters are needed to solve localized comfort problems. Eliminating these may thus require sealing ducts and implementing other retrofit measures.16 On the other hand, lighting opportunities exist in nearly all homes, and are readily targeted by CIP efforts.
Table 17. Top electric opportunities.
Opportunity
Opportunity Incidence
(% of homes)
Average savings
(kWh/yr.)
Percent of aggregate identified electricity
savings
Eliminate portable space heaters (Behavioral)
26% 3,550 31%
LED lighting replacement (Retrofit) 96% 710 23%
Manage use of heat tape (Behavioral) 84% 250 7%
Water heater pipe insulation (Retrofit) 86% 240 5%
Upgrade to Air-source heat pump (Upgrade)
1% 8,280 3%
Central A/C upgrade (Upgrade) 22% 460 3%
Electric water Heater wrap (Retrofit) 61% 160 3%
Showerhead (Retrofit) 62% 240 3%
Refrigerator/freezer replacement (Upgrade)
66% 120 3%
Computer power management (Behavioral)
12% 470 2%
On the natural-gas side, furnace upgrades and duct sealing account for more than half of all cost-effective natural-gas opportunities (Table 18). Because furnace upgrade opportunities are available only when households elect to replace their furnace, the savings available to natural-gas CIPs in any given year is limited to the (small) fraction of households that replace their heating system. In contrast, duct sealing, air sealing and insulation retrofits can be
16 Removing the portable-space-heater measure entirely from our pool of opportunities would reduce the average cost-effective savings potential from $480 to $400.

Minnesota Manufactured Homes Survey COMM- 087861 | October 20, 2016 Seventhwave 35 | P a g e
implemented at any time, and duct sealing shows a particularly high incidence among manufactured homes, nearly all of which have ducts located in the unheated space below the flooring, and many of which exhibit moderate to significant leakage.
Table 18. Top natural-gas savings opportunities.
Opportunity
Opportunity Incidence
(% of homes)
Average savings
(therms/yr.)
Percent of aggregate identified electricity
savings
Furnace replacement (Upgrade) 54% 72 36%
Duct sealing (Retrofit) 75% 35 22%
Manage thermostat settings (Behavioral)
71% 27 16%
Air sealing (Retrofit) 36% 29 7%
Ceiling insulation (Retrofit) 9% 64 6%
Belly/Floor insulation (Retrofit) 17% 65 4%
On the other hand, insulation opportunities among manufactured homes are much less prevalent than among site-built homes. This is not because manufactured homes could not use more insulation, but rather—as we describe in more detail on page 48—because Minnesota state regulations prohibit adding insulation beyond what was originally installed for the roughly 80 percent of Minnesota manufactured homes covered by the federal HUD code or a Minnesota state code that was briefly in effect prior to the HUD code. This largely eliminates ceiling-insulation opportunities except for heated additions, and limits floor insulation to homes where the belly has been damaged and is in need of restoration to its original condition.
Detailed statistics about individual opportunities that we assessed can be found in Appendix E
Note that not all of the savings identified here can be addressed by Minnesota utility CIPs, because these programs are targeted mainly at electricity and natural gas opportunities, while a significant minority of manufactured homes in the state use propane or other deliverable fuels. However, Minnesota Department of Commerce guidance allows for electric utilities to address delivered-fuel opportunities for low-income households (DER, 2012). This means that only delivered-fuel opportunities in non-low-income homes are beyond the reach of utility CIPs. When these opportunities are deducted, the average available savings potential is slightly reduced to $434 per home.
Technical opportunities for reducing energy consumption can only be realized insofar as households are willing and able to address them. Toward this end, we mapped the list of identified opportunities into the two-way classification of site-visit homes by willingness and ability (see page 21). The results (Table 19) show that opportunities skew somewhat toward households with low ability to undertake measures, primarily due to limited income. This suggests a need for programs that provide financial assistance with measure installation in this population.

Minnesota Manufactured Homes Survey COMM- 087861 | October 20, 2016 Seventhwave 36 | P a g e
Table 19. Distribution of aggregate potential energy-cost savings by household willingness and ability to address opportunities.
Ability
Low Medium High Total
Not willing 1% <1% 0% 1%
Somewhat willing 18% 11% <1% 30%
Willing 20% 14% 9% 42%
Very willing 3% 5% 19% 27%
Total 42% 30% 28% 100%
(Categorization derived from on-site participant interviews.)

Minnesota Manufactured Homes Survey COMM- 087861 | October 20, 2016 Seventhwave 37 | P a g e
Detailed Characteristics The sections that follow provide more detailed information about various aspects of construction and energy-related features of manufactured homes in Minnesota.
Building envelope
Belly and crawl space areas Manufactured homes are built on a structural floor system that generally requires support at a number of points along main beams within the boundaries of the home. The crawl space under the home is commonly enclosed using non-structural skirting, which, if well-installed, can reduce heat loss and keep animals out. Some homes that are more permanently located have concrete block walls closing off the crawl space, and a relatively small fraction are placed on full basements that perform the same enclosing function (Table 20).
Table 20. Foundation enclosure type, not including additions.
(site-visit data) Overall In MH Park
Not in MH park
Low-income
household
Non low-income household
Foundation enclosure type
basement 10% 0% 23% 11% 10%
block crawl space 17% 12% 23% 10% 22%
skirt only 73% 88% 54% 79% 69%
All of the homes in the on-site sample with concrete block crawl space or basement walls had completely enclosed belly areas, and 75 of 79 homes with skirting only were judged to be completely enclosed. Three of the remaining homes had missing sections in the skirting, and in one case the skirting had been entirely removed. Excluding the homes with concrete block enclosures, the skirting material was metal in 51 cases, vinyl in 22 cases, and plywood or other wood sheathing in four cases. A layer of insulation was observed behind the skirting in a few cases. Concrete block crawl space and basement walls were also found to be insulated on the interior surface in several cases.
The belly area below the floor of the living space is generally insulated, and forced air ductwork is almost always installed in this area. We evaluated the condition of the belly in each home, considering missing insulation, tears or missing areas in the liner protecting the insulation, signs of animal activity, etc. Excluding homes on basements, we found the belly to be in good condition in about half of the homes inspected, but in poor or very poor condition for about one in five (Table 21).
Plastic sheeting or similar material is sometimes used to cover the ground below manufactured homes in order to prevent moisture rising from the soil below the home—though the coverage

Minnesota Manufactured Homes Survey COMM- 087861 | October 20, 2016 Seventhwave 38 | P a g e
is often incomplete. Most manufactured homes in our sample either had no ground cover at all, or had 75 to 100 percent coverage. Seam lapping and sealing are ways of increasing the effectiveness of the ground cover in limiting moisture intrusion. For those with substantial ground coverings, seams were overlapped in about a quarter of cases, and sealed in less than 10 percent.
Table 21. Belly condition and crawl space ground cover, Excludes additions and homes on basements.
(site-visit data) Overall In MH Park
Not in MH park
Low-income
household
Non low-income household
Belly condition
good 50% 53% 46% 45% 54%
fair 29% 34% 23% 23% 34%
poor 11% 5% 20% 17% 6%
very poor 10% 8% 12% 15% 6%
Percent ground cover
none 48% 50% 44% 45% 50%
1 to 24 3% 5% 0% 0% 6%
50 to 74 7% 9% 4% 8% 6%
75 to 99 32% 30% 35% 43% 24%
100 10% 6% 17% 5% 14%
Wall construction Wall framing in manufactured homes ranges from 2 x 2 to 2 x 6 (Table 22), and wall framing size has clearly increased over time (Table 23). Manufactured home wall systems are occasionally vented as a means of reducing possible moisture accumulation; however, we found wall venting in just two homes.

Minnesota Manufactured Homes Survey COMM- 087861 | October 20, 2016 Seventhwave 39 | P a g e
Table 22. Manufactured home wall framing, excluding additions.
(site-visit data) Overall In MH Park
Not in MH park
Low-income
household
Non low-income household
Wall framing size
2x2 6% 4% 7% 0% 10%
2x3 5% 2% 9% 8% 3%
2x4 28% 33% 21% 40% 19%
2x6 61% 60% 63% 52% 69%
Table 23. Wall framing size by decade of manufacture.
Framing size (site visit
data)
2x2 2x3 2x4 2x6
Decade built
1950-1959 2 0 0 0
1960-1969 0 5 1 0
1970-1979 0 2 25 0
1980-1989 0 0 3 16
1990-1999 0 0 0 27
2000-2009 0 0 0 16
2010-2016 0 0 0 2
Total 2 7 29 61 Unweighted counts of field-visit sites (n=99)
Roof systems Manufactured home roofs can be categorized by roof framing or truss type as bowed, flat, or pitched (Figure 15); all these types were found in our field inspections, though pitched roofs—which generally offer more space for insulation—dominate (Table 24). Several homes in the study had new pitched roofs constructed over the original bowed or flat roof, and in two cases, the new roofs were supported by pole structures extending to footings in the ground (Figure 16).

Minnesota Manufactured Homes Survey COMM- 087861 | October 20, 2016 Seventhwave 40 | P a g e
Figure 15. Examples of the three types of roofs for manufactured homes.

Minnesota Manufactured Homes Survey COMM- 087861 | October 20, 2016 Seventhwave 41 | P a g e
Table 24. Roof structure type, not including additions.
(site-visit data) Overall In MH Park
Not in MH park
Low-income household
Non low-income household
Roof structure type
bowed 23% 30% 15% 30% 19%
flat 5% 8% 2% 7% 4%
pitched 72% 62% 84% 64% 77%
Figure 16. A manufactured home with a separate roof structure built over it.
We visually assessed roof condition at each home inspected (Table 25). Although only about one in ten homes were judged to have roofs that were in poor or very poor condition, nearly one in four householders reported issues with roof leaks (see page 76). In addition, more than half of home owners (58%) reported formation of icicles and/or ice dams in winter weather, a clear sign of under-insulated or leaky ceiling spaces. About six in ten homes have a vented roof.

Minnesota Manufactured Homes Survey COMM- 087861 | October 20, 2016 Seventhwave 42 | P a g e
Table 25. Roof condition.
(site-visit data) Overall In MH Park
Not in MH park
Low-income
household
Non low-income household
Roof condition
good 29% 28% 30% 19% 36%
fair 62% 62% 62% 68% 58%
poor 9% 10% 8% 12% 6%
very poor 0% 1% 0% 1% 0%
Heated additions Twenty-two of the 99 manufactured homes where we performed site visits had heated additions. Two of the homes had two additions each, and one had three additions. Of the 26 total additions, the most common type was a heated entryway (Table 26, Figure 17). A simple low-slope shed roof appeared most common among the additions we inspected, though gable roofs were found in some cases. The bedroom addition roof in Figure 17 appears to be a bowstring style, perhaps involving re-use of part of a former mobile home.
Table 26. Heated addition types and floor area.
(site visit data) Number of
cases Average
area (sq. ft.)
Addition space type
entryway or foyer 15 162
bedroom 5 197
kitchen or living space 4 178
Other* 2 516
(unweighted counts and averages) *Includes one heated storage room and one heated garage.
The majority of additions we inspected had open frame floors, with or without skirting, similar to typical mobile home construction (Table 27). Most of these floor systems appeared to be completely enclosed or nearly so, but at least three homes had lattice work skirting or other large openings allowing airflow under the addition. Wall and floor framing sizes found in additions are shown in Table 28.

Minnesota Manufactured Homes Survey COMM- 087861 | October 20, 2016 Seventhwave 43 | P a g e
Figure 17. Examples of additions.
Table 27. Foundation types for heated additions.
(site-visit data) Number of
cases
Foundation type 3 slab
basement 2
block crawl space 6
open floor with skirting 15
(unweighted counts)
Table 28. Wall and floor framing in heated additions.
Number of cases (site-visit data) Wall
framing Floor
framing
Framing lumber size 2 x 4 19 1
2 x 6 7 10
2 x 8 0 6
2 x 10 0 2
slab floor n/a 3
(unweighted counts)
Most of the additions we inspected were integrated into the main structure, and shared heating and cooling loads with the rest of the building; a lone heated garage was an exception—it was equipped with a natural gas fired unit heater.

Minnesota Manufactured Homes Survey COMM- 087861 | October 20, 2016 Seventhwave 44 | P a g e
Structural, durability, and energy efficiency problems were common in additions as well as in original structures. Examples noted by the field team include:
• “Much insulation has fallen down from the floor, about 40%.” • “Floor insulation almost entirely gone from animal removing it. Extremely hard
to insulate at this point due to lack of physical access.” • “Rotted wood in floor near interior doorway. Fire at chimney on wood burner in
the past.” • “Leaks to exterior and has no insulation on floor. Owner uses space heater in
this area. Ceiling is a false ceiling, not airtight…Homeowner was not aware that the addition was lacking insulation in the floor and was very surprised to hear that.”
Insulation levels
HUD data plate information
The federal HUD code requires that manufacturers meet minimal regional requirements for insulation levels, and further requires units to be labeled for the thermal zone for which they were designed and with the insulation levels for various components of the structure (Figure 18). We were able to locate the data plate showing the thermal zone information for 59 of the 73 site-visit homes that were built after the 1976 adoption of the HUD code (81%): only two were labeled for zones other than the one that includes Minnesota (Figure 19 shows one of these).
Figure 18. HUD thermal zone map.

Minnesota Manufactured Homes Survey COMM- 087861 | October 20, 2016 Seventhwave 45 | P a g e
Figure 19. One of two homes in the study carrying a data plate indicating that it is meant to be located in a warmer climate zone.
Insulation levels from the HUD data plates were available for 56 homes. Ceiling R-values ranged from 10 to 44, and are noticeably higher for homes built after about 1995 (Figure 20).17
Figure 20. HUD-plate listed insulation levels, by year built.
17 The HUD data plate actually lists U-values, which are the inverse of the R-values presented here.
0
10
20
30
40
50
0
10
20
30
40
50
1980 1990 2000 2010 1980 1990 2000 2010
1980 1990 2000 2010
Ceiling Walls
Floor
HU
D P
late
R-v
alue
*
Year built
*inverse of listed U-value

Minnesota Manufactured Homes Survey COMM- 087861 | October 20, 2016 Seventhwave 46 | P a g e
Listed wall and floor insulation levels ranged from about R-7 to R-22. The average manufactured home built to HUD code is listed as having R-20 ceilings, R-15 walls and R-12 floors (Table 29).
Table 29. Mean insulation levels from HUD data-plate values, by building component.
(site-visit data) Overall In MH Park
Not in MH park
Low-income
household
Non low-income household
Ceiling 20.3 17.0 25.1 19.3 21.1
Walls 15.3 14.2 16.7 15.1 15.5
Floor 12.0 12.3 11.8 11.4 12.6
Values shown are the inverse of mean listed U-values.
Insulation levels among all of the manufactured homes we visited (not just those subject to HUD code) varied over a somewhat wider range—though our ability to directly observe insulation was limited in many cases (Table 30).18 Wall insulation R-values ranged from 3.5 to 19 with a median of R-15.75, and ceiling R-values varied from 7 to 49 with a median of R-22. Ceiling R-values above 36 were found almost exclusively in non-park manufactured homes. Belly insulation values, with the exception of one home that had no observable belly insulation, ranged from 7 to 32 with a median of 12.25. Insulation of wings (the floor area outside the main beams of the home, closest to exterior walls) was the same or very nearly the same as belly insulation in all cases.
Table 30. Envelope insulation R-values for manufactured homes, not including additions.
(site-visit data) Overall In MH Park
Not in MH park
Low-income
household
Non low-income household
Wall insulation R-value 3.5 to 6.9 6% 4% 8% 0% 11%
7.0 to 8.9 13% 10% 17% 26% 3%
9.0 to 11.9 6% 11% 0% 5% 6%
12.0 to 15.9 22% 19% 26% 31% 15%
16.0 to 18.9 30% 20% 42% 26% 34%
19.0 to 19.25 23% 36% 7% 13% 32%
18 We were able to directly observe ceiling insulation levels in fewer than one in five homes (and wall insulation in about one in four homes); as a result, most values reported here are based on HUD data plate and owner information

Minnesota Manufactured Homes Survey COMM- 087861 | October 20, 2016 Seventhwave 47 | P a g e
(site-visit data) Overall In MH Park
Not in MH park
Low-income
household
Non low-income household
Ceiling insulation R-value 7.0 to 10.9 13% 22% 5% 13% 14%
11.0 to 17.9 19% 21% 17% 21% 17%
18.0 to 24.9 28% 34% 21% 31% 25%
25.0 to 35.9 21% 21% 22% 22% 21%
36+ 18% 3% 35% 14% 23%
Belly insulation R-value
0 3% 5% 0% 0% 6%
> 0 to 6.9 0% 0% 0% 0% 0%
7.0 to 8.9 20% 13% 32% 29% 14%
9.0 to 12.9 52% 61% 37% 45% 56%
13.0 to 18.9 12% 10% 15% 8% 15%
19.0 to 24.9 10% 10% 11% 11% 10%
25+ 3% 1% 6% 6% 0%
We found some mistakes in retrofit insulation application; for example, placement of 2 inches of rigid foam on a replacement roof, but with the original ventilation of the area below the roof deck left intact, thus reducing the thermal benefits of the foam. Similarly, in one of the cases of a structural roof and walls placed over the original home, air movement behind the added wall sections degraded the effectiveness of added insulation. We also noted insulation inconsistencies in a number of cases, e.g. "Cellulose insulation varies in depth could be as much as 8 inches in some places and almost nothing in others."
The insulation levels of heated additions varied, but there appear to be higher levels of wall insulation, and lower levels of floor insulation, than typical in the original manufactured homes (Table 31). The ten cases in which no floor insulation was found include the two basement and three slab floor systems, three crawl spaces, and two skirted floor systems.
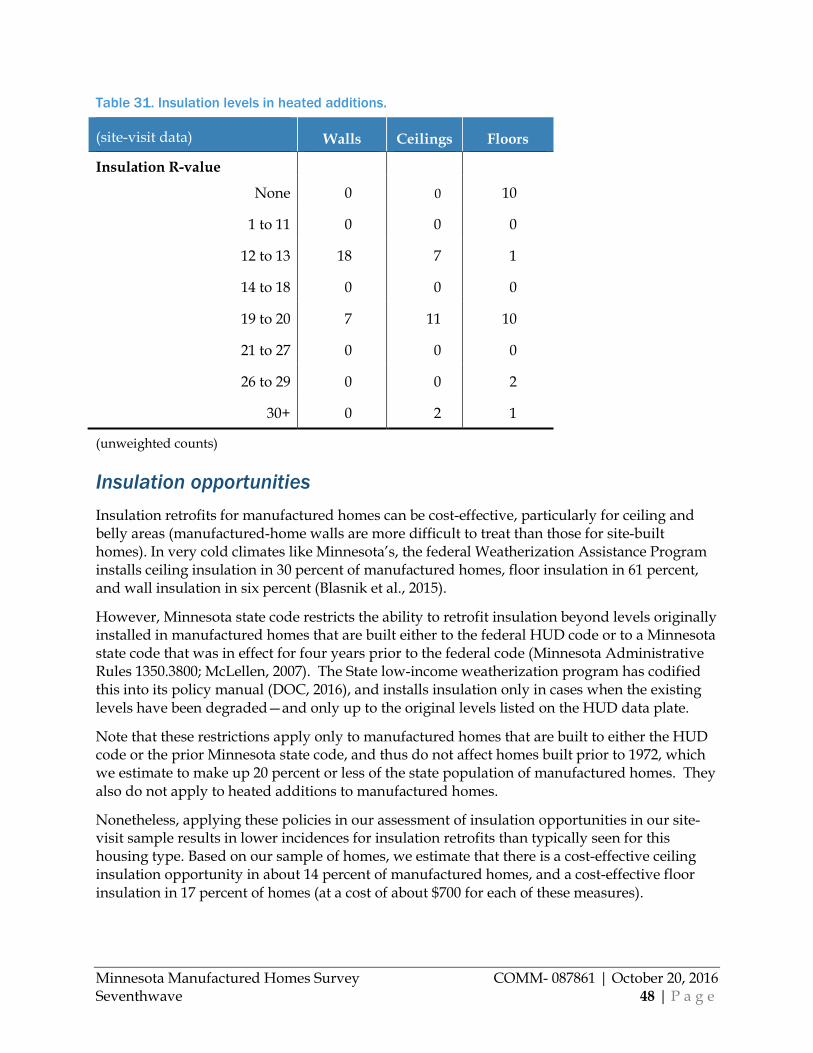
Minnesota Manufactured Homes Survey COMM- 087861 | October 20, 2016 Seventhwave 48 | P a g e
Table 31. Insulation levels in heated additions.
(site-visit data) Walls Ceilings Floors
Insulation R-value
None 0 0 10
1 to 11 0 0 0
12 to 13 18 7 1
14 to 18 0 0 0
19 to 20 7 11 10
21 to 27 0 0 0
26 to 29 0 0 2
30+ 0 2 1
(unweighted counts)
Insulation opportunities Insulation retrofits for manufactured homes can be cost-effective, particularly for ceiling and belly areas (manufactured-home walls are more difficult to treat than those for site-built homes). In very cold climates like Minnesota’s, the federal Weatherization Assistance Program installs ceiling insulation in 30 percent of manufactured homes, floor insulation in 61 percent, and wall insulation in six percent (Blasnik et al., 2015).
However, Minnesota state code restricts the ability to retrofit insulation beyond levels originally installed in manufactured homes that are built either to the federal HUD code or to a Minnesota state code that was in effect for four years prior to the federal code (Minnesota Administrative Rules 1350.3800; McLellen, 2007). The State low-income weatherization program has codified this into its policy manual (DOC, 2016), and installs insulation only in cases when the existing levels have been degraded—and only up to the original levels listed on the HUD data plate.
Note that these restrictions apply only to manufactured homes that are built to either the HUD code or the prior Minnesota state code, and thus do not affect homes built prior to 1972, which we estimate to make up 20 percent or less of the state population of manufactured homes. They also do not apply to heated additions to manufactured homes.
Nonetheless, applying these policies in our assessment of insulation opportunities in our site-visit sample results in lower incidences for insulation retrofits than typically seen for this housing type. Based on our sample of homes, we estimate that there is a cost-effective ceiling insulation opportunity in about 14 percent of manufactured homes, and a cost-effective floor insulation in 17 percent of homes (at a cost of about $700 for each of these measures).

Minnesota Manufactured Homes Survey COMM- 087861 | October 20, 2016 Seventhwave 49 | P a g e
Windows and doors We found an average of 2.1 doors per home (including additions) in our site inspections, with insulated steel doors being most common. A majority of doors had storm doors installed, and most were adequately weather-stripped (Table 32). A majority of doors (69%) included some glazing. Where present, the average glazed area was 3.5 square feet.
Table 32. Door types and characteristics. Includes additions.
(site-visit data) Overall In MH Park
Not in MH park
Low-income
household
Non low-income household
Door type insulated steel 90% 91% 89% 94% 87%
solid core 5% 6% 4% 4% 5%
hollow core 5% 4% 7% 2% 8%
Storm door present? No 44% 44% 43% 43% 44%
Yes 56% 56% 57% 57% 56%
Door needs weather-stripping?
No 72% 84% 59% 70% 74%
Yes 28% 16% 41% 30% 26%
We observed the type of glazing and measured the window area in each home inspected (Table 33). Double pane windows with no additional storm window is the most common glazing type, followed by single pane windows with an added storm. Total window area is substantially greater among manufactured homes in non-park settings as compared to those in parks, with double pane window area accounting for most of the difference. This is likely due to the fact that non-park manufactured homes are more likely to have additions. Double pane, no-storm glazing is also present in larger amounts in non-low income than in low-income homes, though the overall difference in glazing area is modest.

Minnesota Manufactured Homes Survey COMM- 087861 | October 20, 2016 Seventhwave 50 | P a g e
Table 33. Window type and area (including additions).
(site-visit data) Overall In MH Park
Not in MH park
Low-income
household
Non low-income household
Window glazing type (% of total glazing area)
Single-pane, no storm 3% 2% 4% 4% 1%
Single-pane, with storm 36% 40% 32% 45% 23%
Double-pane, no storm 57% 50% 63% 48% 69%
Double-pane, with storm 4% 8% 1% 2% 7%
Mean total area per home (ft2) 126 113 142 121 135
We evaluated savings opportunities for replacement doors and windows—as well as for adding storm windows. Our analysis showed these measures to not be cost-effective except in rare cases.
Air Leakage We measured air leakage using standard blower-door techniques for 95 of the 99 homes in the on-site study. Air leakage is typically expressed in cubic feet per minute (cfm) at a depressurization level of 50 Pascals (CFM50), and also—when combined with information on volume of the home—as air changes per hour at 50 Pascals (ACH50).
Measured air leakage ranged from 4 to 49 ACH50, with a mean value of 12.9 (Table 34). Non-park homes and homes occupied by low-income households tend to be leakier than those in parks or occupied by non-low-income households. This is likely because the manufactured homes for these sub-groups tend to be older, which are much more likely to be leaky (Table 35)
Table 34. Blower-door measured air leakage.
(site-visit data) Overall In MH Park
Not in MH park
Low-income
household
Non low-income household
Mean air leakage CFM50 1,723 1,478 2,036 2,196 1,354
ACH50 12.9 12.0 14.1 15.5 10.9

Minnesota Manufactured Homes Survey COMM- 087861 | October 20, 2016 Seventhwave 51 | P a g e
(site-visit data) Overall In MH Park
Not in MH park
Low-income
household
Non low-income household
Leakage category (ACH50)
<5 4% 0% 9% 0% 7%
5-9 36% 34% 38% 30% 40%
10-14 33% 44% 19% 31% 35%
15-19 16% 13% 20% 25% 9%
20+ 11% 9% 15% 15% 9%
Table 35. Air leakage by home vintage.
Home vintage Mean air changes per hour @ 50 Pa
pre 1976 20.6
1976-1989 12.2
1990s 9.7
2000+ 6.3
Opportunities for air sealing in manufactured homes typically include electrical and plumbing penetrations (Figure 21), as well as the marriage joint for the halves of double-wide units (Figure 22).
Based on achieved air-leakage reductions for manufactured homes treated by Midwestern low-income weatherization programs, we estimate that there is technical potential for air sealing savings in more than 95 percent of Minnesota manufactured homes, and cost-effective savings for about a third of homes. Where cost effective, air sealing is expected to save about 30 therms per year in homes that heat with natural gas (about 45 gallons per year for propane homes), at a cost of about $500 per home.

Minnesota Manufactured Homes Survey COMM- 087861 | October 20, 2016 Seventhwave 52 | P a g e
Figure 21. Evidence of air sealing of electrical penetrations by local weatherization agency in a site-visit home.
Figure 22. Significant air leakage at the marriage joint of the two halves of this double-wide manufactured home is evident in the cold (dark) areas in an infrared photo.

Minnesota Manufactured Homes Survey COMM- 087861 | October 20, 2016 Seventhwave 53 | P a g e
Heating systems Natural gas is the primary heating fuel in the majority of Minnesota manufactured homes, including 89% of homes in parks, while propane is the most common fuel for non-park homes (Table 36). Fuel oil and wood are found primarily in non-park homes, but are relatively uncommon. Electrically-heated homes appear to be rare in general among manufactured homes.
Table 36. Primary heating fuel, heating system type, and thermostat type.
(telephone-survey data) Overall In MH Park
Not in MH park
Low-income
household
Non low-income household
Primary heating fuel
natural gas 59% 91% 24% 58% 60%
propane 30% 7% 56% 31% 29%
electricity 3% 2% 4% 4% 2%
fuel oil 4% 0% 8% 3% 4%
wood 4% 0% 9% 4% 5%
Primary heating system type
central furnace with ducts 97% 99% 95% 96% 98%
wall or floor heater without ducts 0% 0% 0% 1% 0%
free-standing heater or stove 2% 1% 3% 2% 2%
boiler 1% 0% 1% 1% 1%
electric baseboard <1% 0% <1% <1% 0%
Thermostat type
No thermostat 0% 0% 1% 1% 0%
Manual-style thermostat 57% 54% 60% 61% 54%
Digital programmable thermostat 43% 46% 39% 38% 46%
The vast majority of manufactured homes use ducted, forced air furnaces as the primary heating system. Free-standing heaters, most of which are wood stoves, accounted for two percent of the primary heating systems reported. Several boilers were reported by survey respondents; all were wood-fired. A single case of electric baseboard heating used for primary heating was reported, but no heat pumps appeared in survey results. Site visit data are consistent with survey data in terms of fuel use and system types. All but two of the homes we

Minnesota Manufactured Homes Survey COMM- 087861 | October 20, 2016 Seventhwave 54 | P a g e
visited used forced-air central heating systems; the remaining two homes used outdoor wood boilers. The primary heating system was functional in all homes visited.
The majority of thermostats used to control primary heating system are manual rather than programmable.
Table 37. Primary heating system characteristics.
(site-visit data) Overall In MH Park
Not in MH park
Low-income
household
Non low-income household
Age of equipment (years)
<6 16% 13% 20% 27% 8%
6 to 10 18% 22% 13% 10% 25%
11 to 15 31% 28% 35% 23% 37%
16 to 20 18% 17% 19% 20% 16%
21 to 25 4% 3% 5% 9% 0%
26 to 30 7% 7% 8% 6% 9%
31+ 6% 10% 0% 6% 6%
High-efficiency (condensing) system?
No 80% 90% 64% 73% 86%
Yes 20% 10% 36% 27% 14%
Input firing rate (kBtuh)
50 to 69 24% 24% 23% 18% 28%
70 to 79 55% 65% 41% 58% 52%
80+ 22% 12% 36% 24% 20%
Estimated percent of heating load delivered by primary system
92% 96% 87% 94% 90%
More detailed information about primary heating systems was obtained from our site visits (Table 37). The majority of primary heating systems are less than 20 years old, but some are quite old, are likely the original equipment that came with the home. Condensing efficiency furnaces make up only about a fifth of heating systems, but are more common in non-park homes.

Minnesota Manufactured Homes Survey COMM- 087861 | October 20, 2016 Seventhwave 55 | P a g e
Heating system filters Fiber mesh filters are the most common type found in Minnesota manufactured homes, followed by pleated media filters that are typically more efficient at removing small particulate matter (Table 38). Only one home in the site-visit sample had an electronic air cleaner. Regular filter replacement can limit the pressure drop of airflow through forced air heating systems: most survey respondents said they replace filters more than once a year. We assessed the condition of air filters during our on-site visits; only a small number were found to be in poor or very poor condition. One home had no filter in place.
Table 38. Filters in forced-air systems.
Overall In MH Park
Not in MH park
Low-income
household
Non low-income household
Filter type (site-visit data)
Mesh 66% 67% 63% 74% 59%
Pleated 34% 32% 37% 25% 41%
Electronic 0% 1% 0% 1% 0%
Filter replacement frequency (telephone survey data)
more often than monthly 1% 1% 1% 1% 1%
about monthly 24% 24% 23% 23% 24%
every couple of months 36% 36% 37% 41% 33%
a few times a year 26% 26% 26% 24% 28%
annually 9% 8% 9% 8% 10%
less than annually 2% 2% 1% 1% 2%
by some other schedule 1% 1% 1% 2% 1%
never 2% 2% 2% 1% 2%
Filter condition, as-found (site-visit data)
new or good 46% 54% 36% 47% 46%
fair 43% 36% 53% 34% 50%
poor or very poor 10% 10% 10% 19% 4%

Minnesota Manufactured Homes Survey COMM- 087861 | October 20, 2016 Seventhwave 56 | P a g e
Supplemental heating sources While 28 percent of survey respondents said they use an additional supplemental heat source in their home, we found a much higher proportion (60%) among site-visit homes where we examined the issue more closely. We focus here on the on-site data.
Households whose home is not in a manufactured-home park are about three times as likely to use a supplemental heating source as those located in a park (Table 39). By far, the most prevalent form of supplemental heating is portable electric space heaters, which are used in about 30 percent of park homes and more than half of non-park homes. Nearly half of all homes use some form of electric supplemental heat (only one home in the site-visit sample is primarily heated with electricity).
Table 39. Supplemental heating sources used in home.
(site-visit data) Overall In MH Park
Not in MH park
Low-income
household
Non low-income household
None 40% 57% 18% 52% 31%
Portable electric space heater 39% 29% 52% 42% 37%
Fireplace, electric 10% 8% 13% 4% 15%
Fireplace, wood 4% 7% 0% 2% 5%
Fireplace, gas or propane 3% 0% 7% 0% 6%
Space heater, gas or propane 8% 6% 10% 1% 13%
Wood stove 4% 0% 8% 2% 5%
Forced-air furnace, gas or propane
6% 0% 13% 0% 10%
Electric baseboard 2% 1% 3% 2% 3%
Outdoor wood boiler 1% 0% 2% 2% 0%
Oven, electric 1% 0% 2% 2% 0%
Oven, gas or propane <1% 1% 0% 1% 0%
Any electric source 49% 37% 64% 46% 52%
Any wood source 8% 7% 10% 6% 10%
(Columns may total to more than 100%, because some households use more than one source.)

Minnesota Manufactured Homes Survey COMM- 087861 | October 20, 2016 Seventhwave 57 | P a g e
Energy-saving opportunities related to heating systems We evaluated several space-heating related measures for the site-visit sample: upgrading the existing furnace to a high-efficiency, condensing model, practicing regular thermostat setback in the winter, and eliminating the use of portable space heaters.
For heating system replacement, at current natural gas and propane fuel prices, the payback from early replacement of a working natural-gas or propane furnace with a high-efficiency model can be long.19 However, eventually all furnaces need to be replaced, and the payback period from upgrading from a standard efficiency to a high-efficiency new unit at time of failure is a reasonable five to ten years. The site-visit data suggest that about six in ten manufactured homes have an older furnace that would be a good candidate for upgrading at time of failure.
In terms of thermostat management, as documented earlier in this report (see page 23), a significant fraction of households in manufactured homes currently do not practice thermostat setback, either manually or via a programmable thermostat. We judged that about seven in ten households could save on their heating bills by regularly setting the thermostat back by at least 5 degrees nightly, with an average savings of about $30 per year on heating costs.
Finally, our data suggest that a substantial proportion of households living in manufactured homes regularly use portable space heaters, with an estimated average annual consumption of about 3,000 kWh. Eliminating these space heaters could save an average of nearly $300 per year—after accounting for increased consumption by the home’s primary heating system.
However, it is unlikely that a simple campaign to persuade people to stop using space heaters would be effective: while some households use space heaters in the (generally mistaken) belief that it is a less-expensive way to heat their home, for most, electric space heaters are used to solve localized comfort issues. For manufactured homes, such comfort issues can readily arise from leaking or disconnected ductwork and damaged bellies. Indeed, while we found no statistically significant correlation between space-heater use and numerical measures of air and duct leakage, our data do indicate that space-heater use is nearly twice as prevalent among households in manufactured homes with bellies that we judged to be in “poor” or “very poor” condition. Additionally, our data also indicate higher levels of discomfort in those homes where space heater opportunities were identified. Solving these underlying issues as part of a more comprehensive treatment is likely a pre-requisite for mitigating space-heater use.
Cooling systems Nearly all manufactured homes have some form of air conditioning systems (Table 40). Where air conditioning is present, central cooling systems are the most prevalent, and according to our survey results, are more common in non-low-income households, while room air conditioners (window or wall units) are substantially more common in low-income homes.
19At current fuel prices, estimated natural gas and propane savings average about $65 and $120 per year in our site-visit sample. Replacing a furnace in a manufactured home typically costs between $2,000 and $2,500.

Minnesota Manufactured Homes Survey COMM- 087861 | October 20, 2016 Seventhwave 58 | P a g e
Table 40. Cooling equipment types.
(telephone-survey data) Overall In MH Park
Not in MH park
Low-income
household
Non low-income household
Does home have air conditioning?
yes 90% 93% 85% 86% 92%
no 10% 7% 15% 14% 8%
Type
Central 72% 75% 68% 57% 82%
Room 27% 24% 30% 42% 16%
Both 1% 1% 2% 1% 1%
Among the sit-visit homes where we were able to collect more detailed data, the vast majority are split-systems with a capacity of 2 or 2.5 tons. (Table 41). Age of cooling equipment varies widely, but most of the systems greater than 20 years old are found in manufactured home parks. We encountered only one high-efficiency unit (which was a SEER-16 system) among the homes in the site-visit sample. About eight percent of the central systems among the site-visit homes were non-functional at the time of the site visit.
Table 41. Characteristics of central air conditioners.
(site-visit data) Overall In MH Park
Not in MH park
Low-income
household
Non low-income household
Type
Split 92% 87% 100% 90% 93%
Package 8% 13% 0% 10% 7%
Cooling capacity
1.5 tons 1% 2% 0% 3% 0%
2.0 tons 31% 27% 37% 48% 23%
2.5 tons 59% 55% 63% 40% 67%
3.0 tons 9% 16% 0% 9% 9%

Minnesota Manufactured Homes Survey COMM- 087861 | October 20, 2016 Seventhwave 59 | P a g e
(site-visit data) Overall In MH Park
Not in MH park
Low-income
household
Non low-income household
Age (years)
<6 18% 23% 12% 16% 20%
6 to 10 5% 9% 0% 15% 0%
11 to 15 40% 24% 60% 31% 45%
16 to 20 18% 18% 19% 23% 16%
21 to 25 13% 22% 0% 6% 16%
26-30 4% 3% 6% 5% 4%
31+ 2% 1% 3% 5% 0%
Seasonal Energy Efficiency Ratio (SEER)
<10 12% 15% 9% 14% 11%
10-12 49% 48% 51% 45% 52%
13 38% 37% 38% 39% 37%
14+ 1% 0% 2% 2% 0%
The majority of households with a room air conditioner have only a single unit, but about one in three has multiple units (Table 42). None of the room air conditioners that we encountered met the current qualification criteria for ENERGY STAR, which is an energy efficiency ratio of about 12.1 or higher.
Table 42. Characteristics of room air conditioners.
(site-visit data) Overall In MH Park
Not in MH park
Low-income household
Non low-income household
Number of units in home
1 68% 58% 77% 69% 66%
2 29% 37% 23% 26% 34%
3 3% 5% 0% 4% 0%

Minnesota Manufactured Homes Survey COMM- 087861 | October 20, 2016 Seventhwave 60 | P a g e
(site-visit data) Overall In MH Park
Not in MH park
Low-income household
Non low-income household
Cooling capacity (Btuh)
5,000 to 5,999 24% 23% 26% 18% 34%
6,000 to 9,999 51% 43% 60% 61% 36%
10,000 to 11,999 19% 29% 8% 12% 30%
12,000+ 5% 4% 7% 9% 0%
Age
2014+ 23% 14% 33% 17% 30%
2000-2013 54% 67% 39% 53% 55%
1990-1999 9% 5% 13% 15% 0%
1989 or older 15% 14% 15% 15% 14%
Energy Efficiency Ratio (EER)
8.0 to 8.99 8% 12% 0% 0% 14%
9.0 to 9.99 58% 64% 48% 41% 74%
10.0 to 10.99 19% 18% 20% 41% 0%
11.0 to 11.99 15% 5% 32% 18% 12%
Duct leakage Duct leakage is a common issue for manufactured homes, and—since the home’s ductwork is nearly always located under the floors in the unconditioned belly area of the home—sealing these leaks can provide not only energy savings, but comfort improvements as well. The typical manufactured home has a down-flow furnace in a utility closet that delivers heated (or cooled) air through the flooring to a plenum that runs the length of the home, with multiple take-offs for room supply registers. Double-wide manufactured homes have a plenum for each side and a cross-over duct that joins the two. Common supply leakage sites include the joints where the furnace connects through the flooring to the plenum, leaks—and sometimes even complete disconnects—at the boots for supply registers, leakage at the ends of the plenum runs, and leakage issues with cross-over ducting (Figure 23). Few manufactured homes have return-air ductwork: typically, air is returned through louvres in the utility-closet door where the air handler is located.

Minnesota Manufactured Homes Survey COMM- 087861 | October 20, 2016 Seventhwave 61 | P a g e
Figure 23. Example of duct leaks.
We measured duct leakage for this study in three ways:
Duct pressurization – supply registers are sealed, and a specialized fan is used to measure leakage at a standard pressure (25 Pascals) for measurement of total duct leakage. In addition, a blower door is used to pressurize the home to the same level as the duct work in order to eliminate the contribution of leaks that are to the inside of the home, leaving a measure of duct leakage to the outside (TEC, 2012).
Delta Q – blower door measurements are taken at a variety of pressurization and depressurization levels with and without the air handler operating. Calculations are then used to estimate duct leakage levels under actual operating conditions (Walker et al., 2001).
Pressure-pan measurements – the home is depressurized to 50 Pascals, and a measurement of the pressure difference across each (temporarily-sealed) supply register is taken. Large pressure differences provide qualitative evidence of duct leakage.
Each of these methods has strengths and weaknesses. Duct pressurization tests are highly repeatable, but measure duct leakage at an artificial pressure that may not reflect actual operating conditions. Delta Q provides a measure of duct leakage under actual operating conditions, but can be subject to considerable uncertainty under windy conditions. Pressure-pan measurements do not directly quantify duct leakage levels, but do provide useful indicators of duct leakage and leakage locations.
We were able to make duct-pressurization and pressure-pan measurements for 88 sites, and Delta Q measurements for 42. Analysis of the relationship between Delta-Q and duct-pressurization measurements of supply leakage to outside suggests that, on average, supply leakage under actual operating conditions is about 72 percent of that measured by standard duct-pressurization methods. Duct-leakage values reported here are a mix of Delta Q measurements (where available, and where the uncertainty in this measurement was less than

Minnesota Manufactured Homes Survey COMM- 087861 | October 20, 2016 Seventhwave 62 | P a g e
75 cfm) and duct-pressurization measurements adjusted by the above 0.72 scaling factor. We also express duct leakage here as an estimated percent of system airflow (in heating mode).20
The results suggest that the typical manufactured-home duct system leaks about 10 percent of the heated supply air to the outside, with about one in four homes having a leakage rate of less than 5 percent and one in 10 leaking at 20 percent or more (Table 43). Newer manufactured homes (1990 and later) appear to have duct leakage that is about half that of older homes (Table 44).
Table 43. Duct leakage.
(site-visit data) Overall In MH Park
Not in MH park
Low-income
household
Non low-income household
Mean supply-duct leakage to outside
cfm 112 119 102 151 83
% of air-handler flowa 10% 11% 9% 13% 8%
Leakage category (% of air-handler flow)*
<5% 24% 17% 32% 11% 33%
5-9% 34% 35% 34% 33% 35%
10-14% 24% 29% 18% 23% 25%
15-19% 9% 10% 6% 17% 3%
20+% 9% 9% 9% 16% 5%
*Air-handler flow (heating-mode) estimated based on firing rate and efficiency of system, and an assumed temperature rise of 50F
Table 44. Duct leakage by home vintage (site-visit data).
Home vintage Mean estimated duct leakage to outside
(% of air handler flow)
pre 1976 12%
1976-1989 15%
1990s 8%
2000+ 6%
20 We estimated system airflow, based on the nameplate input firing rate and efficiency, with an assumed temperature rise of 50F.

Minnesota Manufactured Homes Survey COMM- 087861 | October 20, 2016 Seventhwave 63 | P a g e
Through a combination of diagnostic and sealing techniques, duct leakage can be substantially reduced in most manufactured homes. Based largely on Siegel and Davis (1998), we assume that duct leakage can be reduced by 80 percent on average. The site data from this study suggest that there is a cost-effective opportunity for duct sealing in about three of every four manufactured homes, with energy-cost savings that average about $50 per year. We estimate the typical cost for duct sealing at about $350 per home.
Water Heating Figure 24. Example of a water heater in an exterior closet.
The vast majority of water heaters in manufactured homes are conventional tank models. Electricity is the most common fuel for water heating, but natural gas fuels nearly half of water heaters in manufactured-home parks (Table 45). Most water heaters are located inside the home, but a minority are located in closets that are accessed from the exterior (Figure 24). These units tend to lose more heat, because they are located in a colder environment.
Measured hot water temperatures at the kitchen sink ranged from 90 to 160F, with an average of about 124F (Table 46). About one in five manufactured homes have a hot water temperature of 135F or higher, which is generally considered to pose a scalding hazard, especially for children. About one in four showerheads has a measure flow rate of 2 gallons per minute or more, as do about one in seven kitchen faucets (Table 46). Most lack a water heater blanket and pipe insulation (Table 47).
Table 45. Water heater characteristics.
Overall In MH Park
Not in MH park
Low-income
household
Non low-income household
Fuel (telephone-survey data)
Electricity 61% 52% 71% 57% 64%
Natural gas 28% 46% 9% 30% 27%
Propane 10% 3% 18% 11% 9%
Other 1% 0% 2% 1% 0%

Minnesota Manufactured Homes Survey COMM- 087861 | October 20, 2016 Seventhwave 64 | P a g e
Overall In MH Park
Not in MH park
Low-income
household
Non low-income household
Location (telephone-survey data)
Interior 90% 87% 93% 85% 93%
Exterior closet 10% 13% 7% 15% 7%
Tank capacity (gallons)
(site-visit data)
≤20 9% 10% 9% 0% 16%
30 31% 45% 11% 27% 34%
40 36% 31% 42% 46% 29%
50 22% 14% 35% 27% 19%
80 2% 0% 4% 0% 3%
Age (years) (site-visit data)
≤5 16% 13% 20% 27% 8%
6-10 18% 22% 13% 10% 25%
11-15 31% 28% 35% 23% 37%
16-20 18% 17% 19% 20% 16%
21+ 17% 20% 13% 21% 14%
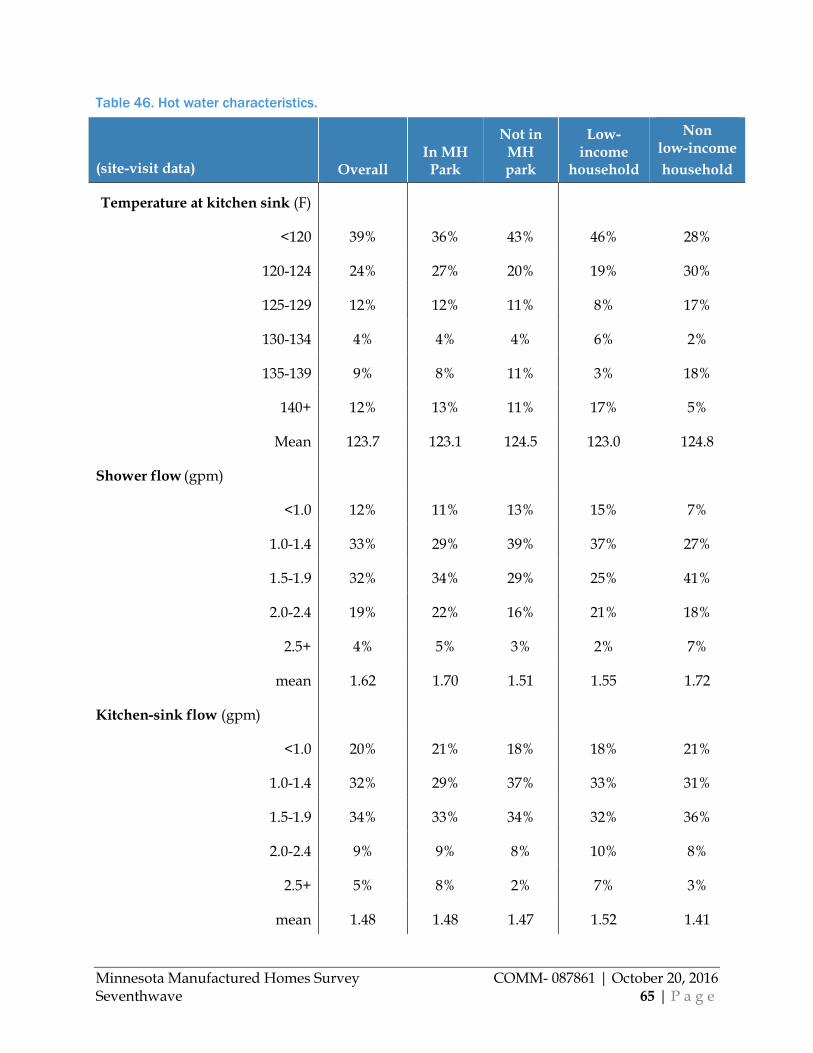
Minnesota Manufactured Homes Survey COMM- 087861 | October 20, 2016 Seventhwave 65 | P a g e
Table 46. Hot water characteristics.
(site-visit data) Overall In MH Park
Not in MH park
Low-income
household
Non low-income household
Temperature at kitchen sink (F)
<120 39% 36% 43% 46% 28%
120-124 24% 27% 20% 19% 30%
125-129 12% 12% 11% 8% 17%
130-134 4% 4% 4% 6% 2%
135-139 9% 8% 11% 3% 18%
140+ 12% 13% 11% 17% 5%
Mean 123.7 123.1 124.5 123.0 124.8
Shower flow (gpm)
<1.0 12% 11% 13% 15% 7%
1.0-1.4 33% 29% 39% 37% 27%
1.5-1.9 32% 34% 29% 25% 41%
2.0-2.4 19% 22% 16% 21% 18%
2.5+ 4% 5% 3% 2% 7%
mean 1.62 1.70 1.51 1.55 1.72
Kitchen-sink flow (gpm)
<1.0 20% 21% 18% 18% 21%
1.0-1.4 32% 29% 37% 33% 31%
1.5-1.9 34% 33% 34% 32% 36%
2.0-2.4 9% 9% 8% 10% 8%
2.5+ 5% 8% 2% 7% 3%
mean 1.48 1.48 1.47 1.52 1.41

Minnesota Manufactured Homes Survey COMM- 087861 | October 20, 2016 Seventhwave 66 | P a g e
Table 47. Water heater tank and pipe insulation.
(site-visit data) Overall In MH Park
Not in MH park
Low-income
household
Non low-income household
Water heater wrapped?
No 95% 98% 92% 91% 98%
Yes 5% 2% 8% 9% 2%
Pipe insulation present?
No 86% 84% 87% 87% 85%
Yes 14% 16% 13% 13% 15%
Water heaters in manufactured homes typically have venting arrangements that differ from site-built homes, and generally require units that are approved for manufactured homes. This limits the ability to install high-efficiency, power-vented water heaters that use natural gas or propane. On the electric side, heat-pump water heaters are often too large to fit in the limited space available in many manufactured homes. Given these restrictions, we did not consider water-heater efficiency upgrades in our analysis. We did, however, evaluate the applicability of low-flow showerheads, faucet aerators, water heater blankets (on electric water heaters), pipe insulation, and reducing the water-heater temperature set-point. Nearly all homes (96%) have an opportunity for at least one of these relatively low-cost measures, at an average cost—and annual savings—of about $50.
Lighting We made a comprehensive census of light bulbs during the site visits, classifying each bulb by type, wattage, and location in the home. The average manufactured home has about 35 bulbs (Table 48). Non-park homes tend to have more lighting, because they are also more likely to have additions and garages. Incandescent lighting makes up about 60 percent of the bulbs in manufactured homes, and represents more than 80 percent of the estimated electricity consumption for lighting.21
21 We estimated lighting energy consumption by applying room-based estimated daily average hours of use. See Appendix E.

Minnesota Manufactured Homes Survey COMM- 087861 | October 20, 2016 Seventhwave 67 | P a g e
Table 48. Mean bulbs per home, by room type (including additions and garages).
(site-visit data) Overall In MH Park
Not in MH park
Low-income
household
Non low-income household
Mean bulbs per home
Kitchen 5.4 6.0 4.7 4.8 5.8
Living, dining, and family 6.8 6.0 7.9 6.6 7.0
Entry or hallway 1.8 1.9 1.5 1.6 1.9
Master bedroom 3.5 3.4 3.5 3.5 3.5
Other bedroom 4.5 3.6 5.7 4.5 4.5
Bathroom 5.7 5.7 5.8 5.2 6.1
Laundry, utility or basement 0.9 0.8 1.0 1.0 0.8
Closet 0.1 0.1 0.0 0.1 0.1
Garage 3.1 0.1 6.8 2.5 3.6
Outdoor 3.0 2.7 3.4 3.0 3.1
Other 0.6 0.3 1.0 0.2 0.9
Total 35.5 30.6 41.4 33.0 37.3
(Averages are over all homes, including homes that do not have a given room type.)
Table 49. Percent of bulbs and estimated lighting electricity consumption, by bulb type.
(site-visit data) Overall In MH Park
Not in MH park
Low-income
household
Non low-income household
Percent of bulbs
Incandescent 63% 60% 66% 65% 62%
CFL 24% 27% 21% 28% 21%
Linear fluorescent 6% 4% 9% 5% 7%
LED 6% 9% 4% 2% 9%

Minnesota Manufactured Homes Survey COMM- 087861 | October 20, 2016 Seventhwave 68 | P a g e
(site-visit data) Overall In MH Park
Not in MH park
Low-income
household
Non low-income household
Percent of estimated lighting electricity use
Incandescent 84% 83% 84% 85% 82%
CFL 9% 11% 7% 10% 8%
Linear fluorescent 6% 3% 7% 4% 7%
LED 2% 3% 1% 1% 3%
(Averages are over all homes, including homes that do not have a given room type.)
While new federal standards governing lighting will not doubt whittle away at the proportion of lighting that is still incandescent-based in manufactured homes, utility CIPs can accelerate this process. We estimated the savings potential for replacing all incandescent bulbs with LED technology, assuming this will yield a 75 percent reduction in power draw. Based on the site-visit data, 96 percent of manufactured homes have at least one incandescent bulb in the home; these homes could save an average of about 675 kWh per year if all incandescents were converted to LED—a savings of about $85 per year (when the secondary impact on space-heating cost is factored in), at a cost of about $230 per home.
We also looked at opportunities for controlling outdoor lighting that is left on 24/7 with the use of photocells or timers. About one in five homes has an opportunity in this regard, at an average savings of about $15 per year.
Table 50. Installed lighting wattage, bulbs and estimated energy use. Includes additions.
(site-visit data) Overall In MH Park
Not in MH park
Low-income
household
Non low-income household
Installed lighting (mean per home)
Total connected wattage 1,468 1,154 1,842 1,299 1,728
Total number of bulbs 35 30 40 31 41
Estimated total lighting kwh 1,066 809 1,372 943 1,255

Minnesota Manufactured Homes Survey COMM- 087861 | October 20, 2016 Seventhwave 69 | P a g e
Appliances and electronics
Refrigerators and freezers The majority of refrigerators in manufactured homes are top-freezer type refrigerators with automatic defrosting capabilities (Table 51). Side-by-side refrigerators or bottom-freezer refrigerators comprise of a smaller portion of refrigerators. Two thirds of all primary refrigerators are between 6 and 15 years old and a third are older than 15 years, suggesting that there is significant opportunity for upgrades to newer and more efficient models.
Nearly a third of manufactured homes have at least one supplemental refrigerator, though half of these are compact units (Table 52). Well over half of homes have one or more supplemental, stand-alone freezers (Table 53).
We flagged homes as having an opportunity for upgrading their primary refrigerator or a stand-alone freezer to ENERGY STAR equivalent if the existing unit was at least 10 years old. We also flagged removal opportunities for secondary refrigerators and freezers that were plugged in but noted as being largely empty at the time of the site visit. About two-thirds of homes show an opportunity for upgrading the primary refrigerator on replacement, and 40 percent show a freezer upgrade opportunity. Our data suggest that only about 10 percent of homes have a refrigerator or freezer removal opportunity–though our classification of this opportunity depended on observing an empty or nearly-empty unit that was plugged in, which was not always possible.
Table 51. Characteristics of primary refrigerators.
(site-visit data) Overall In MH Park
Not in MH park
Low-income
household
Non low-income household
Type Top freezer 61% 55% 69% 72% 53%
Side by side 21% 24% 16% 19% 22%
Bottom freezer 17% 20% 13% 6% 25%
French door 0% 1% 0% 1% 0%
Compact refrigerator 1% 0% 2% 2% 0%
Age 2011 and newer 19% 18% 19% 24% 15%
2001-2010 48% 47% 50% 36% 58%
1991-2000 23% 27% 17% 35% 14%
Older than 1991 10% 7% 14% 5% 14%

Minnesota Manufactured Homes Survey COMM- 087861 | October 20, 2016 Seventhwave 70 | P a g e
(site-visit data) Overall In MH Park
Not in MH park
Low-income
household
Non low-income household
Defrost Auto 91% 90% 91% 94% 88%
manual 9% 10% 9% 6% 12%
Table 52. Number and type of secondary refrigerators.
(site-visit data) Overall In MH Park
Not in MH park
Low-income
household
Non low-income household
Number of units in home 0 68% 80% 53% 64% 71%
1 29% 20% 40% 33% 26%
2 3% 0% 7% 3% 3%
Type Top freezer refrigerator 50% 25% 61% 60% 41%
Compact refrigerator 50% 75% 39% 40% 59%
Table 53. Number and type of freezers.
(site-visit data) Overall In MH Park
Not in MH park
Low-income
household
Non low-income household
Number of units in home 0 40% 50% 27% 34% 44%
1 48% 48% 48% 45% 50%
2 8% 2% 16% 12% 6%
3 4% 0% 9% 9% 0%
Type Chest freezer 87% 85% 88% 88% 86%
Upright freezer 13% 15% 12% 12% 14%

Minnesota Manufactured Homes Survey COMM- 087861 | October 20, 2016 Seventhwave 71 | P a g e
Humidifiers and dehumidifiers Humidifiers may be used in some homes to increase indoor humidity levels in winter months when outdoor air contains very little moisture. Roughly four in ten households have one or more humidifiers, most of which are used frequently (Table 54). Air sealing to reduce the infiltration rate of dry outdoor air in the winter can help mitigate the need for mechanical humidification.
Dehumidifiers, on the other hand, are relatively uncommon in manufactured homes. We identified a behavioral opportunity to reduce dehumidifier use in a small number of households where they are used frequently.
Table 54. Humidifier and dehumidifier presence and use.
(site-visit data) Overall In MH Park
Not in MH park
Low-income
household
Non low-income household
Number of humidifiers present
0 61% 64% 56% 57% 63%
1 38% 35% 43% 40% 37%
2 1% 1% 1% 3% 0%
Humidifier frequency of use
never 1% 2% 0% 2% 0%
rarely 1% 3% 0% 4% 0%
occasionally 13% 16% 10% 8% 17%
frequently 84% 79% 90% 86% 83%
Percent of homes with a dehumidifier 12% 6% 19% 7% 15%
Dehumidifier frequency of use
never 12% 20% 9% 31% 0%
rarely 21% 7% 27% 25% 18%
frequently 67% 73% 64% 44% 82%

Minnesota Manufactured Homes Survey COMM- 087861 | October 20, 2016 Seventhwave 72 | P a g e
Electronics A prior monitoring study in Minnesota homes (not necessarily manufactured homes) showed that televisions and computers make up most of the energy consumption by electronics (Bensch et al., 2010).
Table 55. Televisions and peripherals.
(site-visit data) Overall In MH Park
Not in MH park
Low-income
household
Non low-income household
Television types (mean number per home)
Flat screen, very large (40+”) 0.4 0.4 0.4 0.4 0.4
Flat screen, large (31-39”) 0.9 0.5 1.4 0.5 1.2
Flat screen, medium (23-30”) 0.4 0.4 0.4 0.3 0.4
Flat screen, small (less than 23”) 0.3 0.4 0.2 0.2 0.3
CRT*, large (31+”) 0.0 0.1 0.0 0.0 0.1
CRT, medium (23-30”) 0.2 0.2 0.3 0.3 0.2
CRT, small (less than 23”) 0.3 0.2 0.4 0.3 0.2
Total televisions per home 2.1 2.2 2.1 2.1 2.2
Television peripherals (mean number per home)
DVD / VCR 1.5 1.4 1.5 1.3 1.6
Cable / satellite box 1.2 1.1 1.3 1.3 1.1
Gaming system 0.2 0.2 0.2 0.4 0.1
Number of peripherals for the most-used television 1.3 1.4 1.3 1.1 1.5
*Cathode-ray tube
Flat-screen televisions are more common than CRT televisions, and of these, the largest flat-screen televisions were the most common (Table 55). We asked participants in the site visits to identify their most used television; the two largest sized flat-screen televisions were more commonly pointed out. We also noted the quantity of peripheral plug loads typical of

Minnesota Manufactured Homes Survey COMM- 087861 | October 20, 2016 Seventhwave 73 | P a g e
televisions, such as DVD/VCR players, satellite or cable boxes, and gaming systems. We most commonly saw DVD/VCRs, with an average of 1.3 peripherals found on the most commonly used television.
During our site visits, we counted the number and type of computers in manufactured homes. As Table 56 shows, laptops and flat screen monitors are most prevalent in manufactured homes. We found that, on average, 12% of the desktop computers were left on all day, every day.
Table 56: Computers and monitors
(site-visit data) Overall In MH Park
Not in MH park
Low-income
household
Non low-income household
Computers (mean number per home)
Laptop 0.8 0.8 0.7 0.6 0.9
Desktop 0.6 0.5 0.6 0.5 0.6
Desktop left on 24/7 (% of desktops) 12% 16% 8% 11% 14%
Computer monitors (mean number per home)
Flat-screen monitor 0.5 0.6 0.4 0.4 0.6
CRT* monitor 0.2 0.2 0.2 0.2 0.2
*Cathode-ray tube We considered two measures for electronics: (a) use of advanced power strips to reduce electricity consumption by entertainment centers where an opportunity for this was flagged during the site visits; and, (b) implementing power management on computers that are left on continuously. Given the relatively small number of devices in this population, neither of these measures were common in our sample.
Plumbing heat tape Frozen plumbing pipes are a common issue for owners of manufactured homes: in the on-site interviews, nearly one in three households (31%) reported having had an issue with frozen pipes. While some households resort to drastic measures to prevent pipes from freezing (Figure 25), most employ electrical heat tape—and heat rods—to avoid frozen pipes.
Heat tape is an electric resistance heating element in the form of a flexible tape or rope, which is commonly strapped to or wrapped around exposed water piping (and sometimes drain piping) to prevent freezing (Figure 26). In addition, heat rods - rigid electrically-heated stakes - are sometimes used to prevent freezing in the soil around the water supply entry point.

Minnesota Manufactured Homes Survey COMM- 087861 | October 20, 2016 Seventhwave 74 | P a g e
Figure 25. Faucet left running in the winter to prevent frozen water lines.
Figure 26. Heat tape installed under pipe insulation.
We conducted a separate investigation of heat-tape and heat-rod energy consumption after the completion of the main round of site visits. This smaller survey included 19 manufactured homes, eight of which were part of the main on-site sample. Two of the homes had two separate heat-tape systems, and 15 also had a heat rod installed.
A wall switch is sometimes installed in mobile homes to allow convenient seasonal shutdown of heat tape, but we found such a switch in only two cases. Some owners reported the heat tape could be controlled by a circuit breaker, but we did not confirm that this was the only load on the breaker, which would be a prerequisite to making this a workable control solution. Thermostatic controllers also exist, but none of the systems that we examined had these.
In each home, we measured the operating wattage of each unit, and installed monitoring equipment to take snapshot readings of current draw and air temperature in the space under the home at 10-second intervals. We monitored 21 heat tape systems (including the second system in the two homes where present), and 11 heat rods. Monitoring was started in the second week of March, and continued to the third week of May 2016. Daily average temperatures at nearby weather stations ranged from 23 to 74 F over this period.
The heat tape at six sites, and heat rods at two sites, appeared non-functional, or operated below about 5 Watts (where our monitoring equipment becomes inaccurate). Heat tape at other sites showed widely varying average operating power, ranging from about 8 to 165 Watts, with heat rods coming in at around 7 to 9 Watts. Total power draw by site ranged from zero to 165 watts, with an average of about 45 watts (Figure 27). If operated year-round (as appears to be the case for most), this translates into a range of zero to 1,445 kWh with an average of 390 kWh. Although some of the systems showed variation in power draw over time, implying some type of control or load variation, none show evidence of active thermostatic control.

Minnesota Manufactured Homes Survey COMM- 087861 | October 20, 2016 Seventhwave 75 | P a g e
Two of the homeowners involved in the study stated that they turn off heat tape seasonally, and one other reported that park management controls the heaters seasonally. Others said the heaters operate year-round. Monitoring data confirms two cases in which heat tape was shut off during the course of our monitoring. In one of these cases, no switch was present, and control involved crawling under the home to turn off a power strip.
These systems appear to be a candidate for both maintenance and energy savings. Several of the systems investigated appear to be non-functional or operating at a very low power level—raising the question as to whether pipe heating is really necessary in many cases, or whether a very low power level is adequate to prevent freezing. On the other hand, some systems draw enough energy (up to 1,445 kWh annually in our sample, or about $175 in energy costs) to make improved control a reasonable energy-savings option.
Figure 27. Total heat-tape and heat-rod power draw, by site.
Limiting the operation of heat tape and heat rods to the heating season can reduce consumption by perhaps 50 percent or more as compared to year-round operation. This can be accomplished through manual switch control, or automatically through the use of a thermostatic control. Controls could be used selectively where heating system wattage is high, but applying them to all systems would eliminate the effort of measuring power consumption. The use of thermostatic control eliminates the need for owner attention to controlling the system, with the associated risks of either freezing if left off, or excess energy use if left operating.
Heat tape that responds to temperature with increased current flow as temperature decreases is also available, but we do not have a basis for estimating its energy use.
Finally, it should be noted that heat tape has been cited as a significant cause of fires in mobile homes, and safe installation and operation is important in reducing this risk (CPSC, 1990).
Connectedwatts
Annual kWh(year-roundoperation)
By site
0
500
1,000
1,500
0
50
100
150
200
Heat rod
Heat tape

Minnesota Manufactured Homes Survey COMM- 087861 | October 20, 2016 Seventhwave 76 | P a g e
Repair, health and safety issues Because many are occupied by households of limited means, manufactured homes can have significant repair, health and safety issues. These can represent impediments—or opportunities—for improving the energy efficiency of these homes.
Roof leaks are not uncommon among manufactured homes: nearly one in four households (22%) mentioned issues with roof leaks in the site-visit interviews and we judged one in ten roofs to be in poor or very poor condition. The site visits revealed evidence of damage to ceiling areas in a number of homes, including lost insulation (Figure 28, Figure 29 and Figure 30). While replacing or repairing leaking roofs is generally not within the purview of energy-efficiency programs, programs can address lasting insulation damage to ceiling areas after the leaks are fixed. Some homes also showed signs of damage to exterior walls, repair of which could also represent an energy-saving opportunity (Figure 31).
Figure 28. Deteriorated ceiling area. These are often due to water damage.

Minnesota Manufactured Homes Survey COMM- 087861 | October 20, 2016 Seventhwave 77 | P a g e
Figure 29. This manufactured home has standing water on its flat roof, and a large section of fallen ceiling.
Figure 30. Ceiling damage from roof leaks.

Minnesota Manufactured Homes Survey COMM- 087861 | October 20, 2016 Seventhwave 78 | P a g e
Figure 31. Example of deteriorated exterior.
Underneath manufactured homes, if tight skirting is not maintained, the belly areas of manufactured homes are prone to damage by animals, which find these spaces to be attractive places to shelter (Figure 32). As noted above, we judged about one in five manufactured home bellies to be in poor or very poor condition. Repairing these, and restoring proper insulation levels is a fairly common retrofit for manufactured homes.

Minnesota Manufactured Homes Survey COMM- 087861 | October 20, 2016 Seventhwave 79 | P a g e
Figure 32. Tight skirting is needed to keep animals out of the belly area, where they can otherwise do significant damage to insulation.
Moisture can also be a problem underneath manufactured homes from plumbing leaks or poor drainage. We looked for signs of moisture problems in the belly area in the form of damp materials or standing water: of 89 homes where observations were recorded, 55 were judged to have no moisture accumulation, 29 were damp, and five had standing water in the crawl space. Notable moisture-related observations in the belly area included the following:
• “Terrible shape: paper product absorbs moisture, creates mildew and deteriorates. Water leak at AC condensate. Cellulose blown in belly has created additional moisture absorption and has fallen through in some places.”
• “Very damp and even wet in some areas under belly. Belly cover is paper and is not in great shape due to moisture. In unconditioned back addition, insulation appears wet and in poor shape. In front addition insulation is gone.”
• “Excessive moisture has had a negative effect on the cardboard-like sheathing covering insulation in belly area.”
• “Belly covering was burned from propane heater under belly, likely [placed] to combat freezing pipes. Water heater leaking and making icicles under belly.”
• “Major flooding from water heater-leak, [which] saturated the belly insulation. Contractors tore everything out and redid insulation with many open spots. Could see the floor in one spot.”

Minnesota Manufactured Homes Survey COMM- 087861 | October 20, 2016 Seventhwave 80 | P a g e
Table 57. Kitchen and bath exhaust-fan presence and use.
(site-visit data) Overall In MH Park
Not in MH park
Low-income
household
Non low-income household
Kitchen exhaust fan present?
No 13% 16% 9% 17% 10%
Yes 87% 84% 91% 83% 90%
Kitchen exhaust-fan use
never 14% 12% 18% 14% 15%
rarely 38% 23% 54% 36% 39%
occasionally 22% 38% 5% 16% 26%
frequently 25% 27% 23% 34% 20%
Number of bath exhaust fans
0 15% 18% 11% 14% 16%
1 38% 39% 38% 51% 29%
2 44% 42% 46% 32% 53%
3 3% 1% 6% 3% 3%
Bath exhaust-fan use
never 7% 8% 5% 3% 9%
rarely 36% 37% 36% 29% 42%
occasionally 21% 15% 27% 26% 16%
frequently 37% 41% 32% 42% 33%
In terms of health, air sealing brings with it concerns about indoor air quality. Mechanical ventilation in manufactured homes typically consists of at most a kitchen range hood and a bath fan (Table 57). These may have poor airflow, be improperly vented (Figure 33) or even be non-functional. We measured bath-fan airflow in 52 of the 99 site-visit homes, and found an average flow of 27 cfm, with about a third of fans moving less than 20 cfm, and one in seven moving less than 5 cfm (most bath fans are rated for 50 cfm). Inadequate mechanical ventilation capability can lead to high indoor humidity and other indoor air-quality problems, and these can be further exacerbated by air sealing, if additional steps are not taken.

Minnesota Manufactured Homes Survey COMM- 087861 | October 20, 2016 Seventhwave 81 | P a g e
The federal Weatherization Assistance Program requires that homes treated under the program (including manufactured homes) be assessed for mechanical ventilation under ASHRAE Standard 62.2 (ASHRAE, 2016). This may lead to the installation of continuously-operating mechanical ventilation under the program, typically a quiet bathroom exhaust fan (Figure 34).
Figure 33. Water damage around a bath fan, likely due to improper venting into the attic area.
Figure 34. A quiet, continuously-operating bath fan installed by local weatherization agency to meet ventilation requirements.

Minnesota Manufactured Homes Survey COMM- 087861 | October 20, 2016 Seventhwave 82 | P a g e
Safety issues that intersect with energy improvements center on unsafe combustion equipment, such as older furnaces with cracked heat exchangers (Figure 35) and improper venting (Figure 36). In addition, households may make use of combustion-fired supplemental heating sources that are not properly installed or vented (Figure 37). Programs that take a whole-house approach to energy efficiency need to have policies and procedures in place to deal with issues like these.
Figure 35. Older furnaces, like this 1988 model, may pose a safety hazard if the heat exchanger is cracked.
Figure 36. Disconnected water-heater venting.

Minnesota Manufactured Homes Survey COMM- 087861 | October 20, 2016 Seventhwave 83 | P a g e
Figure 37. Fire damage from a wood-burning stove in a manufactured-home addition.

Minnesota Manufactured Homes Survey COMM- 087861 | October 20, 2016 Seventhwave 84 | P a g e
Conclusions and Recommendations This characterization of manufactured housing in Minnesota shows that there is theoretical potential for cost-effective energy savings in this housing stock of about 25 percent. Not all of this potential is readily addressable by utility programs, however, and many households in this population are financially hard-pressed to make energy-saving investments. Nonetheless, there are good opportunities for Minnesota utilities to reduce energy consumption in this housing stock.
We offer the following suggestions for maximizing the impact of Minnesota CIP achievements among manufactured homes in the state:
First, utilities should work closely with the Minnesota Weatherization Assistance Program and its network of providers to deliver weatherization services to eligible households living in manufactured homes. About half of all households living in manufactured homes appear to be eligible for WAP services, and Minnesota service providers are already trained to address the unique opportunities and challenges associated with this housing type.
One challenge posed here is that manufactured homes tend to be located in rural areas served by electric cooperatives, and these smaller utilities may not have the individual resources for coordinating services. A possible solution would be for utilities to jointly coordinate efforts with the WAP at the state level to reduce the administrative burden on both utilities and individual WAP service providers. WAP service providers would track measure installations and costs through a modified version of the State’s current reporting system, and the State (or a contracted third party) would then be responsible for allocating savings and installation costs among utilities for reporting under CIP. (Note that this concept could readily be extended to low-income weatherization services beyond manufactured housing.)
Iowa offers an example of such a coordinated approach. Like Minnesota, the Iowa utilities generally have individual goals and separate non-low-income energy-efficiency programs. However, for low-income weatherization, the utilities and the State have coordinated for more than 20 years to offer a single ratepayer funded efficiency program that is implemented by WAP service providers, and that is through the State’s reporting system.
Second, utilities could also engage with WAP by helping identify the many manufactured homes on private property for targeting low-income services. This study demonstrates that non-park manufactured homes on private property tend to be in worse shape than those in parks, and have higher potential for energy savings. Moreover, in conducting this study, we found that many jurisdictions tax manufactured homes that are located on private property as real estate (rather than as personal property), and identify them as such in their publicly-available tax databases. A utility-funded effort to identify such manufactured homes on private property from these public records (which can generally be obtained and searched electronically) would facilitate targeting services to households living in homes outside parks.
Our data suggest that the energy-savings potential for manufactured homes on private property is nearly twice that of those in parks, which tend to be newer and in better shape. Since nearly two-thirds of these households heat with propane or fuel oil, utilities should take full advantage of existing CIP policy that provides electric utilities with credit for addressing deliverable-fuel opportunities in low-income homes.

Minnesota Manufactured Homes Survey COMM- 087861 | October 20, 2016 Seventhwave 85 | P a g e
Third, manufactured-homes parks provide an opportunity for “blitz” type programs specifically targeting this housing type. The Housing Justice Center has already compiled a census of such parks in the state, which we mapped into electric-utility service territories for this project. Utilities could contact park operators in their service territories to organize one- or two-day events for residents offering energy audits, direct installation of lighting, hot-water and other low-cost measures, as well as provide on-site qualification for WAP and energy assistance.
Fourth, utilities and the State could coordinate on ways to address the significant use of electric space heaters in this population. We recommend a pilot effort to address the underlying factors that cause people to use electric space heaters, and document savings that can be achieved from eliminating or reducing their use. If successful, this could be incorporated into the Minnesota Technical Reference Manual so that electric utilities can take credit for programmatic efforts to address this opportunity.
Finally, utilities could expand the scope of their existing residential new construction programs to provide incentives for the purchase and installation of an ENERGY STAR manufactured home in their service territory. Census data indicate that manufactured homes are rarely moved from their original location, and factory ENERGY STAR certification for a new manufactured home is a much less expensive than what is needed to field-certify a site-built home. Although the number of new manufactured homes sold in Minnesota annually appears to be relatively small, providing incentives for qualified units should not be a difficult undertaking, and could allow utilities to offer attractive incentives to encourage purchasers of new manufactured homes to upgrade to higher-efficiency models. Two cooperative utilities (Hoosier Energy and East Kentucky Power) and one investor-owned utility (Appalachian Power) currently provide such incentives.

Minnesota Manufactured Homes Survey COMM- 087861 | October 20, 2016 Seventhwave 86 | P a g e
References Ashe, Mary, Dan Chwastyk, Caroline de Monasterio, Mahima Gupta and Mika Pegors. 2012. “2010 U.S. Lighting Market Characterization”, Navigant Consulting, prepared for U.S. Dept. of Energy Building Technologies Program, January 2012. Available at: http://apps1.eere.energy.gov/buildings/publications/pdfs/ssl/2010-lmc-final-jan-2012.pdf
ASHRAE (American Society of Heating, Refrigeration and Air Conditioning Engineers). 2016. Ventilation and Acceptable Indoor Air Quality in Low-Rise Residential Buildings, ASHRAE Standard 62.2-2016.
Bensch, Ingo, Scott Pigg, Karen Koski and Rana Belshe. 2010. “Electricity Savings Opportunities for Home Electronics and Other Plug-In Devices in Minnesota Homes: a Technical and Behavioral Field Assessment,” Energy Center of Wisconsin Report Number 257-1, May, 2010. Available at: http://www.seventhwave.org/sites/default/files/257-1.pdf
Blasnik, Michael, Greg Dalhoff, David Carroll, Ferit Ucar, Dan Bausch and Daya Bill Johnson. 2015. “Evaluation of the Weatherization Assistance Program During Program Years 2009-2011 (American Recovery and Reinvestment Act Period): Energy Impact for Mobile Homes,” Oak Ridge National Laboratory, ORNL/TM-2014/558. Available at: http://weatherization.ornl.gov/RecoveryActpdfs/ORNL_TM-2014_558.pdf.
Census (U.S. Census Bureau). 2015. “Cost and Size Comparisons: New Manufactured Homes and New Single-Family Site-Built Homes (2007-2015).” Spreadsheet available at: https://www2.census.gov/programs-surveys/mhs/tables/time-series/sitebuiltvsmh.xls
CPSC (Consumer Product Safety Council). 1990. “Mobile Homes: Have Heat Tapes, Cable Checked for Fire Hazards,” Press release, October 18, 1990. Available at: http://www.cpsc.gov/en/Newsroom/News-Releases/1990/Mobile-Homes-Have-Heat-Tapes-Cables-Checked-For-Fire-Hazards/
DER (Division of Energy Resources). 2012. “CIP Policy Guidelines: Energy Savings from Delivered Fuels,” Division of Energy Resources, Minnesota Department of Commerce, August 3, 2012. Available at: http://mn.gov/commerce-stat/pdfs/conserve-prog-delivered-fuels.pdf.
DER (Division of Energy Resources). (undated). “State of Minnesota Technical Reference Manual for Energy Conservation Improvement Programs, Version 2.0,” Minnesota Department of Commerce, Division of Energy Resources. Available at: http://mn.gov/commerce/industries/energy/utilities/cip/technical-reference-manual/
DOC (Department of Commerce). 2016. “Minnesota Weatherization Assistance Program: Policy Manual,” Minnesota Department of Commerce. Available at: http://mn.gov/commerce-stat/pdfs/mnwap-policy-manual.pdf.
Lavappa, Priya D. and Joshua D. Kneifel. 2015. “Energy Price Indices and Discount Factors for Life-Cycle Cost Analysis – 2015: Annual Supplement to NIST Handbook 135,” National Institute of Standards and Technology, NISTIR 85-3273-30, May, 2015. Available at: http://energy.gov/sites/prod/files/2015/06/f23/ashb15.pdf

Minnesota Manufactured Homes Survey COMM- 087861 | October 20, 2016 Seventhwave 87 | P a g e
McLellen, Scott. 2007. “Manufactured Structures Memorandum, Subject: Manufactured Home: Remodeling, Repairs, and Alterations,” Minnesota Department of Labor and Industry. Available at: http://www.dli.mn.gov/ccld/ManufacturedBulletinsMemo.asp
Prather, Shannon. 2016. “Met Council pushes to preserve mobile home parks in suburbs,” Minneapolis Star Tribune, June 25, 2016. Available at: http://www.startribune.com/met-council-pushes-to-preserve-mobile-home-parks-as-affordable-suburban-housing/384396681/#1
Siegel, Jeffrey and Bob Davis. 1998. “Measured Heating System Efficiency Retrofits in Eight Manufactured (HUD-Code) Homes,” Proceedings of the 1998 American Council for an Energy Efficient Economy Summer Study on Energy and Buildings.
Talbot, Jacob. 2012. “Mobilizing Energy Efficiency in the Manufactured Housing Sector,” Report Number A124, American Council for an Energy Efficient Economy, July, 2012. Available at: http://aceee.org/research-report/a124.
TEC (The Energy Conservatory). 2012. Minneapolis Duct Blaster® Operation Manual (Series B Systems), The Energy Conservatory, Minneapolis Minnesota, August 2012.
Walker, I.S., Sherman, M.H., Wempen, J., Wang, D., Mcwilliams, J.A., and Dickerhoff, D.J. 2001. “Development of a new duct leakage test: DeltaQ,” LBNL 47308. Lawrence Berkeley National Laboratory, Berkeley, CA.

Appendix A
Minnesota Manufactured Homes Survey COMM- 087861 | October 20, 2016 Seventhwave 88 | P a g e
Appendix A – Sample design and weighting This appendix describes our approach for developing a sample of manufactured homes for the study, as well as how we estimated case weights for the final analysis data sets.
Census data from the American Community Survey (ACS) form the basis for our estimates of the total population of manufactured homes in Minnesota. Specifically, the 2014, five-year population estimates indicate that there are about 61,700 occupied, non-seasonal manufactured homes in the state.
There is, however, one significant complication with this estimate: the Census Bureau classifies manufactured homes that have had one or more permanent rooms added to them as single-family, detached homes rather than manufactured homes.22 For the purposes of this study, it seems more logical to count these units as manufactured homes.
But this begs the question of what is considered a “permanent room” in the eyes of the Census Bureau. Nearly 40 percent of the homes visited for the study had some sort of addition attached to the original structure, but many of these were unheated entryways or three-season porches.23 Documentation on the Census Bureau’s website indicates that the Bureau does not consider these to be permanent rooms.24 This leaves 22 percent of the homes in the study survey sample with a heated addition to the original structure, which would presumably be counted as single-family, detached homes by Census. We used this proportion to scale up the overall Census population count of Minnesota manufactured homes to 79,100.25
To implement the study, we stratified the population of manufactured homes according to three dimensions:
1. geographically; 2. whether the home is located in a manufactured-home park; and, 3. whether the home is occupied by a low-income household.
For geographic stratification, we divided the state into five geographic strata, and established preliminary telephone-survey and on-site data collection completion quotas for park and non-park manufactured homes in each stratum. Figure 38 shows the geographic regions that we defined for the project.
22 See the 2014 ACS Subject Definitions at https://www2.census.gov/programs-surveys/acs/tech_docs/subject_definitions/2014_ACSSubjectDefinitions.pdf 23 This proportion is reasonably consistent with EIA’s 2009 Residential Consumption Survey, which shows 30 percent of (67) manufactured homes in the West North Central Census Division having an addition of some kind. 24 We gleaned this information from a note buried in the interviewing manual for the Census Bureau’s Current Population Survey (Part C, Chapter 2, “The `Front’ of the CPS Instrument”): available at https://www.census.gov/programs-surveys/cps/technical-documentation/methodology/interviewer-s-manual.html. 25 Specifically: 61,700/(1-0.22) = 79,100

Appendix A
Minnesota Manufactured Homes Survey COMM- 087861 | October 20, 2016 Seventhwave 89 | P a g e
Figure 38. Geographic strata for the study.
We also desired to apportion the population of manufactured homes between those in manufactured-home parks and those not in such parks. There are no Census data on this distinction, but there is a near census of Minnesota manufactured-home parks created by the Housing Justice Center (formerly the Housing Preservation Project), which lists nearly 900 parks in the state, along with the number of lots in each park based on state and local health department lists.26 Of course, parks can and do go out of business, and some proportion of lots can be expected to be vacant at any given time, but the HJC list provided a starting point for estimating population proportions by geography and by park/non-park status. Table 58 shows the estimates that we used for developing sample quotas for the telephone survey and on-site data collection.
26 See Manufactured Home Parks page of the Housing Justice Center at: http://hjcmn.org/projects/index.php?strWebAction=resource_detail&intResourceID=40, which provides a link to a list of Minnesota manufactured home parks within their Resource Library link (File name: “20.07.07_MN_MHP_SURVEY_List.xls.”)

Appendix A
Minnesota Manufactured Homes Survey COMM- 087861 | October 20, 2016 Seventhwave 90 | P a g e
Table 58. Estimated population proportions used in sample planning.
Stratum
Percent of statewide population
Park Non-Park
NE 4% 13%
NW 5% 12%
SE 13% 4%
SW 8% 11%
TC 27% 3%
Total 57% 43%
To refine these estimates, we expanded our original plan for a survey of park operators to obtain information about park status and vacancy rates for a sample of parks across the state. In all, we attempted to contact 170 parks in the HJC listing, and completed interviews with 30. From the attempted contacts, we found a small proportion of parks that were no longer in business as well some that were for seasonal occupancy only (the HJC list is intended to exclude these). From the completed interviews, we found an overall park occupancy rate of 92 percent. Based on these findings, we estimate that there are about 40,700 occupied manufactured homes in parks in the state (Table 60), or just over 50 percent of the estimated 79,100 total population.
We further desired to stratify the population of households residing in manufactured homes between low-income and non-low-income households. Here, we define low-income as an annual household income that is at or below 200 percent of the federal poverty guideline. The Census ACS data suggest that about 42 percent of households living in manufactured homes are at or below this threshold. Since the Census data show only minor variation in this rate across regions—and our survey data show a similar poverty rate for park and non-park households—we applied an across-the-board 42/58 split for low-income/non-low-income households to develop population estimates in this dimension.
The population estimates by stratum (combination of region, park/non-park and low-income/non-low-income) then formed the basis for case weights (the number of households in the population represented by each household in the sample) for the survey and on-site samples.

Appendix A
Minnesota Manufactured Homes Survey COMM- 087861 | October 20, 2016 Seventhwave 91 | P a g e
Table 59. Park-operator survey based adjustments to the Housing Justice Center list of Manufactured home parks.
Region
HJC list MH park operator survey results
Lots
Still in business Not Seasonal Occupied lots
%
Adjusted number of Lots %
Adjusted number of Lots %
Estimated manufactured
homes
NE 4,066 96%
3,903 85%
3,318
92%
3,053
NW 5,067 4,864 4,134 3,803
SE 10,791 99%
10,683 90%
9,615 8,846
SW 7,931 7,852 7,067 6,502
Twin Cities
20,506 99% 20,301 99% 20,098 18,490
Total 48,361 47,603 44,232 40,694
Table 60. Final estimates of occupied manufactured homes, by region and park/non-park status.
Region Park Non-Park Total
NE 3,100 9,900 13,000
NW 3,800 9,300 13,100
SE 8,800 5,200 14,000
SW 6,500 8,300 14,800
TC 18,500 5,700 24,200
Total 40,700 38,400 79,100
A final adjustment that we made was to limit the range of case weights to avoid having sample points with an undue influence on the results: this affected only one or two cases in each sample.27 Table 61 and Table 62 show the final case weights that were used in the survey and on-site samples.
27 Specifically, we calculated the interquartile range for the weights, flagged cases that were more than 5 times the IQR above or below the median, and set these weights to the nearest unflagged value—and then rescaled all of the weights back to the original population total.

Appendix A
Minnesota Manufactured Homes Survey COMM- 087861 | October 20, 2016 Seventhwave 92 | P a g e
Table 61. Case weights for the telephone survey sample (n=633), by stratum.
Region Park/Non-park Income Sample n Case weight NE Non-park Non-low-income 35 166.822 NE Non-park Low-income 42 100.669 NE Park Non-low-income 7 261.186 NE Park Low-income 13 101.842 NW Non-park Non-low-income 21 261.186 NW Non-park Low-income 44 90.269 NW Park Non-low-income 7 320.164 NW Park Low-income 13 124.838 SE Non-park Non-low-income 13 235.910 SE Non-park Low-income 17 130.636 SE Park Non-low-income 20 259.501 SE Park Low-income 46 81.702 SW Non-park Non-low-income 47 104.152 SW Non-park Low-income 45 78.772 SW Park Non-low-income 17 225.502 SW Park Low-income 38 73.053 TC Non-park Non-low-income 5 405.725 TC Non-park Low-income 6 405.725 TC Park Non-low-income 66 165.316 TC Park Low-income 131 60.313
Table 62. Case weights for on-site sample (n=99), by stratum.
Region Park/Non-park Income Sample n Case weight NE Non-park Non-low-income 5 1,170.719 NE Non-park Low-income 7 605.544 NE Park Non-low-income 1 1,832.944 NE Park Low-income 1 1,327.304 NW Non-park Non-low-income 2 2,601.598 NW Non-park Low-income 6 663.652 NW Park Non-low-income 1 2,246.835 NW Park Low-income 5 325.404 SE Non-park Non-low-income 2 1,537.308 SE Non-park Low-income 5 445.289 SE Park Non-low-income 2 2,601.598 SE Park Low-income 7 538.262 SW Non-park Non-low-income 5 981.512 SW Non-park Low-income 4 888.438 SW Park Non-low-income 1 2,601.598 SW Park Low-income 7 397.580 TC Non-park Non-low-income 0 --- TC Non-park Low-income 1 2,440.527 TC Park Non-low-income 6 2,384.798 TC Park Low-income 31 255.516

Appendix B
Minnesota Manufactured Homes Survey COMM- 087861 | October 20, 2016 Seventhwave 93 | P a g e
Appendix B — Telephone survey instrument (Note: Response options in ALL CAPS appeared as choices for the interviewer, but were not directly offered to respondents.)
Q0. Hello, I’m calling from Leede Research on behalf of the State of Minnesota about a study of mobile homes. I’m not selling anything; I’d just like to talk with an adult member of your household. All responses are completely confidential and we will provide you with a $15 gift card for completing the survey and providing some additional information. Are you 18 years or older?
1 yes
2 no May I speak with an adult member of the household? Repeat introduction if necessary.
[IF ASKED] This could take up to 15 minutes.
To begin with, I have a few questions about your home.
Q1. First I’d like to confirm the type of home you live in. Is your home a mobile home, sometimes also known as a manufactured home?
1 yes
2 no -> end survey
8 DON’T KNOW -> end survey
9 REFUSED -> end survey
Q1a. Just to confirm your home is a mobile home, also known as a manufactured home, and NOT a camper, trailer, motorhome or modular home, correct?
[If needed for clarification: “A manufactured home is defined as a movable dwelling, 8 feet or more wide and 40 feet or more long, designed to be towed on its own chassis, with transportation gear integral to the unit when it leaves the factory, and without need of a permanent foundation. These manufactured homes include multi-wides and expandable manufactured homes. Excluded are travel trailers, motor homes, and modular housing.”]
1 yes
2 no -> end survey

Appendix B
Minnesota Manufactured Homes Survey COMM- 087861 | October 20, 2016 Seventhwave 94 | P a g e
8 DON’T KNOW -> end survey
9 REFUSED -> end survey
Q2. Is this your primary residence?
[If needed for clarification: “Your primary residence is where you sleep most of the time.”]
1 yes
2 no -> end survey
8 DON’T KNOW -> end survey
9 REFUSED -> end survey
Q3. Is your mobile home a…
1) single-wide
2) double-wide
3) triple-wide
8) DON’T KNOW
9) REFUSED
A – Mobile home characteristics
A1) How many years have you lived in your current home?
1) less than 1 year
2) 1-5 years
3) 6-10 years
4) 11-15 years
5) 16-20 years
6) 20 years or more
8) DON’T KNOW
9) REFUSED
A2) Do own your mobile home?

Appendix B
Minnesota Manufactured Homes Survey COMM- 087861 | October 20, 2016 Seventhwave 95 | P a g e
[Note to interviewer: Response may answer A3 as well so may want fill that response in instead of repeating question.]
1) own
2) rent/lease
7) other: please specify__________
8) DON’T KNOW
9) REFUSED
A3) Which of the following best describes the property on which your home resides…” ?
1) I rent a lot in a mobile-home park
2) I rent a mobile home that is not part of a mobile-home park
3) I own the land
7) other please specify: _______
8) DON’T KNOW
9) REFUSED
A4) Which of the following best describes the location of your home? Do you live in a city, a town, the suburbs, or in a rural area?
1) city
2) town
3) suburbs
4) rural
9) REFUSED
A5) Does your mobile home have any permanently attached rooms that you heat in the winter, and that weren’t part of the mobile home when it was first manufactured?
1) yes
2) no -> skip to A6
8) DON’T KNOW -> skip to A6
9) REFUSED -> skip to A6

Appendix B
Minnesota Manufactured Homes Survey COMM- 087861 | October 20, 2016 Seventhwave 96 | P a g e
A5a) Do you heat this space in the winter?
1) yes
2) no
9) REFUSED
A6) When was your mobile home built? Your best estimate is fine.
1) before 1950
2) 1950-1959
3) 1960-1969
4) 1970-1979
5) 1980-1989
6) 1990-1999
7) 2000-2009
8) 2010-present
98) DON’T KNOW
99) REFUSED
A7) Which of the following best describes the type of roof on your home… Is it….?
1) flat
2) bowed or rounded
3) pitched
8) DON’T KNOW
9) REFUSED
B - Heating system
B1) What type of thermostat do you have to control your heat?
1) no thermostat -> skip to B3
2) manual-style thermostat -> skip to B3
3) digital programmable thermostat (whether or not you use the programmable features)

Appendix B
Minnesota Manufactured Homes Survey COMM- 087861 | October 20, 2016 Seventhwave 97 | P a g e
8) DON’T KNOW -> skip to B3
9) REFUSED -> skip to B3
B1a) Is your thermostat connected to the internet?
1) yes
2) no
8) DON’T KNOW
9) REFUSED
B2) Do you use the programmable features of your thermostat?
1) yes
2) no
3) varies/depends
8) DON’T KNOW
9) REFUSED
B3) What fuel is used MOST for heating your home?
1) natural gas
2) propane
3) electricity => skip to B5
4) fuel oil
5) wood
6) other: _____________
8) DON’T KNOW
9) REFUSED
B4) What equipment is used to heat your home?
1) a central furnace with ducts to individual rooms – skip to B6
2) a wall or floor heater without ducts – skip to B6
3) a free-standing heater – skip to B6

Appendix B
Minnesota Manufactured Homes Survey COMM- 087861 | October 20, 2016 Seventhwave 98 | P a g e
4) a boiler – skip to B6
5) something else: __________- skip to B6
8) DON’T KNOW – skip to B6
9) REFUSED – skip to B6
B5) What equipment is used to heat your home?
1) an electric furnace with ducts to individual rooms
2) built-in baseboard heaters in each room
3) one or more portable space heaters
4) a heat pump
5) something else: __________
8) DON’T KNOW
9) REFUSED
B6) Do you use any other sources for heating your home in the winter?
1) yes
2) no -> skip to B7 if applicable or skip to B8
8) DON’T KNOW
9) REFUSED
B6a) What do you use? [Don’t read responses]
1) CENTRAL FURNACE
2) WALL FURNACE
3) FREE-STANDING HEATER
4) ELECTRIC HEATER(S) -> skip to B6c
5) BOILER
6) OTHER: __________
8) DON’T KNOW
9) REFUSED

Appendix B
Minnesota Manufactured Homes Survey COMM- 087861 | October 20, 2016 Seventhwave 99 | P a g e
B6b) What fuel does that use?
1) natural gas -> skip to B7
2) propane -> skip to B7
3) electricity
4) fuel oil -> skip to B7
5) wood -> skip to B7
6) other: please describe: _________________ -> skip to B7
8) DON’T KNOW -> skip to B7
9) REFUSED -> skip to B7
B6c) If electricity, ask follow-up about whether the equipment used to heat the home is
1) an electric furnace with ducts to individual rooms
2) built-in baseboard heaters in each room
3) one or more portable space heaters
4) a heat pump
8) DON’T KNOW
9) REFUSED
[ask if B4=1 or if B6a=1] B7) How often do you usually replace your heating system filter? Is it…
1) more often than monthly
2) about monthly
3) every couple of months
4) a few times a year
5) annually
6) less than annually
7) by some other schedule
8) never
9) REFUSED

Appendix B
Minnesota Manufactured Homes Survey COMM- 087861 | October 20, 2016 Seventhwave 100 | P a g e
B8)) At what temperature do you keep your home in winter when you are home and awake?
_____ [RECORD 2-DIGIT TEMPERATURE (IN DEGREES FAHRENHEIT)]
997) heat turned off
998) DON’T KNOW
999) REFUSED
B9) At what temperature do you keep your home in winter when you are away?
_____ [RECORD 2-DIGIT TEMPERATURE (IN DEGREES FAHRENHEIT)]
997) heat turned off
998) DON’T KNOW
999) REFUSED
B10) At what temperature do you keep your home in winter when everyone is sleeping?
_____ [RECORD 2-DIGIT TEMPERATURE (IN DEGREES FAHRENHEIT)]
997) heat turned off
998) DON’T KNOW
999) REFUSED
B11) How would you describe the general level of comfort in your home in the winter?
1) very uncomfortable
2) somewhat uncomfortable
3) neither uncomfortable nor comfortable -> skip to C1
4) somewhat comfortable -> skip to C1
5) very comfortable -> skip to C1
8) DON’T KNOW
9) REFUSED
B11a) Are there specific places in your home where you or members of your household often feel uncomfortable in the winter?
1) yes – please describe: _______________________________________
2) no

Appendix B
Minnesota Manufactured Homes Survey COMM- 087861 | October 20, 2016 Seventhwave 101 | P a g e
8) DON’T KNOW
9) REFUSED
C - Cooling system
C1) Do you have air conditioning equipment in your home?
1) yes
2) no -> skip to C6
8) DON’T KNOW
9) REFUSED
C2) What kind of equipment do you have? Is it…
1) …a central system -> skip to C3
2) …individual units in the windows or walls
3)...both a central system and individual units
8) DON’T KNOW
9) REFUSED
C2a) How many individual units do you have? ____ [record number]
C3) At what temperature do you keep your home in summer when you are home and awake?
_____ [RECORD 2-DIGIT TEMPERATURE (IN DEGREES FAHRENHEIT)]
997) AC turned off
998) DON’T KNOW
999) REFUSED
C4) At what temperature do you keep your home in summer when you are away?
_____ [RECORD 2-DIGIT TEMPERATURE (IN DEGREES FAHRENHEIT)]
997) AC turned off
998) DON’T KNOW

Appendix B
Minnesota Manufactured Homes Survey COMM- 087861 | October 20, 2016 Seventhwave 102 | P a g e
999) REFUSED
C5) At what temperature do you keep your home in summer when everyone is sleeping?
_____ [RECORD 2-DIGIT TEMPERATURE (IN DEGREES FAHRENHEIT)]
997) AC turned off
998) DON’T KNOW
999) REFUSED
C6) How would you describe the general level of comfort in your home in the summer?
1) very uncomfortable
2) somewhat uncomfortable
3) neither uncomfortable nor comfortable -> skip to D1
4) somewhat comfortable -> skip to D1
5) very comfortable -> skip to D1
8) DON’T KNOW
9) REFUSED
C6a) Are there specific places in your home where you or members of your household are uncomfortable in the summer?
1) yes -> please describe: __________
2) no
8) DON’T KNOW
9) REFUSED
D - Water heater
D1) What fuel does your water heater use?
1) natural gas
2) propane
3) electricity

Appendix B
Minnesota Manufactured Homes Survey COMM- 087861 | October 20, 2016 Seventhwave 103 | P a g e
4) fuel oil
5) other: please specify: _______
8) DON’T KNOW
9) REFUSED
D1a) Is access to your water heater from the inside of your mobile home or the outside?
1) inside
2) outside
8) DON’T KNOW
9) REFUSED
E – Electronics
Next I am going to ask about your appliances, electronics and lighting.
E1a) How many full-size refrigerators do you have in your home? _____
E1b) How many mini-refrigerators do you have in your home? _____
E1c) How many stand-alone freezers do you have in your home? _____
E2) Is your stove-top…?
1) electric
2) natural gas
3) propane
8) DON’T KNOW
9) REFUSED
E3) Is your oven…?
1) electric

Appendix B
Minnesota Manufactured Homes Survey COMM- 087861 | October 20, 2016 Seventhwave 104 | P a g e
2) natural gas
3) propane
8) DON’T KNOW
9) REFUSED
E4) About what fraction of the lights that you use regularly are energy efficient lightbulbs such as compact fluorescent bulbs or LED bulbs? Your best estimate is fine. Is it…?
1) …none
2) …less than 1/4
3) …1/4 – 3/4
4) …more than 3/4
5) …all
8) DON’T KNOW
9) REFUSED
Next I’ll ask about what kind of laundry equipment you have in your home.
E5) What type of clothes washer do you have in your home? Is it…?
1) none [don’t read]
2) a top-loading washer
3) a front-loading washer
8) DON’T KNOW
9) REFUSED
E6) What type of clothes dryer do you have in your home? Is it…?
1) none [don’t read]
2) an electric dryer
3) a natural gas dryer
4) a propane dryer
8) DON’T KNOW

Appendix B
Minnesota Manufactured Homes Survey COMM- 087861 | October 20, 2016 Seventhwave 105 | P a g e
9) REFUSED
Next I’ll ask about the electronics in your home.
E7) How many televisions do you have in your home? ______
E8) How many desktop computers do you have in your home? ______
E9) How many -cable boxes/satellite receivers do you have in your home? _____
E10) How many gaming systems (Xbox, Playstation, Wii, etc.) do you have in your home? _______
F – Utility bills and energy conservation behaviors
Next I’m going to ask a couple questions about your utility bills
{ask if B3=1 or D1=1}
F1) How are you billed for your natural gas bills…?
1) directly from the utility
2) your mobile home park/landlord is billed for the fuel(s) provided and then you are billed from the operator of the mobile home park - skip to F2
3) something else: _____ - skip to F2 8) DON’T KNOW - skip to F2
9) REFUSED - skip to F2
F1a) What utility provides the natural gas? ______________________
8) DON’T KNOW
9) REFUSED
{ask if B3=2 or D1=2}
F2) How are you billed for your propane bills…?

Appendix B
Minnesota Manufactured Homes Survey COMM- 087861 | October 20, 2016 Seventhwave 106 | P a g e
1) directly from the utility
2) your mobile home park/landlord is billed for the fuel(s) provided and then you are billed from the operator of the mobile home park - skip to F3
3) Something else: _____ - skip to F3 8) DON’T KNOW - skip to F3
9) REFUSED - skip to F3
F2a) Who provides the propane? ______________________
8) DON’T KNOW
9) REFUSED
{ask if B3=3 or D1=3}
F3) How are you billed for your electricity bills…?
1) directly from the utility
2) your mobile home park/landlord is billed for the fuel(s) provided and then you are billed from the operator of the mobile home park - skip to F4
3) Something else: _____ - skip to F4 8) DON’T KNOW - skip to F4
9) REFUSED - skip to F4
F3a) What utility provides the electricity? ______________________
8) DON’T KNOW
9) REFUSED
{ask if B3=4 or D1=4}
F4) How are you billed for your fuel oil bills…?
1) directly from the utility
2) your mobile home park/landlord is billed for the fuel(s) provided and then you are billed from the operator of the mobile home park - skip to F5
3) Something else: _____ - skip to F5 8) DON’T KNOW - skip to F5
9) REFUSED - skip to F5
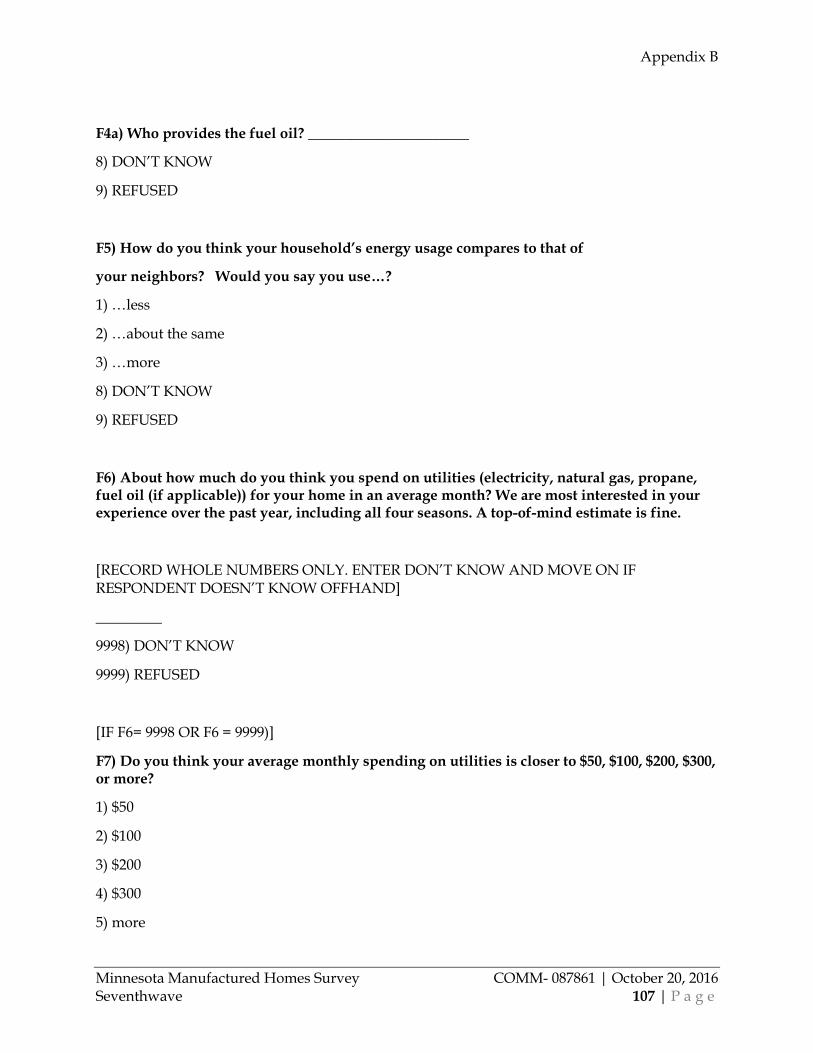
Appendix B
Minnesota Manufactured Homes Survey COMM- 087861 | October 20, 2016 Seventhwave 107 | P a g e
F4a) Who provides the fuel oil? ______________________
8) DON’T KNOW
9) REFUSED
F5) How do you think your household’s energy usage compares to that of
your neighbors? Would you say you use…?
1) …less
2) …about the same
3) …more
8) DON’T KNOW
9) REFUSED
F6) About how much do you think you spend on utilities (electricity, natural gas, propane, fuel oil (if applicable)) for your home in an average month? We are most interested in your experience over the past year, including all four seasons. A top-of-mind estimate is fine.
[RECORD WHOLE NUMBERS ONLY. ENTER DON’T KNOW AND MOVE ON IF RESPONDENT DOESN’T KNOW OFFHAND]
_________
9998) DON’T KNOW
9999) REFUSED
[IF F6= 9998 OR F6 = 9999)]
F7) Do you think your average monthly spending on utilities is closer to $50, $100, $200, $300, or more?
1) $50
2) $100
3) $200
4) $300
5) more

Appendix B
Minnesota Manufactured Homes Survey COMM- 087861 | October 20, 2016 Seventhwave 108 | P a g e
8) DON’T KNOW
9) REFUSED
F8) Government agencies and utilities have programs to help households who have trouble paying their energy bills. Have you received any assistance paying your utility bills in the last 5 years for this home?
1) yes
2) no
8) DON’T KNOW
9) REFUSED
Now I’m going to ask you a few questions about ways you save energy in your home.
Have you added any of the following features to this home since you’ve lived here?
F9a) caulking or weatherstripping
1) yes
2) no
8) DON’T KNOW
9) REFUSED
F9b) put up plastic or other insulation on windows
1) yes
2) no
8) DON’T KNOW
9) REFUSED
F9c) installed low-flow showerheads
1) yes
2) no
8) DON’T KNOW
9) REFUSED

Appendix B
Minnesota Manufactured Homes Survey COMM- 087861 | October 20, 2016 Seventhwave 109 | P a g e
F9d) installed faucet aerators
1) yes
2) no
8) DON’T KNOW
9) REFUSED
F9e) wrapped hot water pipes
1) yes
2) no
8) DON’T KNOW
9) REFUSED
F9f) wrapped water heater
1) yes
2) no
8) DON’T KNOW
9) REFUSED
F9g) installed energy efficient light bulbs
1) yes
2) no
8) DON’T KNOW
9) REFUSED
F9h) added insulation
1) yes
2) no
8) DON’T KNOW
9) REFUSED

Appendix B
Minnesota Manufactured Homes Survey COMM- 087861 | October 20, 2016 Seventhwave 110 | P a g e
Now I’m going to ask you a few questions about ways you save energy in your home.
F10) Do you think you could reduce your spending on home energy use...?
1) easily
2) with minor adjustments
3) with major adjustments
4) not at all
8) DON’T KNOW
9) REFUSED
F11) Which of the following best describes how far your household is willing to go to save energy if it means saving some money too? Would you...?
1) not do anything differently to reduce your energy consumption
2) reduce consumption only if the cost savings are very high
3) reduce consumption only when it is convenient
4) put up with a little inconvenience to reduce your consumption
5) go out of your way to cut down your energy consumption
7) other – please specify:________________
8) DON’T KNOW
9) REFUSED
F12) If you made a deliberate choice to reduce your home’s energy usage or your energy utility bills, what would you do? [RECORD VERBATIM]
______________________
8) DON’T KNOW
9) REFUSED
F13) How much do you think you would save annually if you did this? Your best guess is fine.

Appendix B
Minnesota Manufactured Homes Survey COMM- 087861 | October 20, 2016 Seventhwave 111 | P a g e
[TRY TO GET THE RESPONDENT TO EXPRESS SAVINGS IN QUANTITATIVE TERMS, NOT JUST “A LOT.” DOLLARS, PERCENTAGE SAVINGS, OR ENERGY UNITS ARE ALL FINE. RECORD VERBATIM]
______________________
8) DON’T KNOW
9) REFUSED
G - Demographics:
G1) How many people in each of the following age categories live in your household most of the year?
[RECORD NUMBER]
___ under 18 years old
___ 18 through 64
___ 65 and above
99) REFUSED
G2) Which of the following income categories best describes your total annual household income in 2014, before taxes? Please stop me when I get to the right category.
[READ LIST]
1) less than $25,000 – skip to G3
2) $25,000 to less than $50,000
3) $50,000 to less than $75,000
4) $75, 000 to less than $100,000 - >skip to G3
5) $100,000 or more ->skip to G3
6) prefer not to answer
9) REFUSED
[Ask this question if G2=2 or 3 AND combine that response with the total number of people in the household from G1 to get the income level and that number makes it ambiguous as to whether they are at or below the income level for their household size. Always ask this question if G2=6, still combining their response from G1 to get their household size.]
G2a) Is your income at or below ‘x’ (from the table below, given the total number of household members from G1)?

Appendix B
Minnesota Manufactured Homes Survey COMM- 087861 | October 20, 2016 Seventhwave 112 | P a g e
Household size
Rounded income
1 $24,000
2 $32,000
3 $40,000
4 $48,500
5 $57,000
6 $65,000
7 $73,500
8 $82,000
For each add’l person, add $5500
G3) What is the highest level of education you have completed?
[READ LIST]
1) some high school
2) high school graduation
3) some technical school or college
4) associates degree
5) bachelor’s degree
6) advanced degree (master’s degree or higher)
9) REFUSED
Closing questions:
H1. As part of this study we are gathering utility data on how much energy mobile homes use, and we’d like to include your home. We can get that utility information directly from your utility or fuel provider if you provide us with a signed form that allows the utility to release that information to us. Your information will not be individually identified in our

Appendix B
Minnesota Manufactured Homes Survey COMM- 087861 | October 20, 2016 Seventhwave 113 | P a g e
study but will be aggregated with other customers. As a thank you, we will send you a $15 Visa gift card once we receive your completed form. Are you willing to sign our release form as part of this study? [If needed: We will only get data on monthly consumption and cost, nothing on payments.]
1) yes
2) no ==>JUMP TO END
99) REFUSED ==>JUMP TO END
H2. We can either email you the utility release form or send it you through the mail. Which would you prefer? [Note for interviewer: we would prefer email so if the respondent doesn’t have a strong preference, soft push them towards email.]
1) Email: (Get and verify name and email address)_______________________
2) Mail: (Get and verify name and mailing address) ______________________
H3.We are also looking for households willing to participate in an in-home study to gather more information about manufactured homes. Households selected for this study will receive an additional $75 for a 3-4-hour visit to your home to gather more information about your home and its appliances and conduct a short interview with you. Would you be willing to participate in this study if the research team needs additional households in your part of the state?
1) yes
2) no ==>JUMP TO END
3) Perhaps, would need more information
99) REFUSED ==>JUMP TO END
H4. Record contact info.
Name: ____________________
Phone number: ____________________
Address: ____________________ (don’t need this if received in H2)
Good time to reach you: ____________________ [INTERVIEWER NOTE: LOOKING FOR TIME OF DAY OR DAY OF WEEK; ANY INSTRUCTIONS OF WHEN WE WOULD HAVE THE BEST CHANCE TO REACH THE RESPONDENT AND NOT INTERRUPT WORK, SLEEP, ETC.]

Appendix B
Minnesota Manufactured Homes Survey COMM- 087861 | October 20, 2016 Seventhwave 114 | P a g e
[IF NEEDED: We will be recruiting willing homes for this study in the next couple months. Someone from the Seventhwave would call you then to schedule a time for the visit to your house if your home is selected.]
[IF NEEDED FOR WILLING RESPONDENTS WHO NEED MORE INFORMATION: We will be recruiting willing homes for this study between ____ and ____. Someone from the Seventhwave would call you then if your home is selected and can tell you more about the study before you decide whether you want to participate.]
Those are all the questions I have for you. Thank you for participating in this survey.

Appendix C
Minnesota Manufactured Homes Survey COMM- 087861 | October 20, 2016 Seventhwave 115 | P a g e
Appendix C — On-site data collection instrument
Visit date: Householder name:
Site Address: Details
Year built 19_____ 20_____
Additions? Y/N
Lot: renter/owner? R/O Roof leaks? Y/N raining/ thawing
MH: renter/owner? R/O Plumbing issues? Y/N
Original owner? Y/N Electrical issues? Y/N Years lived here ____ Freezing pipes? Y/N
# adults ____ Ice dams? Icicles?
Y/N Y/N
# children _____
Window Condensation?
Y/N Some All Severe
# smokers _____ Moisture? Y/N mold/ mildew
RH %________
# w/ asthma _____
# cats _____ Thermostat & comfort Take picture of t-stat # dogs _____ Thermostat type prog man none
Program used? Y N NA Water Source City Well Fan-on used? Y N Sometimes NA
Temperature settings Winter Summer*
# Frequency of use
Awake _____ F
_____ F
* enter 99 if no central cooling
Bath fan: __ never rare occ freq Asleep _____ F _____ F
Ktch exh: __ never rare occ freq Away _____ F _____ F
Humidifier __ never rare occ freq Tstat notes:
Dehumid.: __ never rare occ freq
Oven used for heat?
never rare occ freq Comfort uncomfortable* comfortable*
1 2 3 4 5 Ext. HUD label
location: Winter comfort 1 2 3 4 5
Summer comfort 1 2 3 4 5
Int. HUD label location:
Elec panel Other:
Comfort issues
*1 = very uncomfortable; 2 = uncomfortable; 3 = neither uncomfortable nor comfortable; 4 = comfortable; 5 = very comfortable
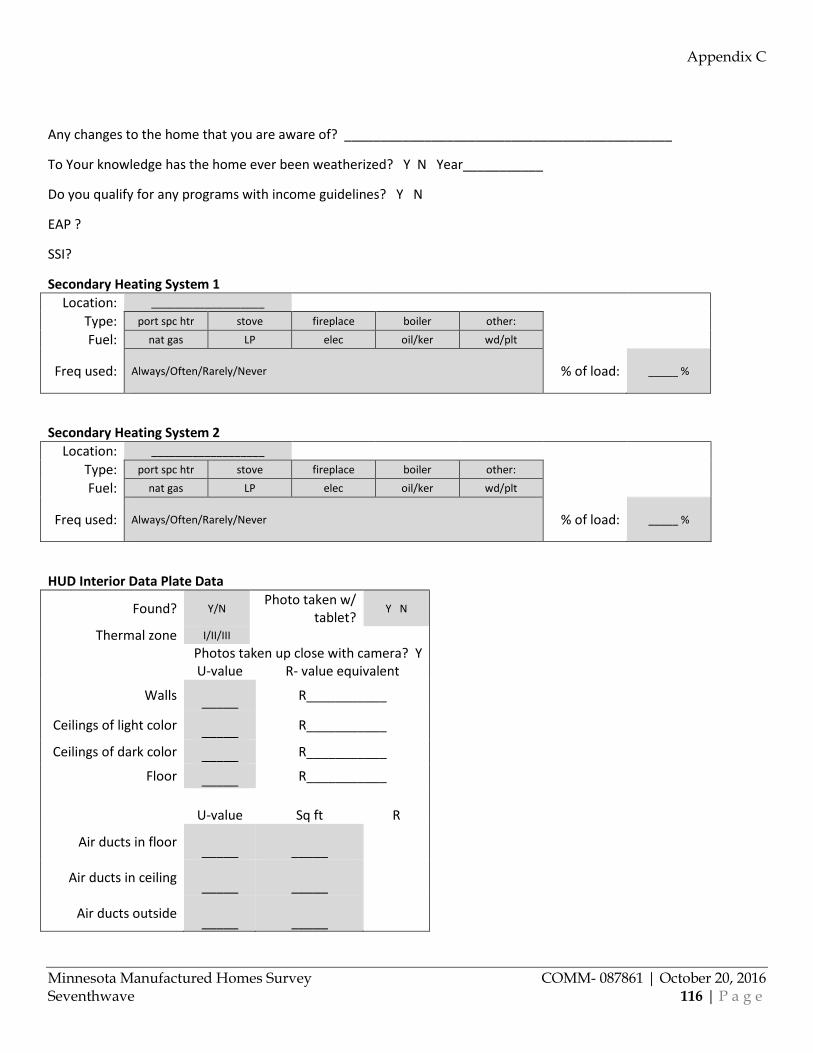
Appendix C
Minnesota Manufactured Homes Survey COMM- 087861 | October 20, 2016 Seventhwave 116 | P a g e
Any changes to the home that you are aware of? _____________________________________________
To Your knowledge has the home ever been weatherized? Y N Year___________
Do you qualify for any programs with income guidelines? Y N
EAP ?
SSI?
Secondary Heating System 1 Location: ___________________
Type: port spc htr stove fireplace boiler other:
Fuel: nat gas LP elec oil/ker wd/plt
Freq used: Always/Often/Rarely/Never
% of load: _____ %
Secondary Heating System 2 Location: ___________________
Type: port spc htr stove fireplace boiler other:
Fuel: nat gas LP elec oil/ker wd/plt
Freq used: Always/Often/Rarely/Never
% of load: _____ %
HUD Interior Data Plate Data
Found? Y/N Photo taken w/
tablet? Y N
Thermal zone I/II/III
Photos taken up close with camera? Y U-value R- value equivalent
Walls _____ R___________
Ceilings of light color _____ R___________
Ceilings of dark color _____ R___________
Floor _____ R___________ U-value Sq ft R
Air ducts in floor _____ _____
Air ducts in ceiling _____ _____
Air ducts outside _____ _____

Appendix C
Minnesota Manufactured Homes Survey COMM- 087861 | October 20, 2016 Seventhwave 117 | P a g e
Exterior
Length: _____ ft Total floor area:
_______ ft2
Width: _____ ft Total volume:
_______ ft3 Orientation of long wall: N/S/E/W
Roof: Flat/Bowed/Pitched Roof condition: Good / Fair/Poor /VPoor
Exterior HUD plate found?: Y/N Photo Taken? Y/N
Foundation type: Skirting: None/Partial/Full Metal/Vinyl/Insulated/Other
VENTILATION
Is Attic vented? Y/N Roof vents visible? Y/N
Unconditioned additions:
Space for Calculating volume / sq. ft., Calculate while on site
Exterior Lighting (including porches and garages)
Loc
Use & controls (ask owner) Bulbs Incan/Hal CFL Lin. Fluor
LED Use Controls
<50 50 70 90
>125 <13 13 18 21
>28 2’ 4’ 8’ 24hr 12hr phot tmr mo 69 89 125 17 20 28
Central A/C Type: none split A/C pkg A/C split HP pkg HP Minisplit/ductless
Functional?: Y/N Capacity: _______ kBtuh
Brand ____________ M# ____________
Yr mfr: 19_____
20_____
SEER: _____ coil fouling: none some
a lot
If not stated, estimated SEER: 1976 – 1981 = 7.5, 1982 - 1991 = 9, 1992 – 2003 = 11, 2004 – present = 13 NOTES:

Appendix C
Minnesota Manufactured Homes Survey COMM- 087861 | October 20, 2016 Seventhwave 118 | P a g e
Conditioned additions
Addition 1 Description: ________________________________________________________Year built___________ Floor area _______ ft2 Ceil height ______ ft Walls
Framing: 2x4 2x6 Other Cavity ins: FG batt FG loose Cellulose Foam Other Unins
Ext ins.: _____ in.
Ceiling Ins type: FG batt FG loose Cellulose Foam Other Unins
Ins depth: _____ in. Addl avail depth: _____ in
Foundation Type: slab crawl bsmt exposed
Joists: none 2x4 2x6 2x8 other: Ins location: none att to flr btw joists under joists
Batt ins depth:
_____ in.
Loose ins depth: ______in. Addl avail depth: _____ in.
Addition 2 Description: _________________________________________________________ Year built _________ Floor area _______ ft2
Ceil height ______ ft
Walls
Framing: 2x4 2x6 Other Cavity ins: FG batt FG loose Cellulose Foam Other Unins
Ext ins.: _____ in.
Ceiling Ins type: FG batt FG loose Cellulose Foam Other Unins
Ins depth: _____ in. Addl avail depth: _____ in.
Foundation Type: slab crawl bsmt exposed
Joists: none 2x4 2x6 2x8 other: Ins location: none att to flr btw joists under joists
Batt ins depth: _____ in. Loose ins depth: ______in. Addl avail depth: _____ in.
Belly Accessible? Y/N Joist direction: Lengthwise Widthwise Wings
Joist size: 2x4 2x6 2x8 Ins location: none att to flr btw joists att under joists draped blw

Appendix C
Minnesota Manufactured Homes Survey COMM- 087861 | October 20, 2016 Seventhwave 119 | P a g e
Belly Ins condition: good fair poor
Batt ins depth: _____ in. Test hole? Y N
Loose ins depth: _____ in.
Belly Config: square rounded flat
Joist size: 2x4 2x6 2x8 Ins location: none att to flr btw joists att under joists draped blw
Ins condition: good fair poor
Batt ins depth: _____ in. Test hole? Y N
Loose ins depth: _____ in.
Max avail depth: _____ in. Ducts
Registers: outer middle mixed Duct issues:
Ground cover % Coverage 0% 1-24% 25-49% 50—74% 75%-99% 100%
Seams overlapped? Y/N Seams sealed? Y/N
Moisture exposed areas none dry damp standing water
H20 on top of cover? Y/N Belly notes:

Appendix C
Minnesota Manufactured Homes Survey COMM- 087861 | October 20, 2016 Seventhwave 120 | P a g e
Walls
Framing: 2x2 2x3 2x4 2x6 2 x 8
Ceiling ht (at wall): _____ ft.
Vented?: Y/N Able to assess ins?: Y/N
Batt ins depth: _____ in.
Test hole? Y N
Loose ins depth: _____ in. Foam ins depth: _____ in.
Ceiling
Accessible?: Y/N Vented?: Y/N
% cathedral: _____ %
Joist size: 2x4 2x6 2x8
Batt ins depth: _____ in. Test hole? Y N Loose ins depth: _____ in. Foam ins depth: _____ in. Addl ins depth: _____ in.
Primary Heating System
Type: cent fur wall fur bsbrd other: Notes: Near drain? Y/N
Fuel: nat gas LP oil elec
Functional?: Y/N % ttl load: _____ %
Input: _____ Btuh
Yr mfr: _____ Original
equipment?: Y/N
Condensing?: Y/N Filter
Type: mesh pleated EAC
Thickness: _____ in.
Condition: good fair poor
DHW
Type: tank tankless Location: int closet ext closet other:
Yr Mfr: 19______ 20________
Capacity: _______ gal
Fuel: nat gas LP elec oil MH apprv?: Y/N/NA
Wrapped?: Y/N Pipe ins?: Y/N Temp: _____________________

Appendix C
Minnesota Manufactured Homes Survey COMM- 087861 | October 20, 2016 Seventhwave 121 | P a g e
Window Type 1 Type: jalousie awning slider fixed sldg glss dr skylight other:
Frame: wood/vinyl metal metal w brk Length Width N E S W Glazing: single double triple 1.
Storm: none glass plastic 2. Shading: none awning carport porch 3.
Condition: v loose loose med tight v tight 4. Window Type 2
Type: jalousie awning slider fixed sldg glss dr skylight other: Frame: wood/vinyl metal metal w brk Length Width N E S W
Glazing: single double triple 1. Storm: none glass plastic 2.
Shading: none awning carport porch 3. Condition: v loose loose med tight v tight 4. Window Type 3
Type: jalousie awning slider fixed sldg glss dr skylight other: Frame: wood/vinyl metal metal w brk Length Width N E S W
Glazing: single double triple 1. Storm: none glass plastic 2.
Shading: none awning carport porch 3. Condition: v loose loose med tight v tight 4. Window Type 4
Type: jalousie awning slider fixed sldg glss dr skylight other: Frame: wood/vinyl metal metal w brk Length Width N E S W
Glazing: single double triple 1. Storm: none glass plastic 2.
Shading: none awning carport porch 3. Condition: v loose loose med tight v tight 4. Window Type 5
Type: jalousie awning slider fixed sldg glss dr skylight other: Frame: wood/vinyl metal metal w brk Length Width N E S W
Glazing: single double triple 1. Storm: none glass plastic 2.
Shading: none awning carport porch 3. Condition: v loose loose med tight v tight 4. Window Type 6
Type: jalousie awning slider fixed sldg glss dr skylight other: Frame: wood/vinyl metal metal w brk Length Width N E S W
Glazing: single double triple 1. Storm: none glass plastic 2.
Shading: none awning carport porch 3. Condition: v loose loose med tight v tight 4. Door Type 1 Number: _____ Door Type 2 Number: _____
Type: hlwcore sldcore std MH ins. Steel Type: hlwcore sldcore std MH ins. Steel Size: ____ in. x ____ in. Size: ____ in. x ____ in.
Wndw size: ____ in. x ____ in. Wndw size: ____ in. x ____ in.
Storm: Y/N wstrp needed? Y/N Storm: Y/N wstrp
needed? Y/N

Appendix C
Minnesota Manufactured Homes Survey COMM- 087861 | October 20, 2016 Seventhwave 122 | P a g e
Room A/C NOTE: Take photos of name plates and AC units Location Operable? Yr mfr Capacity (Btuh) EER In storage Notes
1 Y/N 2 Y/N 3 Y/N 4 Y/N
Refrigerators/freezers: Take photos of all name plates. Be sure they are clear and readable Type (see below)
Yr Mfr
Defrost
Location
Refrigerator Primary TF BF SS FD SD CP _____ A/M
Secondary Refrigerator Freezer
1 TF BF SS FD SD CP CF UF _____ A/M __________ 2 TF BF SS FD SD CP CF UF _____ A/M __________ 3 TF BF SS FD SD CP CF UF _____ A/M __________ 4 TF BF SS FD SD CP CF UF _____ A/M __________
Refrigerators: TF = Top-freezer; BT = bottom-freezer; SS = Side-by-side; FD = french door; SD = single-door; CP = compact refr or wine cooler). Freezers: CF = chest freezer; UF = upright freezer
Washer/Dryer Washer
none top-load front-load
Yr mfr _____
Dryer
none elec nat gas LP Yr mfr
_____ Vented to outside?
Y/N
Hot Water Ktch flow:
_______ ml
_______ sec
Ktch temp: _______F
Shwr flow: _______ ml
_______ sec
Flow adj?: Y/N Diverter?: /Y/N Leaks?: Y/N

Appendix C
Minnesota Manufactured Homes Survey COMM- 087861 | October 20, 2016 Seventhwave 123 | P a g e
Lighting Count
Room
Luminaires Bulbs
Incan/Hal CFL Lin. Fluor
LED ceil wall cab flr tbl <50 50 70 90
>125 <13 13 18 21
>28 2’ 4’ 8’ 69 89 125 17 20 28 LV = Living, Kit = Kitchen, DR = Dining, BR = Bedroom, MBR = Master, Mbath = Master Bath, BA = Bath, LA = laundry
Electronics
Number
TV Most-used flatscreen, <23” _____
flatscreen, 23-30” _____ flatscreen, 31-39” _____
flatscreen, 40+” _____ CRT, <23” _____
CRT, 23-30” _____ CRT, 31+” _____
Other _____ TV peripherals
DVD/VCR _____ cable/sat. box _____
gaming system _____ # peripherals for most-used TV (excl cable/sat.) _____
Computer desktop CPU _____ on 24/7?
desktop flatscreen monitor _____ desktop CRT monitor _____
laptop _____ Unusual electrical devices (record on tablet under ad hoc):

Appendix C
Minnesota Manufactured Homes Survey COMM- 087861 | October 20, 2016 Seventhwave 124 | P a g e
Blower door and duct blaster Blower door Duct Blaster
Baseline Pr: _____ Pa
Total leakage leakage to outside
Ring: Open A B
Duct Pr: _____ Pa
Fan Pr: _____ Pa
DB Ring: Open 1 2 3 Open 1 2 3
CFM50:
_____ cfm
DB Fan Pr: _____ Pa _____ Pa
Outdoor temp _____ F
DB CFM25: _____ cfm _____ cfm
Indoor temp _____ F
*If over 500 CFM on Total, take another one in duct farthest away and average.
If over 800 CFM total, needs to be a Pressurization test with no conditioner and no Ring (Open). Pressure Pan
Pressure Readings Room Sup/Ret Kick-out? Pa unable to measure
1 LV Din Kit MBR MBa BR Ba
S/R Y/N
2 LV Din Kit MBR MBa BR Ba S/R Y/N
3 LV Din Kit MBR MBa BR Ba S/R Y/N
4 LV Din Kit MBR MBa BR Ba S/R Y/N
5 LV Din Kit MBR MBa BR Ba S/R Y/N
6 LV Din Kit MBR MBa BR Ba S/R Y/N
7 LV Din Kit MBR MBa BR Ba S/R Y/N
8 LV Din Kit MBR MBa BR Ba
S/R Y/N
9 LV Din Kit MBR MBa BR Ba S/R Y/N
10 LV Din Kit MBR MBa BR Ba S/R Y/N
11 LV Din Kit MBR MBa BR Ba S/R Y/N
12 LV Din Kit MBR MBa BR Ba S/R Y/N
13 LV Din Kit MBR MBa BR Ba S/R Y/N

Appendix C
Minnesota Manufactured Homes Survey COMM- 087861 | October 20, 2016 Seventhwave 125 | P a g e
Delta Q
Implemented?: Y/N Leakage (cfm): _____
EE Opportunities
# Measure Criteria Typ cost
low/med/high Applicable? Notes
1 Duct sealing high CFM25 100/250/700 2 Belly ins fallen/missing 700/1500/2500 3 Ceiling ins <R30; room for addl 300/800/1700 4 Air Sealing high CFM50 200/400/1,000 5 Htg sys repl (condensing) 25+ yrs old 2000/2200/2800 6 Minisplit to offset elec heat elec heat 2500/4000/5500 7 Central A/C repl 15+yrs old 2500/3000/3500 8 Room A/C repl 15+yrs old 250/350/450 9 Window repair broken wndw(s)
10 Interior storm wndws generally leaky wndws 200/400/1000
11 DHW repl (gas/LP) 15+ yrs old 1250/1450/1750 12 Refr repl 15+ yrs old 500/650/800 13 Refr/frzr removal plugged in, <1/4 full 14 Dehum repl 15+ yrs old; used
regularly 175/250/350
15 Int lighting upgrade mostly incan 25/75/175 16 Ext lighting upgrade/controls 24/7 operation
and/or incan
17 Showerhead >2.25 gpm 18 WH temp reduced >130F 19 Tstat setback no current setback 20 Reduce electric space heater use high use 21 Reduce electronics use desktop computer on
24/7; other high use
22 Reduce lighting use lights routinely left on
23 Other: 24 Other: 25 Other:
Interest Level in Opportunities Identified Opp #
(above) Interest level Reasons
___ yes maybe no
___ yes maybe no
___ yes maybe no

Appendix C
Minnesota Manufactured Homes Survey COMM- 087861 | October 20, 2016 Seventhwave 126 | P a g e
Interest Level in Opportunities Identified
Site summary:
Home receive weatherization? Y/N Report requested by owner? Y/N
Sign Off for Gift Card
MINNESOTA MANUFACTURED HOME CHARACTERIZATION STUDY Gift card receipt
My signature below confirms that I have received the $75 gift card as a thank you for the interview by Seventhwave Researchers on behalf of the Minnesota Department of Commerce, Division of Energy Resources, and that I have been advised of (and understand) __ health and safety notes below regarding my home.
Name Signature Date
# Health and safety notes 1
2
3
4
5
Appendix D
Minnesota Manufactured Homes Survey COMM- 087861 | October 20, 2016 Seventhwave 127 | P a g e
Appendix D — Interview guides
Manufactured-Home Park Owner or Manager 1) How big is your park (i.e., how many MH lots do you have in your park)? 2) How many lots are empty? How many have homes that are currently unoccupied? 3) In the last year, how many lots have turned over (new tenants)? How many of those involved
moving a different MH onto the lot? 4) How are energy bills determined, does each home have its own meter (or own service) for all fuel
types? (if no, probe for more detail) 5) Do any of your residents have access to natural gas or propane/fuel oil service (if some do, what
proportion? (ask about continuation for longer version – if ok to ask more, continue) (Begin long version)
6) Do your tenants ever ask you about energy issues (e.g., costs, bills)? What do you suggest? 7) Are you aware of any energy efficiency programs or information offered by your electric (and
gas) utility? Have you worked with the low-income weatherization provider in the area (note: which is not necessarily utility funded)
8) How do mobile home sales usually work – what are the most common types of transactions (i.e., do the homes tend to stay put and new people move in on the same spot, or are sales typically followed by moving the home elsewhere?)
9) Does the park own any of the homes and rent them out? 10) (If yes to 9) Have you ever explored options for improving energy efficiency in homes in your
park? Would you consider going to your utility for information on efficiency? 11) Would you be willing to share information on utility offerings that might save money with your
tenants?
Manufactured-Home Dealer 1) Does your business focus on a specific geographic region in MN? Which one(s)? 2) In your area would you say sales of new MHs are growing in volume, staying steady, or
shrinking? 3) How about for used MHs? 4) Is it the same throughout the state of MN or are there areas where the market is different? 5) What do people look for in a MH? Do they ever ask about energy efficiency (appliances, HVAC,
insulation)? Is this something buyers seem to care about? 6) Do you do any upgrades on used MHs prior to re-selling? If yes, are any of these energy related?
(If appliance replacement is sometimes done) Do you consider energy efficiency when replacing appliances?

Appendix D
Minnesota Manufactured Homes Survey COMM- 087861 | October 20, 2016 Seventhwave 128 | P a g e
7) Are you aware of any efficiency programs offered by utilities that relate to MHs? (If no above) If there were financial incentives for EE upgrades would that make you more likely to do them?
Manufactured-Home Manufacturer Choose manufacturers that build homes for Zone 3 climate zones (can be found on website or through initial phone call)
1) How would you describe production levels in the MH industry right now (i.e., rising, falling steady)?
2) Do you ship homes to Minnesota? Approximately what percentage of your sales are to MN? 3) Are there any production or design steps you take to make your homes energy efficient beyond
the ASHRAE heat loss / heat gain requirements (is there demand in the market for energy-efficiency in MHs)? (e.g., do you install efficient lighting, EnergySTAR appliances, additional underside insulation?)
4) Do you foresee any additional requirements for MH designs in the future (i.e. HUD requirements)?

Appendix E
Minnesota Manufactured Homes Survey COMM- 087861 | October 20, 2016 Seventhwave 129 | P a g e
Appendix E —Energy-Saving Measure Details This appendix provides additional detail about how we assessed the applicability and savings potential for the 30 energy-efficiency and conservation measures that we evaluated for the homes in the on-site sample. It also provides a more detailed table of statistics about each measure that we considered.
Approach
Assessing applicability, savings and cost We used one of three methods for calculating savings for various measures:
1. Algorithms in the Minnesota Technical Reference Manual (TRM), Version 2.0 (DER, n.d.). We used the TRM algorithms for a number of measures. In some cases, we were able to tailor the TRM-based savings estimates to individual homes, because we had site-specific information for one or more inputs (e.g., household size for washer upgrades).
2. Mobile Home Energy Audit software (MHEA), Version 8.9.0.5.28 This computer software was developed by Oak Ridge National Laboratory, and is used by many low-income weatherization programs around the country. We used it to evaluate the savings from insulation, air sealing and duct sealing, with some modifications described later in this appendix.
3. Other algorithms. For measures not in the TRM or in MHEA, we used our own algorithms for estimating savings.
Where available, we used cost information from the Minnesota TRM. In many cases, we assigned typical costs based on program data available to us for low-income weatherization programs that treat manufactured homes in the Midwest. For purely behavioral measures (such as reducing water heater set point), we assigned a nominal cost of $10.
Table 63 provides details about how we determined applicability and assessed savings and cost for each measure.
28 See http://www.waptac.org/Weatherization-Assistant/Weatherization-Assistant-8002E9.aspx

Appendix E
Minnesota Manufactured Homes Survey COMM- 087861 | October 20, 2016 Seventhwave 130 | P a g e
Table 63. Measure applicability, savings and cost details.
ID Measure Applies to Savings estimates
Cost (includes materials
and labor)
1 Air sealing Measured leakage at site-visit of 1,100+ CFM50
Modeled in MHEA based on estimated post-retrofit leakage of 450 + 0.42*pre-retrofit leakage
$350 +$13 per 100 CFM50 reduction
2 Belly (and other foundation) insulation
Observed damaged belly areas with less than original level of insulation; underinsulated foundation spaces for additions.
Modeled in MHEA $75/bag
3 Ceiling insulation Observed underinsulated ceiling areas.
Modeled in MHEA $60/bag for blown fiberglass
$32.50/bag for blown cellulose
4 Wall insulation Observed lack of wall insulation for additions
Modeled in MHEA $2.75/sf for fiberglass batt
$60/bag for blown cellulose
$90/bag for blown fiberglass
5 Window replacement
Single-pane windows.
Modeled in MHEA; mutually exclusive with storm windows
$4 per united inch
6 Door replacement Uninsulated door Modeled in MHEA $650 per door
7 Storm windows Single-pane windows with no storm
Modeled in MHEA; mutually exclusive with storm windows
$16 per square foot

Appendix E
Minnesota Manufactured Homes Survey COMM- 087861 | October 20, 2016 Seventhwave 131 | P a g e
ID Measure Applies to Savings estimates
Cost (includes materials
and labor)
8 Heating system upgrade
Observed non-condensing natural-gas or propane furnace, or low-efficiency oil furnace.
11% savings for natural gas or propane (assumes upgrade from 80% to 90% efficiency); 8% savings for oil furnace (80% to 87%). Percent savings applied to observed or modeled heating energy consumption.
$630 (upgrade cost)
9 Duct sealing Measured duct leakage to outside at time of site visit
Modeled in MHEA, assuming 80% reduction in leakage can be achieved
$50 + $1.75 per 1 cfm reduction in leakage to outside
10 Central air conditioner efficiency upgrade
Existing central A/C at or below SEER 10 and system at least 10 years old
13% cooling savings (based on upgrade from SEER 13 to SEER 15), applied to observed or modeled cooling consumption
$238 per ton nominal capacity upgrade cost, per TRM
11 Upgrade central A/C to heat pump to offset electric resistance heat
Existing electric resistance heat and older central A/C system
64% heating savings (from HSPF of 3.412 to 9.5) applied to observed or modeled estimate of heating energy consumption
$685 (upgrade cost)
12 Room air conditioner efficiency upgrade
Functional room A/C unit that is at least 7 years old
TRM assumptions for baseline and upgrade CEER by size, applied to observed or modeled cooling consumption
$19 to $66 upgrade cost (depending on capacity of unit), per TRM
13 Thermostat setback in the winter
Households reported to practice no (or less than 5F) thermostat setback in the heating season.
1% heating savings per F of additional nighttime setback potential (where potential is difference between 5F and current setback), applied to observed or modeled heating consumption.
$10 nominal assumed cost for behavioral measures

Appendix E
Minnesota Manufactured Homes Survey COMM- 087861 | October 20, 2016 Seventhwave 132 | P a g e
ID Measure Applies to Savings estimates
Cost (includes materials
and labor)
14 Thermostat setback in the summer
Households with central A/C reported to practice no (or less than 5F) thermostat setback in the cooling season.
2% per F of cooling daytime setback potential (no savings for nighttime cooling), applied to observed or modeled cooling consumption.
$10 nominal assumed cost for behavioral measures
15 Reduce use of furnace fan
Households practicing continuous-fan operation at any time during the year without stated need for continuous filtration.
Estimated 700 kWh/yr of savings for reported “occasional” use of fan-on, and 2,600 kWh/yr for year-round operation—unless existing furnace has an ECM blower, in which case assumed 650 kWh/yr for eliminating year-round operation.
$10 nominal assumed cost for behavioral measures
16 Reduce use of electric space heaters
Households reported to use portable electric space heaters
Assumed elimination of electric space heaters. Usage based on estimated % of heating load met by space heaters and observed or modeled heating consumption. Accounts for increase in primary heating fuel consumption
$10 nominal assumed cost for behavioral measures
17 Showerhead replacement
Measured showerhead flow > 1.5 gpm
TRM algorithm for showerheads
$12, per TRM
18 Aerator Measured kitchen-sink flow > 1 gpm
TRM algorithm for aerators
$6.7, per TRM
19 Hot water temperature reduction
Measured hot-water temperature of 130F or higher.
TRM algorithm for temperature reduction
$10 nominal assumed cost for behavioral measures

Appendix E
Minnesota Manufactured Homes Survey COMM- 087861 | October 20, 2016 Seventhwave 133 | P a g e
ID Measure Applies to Savings estimates
Cost (includes materials
and labor)
20 Water heater blanket
Unwrapped electric water heater
TRM algorithm for water heater blanket
$20, per TRM
21 Hot water pipe insulation
Uninsulated hot water piping
TRM algorithm for pipe insulation, assuming 6 feet of insulation
$21.78, per TRM
22 Lighting replacement
Presence of incandescent or halogen lighting
75 percent savings for LED, applied to recorded wattages and location-specific estimated hours of use (see Table 64).
$10.23 per bulb
23 Exterior lighting sensors
Households identified by interview as leaving exterior lights on 24/7.
Assumed 40% savings on 8,760 hrs/yr operation times observed wattage of fixture.
$40 per control device
24 Refrigerator/freezer upgrade
Primary refrigerators or freezers that are not removal candidates and are 10+ years old
49 to 141 kWh/year savings, depending on type, per TRM. Also includes estimated gas heating penalty for reduced electricity consumption during the heating season.
$40 per unit incremental cost, per TRM
25 Refrigerator/freezer remove or unplug
Existing secondary refrigerator or freezer that is plugged in and less than half full (refrigerator) or nearly empty (freezer), where information was available.
350 to 1,450 kWh/year, depending on type and age.
$10 per household educational campaign(?)

Appendix E
Minnesota Manufactured Homes Survey COMM- 087861 | October 20, 2016 Seventhwave 134 | P a g e
ID Measure Applies to Savings estimates
Cost (includes materials
and labor)
26 Clothes washer upgrade
Existing clothes washer is 15+ years old
Use the TRM calculations for savings, but use actual number of household members for annual loads of laundry (assume 2 loads of laundry per person per week)
$119.46 per unit incremental cost, per TRM
27 Desktop computer power management
Homes with desktop computers that are left on 24/7
400 kWh/yr. 29
28 Manage use of electronics
Identified by interviewer as having an opportunity to reduce use of electronics.
307 kWh/year, per TRM $70, per TRM
29 Heat-tape thermostatic control (thermostatic control)
Homes with uncontrolled heat tape and/or heat rod
Savings of 50% based on typical reported manual control schedule, and assumed ability of thermostatic control to achieve equivalent or better savings; usage based on field-study data.
$60 for thermostatic controller.
30 Manage dehumidifier use
Dehumidifier reported to be used frequently
Estimated 100 kWh savings potential
$10 nominal assumed cost for behavioral measures
29 Based on Bensch et al. (2010).

Appendix E
Minnesota Manufactured Homes Survey COMM- 087861 | October 20, 2016 Seventhwave 135 | P a g e
Table 64. Estimated typical lighting hours of operation, by room type.
Room type
Average daily hours of
operation
kitchen 2.3
living, dining, and family 2.0
entry or hallway 1.5
master bedroom 1.6
other bedrooms 1.6
bathrooms 1.6
laundry or utility room 1.7
closets 1.4
garage 1.6
outdoor 2.6
other 1.5
Based on Ashe (2012)
Appendix E
Minnesota Manufactured Homes Survey COMM- 087861 | October 20, 2016 Seventhwave 136 | P a g e
MHEA modeling details For those familiar with MHEA, there are a several differences in how we used the software for our purposes compared to how it is typically used:
• We only modeled insulation, air sealing and duct sealing using MHEA; we used TRM or other methods for other measures.
• We did not use MHEA to evaluate cost-effectiveness. We set the MHEA allowable benefit/cost ratio to a very low number so that MHEA would select all measures, then screened these measures for cost-effectiveness outside of MHEA.
• We adjusted MHEA’s heating and cooling savings estimates for degree-day differences for local site conditions. MHEA provides only three weather stations for Minnesota (Minneapolis, Rochester and Duluth), but we assigned our sites to one of nine Minnesota stations. We evaluated each site in MHEA using the nearest MHEA station, but then adjusted savings estimates using the ratio of heating or cooling degree days between the nearest station and the MHEA station.
• We applied a generic bias-correction factor for sites where we lacked actual consumption data. MHEA has the capability to true up savings estimates to actual consumption histories. However, we had information on actual heating consumption for only 22 of 99 sites, and information on cooling consumption for 53. We therefore, regressed observed consumption against MHEA’s predicted consumption for cases where we had both, and used the resulting regression fits to adjust MHEA’s estimates for cases where we lacked information on actual consumption. Figure 39 shows the results of this analysis.

Appendix E
Minnesota Manufactured Homes Survey COMM- 087861 | October 20, 2016 Seventhwave 137 | P a g e
Figure 39. Observed versus MHEA-predicted space heating and cooling consumption.
0
50
100
150
200
Obs
erve
d he
atin
g co
nsum
ptio
n (1
0^6
BTU
)
0 50 100 150 200
Predicted heating consumption (10^6 BTU)
0
500
1,000
1,500
2,000
2,500
3,000
3,500
4,000
Obs
erve
d co
olin
g co
nsum
ptio
n (k
Wh)
0 500 1,000 1,500 2,000 2,500 3,000 3,500 4,000
Predicted cooling consumption (kWh)

Appendix E
Minnesota Manufactured Homes Survey COMM- 087861 | October 20, 2016 Seventhwave 138 | P a g e
Fuel Costs We used the following statewide average fuel costs for the study, based mainly on recent Energy Information Agency (EIA) statistics for Minnesota:
• Electricity: 13.05 cents per kWh —EIA residential price for May 2016 • Natural gas: 84.9 cents per therm (88.4 cents per ccf) — EIA residential price for 2015 • Propane: $1.55 per gallon —average of EIA residential prices over the 2014/15 and
2015/16 heating seasons • Fuel oil: $2.31 per gallon — average of EIA residential prices over the 2014/15 and
2015/16 heating seasons • Wood: $225 per (20 million Btu) cord — estimated
Cost Effectiveness In addition to calculating the simple payback period for each opportunity in each home, we also calculated a discounted, life-cycle benefit/cost ratio for each measure. We used a 3 percent societal discount rate, and Census Region 2 project fuel-price indices from Lavappa and Kneifel (2015) to calculate the discounted, life-cycle value of energy savings, which we then divided by the cost of the measure.

Appendix E
Minnesota Manufactured Homes Survey COMM- 087861 | October 20, 2016 Seventhwave 139 | P a g e
Detailed Measure Results
Table 65 provides detailed statistics about each measure that we evaluated for the 99 homes in the field sample, and the text below describes the items in the table in more detail. Note that proportions, means and medians reported in Table 65 are weighted using the case weights described in Appendix A.
Technical incidence – the percent of homes in the field sample where there was judged to be a technical opportunity for the measure, regardless of cost-effectiveness.
Median payback – median simple payback period (years) for all homes in the field sample where there was judged to be a technical opportunity for the measure.
Median SIR – median discounted, life-cycle savings-to-investment ratio for all homes in the field sample where there was judged to be a technical opportunity for the measure.
Cost-effective incidence – the percent of homes in the field sample with a cost-effective opportunity for the measure, based on a discounted, life-cycle analysis.
Mean cost – mean cost for the measure, where a cost-effective opportunity exists among the field-sample homes. Cost is the full cost for retrofit and behavioral measures, and the upgrade cost from a standard to a high-efficiency model for upgrade measures. Costs for purely behavioral opportunities are set to $10.
Mean dollar savings – mean annual energy-cost savings (all fuels), where a cost-effective opportunity was judged to be present in the field sample of homes.
Mean kWh – mean annual electricity savings (kWh/year), where a cost-effective opportunity exists, and electricity savings are non-zero in the field sample of homes.
Mean therms – mean annual natural-gas savings (therms/year), where a cost-effective opportunity exists, and gas savings are non-zero in the field sample of homes.

Appendix E
Minnesota Manufactured Homes Survey COMM- 087861 | October 20, 2016 Seventhwave 140 | P a g e
Table 65. Detailed measure results.
Measure Parameter Overall Park Non-park
Low-incom
e
Non-low-
income Air sealing Tech. incidence 96% 99% 93% 98% 94% (Retrofit) Median
payback 20.1 27.7 13.8 16.3 25.9
Life: 20 yrs Median SIR 0.78 0.61 1.01 0.98 0.61 C.E. incidence 36% 27% 48% 49% 27% Mean Cost $494 $447 $526 $535 $438 Mean $ savings $58 $35 $74 $73 $38 Mean kWh 119 86 152 137 107 Mean therms 29.0 28.1 31.2 39.1 22.8 Belly/Floor insulation Tech. incidence 22% 15% 31% 37% 11% (Retrofit) Median
payback 10.7 11.6 8.0 10.7 2.4
Life: 20 yrs Median SIR 1.49 1.48 2.02 1.49 7.30 C.E. incidence 17% 10% 24% 24% 11% Mean Cost $700 $663 $719 $788 $558 Mean $ savings $111 $57 $138 $102 $125 Mean kWh 206 15 339 349 44 Mean therms 64.9 63.5 73.1 60.6 67.9 Ceiling insulation Tech. incidence 15% 10% 21% 22% 9% (Retrofit) Median
payback 15.4 15.4 12.6 21.7 12.6
Life: 20 yrs Median SIR 1.11 1.11 1.28 0.67 1.28 C.E. incidence 9% 7% 12% 9% 9% Mean Cost $911 $766 $1,014 $866 $944 Mean $ savings $166 $62 $239 $150 $177 Mean kWh 631 36 1,054 267 896 Mean therms 64.2 66.7 61.5 96.1 50.6 Window replacement Tech. incidence 21% 15% 27% 26% 17% (Retrofit) Median
payback 37.6 54.0 30.4 31.8 49.5
Life: 20 yrs Median SIR 0.43 0.32 0.53 0.50 0.36 C.E. incidence 4% 0% 9% 2% 6% Mean Cost $717 $717 $1,552 $504 Mean $ savings $45 $45 $99 $31 Mean kWh 149 149 679 14 Mean therms Door replacement Tech. incidence 48% 60% 34% 43% 53% (Retrofit) Median
payback 216.7 216.7 130.0 216.7 216.7
Life: 20 yrs Median SIR 0.08 0.07 0.13 0.08 0.08 C.E. incidence 0% 0% 0% 0% 0%

Appendix E
Minnesota Manufactured Homes Survey COMM- 087861 | October 20, 2016 Seventhwave 141 | P a g e
Measure Parameter Overall Park Non-park
Low-incom
e
Non-low-
income Mean Cost Mean $ savings Mean kWh Mean therms Storm windows Tech. incidence 64% 63% 66% 60% 68% (Retrofit) Median
payback 115.2 154.3 92.3 112.7 115.2
Life: 20 yrs Median SIR 0.14 0.11 0.18 0.15 0.14 C.E. incidence 1% 0% 2% 2% 0% Mean Cost $44 $44 $44 Mean $ savings $5 $5 $5 Mean kWh Mean therms Furnace upgrade Tech. incidence 58% 64% 50% 59% 57% (Upgrade) Median
payback 9.7 9.8 5.5 9.3 9.8
Life: 20 yrs Median SIR 1.79 1.75 2.91 1.87 1.75 C.E. incidence 54% 58% 50% 59% 51% Mean Cost $630 $630 $630 $630 $630 Mean $ savings $76 $63 $95 $82 $71 Mean kWh Mean therms 71.7 72.3 69.5 77.0 67.6 Duct sealing Tech. incidence 86% 87% 84% 94% 80% (Retrofit) Median
payback 9.0 11.2 7.4 8.0 11.2
Life: 20 yrs Median SIR 1.88 1.56 2.20 2.11 1.56 C.E. incidence 75% 76% 74% 86% 66% Mean Cost $316 $328 $301 $366 $267 Mean $ savings $47 $38 $57 $59 $35 Mean kWh 79 44 130 120 49 Mean therms 35.4 39.0 20.4 46.8 28.0 Central A/C upgrade Tech. incidence 33% 36% 29% 27% 37% (Upgrade) Median
payback 11.6 11.6 14.4 14.2 11.6
Life: 18 yrs Median SIR 1.18 1.28 0.70 1.06 1.28 C.E. incidence 22% 31% 11% 19% 24% Mean Cost $577 $586 $546 $565 $584 Mean $ savings $60 $50 $97 $70 $55 Mean kWh 462 385 741 538 417 Mean therms Upgrade to ASHP Tech. incidence 1% 0% 3% 0% 2% (Upgrade) Median 0.6 0.6 0.6

Appendix E
Minnesota Manufactured Homes Survey COMM- 087861 | October 20, 2016 Seventhwave 142 | P a g e
Measure Parameter Overall Park Non-park
Low-incom
e
Non-low-
income payback
Life: 18 yrs Median SIR 23.70 23.70 23.70 C.E. incidence 1% 0% 3% 0% 2% Mean Cost $685 $685 $685 Mean $ savings $1,080 $1,080 $1,080 Mean kWh 8,276 8,276 8,276 Mean therms RAC A/C upgrade Tech. incidence 12% 18% 5% 15% 9% (Upgrade) Median
payback 17.2 21.8 13.5 14.3 70.0
Life: 9 yrs Median SIR 0.48 0.38 0.60 0.48 0.16 C.E. incidence 3% 5% 0% 1% 4% Mean Cost $43 $43 $43 $43 Mean $ savings $8 $8 $6 $8 Mean kWh 57 57 42 61 Mean therms Heating tstat settings Tech. incidence 71% 68% 76% 80% 65% (Behavioral)` Median
payback 0.4 0.4 0.3 0.3 0.4
Life: 2 yrs Median SIR 5.20 4.80 6.80 5.50 5.20 C.E. incidence 71% 68% 76% 80% 65% Mean Cost $10 $10 $10 $10 $10 Mean $ savings $31 $24 $39 $34 $28 Mean kWh Mean therms 26.6 26.4 27.2 30.6 22.9 Cooling tstat settings Tech. incidence 41% 54% 26% 28% 52% (Behavioral) Median
payback 0.8 0.8 1.0 1.0 0.8
Life: 2 yrs Median SIR 2.40 2.40 2.00 2.00 2.40 C.E. incidence 39% 53% 22% 26% 48% Mean Cost $10 $10 $10 $10 $10 Mean $ savings $17 $16 $21 $18 $17 Mean kWh 130 119 161 136 127 Mean therms Fan settings Tech. incidence 8% 7% 10% 9% 7% (Behavioral) Median
payback 0.1 0.1 0.2 0.2 0.1
Life: 3 yrs Median SIR 23.50 23.50 18.70 18.70 23.50 C.E. incidence 8% 7% 10% 9% 7% Mean Cost $10 $10 $10 $10 $10 Mean $ savings $75 $80 $72 $67 $83 Mean kWh 681 700 664 659 700

Appendix E
Minnesota Manufactured Homes Survey COMM- 087861 | October 20, 2016 Seventhwave 143 | P a g e
Measure Parameter Overall Park Non-park
Low-incom
e
Non-low-
income Mean therms -13.6 -13.6 -14.9 -13.3 Portable space heaters Tech. incidence 31% 24% 39% 33% 30% (Behavioral) Median
payback 0.0 0.0 0.0 0.0 0.0
Life: 2 yrs Median SIR 46.00 48.00 32.80 21.40 54.40 C.E. incidence 26% 22% 30% 20% 30% Mean Cost $10 $10 $10 $10 $10 Mean $ savings $313 $239 $382 $295 $323 Mean kWh 3,554 2,575 4,448 4,359 3,142 Mean therms -113.8 -107.7 -132.4 -92.5 -119.7 Showerhead Tech. incidence 62% 70% 52% 50% 71% (Retrofit) Median
payback 0.7 0.8 0.6 0.6 0.7
Life: 10 yrs Median SIR 13.25 11.75 14.75 14.75 13.25 C.E. incidence 62% 70% 52% 50% 71% Mean Cost $12 $12 $12 $12 $12 Mean $ savings $22 $20 $25 $24 $21 Mean kWh 239 261 218 252 230 Mean therms 9.3 9.8 3.6 7.7 9.9 Aerator Tech. incidence 86% 90% 81% 80% 90% (Retrofit) Median
payback 1.7 3.3 1.3 1.7 1.7
Life: 10 yrs Median SIR 4.93 3.13 6.57 5.22 4.93 C.E. incidence 81% 81% 81% 75% 85% Mean Cost $7 $7 $7 $7 $7 Mean $ savings $4 $4 $6 $5 $4 Mean kWh 46 42 49 54 41 Mean therms 2.1 2.2 1.9 1.8 2.3 DHW setpoint Tech. incidence 30% 29% 32% 33% 28% (Behavioral) Median
payback 0.5 0.7 0.5 0.5 0.7
Life: 2 yrs Median SIR 3.70 3.00 3.70 3.70 3.00 C.E. incidence 30% 27% 32% 32% 28% Mean Cost $10 $10 $10 $10 $10 Mean $ savings $28 $18 $37 $37 $20 Mean kWh 264 184 303 351 175 Mean therms 16.7 16.7 14.4 17.5 Elec WH wrap Tech. incidence 61% 47% 78% 62% 60% (Retrofit) Median
payback 1.2 1.3 1.2 1.1 1.3
Life: 5 yrs Median SIR 4.05 3.80 4.05 4.40 3.80 C.E. incidence 61% 47% 78% 62% 60%

Appendix E
Minnesota Manufactured Homes Survey COMM- 087861 | October 20, 2016 Seventhwave 144 | P a g e
Measure Parameter Overall Park Non-park
Low-incom
e
Non-low-
income Mean Cost $20 $20 $20 $20 $20 Mean $ savings $17 $16 $18 $18 $17 Mean kWh 159 144 169 164 154 Mean therms -3.1 -3.0 -3.4 -3.3 -3.0 WH pipe insulation Tech. incidence 86% 85% 88% 88% 85% (Retrofit) Median
payback 0.8 1.1 0.8 0.8 0.8
Life: 13 yrs Median SIR 15.52 10.74 15.52 15.52 15.52 C.E. incidence 86% 85% 88% 88% 85% Mean Cost $22 $22 $22 $22 $22 Mean $ savings $24 $20 $28 $27 $21 Mean kWh 238 250 231 254 225 Mean therms 11.0 10.8 13.1 13.9 9.4 LED lighting replacement Tech. incidence 96% 99% 93% 99% 94% (Retrofit) Median
payback 2.6 2.7 2.5 2.5 2.7
Life: 15 yrs Median SIR 4.95 4.86 5.19 5.19 4.86 C.E. incidence 96% 99% 93% 99% 94% Mean Cost $239 $190 $303 $222 $252 Mean $ savings $91 $72 $117 $86 $95 Mean kWh 711 559 910 668 744 Mean therms -1.4 -1.3 -1.8 -1.4 -1.4 Outdoor lighting controls Tech. incidence 75% 83% 65% 67% 81% (Retrofit) Median
payback 17.1 20.0 12.3 17.1 13.3
Life: 15 yrs Median SIR 0.75 0.60 1.02 0.74 0.93 C.E. incidence 22% 11% 35% 20% 23% Mean Cost $134 $59 $162 $120 $144 Mean $ savings $17 $8 $20 $17 $16 Mean kWh 126 58 151 134 121 Mean therms Refr/frzr replacement Tech. incidence 66% 60% 75% 65% 68% (Upgrade) Median
payback 3.3 3.1 3.3 3.3 3.3
Life: 14 yrs Median SIR 3.78 4.07 3.78 3.78 3.78 C.E. incidence 66% 60% 75% 65% 68% Mean Cost $40 $40 $40 $40 $40 Mean $ savings $13 $14 $12 $13 $13 Mean kWh 121 123 119 119 122 Mean therms -2.5 -2.6 -2.3 -2.5 -2.6 Second freezer replacement Tech. incidence 36% 26% 48% 47% 28% (Upgrade) Median 6.7 6.7 4.0 6.7 6.7

Appendix E
Minnesota Manufactured Homes Survey COMM- 087861 | October 20, 2016 Seventhwave 145 | P a g e
Measure Parameter Overall Park Non-park
Low-incom
e
Non-low-
income payback
Life: 14 yrs Median SIR 1.95 1.67 2.95 1.95 1.70 C.E. incidence 36% 26% 48% 47% 28% Mean Cost $40 $40 $40 $40 $40 Mean $ savings $8 $6 $9 $9 $7 Mean kWh 66 53 74 71 60 Mean therms -1.1 -1.1 -1.4 -1.2 -1.0 Second ref/frzr removal Tech. incidence 8% 3% 14% 12% 5% (Behavioral) Median
payback 1.6 2.2 1.6 1.6 1.5
Life: 8 yrs Median SIR 4.75 3.39 4.75 4.75 7.16 C.E. incidence 8% 3% 14% 12% 5% Mean Cost $92 $92 $92 $92 $92 Mean $ savings $77 $42 $86 $70 $88 Mean kWh 649 375 722 606 725 Mean therms -8.0 -8.0 -8.0 Washer upgrade Tech. incidence 31% 31% 32% 42% 24% (Upgrade) Median
payback 8.5 8.5 8.5 8.5 8.5
Life: 11 yrs Median SIR 1.13 1.13 1.13 1.13 1.13 C.E. incidence 22% 18% 27% 28% 18% Mean Cost $119 $119 $119 $119 $119 Mean $ savings $20 $26 $16 $22 $19 Mean kWh 153 196 117 164 139 Mean therms 3.7 3.8 3.6 4.0 3.3 Computer power management
Tech. incidence 12% 16% 8% 11% 14%
(Behavioral) Median payback
0.2 0.2 0.2 0.2 0.2
Life: 2 yrs Median SIR 8.90 8.90 9.10 8.90 8.90 C.E. incidence 12% 16% 8% 11% 14% Mean Cost $10 $10 $10 $10 $10 Mean $ savings $51 $48 $57 $50 $51 Mean kWh 475 437 572 472 476 Mean therms -8.4 -8.5 -7.6 -8.0 -8.5 Manage use of electronics Tech. incidence 1% 2% 0% 3% 0% (Behavioral) Median
payback 2.0 2.0 2.0
Life: 8 yrs Median SIR 3.66 3.66 3.66 C.E. incidence 1% 2% 0% 3% 0% Mean Cost $70 $70 $70 Mean $ savings $35 $35 $35

Appendix E
Minnesota Manufactured Homes Survey COMM- 087861 | October 20, 2016 Seventhwave 146 | P a g e
Measure Parameter Overall Park Non-park
Low-incom
e
Non-low-
income Mean kWh 307 307 307 Mean therms -6.5 -6.5 -6.5 heat tape switch or unplug Tech. incidence 88% 90% 87% 92% 86% (Behavioral) Median
payback 2.1 2.1 2.3 2.3 2.1
Life: 20 yrs Median SIR 7.48 7.48 6.00 6.00 7.97 C.E. incidence 84% 89% 79% 83% 86% Mean Cost $60 $60 $60 $60 $60 Mean $ savings $33 $32 $34 $28 $36 Mean kWh 252 247 258 214 279 Mean therms Dehumidifier habits Tech. incidence 9% 6% 14% 6% 12% (Behavioral) Median
payback 0.8 0.8 0.8 0.8 0.8
Life: 2 yrs Median SIR 2.60 2.60 2.60 2.60 2.60 C.E. incidence 9% 6% 14% 6% 12% Mean Cost $10 $10 $10 $10 $10 Mean $ savings $13 $13 $13 $13 $13 Mean kWh 100 100 100 100 100 Mean therms

Appendix F
Minnesota Manufactured Homes Survey COMM- 087861 | October 20, 2016 Seventhwave 147 | P a g e
Appendix F — Weather Normalization of Consumption Histories For homes in the study where we were able to obtain actual energy-consumption histories, we analyzed these data in relation to weather data to perform two important functions: (1) disaggregate weather-sensitive space heating and air conditioning use from other uses; and, (2) adjust heating and cooling consumption to long-term average weather conditions. This appendix provides details about the weather-normalization procedures that we used.
Given a history of monthly electricity or gas consumption for a given home and a database of daily outdoor temperatures for a nearby weather station, we fit one of four models to the data:
1. Model 1 (heating-only): Use per day = α + βhhτh + ε 1. Model 2 (cooling-only): Use per day = α + βchτc + ε 2. Model 3 (heating-and-cooling): Use per day = α + βhhτh + βchτc + ε 3. Model 4 (no-heating-or-cooling): Use per day = α + ε
where,
α ≡ non-weather sensitive (or base) use per day
βh,c ≡ use per heating or cooling degree day
hh,c ≡ average heating or cooling degree days per day from base temperature τh,c, which in turn is calculated from daily average outdoor temperatures (Tavg) as:
Hh ≡ max(τh – Tavg,0)
Hc ≡ max(Tavg - τc,0)
and then averaged over the consumption period
τh,c ≡ base temperature for calculating heating or cooling degree days
ε ≡ random error component
Model 1 (heating only) is appropriate for analyzing gas usage for houses with gas space heat or electrically-heated homes with no air conditioning. Model 2 (cooling only) is appropriate for analyzing electricity usage for houses with air conditioning but no electric space heat. Model 3 is appropriate for analyzing houses with electric space heat and air conditioning. Model 4 is appropriate for gas or electricity consumption where no space-heating or space-cooling equipment is present.
For each of the first three models, the α, β, and τ coefficients are fit individually to each house using a modified least-squares approach that searches across a range of τ values, and chooses the value(s) of τ with the best fit (r2). An additional Bayesian component effectively restricts τ to be in a range that is typical of most homes, unless the improvement in fit is large.30 The fourth
30 Specifically, we employed a Gaussian loss function centered at 60F with a standard deviation of 8F for τh,c.

Appendix F
Minnesota Manufactured Homes Survey COMM- 087861 | October 20, 2016 Seventhwave 148 | P a g e
model (no heating or cooling) is simply fit as the average consumption per day of the period analyzed.
We started by fitting all models to each home, and used goodness-of-fit criteria to select the most appropriate one. We then compared the selected models to the reported end-uses for the home, and selected a more appropriate model as needed. For example, if the algorithms selected a cooling model for electricity, but the household reported no air conditioning equipment, we over-rode the default model selection.
Once the appropriate model is fit to the data, weather-normalized annual use for each component can be calculated using long-term average heating and/or cooling degree days at the fitted value(s) of τ. The long-term averages that we used were based on the period 1981-2010.