ministry of mines and energy luis ernesto mejía … · manuel fernando maiguashca olano...
TRANSCRIPT


MINISTRY OF MINES AND ENERGY Luis Ernesto Mejía Castro Minister Manuel Fernando Maiguashca Olano Viceminister MINING ENERGY PLANNING UNIT – UPME Carlos Arturo Flórez Piedrahita General Director Jairo Herrera Arango Mining Planning Assistant Director Mining Planning Assistant Directorate Technical Team Álvaro Ponce Muriel Gloria Patricia Gamba Saavedra Luz Constanza Fierro Enciso María Claudia Díaz Orozco Sergio Alonso Mejía Tobón Editorial text: Luz Constanza Fierro Enciso Gloria Patricia Gamba Saavedra Official Translation by Las Traducciones EU www.lastraducciones.com Based on the report of the study “Evaluation of the potential demand of Colombian coal in the national and international market”, carried out for the UPME by Alfonso José Ruan Gómez Mining Energy Planning Unit – UPME, 2006 ISBN: 958-97750-7-1 Design, prepress and printing: IMPRESOS LEAL Bogotá, D.C. March of 2006.

TABLE OF CONTENTS PRESENTATION 5 INTRODUCTION 7 1. THE GLOBAL COAL MARKET 9 1.1 TRADE FLOWS 17 1.2 MAIN HISTORICAL JUNCTURES 21 2. THE NATIONAL MARKET 25 3. CHARACTERIZATION OF THE MARKET PER TYPE OF COAL 35 3.1 THERMAL COAL 37 3.1.1 International Market 37 3.1.2 National Market 41 3.2 COKING COAL 44 3.2.1 International Market l 44 3.2.2 National Market 50 3.3 COKE 52 3.3.1 International Market 52 3.3.2 National Market 56 4. POSITIONING OF COLOMBIAN COAL ON THE INTERNATIONAL MARKET 59 4.1 OPPORTUNITY COSTS AND PRICE STRUCTURE 61 4.2 ANALYSIS OF THE POSSIBILITIES OF COLOMBIAN COAL FROM THE INLAND 63 4.3. STRATEGIES FACING POSSIBLE ENVIRONMENTAL RESTRICTIONS 64

4.3.1 Impact of the Kyoto Protocol on the global coal demand 64 4.3.2 Strategies for Colombian coal 65 4.4 POSSIBILITIES OF MARKETING SERVICES IN THE CONTEXT OF REGIONAL
TREATIES OR AGREEMENTS 65 4.4.1 Free Trade Area of the Americas (FTAA) agreement with the United States 66 4.4.2 Intraregional Trade 66 4.4.3 Service sales in the past 67 5. OPPORTUNITIES IN THE HEMISPHERICAL MARKET 69 5.1 THERMAL COAL 71 5.1.1 Atlantic Coast 71 5.1.2 Pacific Coast 73 5.2 COKING COAL 73 5.2.1 Atlantic Coast 73 5.2.2 Pacific Coast 74 5.3 COKE 75 5.3.1 Atlantic Coast 75 5.3.2 Pacific Coast 76 6. MAIN IMPORTATION COMPANIES 77 6.1 THERMAL COAL CONSUMER COMPANIES 79 6.2 FERROUS AND NON-FERROUS FOUNDRIES 80 6.3 COKE IMPORTING IRON AND STEEL INDUSTRIES 81 7. ESTABLISHMENT AND CHARACTERIZATION OF THE MAIN NICHE MARKETS 83 8. ACTIONS TO FAVOR MARKET PENETRATION OR GROWTH 87
9. MEASURES TO PROMOTE THE USE OF COAL IN THE COUNTRY 91 9.1 USE OF COAL AS AN ENERGY SUBSTITUTE 96 9.2 COAL PRICES WITH RESPECT TO OTHER SUBSTITUTES 97 BIBLIOCHARTICAL REFERENCES 101 GLOSSARRY AND UNITS OF MEASUREMENT 105

PRESENTATION Coal represents an important source of energy and economic resources for the country. Given the quality of the reserves that exist in the different geoChartical zones, it is indispensable to have enough information to have access to the national and international markets. This allows increasing the revenue generated by royalties and foreign currencies. For the actors involved in this business, it is necessary to have reliable statistical information to allow them to learn about the behavior of the coal market, not only on a national, but also on an international level, and about the possible market niches that they may have access to, given that information is the first element of promotion of any activity. The Mining and Energy Planning Unit delivers this document as a source of statistical information in order that those who are interested may have a foundation that will allow them to gain access to the different markets that are regarded as promising for the Colombia. CARLOS ARTURO FLOREZ PIEDRAHITA General Director

INTRODUCTION This document consolidates an analysis of the national and global environment of the demand for coals, and the possibilities of Colombian coals in these markets are contextualized. This in turn generates specific recommendations before the national market and regional negotiations such as ALCA, MERCOSUR, the FTAA, the Market of the European Union and the Asian Market. The chapter on the international environment contains an analysis of the market situation where we include reserves, production, producing countries, consumption, supply, demand, trade flows and the main historical junctures which occurred during the 1980 – 2004 period. The analysis that is made of the national market contains reserves, production and internal consumption. A characterization is made per types of coal, and furthermore, coke is included as a product with an added value which is significantly important for the country. To achieve positioning of Colombian coal on the international market, opportunity costs, price structure and the possibilities of Colombian coal were analyzed. The coal from inland Colombia was given a greater emphasis. In order to have a general vision of the existing opportunities on the hemispherical market, we describe the behavior of Colombian coal exports, which are shipped from the Atlantic in coach, and according to the type of coal. In order to approach the access to global markets, there is a series of annexes which include the directory of the main importing companies, thermal coal consuming companies, ferrous and non-ferrous foundries and iron and steel industries that import coke. These may be used as reference by those who are interested in the Assistant Directorate of Mining Planning of the Mining Energy Planning Unit - UPME.


CHAPTER 1 THE GLOBAL COAL MARKET

CHAPTER 1 THE GLOBAL COAL MARKET
1. THE GLOBAL COAL MARKET Reserves Proven coal reserves in the world at the end of 2004 totaled 984.453 billion tons, of which 519.062 billion tons correspond to anthracitic and bituminous coals and 465.391 billion tons to the sub-bituminous and lignite type3. This makes coal the most plentiful of all fossil fuels in the world, with recoverable reserves in more than 50 countries, which at the current rates of production could last more than 200 years.
Chart 1. PROVED COAL RESERVES ON A GLOBAL LEVEL (Mt)
Source: British Petroleum Company, Statistical Review of World Energy 2005
Production During 2004 global production of coal was over 4300 Mt to meet the needs of the international demand and of global consumption. This shows a notable positive tendency with respect to 1980, accounting for a 54% growth which corresponds to an additional 1,500 Mt:
Chart 2. GLOBAL COAL PRODUCTION 1980 – 2004*
3 World Energy Council 2004

Source: U.S. International Energy Agency - IEA (2004) 2004*: Estimate Assistant Directorate of Mining Planning - UPME
The evolution of global production is the result of the positive behavior shown mainly by countries in Asia, which contributed over 1,275 Mt more, which equal an increase of 164,5% in this region, followed by North America, which accounted for 228 Mt more with a growth rate of 31.1%. In 2004, Asia's share in global production was 49.6% and North America´s was 23.3%. With a share of 6.1%, Africa had an increase of 108.9% during the period. On the other hand, there was a negative growth of 40.9% and 62.0% in the production levels of Russia and European countries, respectively, most notably reducing their share in the world total.
Chart 3. COAL PRODUCTION BY REGION
1980 - 2004*
Source: U.S. International Energy Agency - IEA (2004) 2004* : Estimate Assistant Directorate of Mining Planning UPME (1) Does not include Japan and Korea
In terms of producing countries, during the period studied, China generated the greatest contribution, accounting for a production 2.7 times greater than the amounts produced in 1980. This puts China in the first place, with an increase of 174.5% during 2004. Likewise, there are significant growth is in India, Australia, South Africa and Indonesia (more than 200%), which

makes them the main producing countries in the world. The United States, on the other hand, had an increase of 29.7% during the period. In the case of countries such as Russia and Poland, there was a notable reduction of close to 21.9% and 49.4% respectively.
Chart 4. COAL PRODUCING COUNTRIES 2004 *
Source: U.S. International Energy Agency - IEA (2004) 2004*: Provisional
Consumption An increase in the global consumption of coal of close to 54.0% was recorded during the period studied, when it went from 2,780 Mt in 1980 to 4,282 Mt in 2004.
Chart 5. GLOBAL CONSUMPTION OF COAL 1980- 2004*
Source: U.S. International Energy Agency - IEA (2004) 2004*: Estimate Assistant Directorate of Mining Planning UPME
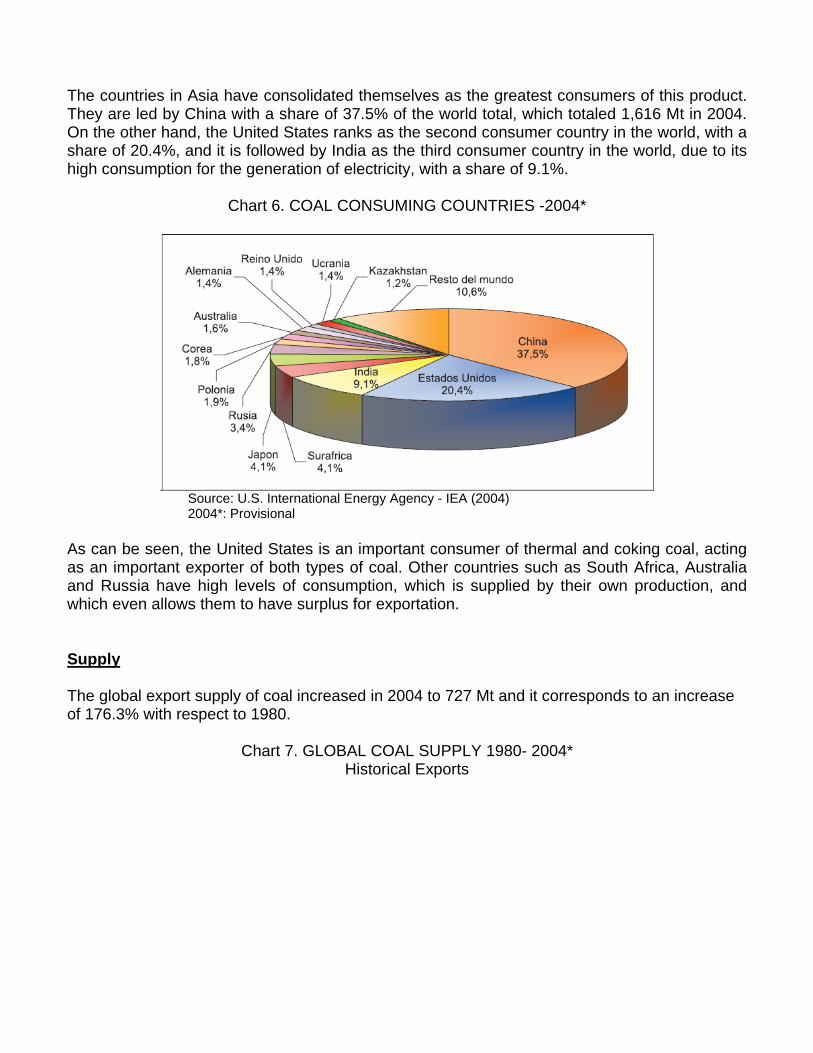
The countries in Asia have consolidated themselves as the greatest consumers of this product. They are led by China with a share of 37.5% of the world total, which totaled 1,616 Mt in 2004. On the other hand, the United States ranks as the second consumer country in the world, with a share of 20.4%, and it is followed by India as the third consumer country in the world, due to its high consumption for the generation of electricity, with a share of 9.1%.
Chart 6. COAL CONSUMING COUNTRIES -2004*
Source: U.S. International Energy Agency - IEA (2004) 2004*: Provisional
As can be seen, the United States is an important consumer of thermal and coking coal, acting as an important exporter of both types of coal. Other countries such as South Africa, Australia and Russia have high levels of consumption, which is supplied by their own production, and which even allows them to have surplus for exportation. Supply The global export supply of coal increased in 2004 to 727 Mt and it corresponds to an increase of 176.3% with respect to 1980.
Chart 7. GLOBAL COAL SUPPLY 1980- 2004* Historical Exports

Source: U.S. International Energy Agency - IEA (2004) 2004*: Estimate, Assistant Directorate of Mining Planning UPME
The behavior of the supply in 2004 has been driven mainly by the evolution and importance of Australia in terms of the exported amounts, which makes it the first exporter of the product with a share of 29.0% of the total. China, Indonesia and South Africa follow with 13.0%, 12.5% and 9.9% respectively. During the 1998-2004 period, Colombia became part of the global scene of coal and in 2004 it ranked sixth among the main exporting countries with a share of 6.4%, fueled mainly by the high international prices of the moment which climbed on an average to 58.1 US$/t for 11.300 BTU and to 59.5 US$/t for 11.600 BTU. In the case of Russia, there was a variable behavior given that during the 1990-1998 period it reduced its export supply by 57% and had an increase of 148.7% in 2004. The United States, on the other hand, steadily reduced its exports reaching 52.4% with respect to 1980.
Chart 8. COAL EXPORTING COUNTRIES 1980 - 2004*
Source: U.S. International Energy Agency - IEA (2004) 2004*: Estimate, Assistant Directorate of Mining Planning - UPME

Demand Global coal demand grew steadily during the 1980-2004 period, with an average increase of 4.5%. Asian countries, led by Japan, have remained as the main importers accounting for close to 40.6% of the global demand.
Chart 9. GLOBAL COAL DEMAND 1980- 2004*
Source: U.S. International Energy Agency - IEA (2004) 2004*: Estimate, Assistant Directorate of Mining Planning - UPME
Germany, the United Kingdom, Spain, Netherlands, Italy and France are also among the main importing countries. All together their share accounts for 20% of the world total. The United States and Canada have been increasing their demand since the 80s and are currently taking 3.2% and 2.8% of global importations respectively.
Chart 10. COAL IMPORTING COUNTRIES 1980- 2004*
Source: U.S. International Energy Agency - IEA (2004) 2004*: Estimate, Assistant Directorate of Mining Planning - UPME

1.1 TRADE FLOWS Asia-Pacific Trade The coal trade in Asia-Pacific increased considerably during the period, going from 80 Mt in 1980 to 288 Mt in 2003. Per type of coal, approximately 179 Mt of thermal coal were imported; this equals 51.0% of global importations and 108 Mt of coking coal were imported; that is, 66,0% of the total. Japan has been the greatest importer of coal, both thermal and coking coal. Korea follows with a significant growth of its importations, going from 5 Mt at the start of the period to 74 Mt in 2003. Taiwan comes next with 55 Mt at the end of the period, represented mostly by its need of thermal coal. The main supplier of coal in Asia-Pacific is Australia, which supplies close to 46.0%. Indonesia follows supplying 10.0% of importations, which mostly go to Japan and Korea. The countries of the former Soviet Union supply 3.6% and Canada has entered this market in the last 10 years with a 2.8% share of the total imported, mainly coking coal. Trade in Mediterranean Europe Coal importations in the Mediterranean Europe market have increased significantly, going from 82 Mt in 1980 to 152 Mt in 2004, which shows a constant commercial evolution. In 2003, this region imported close to 24% of the total thermal coal importations and 14.9% of the total coking coal imported in the world. Germany, the country with the largest growth in importations, needed 36 Mt in 2004, of which 85.0% corresponded to thermal coal. The United Kingdom follows with 33 Mt, all of which was thermal coal, with an important growth during the period. Other countries like Spain, Netherlands and Italy have had moderate growths in their purchases from abroad. The opposite happened in France which reduced its importations during the period. These countries together accounted for 66 Mt in 2003, thus they still have an interesting consumption of coal, especially thermal coal. On a smaller scale are Sweden, Slovakia, Denmark and Turkey. The greatest suppliers of coal to Mediterranean Europe are: South Africa which supplies close to 37.0% of the total imported by this region, which is all thermal coal. The countries of the former Soviet Union follow with thermal coal. Then come Australia with both thermal and coking coal, and Colombia which supplies close to 22 Mt of thermal coal. Other countries such as Indonesia and the United States have been increasing their share significantly since 1998, especially with thermal coal. Trade in North America

Coal imports in North America accounted for 3.2% of the world total in 2004. In recent years, there has been a steady growth in the United States, especially in thermal coal and in Canada with consumptions not only of thermal but also coking coal. Colombia is the greatest supplier of thermal coal to the United States; in 2004 the trade flow between these countries increased by 59.0% in terms of volume with respect to the previous year. Venezuela supplies close to 3 Mt of thermal coal and in a lesser degree Canada supplies approximately 2 Mt of coking coal. Canada has been increasing its consumption. The United States accounts for 90.0% of its supply. Imports from Colombia accounted for 7.5% of its purchases from abroad.. Trade in Latin America Coal imports in Latin America have been growing; They went from 13.3 Mt in 1990 to 15.7 Mt in 2004. The main importers are Brazil with 13.2 Mt totally of coking coal, followed by Chile with 2.5 Mt of thermal coal and 1.1 Mt of coking coal. Then come Peru (0.9 Mt) and Argentina (0.8 Mt), and in a smaller scale Guatemala, Honduras and Dominican Republic. The main suppliers of coal to the countries of Latin America are still the United States, Australia and South Africa, and in a lesser degree Canada and Colombia.
Table 1. FLOW OF COAL. ORIGIN-DESTINATION (Mt) Origin: Australia
Destination 1980 1990 1998 2002 2003 Japan 29,3 55,3 68,9 91,8 94,6 Korea 3,0 8,5 25,5 26,9 26,3 Germany 0,6 1,1 2,3 3,4 5,0 Mexico 0,0 0,0 0,0 1,9 5,6 United Kingdom 2,8 3,0 4,6 5,1 5,6 France 1,6 3,5 3,2 4,2 4,5 Netherlands 1,1 5,6 2,9 2,8 2,5 Turkey 0,0 1,3 1,9 1,8 2,1 Spain 0,6 0,2 1,2 3,7 3,8 Belgium 0,2 1,4 3,6 2,5 2,3 Sweden 0,0 0,6 0,8 1,0 1,1
Source: U.S. International Energy Agency - IEA (2004)
Table 2. FLOW OF COAL. ORIGIN-DESTINATION (Mt) Origin: Indonesia
Destination 1980 1990 1998 2002 2003 Japan 0,0 1,0 12,4 19,5 21,5

Korea 0,0 0,4 6,5 6,9 6,4 Italy 0,0 0,0 0,2 3,3 5,0 Spain 0,0 0,0 3,0 3,1 3,3 Netherlands 0,0 0,0 0,1 1,7 1,9 United States 0,0 0,0 1,2 1,7 1,9 France 0,0 0,0 0,1 0,0 0,6 Finland 0,0 0,0 0,2 0,2 0,3
Source: U.S. International Energy Agency - IEA (2004)
Table 3. FLOW OF COAL. ORIGIN-DESTINATION (Mt) Origin: Unión Soviética
Destination 1980 1990 1998 2002 2003 Japan 2,1 8,0 3,6 6,9 7,5 Turkey 0,0 0,8 3,6 5,7 7,0 Finland 0,5 2,3 0,8 2,6 5,7 United Kingdom 0,04 0,6 0,0 5,2 5,5 Korea 0,0 1,2 0,6 2,8 3,0 Germany 0,2 1,2 0,6 2,8 3,0 Spain 0,1 0,2 0,1 2,4 2,1 Slovakia 0,0 0,0 1,2 1,9 2,0 Poland 0,0 0,0 2,4 2,1 1,9
Source: U.S. International Energy Agency - IEA (2004)
Table 4. FLOW OF COAL. ORIGIN-DESTINATION (Mt) Origin: Estados Unidos
Destination 1980 1990 1998 2002 2003 Canada 15,6 14,1 16,1 14,6 18,2 Italy 6,7 11,0 4,8 2,9 2,4 France 7,3 6,6 3,4 1,9 2,1 Belgium 4,1 5,8 2,6 1,8 1,7 Spain 3,0 3,1 2,9 1,9 1,4 Netherlands 2,8 6,1 3,2 2,3 1,1 United Kingdom 3,6 5,4 6,7 1,5 1,1 Mexico 0,7 0,0 1,1 0,7 1,0 Turkey 0,9 2,0 2,1 0,8 1,0
Source: U.S. International Energy Agency - IEA (2004)
Table 5. FLOW OF COAL. ORIGIN-DESTINATION (Mt) Origin: Canada
Destination 1980 1990 1998 2002 2003 Japan 0,0 0,0 16,6 9,5 9,1 Korea 0,0 0,0 0,0 4,5 3,7

United States 0,0 0,0 0,0 1,7 1,7 Turkey 0,0 0,0 0,0 1,5 1,4 Netherlands 0,0 0,0 0,0 1,6 1,1 Italy 0,0 0,0 0,0 0,7 0,8 United Kingdom 0,0 0,0 0,0 0,7 0,8 Mexico 0,0 0,0 0,0 0,7 0,4
Source: U.S. International Energy Agency - IEA (2004)
Table 6. FLOW OF COAL. ORIGIN-DESTINATION (Mt) Origin: Poland
Destination 1980 1990 1998 2002 2003 Germany 1,9 2,7 4,9 6,9 7,2 Austria 0,9 1,7 1,8 2,2 2,1 Finland 3,1 2,8 2,6 1,6 2,0 United Kingdom 0,4 1,0 0,9 1,6 1,9 Czech Republic 2,3 2,2 1,5 1,2 1,2 Denmark 3,4 0,9 2,6 2,2 0,8 France 3,4 0,4 2,0 1,0 0,7
Source: U.S. International Energy Agency - IEA (2004)
Table 7. FLOW OF COAL. ORIGIN-DESTINATION (Mt) Origin: South Africa
Destination 1980 1990 1998 2002 2003 United Kingdom 0,0 0,3 2,4 9,8 12,2 Spain 0,7 4,6 5,5 10,7 8,0 Germany 1,4 4,5 6,6 6,7 8,1 Netherlands 0,4 1,4 5,6 7,3 8,0 Italy 3,1 4,8 3,9 3,8 4,7 France 9,1 0,8 4,8 4,8 4,0 Belgium 2,0 4,5 4,2 2,8 3,6 Denmark 3,1 0,0 2,9 1,2 2,9 Portugal 0,0 2,1 1,8 2,1 2,0 Turkey 0,0 1,2 1,8 1,1 1,5
Source: U.S. International Energy Agency - IEA (2004)
Table 8. FLOW OF COAL. ORIGIN-DESTINATION (Mt) Origin: Colombia
Destination 1980 1990 1998 2002 2003 United States 0,0 1,3 3,1 8,3 14,0 Netherlands 0,0 1,5 3,7 3,0 4,2 Germany 0,0 0,1 3,0 2,8 3,9 United Kingdom 0,0 0,9 3,8 3,5 3,4 Denmark 0,0 2,0 1,2 2,9 1,5

Italy 0,0 0,3 2,3 1,9 2,4 France 0,0 2,0 2,3 1,3 2,3 Portugal 0,0 0,4 1,9 1,5 1,9 Canada 0,0 0,0 0,1 2,9 1,5 Spain 0,0 0,4 0,4 1,6 1,4 Turkey 0,0 0,0 0,0 0,0 0,6
Source: U.S. International Energy Agency - IEA (2004) 1.2. MAIN HISTORICAL JUNCTURES Oil crisis and its relation with coal Oil is the source of energy which leads the behavior of fuels on the international market. The continuity of coal as a resource which can be used to generate electric power depends on its capacity to prove its competitiveness on the medium and long term with oil and more specifically, in the past, with residual Fuel Oil No. 6, which used to be the most commonly used fuel for thermoelectric consumption; currently with natural gas, whose price is linked to oil and acquires an increasingly bigger share in the generation of electricity. Several events have marked the rising tendency in the prices of crude oil since the first oil crisis in October of 1973, on occasion of the Arab – Israeli conflict. At that time, the oil producing countries that were in the conflict agreed to cut down production which was equal to 7% of the global supply. This created panic among petroleum companies and induced the organization of petroleum exporting countries – OPEC, which then comprised thirteen countries to raise the price up to eight times the price in effect at the beginning of the 60s. A second oil crisis, as a result of the revolution of 1979 in Iran and its war against Irak in 1980, triggered another rise close to 80 US$/b (dollars of 2003). In industrialized countries, the high fuel prices generated a generalized tendency towards energy conservation, which was detrimental to the demand of fossil fuels. Likewise, as the demand for oil decreased, there was an increase in the oil supply from countries which were not members of the OPEC such as Mexico, Brazil, Egypt, China, India, the new oil producing countries in Europe in the area of the North Sea and the Soviet Union, which in 1989 reached a production equal to 19.2% of the world total that year. The oil crisis described above was a determining factor of the appearance of coal as a serious competitor of crude oil on the international market. On the national scene, these events led to large scale exploration-exploitation of the Cerrejón Zona Norte field, by means of a joint Intercor – Carbocol operation. Oil prices result from the combination of several factors: expectations about the evolution of the situation in Irak, restrictive OPEC policies regarding increases in production and internal problems in some oil producing countries (recently in Venezuela and Nigeria). In absolute figures the WTI crude oil posted price in 2005 was between 53 US$/b and 63 US$/b, with a rising tendency.

Apartheid regime in South Africa The trade embargo against South Africa by most European countries, as a way to pressure South Africa to eliminate the segregationist regime called Apartheid, facilitated the entry of Colombian coal into the European market until it became the second supplier in that continent. The end of Apartheid in a peaceful transition of the government in that country eliminated the restrictions imposed against coal exportation to the European Union, and led this country to becoming one of the main coal exporters on a global scale. Shipping and port infrastructure Coal transportation costs are increasingly relevant in the decision to purchase coal. This is how initially the transportation cost component accounted for 12.0% and 17.0% of the CIF price in ARA ports (when the average FOB Puerto Bolivar price ranged between 20 US$/t and 30 US$/t), in 2003 the price of transportation accounted for 28.0.% to 35.0% of the price. On the other hand, the availability of modern and efficient port facilities has a positive influence on the coal market. It allows loading increasingly large tonnages for exportation and consequently there is a reduction in freight costs. Notable facts regarding this are the successive expansions of the Port of Richards Bay in South Africa, which currently handles 70 Mt/year; Indonesia also notably expanded its port capacity in recent years and the United States has modernized its port facilities on both ocean coasts. Nuclear power In recent decades, this source of energy has been one of the most important options for the planning of the energy sector and particularly for the electric system, as competition for coal. Such is the case of France, whose energy policy focused on suspending the use of coal and generating their electricity with nuclear power. However, some accidents at nuclear plants, especially at Three Mile Island in the United States and Chernobyl in the former Soviet Union (in the early 80s), set back the construction of new facilities for the generation of nucleoelectricity, due to the extreme and costly industrial safety measures that had to be adopted, the high costs of a non conventional thermal plant and the cost of handling nuclear wastes As a development of the conservation concepts of the Kyoto Protocol, nuclear plants have become popular again since they do not generate greenhouse gasses. Subsidies for coal production In the European Union, traditionally important producers of coal, Germany and Spain, keep subsidies for coal production which imply high costs for their respective economies and impose restrictions on coal importations, which are forced to compete with the prices of the subsidized domestic supply placed at consumption sites. However, in other countries and especially in those with a significant domestic coal production, phasing out state subsidies has been
traumatic, such as the case of the United Kingdom which became a net importer after being an exporter. Price rises This factor directly influences the flow of investments towards the coal sector. This happened in the 1995-1996 period, when most petroleum companies decided to join the business, thus generating an oversupply of coal on the international market and several consolidations in the coal industry in 1999, when most petroleum companies opted to get out of the market. Technological advancements Constant technological developments in order to increase the efficiency in coal combustion have led the new thermoelectric generating units to reduce their consumption to generate the same amount of energy. Supply contracting systems The purchase pattern in consuming nations is fundamental for the analysis of the prevailing type of price in each one of its respective markets. This way, for instance, countries with a high dependence on coal for the generation of electricity or those that see it as a strategic product to diversify their sources of supply prefer to secure their supply at stable prices by means of long term contracts. On the other hand, in some countries which have a diversified fuel portfolio for power generation and especially in those where hydroelectric or nuclear power plants meet their basic generation needs and where coal or natural gas are used to provide peak energy supply, the tendency is to prefer the purchase of coal by means of short term or occasional contracts. Comoditization of coal prices Futures market analysts estimate that coal non physical or futures transactions have grown from zero at the end of 1997 to close to 1,000 Mt a year in 2004. Therefore, it can be said that the main producing companies participate actively in this type of market or “hedging” in order to acquire price coverage for the sale of their product. Nowadays the prices of coal supply contracts are determined not only according to the indexes of the physical market but also the futures market (Global Coal y API No.2). Both are published by specialized magazines.

CHAPTER 2 THE NATIONAL MARKET

CHAPTER 2 THE NATIONAL MARKET
2. THE NATIONAL MARKET Reserves Colombia has potential of resources and reserves which is estimated at 16,992.8 Mt of which 7,063.6 Mt are measured, 4,571.9 Mt are indicated, 4,237 Mt are inferred and 1,119.8 Mt are hypothetical (Ingeominas, 2004). These resources and reserves are distributed in the three Colombian mountain ranges and have been calculated according to the Sistema de Clasificación de Recursos y Reservas de Carbón (Coal Resource and Reserve Classification System) which was established by Ecocarbón in1995. The coal producing zones of La Guajira and Cesar are the most widely known. They have a large potential of exportation type thermal coal which at the 2004 levels of production (24.5 Mt in La Guajira and 25.0 in Cesar) could supply the international markets for more than ten decades depending of course on the profitability of exploitation and the market. It should be noted that these zones have production costs and transportation and loading infrastructure which make them highly competitive regarding countries like Venezuela, the United States, South Africa and Australia, among others. On the Atlantic coast, the San Jorge area in the department of Córdoba is next as to knowledge and potential with a current yearly production of 351.0 Mt of thermal coal, which mainly supplies the internal market. Regarding the inland coal producing zones, the zones of Norte de Santander, Cundinamarca and Boyacá are important since they have the greatest metallurgic and thermal coal reserves for national consumption and exportation, with a production level during 2004 of 3.4 Mt. There are other zones with a smaller potential such as those in Antioquia – Antiguo Caldas and Valle del Cauca and Cauca with thermal coals for internal consumption; their resource and reserve potential is enough to meet the internal demand, but for economic reasons coal is brought from Antioquia, Cundinamarca and Boyacá to the Valle del Cauca and Cauca zone There are other zones such as Santander with a potential of thermal, metallurgic and anthracitic coals that are being developed according to the possibilities of the market.
Chart 11. MEASURED RESOURCES AND RESERVES IN COLOMBIA (Mt)

Source: Ingeominas. El carbón Colombiano: recursos, reservas y calidad – 2004
Production There was permanent growth of total coal production in the country during the period of the study with notable increases in the order of 17 Mt between 1980 - 1990 and 32 Mt between 1990 - 2004.
Chart 12. COLOMBIAN COAL PRODUCTION 1992-2005*

Source: Development Plans Coal Sector, Mining Energy Statisticsr - UPME 1996-2002, National Congress Memoirs - MME 1991-2004, Minercol e Ingeominas. 2004 pr: Estimate, Assistant Directorate of Mining Planning - UPME 2005*: January-September 2005 During the 80s, most of the national coal production came from inland Colombia. This was when the Cerrejón Zona Norte project started exploiting and exporting coal. Currently this composition changed and the projects on the Atlantic Coast account for close to 92.9% of the total production while production from the inland kept a vegetative growth during the 1980-2004 period and tended to decrease, especially in the 1992-1999 period. Internal consumption There was a 39.6% growth in the domestic consumption of coal between 1980 and 1993. Since then there has been a reduction in the national consumption in the order of 2.6 Mt in the last eleven years, which equals a negative growth of 43.8%.
Chart 13. NATIONAL COAL CONSUMPTION 1992-2005*

Source: Ministry of Mines and Energy, Development Plan of the Coal Subsector 1980-1994, 1194-6, 1996-2000, 19972005 Ecocarbón, Mining Energy Statisticsr 1996-1997, 1997, 1998, 1999, 200 y 1991-2002-2003, National Mining Balance 1990-2000. Memoirs 2004-2005 2005 * :Estimate, Assistant Directorate of Mining Planning - UPME, September de 2005 Regarding the distribution per department, Boyacá and Cundinamarca are the greatest consumers of the product with 56.0 of the total consumption of the country. Furthermore, there has been a notable decrease in Norte de Santander of 86.9% in the last eleven years due to the reduced demand of Termotasajero. Likewise, there has been a reduction in consumption of 29.1% in the department of Valle del Cauca.
Gráfi co 14. COAL CONSUMPTION PER DEPARTMENT 2005*
Source: National Congress Memoirs 2004-2005. 2005*: Provisional
Consumption per Economic Activity The dynamics of consumption per economic activity has been stable. Thermal coal accounts for the biggest consumption with an 88.0% share of the total domestic consumption especially in the electric and cement sub-sectors, followed by the food, brick, and textile sub-sectors, and the last are the residential sub-sector and the so called other industrial processes sub-sector. Metallurgic coal is destined to foundry and steel industrial processes with a 12.0% share of the total. Electric The largest consumption in electric sub-sector was recorded in 1992 with 2.3 Mt, with a 41.4% share of the national coal consumption. For 2004 consumption decrease to 668 Kt which accounts for a negative growth of approximately 71.0% in the last eleven years. Cement

This sector accounts for 20.2% of the national coal consumption. There was an increasing demand until 1998, when it reached its maximum consumption with a total of 1.2 Mt; after this the demand decreasing significantly until 2004. It must be noted that cement production in the country has been centered in 16 plants which currently operate 47 kiln units. The installed cement production capacity in Colombia is 11 Mt, of which 97.0% correspond to gray cement production; 29 kiln units (12 plants), which account for 72.0% of the installed capacity, are fueled by coal as the only fuel. Moreover, four plants with 16 kiln units use coal along with other fuels, preferably natural gas, to obtain heat due to the dual characteristics of their plant technologies. Brick and Pottery Coal consumption in this sector peaked in 1995 with its highest use for a total of 602 Kt which accounts for 10.8% of the national consumption, and declined in 2004 with a consumption of 256 Kt which account for a decline of 48.4%. A good share of coal consumption in this industry is attributed to small facilities grouped in the zones of greatest consumption on a national level. Among them are the kilns located in Bogotá D.C. and its surroundings, the brickyards and kilns for the production of lime in the vicinity of Sogamoso and other regions in Boyacá and Cundinamarca, the brick factories and pottery shops in the metropolitan area of Medellín and in the department of Norte de Santander, the pottery industry located in the municipalities of Ráquira, Guamo, Coyaima, Pitalito and el Carmen de Viboral. Textile Coal consumption to generate steam in the textile sector reached its maximum consumption in 1998, 147 Kt, which accounted for 2.8% of the national consumption. Consumption in 2004 was 103 Kt which was historically the lowest, showing a decline of close to 29.9 % during this last period. Food and Beverages This sector has had steady growth since 1980, reaching the peak consumption in 1998 with 288 Kt of coal which accounted for 5.5% of the national consumption. In 2004, 200 Kt were consumed, which accounts for a 30.5% decline compared to 1998. Coal consumption is oriented basically to the generation of process steam and to produce heat in ovens. Breweries use steam that is generated to obtain electricity in cogeneration processes. This way coal consumption is led by breweries and one liquor producing plant, which account for three fourths of the consumption in this sector. The rest is dispersed among food processing plants, rice mills, small preserve producing factories and brown sugar mills. The department that has lead the consumption in this sector has been Valle del Cauca with a share of aproximately 58.0%, with the main consumption centers are located in the

municipalities of Palmira, Candelaria and Cerrito. Next in order of importance are the departments of Boyacá with 13.0%, Cundinamarca with 13.0% and Antioquia with 7.0%.
Chart 15. NATIONAL COAL CONSUMPTIO PER ECONOMIC ACTIVITY 2005*
Source: Ministerio de Minas y Energia, Estadísticas UPME, National Mining Balance *2005: Provisional
One characteristic of small food producing companies is that occasionally their consumption of coal is marginal, which makes one think that anytime this consumption may be displaced by other sources of energy. To minimize this risk, the sector has been making efforts aimed at achieving an effective substitution of fire wood and other organic residues used in the brown sugar (panela) industry for coal. Exports There was an increase in total Colombian coal export of 49.1% in 2004 compared to 2000. These increased to more than 50 Mt coming mostly from those on the Atlantic Coast, which accounts for 97.0% of total exports and the remaining 3.0% from the inland.
Chart 16. COLOMBIAN EXPORTS - 1992-2005*
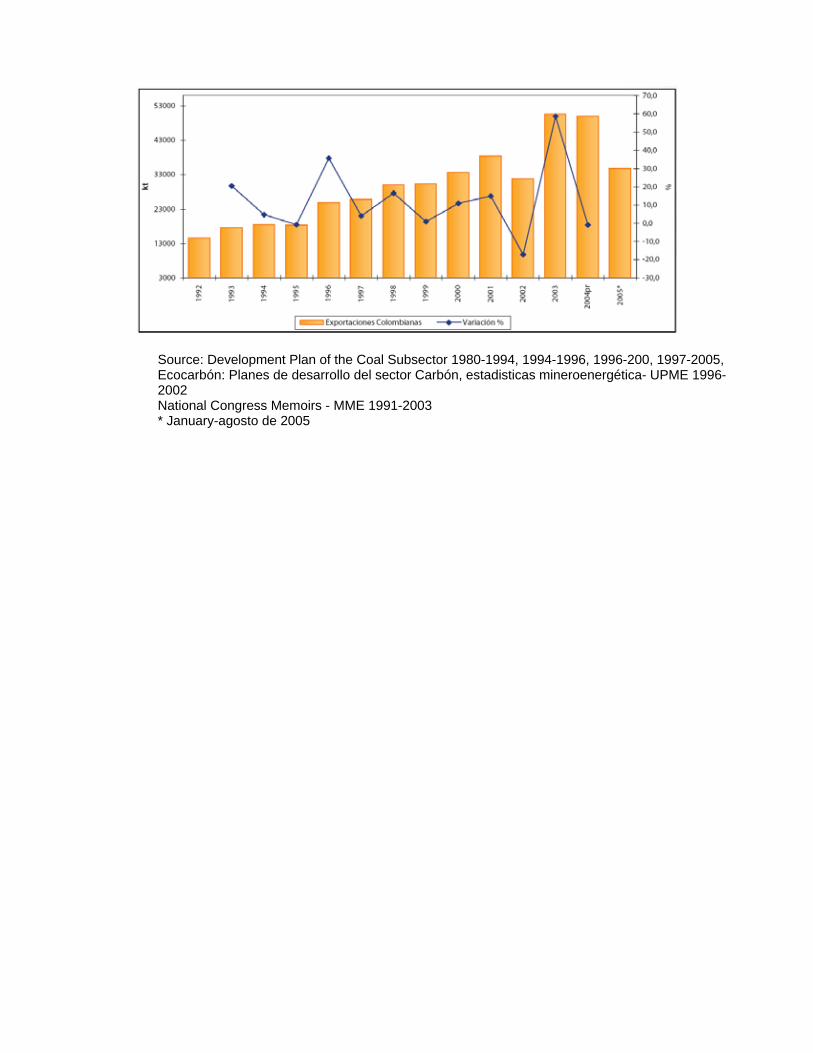
Source: Development Plan of the Coal Subsector 1980-1994, 1994-1996, 1996-200, 1997-2005, Ecocarbón: Planes de desarrollo del sector Carbón, estadisticas mineroenergética- UPME 1996-2002 National Congress Memoirs - MME 1991-2003 * January-agosto de 2005

CHAPTER 3 CHARACTERIZATION OF
THE MARKET BY TYPE OF COAL

CHAPTER 3
CHARACTERIZATION OF THE MARKET BY TYPE OF COAL
3. CHARACTERIZATION OF THE MARKET BY TYPE OF COAL 3.1 THERMAL COAL 3.1.1. International Market Production The behavior of thermal coal production is similar to the one described for total coal production given that it accounts for 85.8% of the coal produced in the world. During the 1980-2004 period there was steady growth which allowed reaching 3,712 Mt in 2004, that is a global increase of 62.9%.
Chart 17. GLOBAL PRODUCTION OF THERMAL COAL 1980-2004 *
Source: U.S. International Energy Agency - IEA (2004) 2004*: Estimate, Assistant Directorate of Mining Planning - UPME
This dynamics is due mostly due to the behavior of production in countries of the Asian bloc, mainly China which increased its volume in relation to 1980 reaching a volume of 1,419 Mt in 2004, which equals 38.2% of global production. Next in importance is the United States which maintains its large share with 23.7%, and India which has had an enormous growth, going from 92.8 Mt in 1980 to 340 Mt in 2004, which makes India the third largest producer with a 9.2% share.
Chart 18. GLOBAL THERMAL COAL PRODUCERS
2004*
Source: U.S. International Energy Agency - IEA (2004) 2004*: Provisional
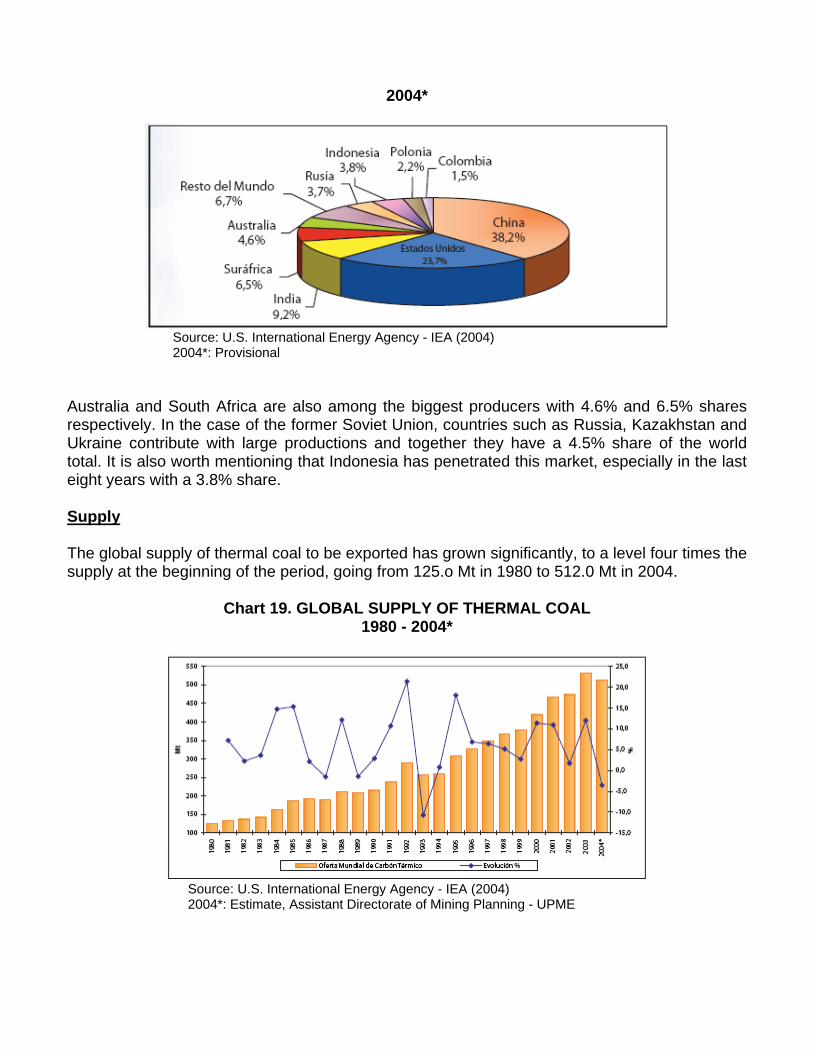
Australia and South Africa are also among the biggest producers with 4.6% and 6.5% shares respectively. In the case of the former Soviet Union, countries such as Russia, Kazakhstan and Ukraine contribute with large productions and together they have a 4.5% share of the world total. It is also worth mentioning that Indonesia has penetrated this market, especially in the last eight years with a 3.8% share. Supply The global supply of thermal coal to be exported has grown significantly, to a level four times the supply at the beginning of the period, going from 125.o Mt in 1980 to 512.0 Mt in 2004.
Chart 19. GLOBAL SUPPLY OF THERMAL COAL 1980 - 2004*
Source: U.S. International Energy Agency - IEA (2004) 2004*: Estimate, Assistant Directorate of Mining Planning - UPME

The export supply per country shows Australia and South Africa growing steadily during the period with 18.9% and 13.5% shares respectively. Indonesia has become an increasingly important exporter. It has achieved a considerable increase in exported volume since 1990, going from a 1.9% share in 1990 to a 17.1% share in 2004, which makes Indonesia the second largest exporter. In recent years, China has occupied a predominant place in the world ranking, allotting 6.0% of its production for exportation, accounting for 15.1% of the total supply. Likewise, Colombia has become an important exporter positioning itself among the largest exporters of thermal coal at an international level, with an 8.7% share of total exports. In the case of the United States which in the 80s had an important increase, its volume declined in the following years, and its share of exports went from 15.1% to 3.6%.
Gráfi co 20. THERMAL COAL EXPORTING COUNTRIES 2004*
Source: U.S. International Energy Agency - IEA (2004) 2004*: Estimate, Assistant Directorate of Mining Planning - UPME
Demand The global demand of thermal coal reached 487 Mt in 2004. This is a fourfold increase compared to the beginning of the study (1980).
Chart 21. GLOBAL DEMAND OF THERMAL COAL - 1980 – 2004

Source: U.S. International Energy Agency - IEA (2004) 2004*: Provisional
This demand is concentrated in the Asian countries which grew significantly during the period. Japan is the first importer with a 16.9% share of the world total, followed by Korea with 11.5% and Taiwan with 9.6%. India has also become important in its demand, with a 2.1% share of the total. The European countries are still important importers with a 24.8% share of the global demand.
Chart 22. THERMAL COAL IMPORTING COUNTRIES 2004*
Source: U.S. International Energy Agency - IEA (2004) Provisional
Consumption Global consumption of thermal coal reached 3,615 Mt in 2004. This figure represents an increase of approximately 60.9% compared to 1980. Most of it is required for the generation of electricity and in a lesser degree for industrial use, using small amounts as PCI coal and mixtures to produce coke.
Chart 23. WORLDWIDE THERMAL COAL CONSUMPTION - 1980-2004 *

Source: U.S. International Energy Agency - IEA (2004) 2004*: Estimate, Assistant Directorate of Mining Planning- UPME
Asian countries consume close to 39.8}% of the total. China has the largest share with 35.9%, which it supplies with its internal production. Likewise, India appears in recent years as an important comsumer and with a high self supplying capacity, with an 8.9% share. In the case of Korea, there was a large consumption, all of it coming from the international market. As to the United States, it still consumes significant amounts, resorting mostly to its own production and in a lesser degree to imported coal, accounting for 24.0% of the global consumption.
Chart 24. THERMAL COAL CONSUMING COUNTRIES 2004*
Source: U.S. International Energy Agency _ IEA (2004) 2004* : Provisional 3.1.2 Mercado Nacional
3.1.2 National Market Production

There was a steady increase in national thermal coal production until 2001; however, there was a decline of 8.2% in 2002, with respect to the previous year, mainly due to the performance of the Zona Norte and Carbones del Cerrejón projects in La Guajira in those years. They recovered in 2003 and achieved a production on 48.2 Mt with an increase of 25.5% with respect to the previous year. Most of the production of thermal coal comes from these projects, which are considered to be of national interest, and other mining projects located on the Atlantic Coast and in a lesser degree from the exploitations in the inland.
Chart 25. COLOMBIAN PRODUCTION OF THERMAL COAL 1992-2005*
Source: Ecocarbón 1996-1997, Minercol 1998-2003, Ingeominas, National Congress Memoirs. MME 2000-2003 * January-September de 2005
The Atlantic Coast has approximately a 93.0% share of the total national production, coming mainly from the departments of La Guajira and Cesar. La Guajira achieved a production of 24.5 Mt in 2004, led by El Cerrejón Zona Norte project in spite of having a decline of approximately 5.5 Mt in 2002. It reached 24.5 Mt in 2004 with the contribution of the Patilla sector. Other projects such as Cerrejón Zona Central and Oreganal produce over 4.0 Mt. The coal producing zone of Cesar, led by La Loma project, produced 25.0 Mt in 2004, which represents an increase of 18.3% compared to the previous year. Regarding the inland, production in 2004 reached 3.7 Mt which equals a 7.0% share of the national production. This production comes mainly from the five traditional coal producing regions: Antioquia, Boyacá, Cundinamarca, Norte de Santander and Valle del Cauca/ Cauca. Exportation Historical figures of thermal coal exports, corresponding to the 1992-2004 period show steady and significant growth until 2003, with exportation stability during 1994 and 1995. In 2004 there

are thermal coal exports in the order of 48 Mt which represent a threefold increase compared to exports in 1992.
Chart 26. COLOMBIAN THERMAL COAL EXPORTS 1992 – 2005*
Source: National Congress Memoirs. MME 1985-1997, UPME - Exportaciones Colombianas de Productos Minerales, Minercol 2003, Ingeominas * January -September 2005
As of 1996 there is another increase in the volume of exports. These reached the maximum amount of exported coal in 2003 reaching 49.2 Mt. There was a notable decline in the volume of exports in 2002 with a decrease of approximately 18.9% compared to the previous year due to the low production of the Cerrejón Zona Norte project. Consumption The history of thermal coal consumption shows its greates growth in 1993, when it reached 5.0 Mt. After this year there is a period with a notable decline until 2004 which was 2.6 Mt and which represents a decrease of 45.0% in the last decade.
Chart 27. COLOMBIAN CONSUMPTION OF THERMAL COAL 1992 – 2005*

Source: Ministry of Mines and Energy, Development Plan of the Coal Subsector 1980-1994, 1194-6, 1996-2000, 1997-2005 Ecocarbón, Mining Energy Statistics 1996-1997, 1997, 1998, 1999, 200 y 1991-2002-2003, National Mining Balance 1990-2000. Memoirs 2002-2003. 2004 pr: Estimate, Assistant Directorate of Mining Planning - UPME 2005*: Estimate, Assistant Directorate of Mining Planning - UPME, January-September 2005 Prices The behavior of prices on the internal market has been historically stable with a rising and steady tendency until they reached a high value in 1999; later prices declined until they reached 26.5% in 2000. After that they recovered again to reach a maximum price of $41,355/t in 2003 and rose further to reach thermal coal prices of $90,000/t in 2004. 3.2 COKING COAL 3.2.1 International Market Production The average production of coking coal during the 1980-2004 period was approximately 508 Mt with slight variations. There was a tendency to decline from 1998 to 2001. In recent years there has been a recovery and production picked up reaching 545 Mt in 2004. This was brought about mainly by the greater demand of China and the United States.
Chart 28. GLOBAL PRODUCTION OF COKING COAL 1980 – 2004*

Source: U.S. International Energy Agency - IEA (2004) 2004*: Estimate, Assistant Directorate of Mining Planning - UPME
China is the biggest producer of coking coal in the world with a 33.7% share of global production during 2004, followed by Australia and Russia, with 22.0% and 10.5% shares. The European countries reduced their contribution to production, which was over 6.4% in 2004. The main coking coal producing countries are presented. They are generally the same ones that have traditionally had a significant production in the last twenty years.
Chart 29. PRODUCERS OF COKING COAL 2004*
Source: U.S. International Energy Agency - IEA (2004) 2004*: Provisional
China and Australia have advanced significantly in their production with steady growth during the whole 1980-2004 period, accounting for 13.3% and 5.2% growth in 2004 compared to the previous year. This makes them the main producers and together they account for a 55.7%

share of the total global production. Other countries such as India and Canada are still important producers, but they have been decreasing their share since 1990. It is worth mentioning that the United States and Russia, which at the beginning of the period were the two biggest producers of coking coal, have greatly reduced the volume of their production. Supply The export supply of coking coal was close to 209 Mt in 2004. This is equal to 38.4% of what is produced in the world. According to historical figures, there has been a 51.6% growth in exports. The most dynamic country in coking coal exportation is Australia. Its export volume has increased threefold during the period, thus becoming the biggest exporter with a 57.6% share of the total global offer. Canada and the United States follow. They still export significant amounts with 12.7% and 10.7% shares respectively. China has had outstanding growth. At the beginning of the period, China exported a little more than 1 Mt and in 2003 it exported 13.1 Mt, which makes it an important player as an exporter.
Chart 30. GLOBAL SUPPLY OF COKING COAL 1980 – 2004*
Historical Exports (Mt)
Source: U.S. International Energy Agency - IEA (2004) 2004*: Estimate, Assistant Directorate of Mining Planning - UPME
It is worth mentioning Colombian exports although they are still relatively small (1.3 Mt in 2003). This makes Colombia a member of the group of exporters in the world even though it only has a 0.7% share.
Chart 31. COKING COAL EXPORTERS – 2004*

Source: U.S. International Energy Agency - IEA (2004) 2004*: Provisional
Demand As to historical figures of the global demand for coking coal, it can be concluded that during the 1980-2004 period, there was an increase of 75.8 Mt which represents a 54.1% increase, with average annual variations of 1.93%, with a regulated behavior of importations.
Chart 32. GLOBAL DEMAND OF COKING COAL 1980 – 2004*
Historical Importations (Mt)
Source: U.S. International Energy Agency - IEA (2004) 2004*: Estimate, Assistant Directorate of Mining Planning - UPME
Asia is the region which has had the greates growth of coking coal demand. Japan has been the greatest importer of this product during the whole period and its importations equal 39.8% of the global total. Likewise, Korea, India and Taiwan have been growing gradually in their importation needs which currently account for 19.3% as a group.
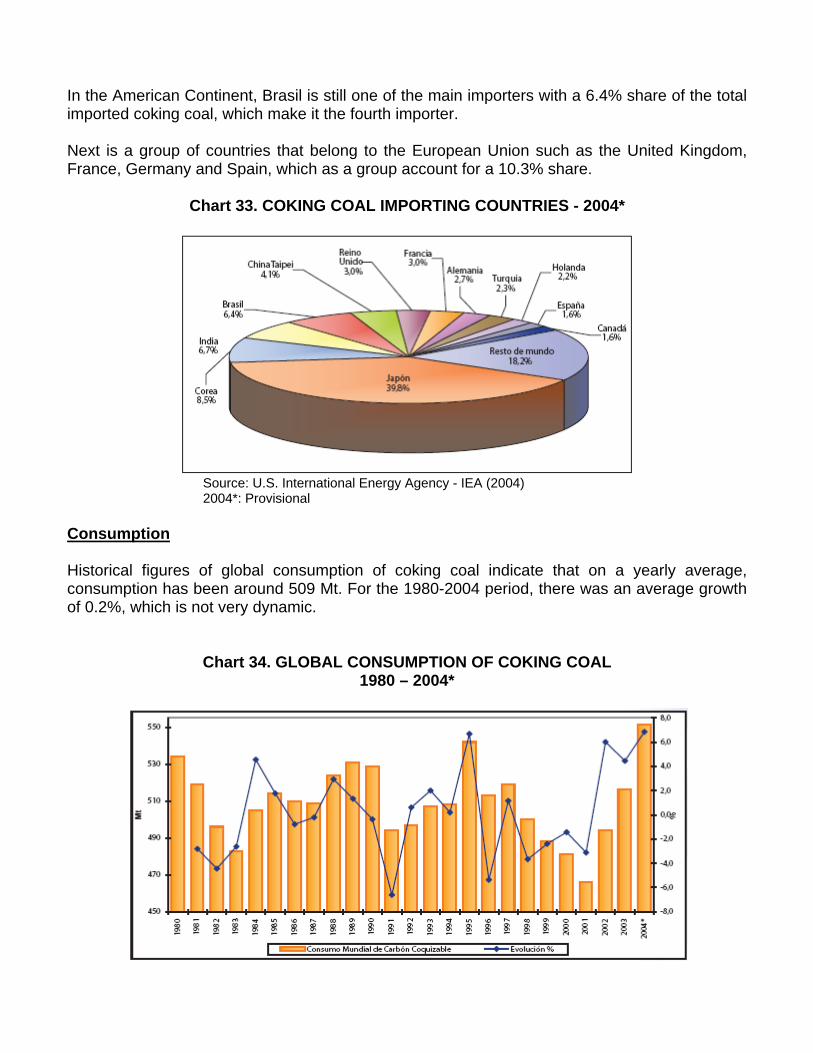
In the American Continent, Brasil is still one of the main importers with a 6.4% share of the total imported coking coal, which make it the fourth importer. Next is a group of countries that belong to the European Union such as the United Kingdom, France, Germany and Spain, which as a group account for a 10.3% share.
Chart 33. COKING COAL IMPORTING COUNTRIES - 2004*
Source: U.S. International Energy Agency - IEA (2004) 2004*: Provisional
Consumption Historical figures of global consumption of coking coal indicate that on a yearly average, consumption has been around 509 Mt. For the 1980-2004 period, there was an average growth of 0.2%, which is not very dynamic.
Chart 34. GLOBAL CONSUMPTION OF COKING COAL 1980 – 2004*

Source: U.S. International Energy Agency - IEA (2004) 2004*: Estimate, Assistant Directorate of Mining Planning - UPME
Generally, the greatest consumers are the Asian countries due to their use of coal in the production of coke for the steel industry. China is the largest consumer with a 28.9% share of global consumption using approximately 92.0% of what it produces and exporting the surplus (8.o%). Japan follows with a 16.0% share of global consumption, totally supplying itself with imported coal, as does Korea. India has been increasing its consumption which is currently in the neighborhood of 9.0%, of which 62.0% corresponds to its own supply and the remaining 38.0% comes from importations. It is worth mentioning the special case of Brazil which has had a steady growth during the period, exceeding a 2.6% share, which it supplies almost totally with imported coal.
Chart 35. COKING COAL CONSUMING COUNTRIES – 2004*
Source: U.S. International Energy Agency - IEA (2004) 2004*: Provisional
3.2.2. National Market Production The estimated production of metallurgic or coking coal for 2004 was 1.8 Mt. According to available statistical figures on the production of this type of coal, there was a decline during the 1992-2002 period in the neighborhood of 46.0%. In 2004, there was a recovery in the produced volume, which is equal to a 27.7% increase compared to the previous year.
Chart 36. COLOMBIAN PRODUCTION OF COKING COAL 1992 – 2005*

Source: National Congress Memoirs. MME 2004-2005 2004*: Estimate, Assistant Directorate of Mining Planning - UPME 2005*: Estimate, Assistant Directorate of Mining Planning - UPME, January-September 2005
Metallurgic coal production comes mainly from the departments of Boyacá, Cundinamarca and Norte de Santander, with 32.0%, 36.0% and 31.0% shares during 2003 in relation to the total production of the country, Norte de Santander being the most dynamic. Exportaciones In the 1992-2004 period, Colombia exported a yearly average of 1.4 Mt with a notable rising tendency, except in 2000 when exports declined to levels of 0.6 Mt. There was a 21.9% growth in 2004 compared to 2003.
Chart 37. COLOMBIAN EXPORTS OF COKING COAL 1992 – 2005*
Source: National Congress Memoirs. MME 2004-2005 2004*: Estimate, Assistant Directorate of Mining Planning - UPME 2005*: Estimate, Assistant Directorate of Mining Planning - UPME,January-September 2005
Internal Consumption The historical consumption of coking coal shows an average of 522 Mt during the 1992-2004 period, with an unstable behavior, especially in 1999 when there was a decline of 27.5% compared to the previous year, and a recovery of 36.9% during 2003 compared to 2002.
Chart 38. COLOMBIAN CONSUMPTION OF COKING COAL 1992 – 2005*
Source: Ministry of Mines and Energy, Development Plan of the Coal Subsector 1980-1994, 1194-6, 1996-2000, 1997-2005 Ecocarbón, Mining Energy Statisticsr 1996-1997, 1997, 1998, 1999, 200 y 1991-2002-2003, National Mining Balance 1990-2000. Memoirs 2002-2003. 2004*: Estimate, Assistant Directorate of Mining Planning - UPME 2005*: Estimate, Assistant Directorate of Mining Planning - UPME, January-September 2005
Prices Internal Price Average prices on the internal coking coal market varied between $7,658/t in 1992 and $45,342/t in 2003 for a global average of $31,489/t during the period. 3.3 COKE 3.3.1 International Market Production Global production of coke has had a declining tendency. The average during the 1980-2004 period of the study was 357 Mt, with an average rising tendency of 4.1% from 2000 to 2004, reaching an estimated production of 404 Mt in 2004, which represents a 5.4% growth compared to what was produced in 1980.
Chart 39. GLOBAL COKE PRODUCITON 1980 – 2004*

Source: U.S. International Energy Agency - IEA (2004) 2004*: Estimate, Assistant Directorate of Mining Planning - UPME
This production comes mainly from China, with a 39.3% share of the total produced in the world and with considerable increases which equal three times what they produced at the beginning of the period. Japan and Russia follow (11.2% and 10.0%). They are still important coke producers in the world because of the volume that they have produced although they declined slightly during the period. Other countries such as India and Korea had steady increases in their production; however, these countries only have a 3.9% and 2.9% shares of the global production.
Chart 40. COKE PRODUCING COUNTRIES – 2004*
Source: U.S. International Energy Agency - IEA (2004) 2004*: Provisional
The United States and Germany are the countries with the greatest decline in the volume of their recorded productions, with decreases in the neighborhood of 62.8% and 77.9% for the period, notably reducing their global share.

Brazil´s production of coke is to be highlighted. Although it has a 2.2% share of the total produced in the world, Brazil had a volume increase of more than 3.2 Mt for a 72.1% growth during the period. Supply The average export supply of coke in the world is 21.8 Mt with a volume increase of 13.4 Mt compared to 1980, which means a 62.5% growth in 2004.

Chart 41. GLOBAL SUPPLY OF COKE
1980 – 2004* Historical Exports (Mt)
Source: U.S. International Energy Agency - IEA (2004) 2004*: Estimate, Assistant Directorate of Mining Planning - UPME
The global supply is led by China, a country which has notably increased its exports, especially between 1980 and 1998, with a 45.3% share of the total exporten in the world in 2002. Poland and Russia follow in amounts exported with 14.1% and 10.7% shares of the total supply. In the case of other countries, such as the Czech Republic, Spain, Netherlands and the United States, their contribution in volume for each one is under 1 Mt, but they are still relatively important in the global distribution of coke. It is worth mentioning Colombia, which in spite of the low share of the global export supply, it is seen as one of the coke exporting countries in the world. Demand The demand for coke during the 1980-2004 period shows a stable behavior, with a yearly average demand of 20.6 Mt. After 2000 there was a rising tendency going from 20.4 Mt in 1999 to 30.2 Mt in 2004, which means a 48.1% increase.

Chart 42. GLOBAL COKE DEMAND
1980 -2004* Historical Importations (Mt)
Source: U.S. International Energy Agency - IEA (2004) 2004*: Estimate, Assistant Directorate of Mining Planning - UPME
Due to the decline in their production, Germany and the United States increased their importations during the period, with 27.1% and 11.1% shares of the total importations during the period. They maintained this increase in imported volume in 2003, according to the records of the OECD countries. On the other hand, India increased its volume demand for coke during the period. In spite of having increased its production, it has had to increase its importations considerably, going from 0.2 Mt to 2.2 Mt in the 1998-2002 period. There are other countries in Europe and Eastern Europe, such as the case of Austria, Italy, Netherlands, Sweden, Czech Republic and Rumania. Although they have moderate demands with amounts between 0.5 Mt and 0.8 Mt, they traditionally carried out importations during the whole period, thus making them important in the coke market. Consumption Glogal consumption of coke, which in 1980 was 387 Mt, reached approximately 399 Mt in 2004. The average yearly consumption was 356 Mt with a tendency to grow after the year 2000. The most important years were 2003 and 2004, due to the global economic growth driven by China.

Chart 43. GLOBAL COKE CONSUMPTION
1980 -2004*
Source: U.S. International Energy Agency - IEA (2004) 2004*: Estimate, Assistant Directorate of Mining Planning - UPME
Global consumption is led mainly by China with a large increase during the last decade, which is reflected in their growing production of steel. China´s consumption accounts for 39.3% of total global consumption. China supplies itself with its own production and it exports the surplus. In the case of Japan and Russia, despite having declined in their consumption during the period, they still consume large amounts with 11.6% and 10.0% shares. Likewise, these countries supply themselves with their own production, and destine some amounts for exportation. Other countries such as India and Brazil have increased their consumption in such a way that they have not been able to cover their needs with their own production. This has led them to import 21.0% of their consumption, as is the case of Brazil. 3.3.2 National Market Production The average production of coke in Colombia during the 1992-2004 period was 0.5 Mt with a notable growth of 51.0% in 2003 compared to the previous year. There was an increase in production in 2004 when it reached 1.1 Mt. This was generated especially by international prices and by the increase in the construction of coke ovens to meet the needs of the market.

Chart 44. COLOMBIAN COKE PRODUCTION
1992 – 2005*
* Cálculos Assistant Directorate of Mining Planning - UPME Source: Development Plans Coal Sector, Mining Energy Statisticsr - UPME 1996-2002, Memoirs al Congreso Nacional. MME 1991-2003, Ingeominas Estimate, Assistant Directorate of Mining Planning UPME
Most of the coke production is destined for exportation and it is estimated that close to 30% is for national consumption. It is produced mainly in the departments of Boyacá, Cundinamarca and Norte de Santander. Exportation Coke for exportation, which is produced mainly in the Cundiboyacense region, accounts for 80% of the total exported. The Port of Buenaventura is used to ship it out, and in a lesser degree, the ports in Santa Marta. There were also exports of coke to Venezuela through Norte de Santander.
Chart 45. COLOMBIAN COKE EXPORTS 1992 – 2005*

* Cálculos Assistant Directorate of Mining Planning - UPME Source: Development Plans Coal Sector, Mining Energy Statisticsr - UPME 1996-2002, Memoirs al Congreso Nacional. MME 1991-2003, Ingeominas Estimate, Assistant Directorate of Mining Planning UPME
Prices For coke (P.A. 2704001000), FOB export prices for the 1991-2004 period are generally stable with two extreme prices: the lowest price was US$57.4 in 1992 and the highest was US$105 in 2004.

CHAPTER 4POSITIONING OF COLOMBIAN COAL
ON THE INTERNATIONAL MARKET

CHAPTER 4
POSITIONING OF COLOMBIAN COAL ON THE INTERNATIONAL MARKET
4. POSITIONING OF COLOMBIAN COAL ON THE INTERNATIONAL MARKET 4.1 OPPORTUNITY COSTS AND PRICE STRUCTURE According to the behavior of the internal demand of thermal coal in the country, the tendency to decline during recent years had negative consequences for producers given that they lost a significant part of their market. This forced them to reduce their operations and to keep a low wage structure and low general costs at the mine. Furthermore, they were unable to comply with their labor related and social security obligations as well as their fiscal obligations. This situation was worsened by the characteristics of the contracts, which had been established especially by the consumers of electricity generation who were trying to obtain the product at a lower price. Production costs at the mine entrance are related to the level of demand and they are adjusted to the market prices that have established costs within a short term framework according to immediate needs. This has not allowed defining and applying an appropriate and real cost structure. This situation led producers to sell their production at prices below their total costs because of the risk of losing a client or stable supply, thus lowering wages and other obligations. Therefore, in order to establish or measure the sustainability and competitiveness of mining from the inland, it must be done within a cost structure of the productive chain according to the law and within a framework of medium and short term parameters, where items such as investment, amortization, depreciation, taxes, and profits, among others are assessed. These are basic components in the business which allow evaluating with certainty not only the incremental cost but also the long term marginal cost. Regarding the evolution of thermal coal prices delivered at the carboelectric power plants in the country (main consumers), these were high in the 1991-1995 period, due to the demand for electric power generation because of power rationing and the provisions that were made to assume new dry spells. After 1996 prices declined steadily until 2003. Facing the need to meet the demand for thermal coal to be shipped abroad and the growing demand for metallurgic coal and coke on the international level as of 2002, the possibility of using thermal coal in mixing processes for low volatile coal was thought of. This generated scarcity in the supply of thermal coal in 2003 and forced carboelectric power plants and other industrial sectors to assume the high prices. Keeping in mind the high terrestrial transportation and port costs with the additional loading limitations that prevent the use of large hull vesselsto contract competitive freight, the possibilities to ship thermal coal abroad reduce the volumes that would be destined for special niches, mainly towards the east coast of the United States.

Consequently, the opportunity cost of thermal coal from the inland would be based on the increase in the supply for traditional consumers, be it directly as raw run-of-mine coal or by means of its use as a substitute by means of technological conversion processes. Any price structure for the case of thermal coal in the inland must be associated with entering into long term and direct contracts between the producer and the consumer, in such a way that the cost of intermediation is eliminated. Regarding metallurgic coal, the situation is similar when it comes to the evolution of its prices. This is mainly due to the fact that generally in previous years no distinction was made about its specific use so its prices were similar to those of thermal coal. The exception is the coal that is used in coking processes which still has low production. In 2003 the significant demand for coke to be exported generated and increase in the production and consumption of metallurgic coal. This produced not only a rise in its prices, but also it led to defining its use exclusively for the production of coke. The following table shows the evolution of average prices in recent years: The reference price of coke placed at the plant for steel industries was $135.000/t in 2003 and $240,000/t in 2004 and the price for coke for exportation in the Cundiboyacense region ranged from $145,000/t to $280,000/t in the last two years.
YEAR PRICE
2002 $ 35,220
2003 $ 45,342
2004 $ 74,485
All of the metallurgic coal is destined to internal coking processes due to the profitability that this market offers. Given that the current ratio for the production of coke is 1.6 t of metallurgic coal mixtures, coal producers faces a real demand which is increased by 60% in relation to coke production and individual metallurgic coal producers face an unfulfilled demand for this raw material for coking. The domestic production of coke is influenced by international marketing, given that the domestic demand for coke is well difined as a consequence of steel production capacity of the country which was 668 kt in 2003. This implies an annual consumption of coke no greater than 380 kt, of which most of it is supplied by producers of steel and byproducts. Therefore, the best option for the local coke producer is to destine his production for the international market which can be seen as having a great potential as to natural clients, such as the United States and Brazil which are within his influence and competitiveness of Colombian production. The international market offers great challenge for Colombian coke producers:

• Because of the standards of quality which are required by the international market, some locally produced cokes are not competitive and some producers must make an effort to improve the coal mixtures for coking and furthermore improve the efficiency of coking materials in order to lower costs and to produce more consistent cokes.
• In spite of the relative proximity of the target markets such as the United States, Brazil, Chile
and Peru, the competition with the producers in the Republic of China and Australia is harsh due to the quality problems that the local product has had and the disadvantage of production and transportation limitations that the country currently has.
4.2 ANALYSIS OF THE POSSIBILITIES OF COLOMBIAN COAL FROM THE INLAND Thermal Coal On an international level, projections until the year 2025 indicate that the demand for imported coal will continue growing. This means that there is room for optimism about exports of thermal coal from the inland. In addition, as oil prices stabilize at prices higher than before the war in Irak and as China continues to absorb so much raw materials and engergetics as it has, coal prices will be significantly over US$30/t dollars FOB. Despite the obstacles, especially those related to mining technology and infrastructure, they must continue to be solved in order that exporters from the inland are perceived as reliable by importing companies and that their business volumes will grow. Metallurgic coals It is necessary to restructure the coking business within the framework of a new technological and business vision which is vertically integrated with mining, in order to think about being suppliers of international steel industries. Foundry cokes Besides the experience and acceptance that Colombian coke production has in some Latin American markets, other market niches such as the United States can be identified; these markets require that producing companies be committed with the coke production chain, invest in suitable coking technologies and lower costs in order to be competitive and increase exports. However, they must comply with the appropriate homogeneity characteristics required by steel industries which are the big buyers. 4.3. STRATEGIES FACING POSSIBLE ENVIRONMENTAL RESTRICTIONS With Russia´s ratification last October 5, 2005, the Kyoto Protocol has the support of 55 industrialized nations which in 1990 accounted for 55% of global carbon dioxide emmissions. This instrument establishes for signatory nations that have ratified it, the commitment to achieving the
“...stabilization of greenhouse gas concentrations in the atmosphere at a level that would prevent dangerous anthropogenic interference with the climate system”. Regarding this it states that “...Such a level should be achieved within a time-frame sufficient to allow ecosystems to adapt naturally to climate change, to ensure that food production is not threatened and to enable economic development to proceed in a sustainable manner.” Therefore, in compliance with the stated objectives, the nations of the industrialized world must adopt policies of promotion and technological change in order to minimize the impact of global emissions. This makes us foresee a beneficial incidence for developing nations as it allows them to reduce emissions by means of the transfer of financial and technological resources. 4.3.1 Impact of the Kyoto Protocol on global coal demand On the long term, we can expect a significant reduction in the demand by countries of the northern European Union, since they have a plentiful supply of natural gas which is the main competitor of coal and a notable increase in coal consumption can be foreseen in the Mediterranean region. In the American continent on the medium and long term, exports from the United States and Canada to countries in northern Europe, their most important buyers, will be affected by the environmental restrictions of the Kyoto Protocol, as well as by the competition of natural gas. In this regard, it must be mentioned that such a reduction may produce the closure of important mines in the United States which are still in operation in spite of high costs by virtue of European supplier diversification policies. In the Asian bloc, Japan, covered by the Kyoto Protocol, will probably reduce its use of coal in the medium and long term, as it applies the strict measures that were announced to save energy, as a result of postponing their nuclear power plant construction program. Finally, the remaining countries which are not covered by the agreement, Colombia among them, must also try to mitigate climatic change on the medium and long term, particularly in power generation and steel production projects which require financing of international credit entities. 4.3.2 Strategies for Colombian coal Although the Kyoto Protocol mainly affects coal, which among fossil fuels produces the most CO2 for the same generation of heat, a commercial strategy of exporting coals with a high calorific power and low sulfur content will allow it to remain in the market of the European Union, at least during the period that is needed to adjust their economies to comply with the greenhouse gas emission reduction objectives. However, electric power generation with Flue Gas Desulfurization (FGD) systems will have an unfavorable impact for Colombian low sulfur coal.
The United States, which is a country that rejected the ratification of the Kyoto Protocol, represents the most promising horizon to export Colombian coal. In fact, the reduction in gas and oil reserves in the United States, facing the enormous volume of exploitable coal reserves and the great installed capacity for power generation, make us think of important technological developments on the medium and long term to use coal in environmentally friendly conditions. In this scenario, the characteristics of Colombian coal indicate that it will be considered especially for the expansion of the power generation system. In the remaining countries of the continent, the current active promotion of economic mitigation processes makes us foresee the creation of an important and expanded market for Colombian coal, both thermal and metallurgic. 4.4 POSIBILITIES OF MARKETING SERVICES IN THE CONTEXT OF REGIONAL TREATIES OR AGREEMENTS Colombian is currently a member of the Andean Community of Nations (Comunidad Andina de Naciones – CAN), the Latin American Free Trade Association (Asociación Latinoamericana de Libre Comercio – ALALC) and the so called Group of Three (Grupo de los Tres), also signed by Venezuela and México. More recently, Colombian signed with eleven other South American countries the constitution of the South American Community of Nations (Comunidad Suramericana de Naciones – CSN), which will be based on the Free Trade Agreement between CAN y el MERCOSUR (Southern Common Market). All these integrationist process aim at consolidating large markets in the near future. However, the possibility of extending the horizon for Colombian products in the United States market, with zero tariffs, represents an unmatched opportunity to boost its economic growth. In view of the above, we now focus on the expected impact of the Free Trade Area of the Americas agreement with the United States, without denying the importance of the current free trade agreement with Venezuela and with the rest of Latin America in the future. 4.4.1 Free Trade Area of the Americas (FTAA) agreement with the United States In general terms the FTAA intends to: • Eliminate trade barriers and facilitate the circulation of goods and services between the
United States and Colombia. • Promote loyal competition between among commercial players. • Improve and increase the possibilities of investment for nationals from both nations. Consequently, this agreement is of the utmost importance for the service sector, and within this sector, for transportation and logistics. Likewise, when this agreement comes into effect, it will bring opportunities of great relevance for Colombian trade on the continental and global scene, as a result of the investments that must be made to technologically modernize and update transportation infrastructure in Colombia.

On the other hand, the repercussion that the FTAA will have on such aspects as intellectual property and eliminating or reducing trade barriers will be of great importance for Colombia in the negotiations that will take place with the Latin American bloc in the near future. In conclusion, it may be said that in the FTAA the competition will involve logistics chains rather than products or raw materials. This offers multiple opportunities for the creation of services related to these chains. 4.4.2 Intraregional trade Intraregional trade in Latin America takes place mostly by ship although terrestrial transportation will be increasingly important in the future as a result of the construction of road axes which are contemplated in recent subregional agreements. Thus, on the continental level, transportation and logistics will be fundamental for the development and competitiveness of the country. Regarding the marketing of services related to coal producing activities, Colombia has particular experience in research, mining investment projects, export control and environmental auditing. 4.4.3 Service sales in the past Professional services. Carbocol and later Ecocarbón sent Colombian professionals to Guatemala, Haiti and Cuba to set up exploration programs and the inclusion of carboelectric power plants. They also carried out the sale of briquette production plants with Colombian technology. These professional services were paid for by the Latin American Energy Organization (Organización Latinoamericana de Energía -OLADE). The sale of carboelectric power plants. Together with private industries, the sale of a package that included the coal market, a carboelectric power plant supplied by Distral and technology transfer was negotiated in Costa Rica.

CHAPTER 5 OPPORTUNITIES IN
THE HEMISPHERICAL MARKET

CHAPTER 5 OPPORTUNITIES IN
THE HEMISPHERICAL MARKET 5. OPPORTUNITIES IN THE HEMISPHERICAL MARKET Now we describe the behavior of Colombian coal exports to the countries on the Atlantic and Pacific coast and according to the type of coal. 5.1 THERMAL COAL 5.1.1 Atlantic Coast The United States The markets for Colombian thermal coal have traditionally been on the East Coast of the United States and North American ports located on the Gulf of Mexico. In 2003, the great producers of Colombian coal: Cerrejón Zona Norte (CZN) and Mina Pribbenow (Drummond Ltd.), shipped close to 13.0 Mt to this area. This accounts for 90% of the total exported to the United States. Medium sized exporters such as Carbones del Caribe, Carboandes, Inter-American Coal (IAC) and other small exporters carried out sporadic exports to these markets. In terms of the share of the total coal that is imported, Colombia is the main supplier. This supply is destined especially for thermoelectric generation and Colombia is seen as a reliable supplier and its high quality coal is used for the development of their substitution and expansion plans for years to come. Canadá Colombian exports to Canadian ports on the Atlantic coast are destined for electric power generation, in amounts that range from 1.5 Mt/year and 1.7 Mt/year. The main suppliers of this market are CZN and Drummond Ltd. Dominican Republic Thermal coal consumption in this country is represented mainly by the carboelectric centrals of ITABO I and II, with close to 700,000 t/year and Cementos CIBAO, which demands thermal coal in the neighborhood of 60,000 t/year. Puerto Rico

Thermal coal importation is carried out by Puerto Rico Energy Authority (PREPA), whose main suppliers have been Colombian exporters, recently Drummond Ltd. with close to 1.5Mt/year. Mexico Through the ports on the Mexican Atlantic coast, la Comisión Federal de Electricidad (CFE) is mainly in charge of thermal coal importation to supply the consumption of its carboelectric power plants which are located in the municipality of Piedras Negras, state of Coahuila, with an annual demand of close to 500,000 t/year. However, the main supplier of the CFE for the northeast of the country is the United States via railroad, although Colombian exporters could compete with dispatches to the port of Tampico. Guatemala Colombia is currently the only supplier of Central Generadora Eléctrica San José, with its annual consumption of approximately 400,000 t. Likewise, Cementos Progreso supplies itself mainly with Colombian and Venezuelan thermal coal. Costa Rica The cement industry demands between 40,000 and 80.000 t/year, which are supplied by Colombia and some occasional shipments from Venezuela. Honduras Importations are carried out for the UMAR-Holcim cement industry and Cementos del Norte, with an annual demand of 150,000 to 200,000 t, supplied mainly by Colombia and Venezuela. Jamaica The most important potential client is Caribbean Cement with consumptions of about 60,000 t/year, which are normally supplied by Colombian producers in small shipments (Handysizes or Coasters). Argentina Although Colombian thermal coal has been exported sporadically to the Central Térmica de San Nicolás, these exports have reached 700,000 t/year and therefore constitute a significant market niche. 5.1.2 Pacific Coast Mexico Imported thermal coal for Puerto Lázaro Cárdenas, state of Michoacán on the Pacific coast, has come from Australia lately and it is destined for the Petacalco power central, which accounts for 6.0 Mt/year. The limiting factor for Colombian producers in terms of competitiveness is the over

cost which is generated by the payment for passing the Panama Canal (US$1.5/t y US$2.0/t), which raises the CIF price significantly. Central American Countries The demand for thermal coal in these countries is relatively small although it tends to rise in Costa Rica, Guatemala, Nicaragua and El Salvador, as part of their electrical expansion plans with medium sized and small generating plants. Peru Exports from the port of Buenaventura have increased noticeably in recent years. They reached the amount of 600,.000 t in 2003. Colombia and Venezuela are still important suppliers of this market due to their geoChartical proximity and the importance of duty free importation for coal coming from the Andean Community of Nations (CAN). Ecuador Colombian exports of thermal coal for “Cementos Nacional S.A.” started in 2003 with an annual consumption of 150,000 t. Chile Importation of thermal coal for electric power generation varies according to the rain regime, given that most generation comes from hydroelectric plants. However, Colombian exports have increased lately and they are expected to reach 1.0 Mt/year due to the recent Argentine decision to cut back the gas supply to Chile by 35% because of the increase in their domestic consumption. 5.2 COKING COAL 5.2.1 Atlantic Coast Venezuela In spite of being a thermal coal producer and exporter, there are no reports of the production of coal with coking characteristics. However, the main Venezuelan buyer of metallurgic coal is Sidor (Siderúrgica del Orinoco C.A.), a company that goes out to the international market twice a year to buy a total of 60,000 t. This demand is expected to be stable in coming years. United States The demand for imported coking coal in the United States is small mainly due to the large domestic production, the decline in the demand because of technological advances and high quality demands. Brazil

Within the hemispherical market, this is seen as the market with the greatest potential for Colombian coking coal and coke, with annual imports in the neighborhood of 12 Mt. The great Brazilian metallulrgic industry started to demand coal from Colombia, starting with PCI or coal that is pulverized to be injected into kilns; however, there is concern in the industry for the guarantees of homogeneity and consistence of the quality parameters that may affect Colombian exporters, particularly regarding the CRI4 and CSR5 indexes. Within the range of coking coal or PCI consumers, it can be seen that some only import the first type of coal or PCI. Such is the case of Compañía Siderúrgica de Tubarao (CST). Others import only coke and the others require both coking coal and coke, such as Usiminas, Açominas, Cosipa, and Compañía Siderúrgica Nacional (CSN Brasil) One adverse factor for coal export to Brazil is the freightage from the ports on the Atlantic coast to specialized Brazilian ports, which turns out to be particularly costly when small ships are used (less than 25,000 t DWT6) 5.2.2 Pacific Coast Mexico Colombian coking coal has a competitive disadvantage due to the laws that favor importation from countries in the “North America Free Trade Agreement” (NAFTA), which privileges coal from Canada and the United States with up to 10% in tariff favorability. The great potential for the importation of coking coal by Mexico is in the Pacific area and more exactly through the Lázaro Cárdenas port. Furthermore, the steel industry is initiating PCI processes and the demand is expected to increase in years to come. Peru Peru is the main consumer of the coking coal and coke that is exported through the Colombian pacific coast, and it demands the whole range of coking coals from low to medium and high volatile matter content coking coals. Their steel industry has important firms such as Siderperu, la Corporación de Aceros de Arequipa and Doe Run Perú, with a total requirement of approximately 180,000 t/year. In conclusion, this is a market that is expected to expand as the internal demand for steel and iron expands. Chile
4 CRI : Coke Reactivity Index 5 CRS : Coke Strength After Reaction 6 DWT: Dead Weight

Coking coal consumption in Chile is in the neighborhood of 800,000 t/year. Their main suppliers are Canadian producers; however, they also import from Australia and China Capesize vessels. 5.3 COKE 5.3.1 Atlantic Coast The potential demand for Colombian coke is important in the area of the Atlantic y the most important markets are: United States The East Coast and some processing centers in the area of the Gulf of Mexico may be seen as target markets for Colombian coke. Foundry coke has a great possibility to be sold in the states of Florida and Texas; likewise, metallurgic coke or “metcoke” has good possibilities to be sold at the industrial centers of Illinois, Ohio and Pennsylvania Countries in Central America Demand for foundry coke has been detected in Costa Rica, El Salvador, Guatemala and Panamá. This demand may be met by small Colombian producers, by means of suitable transportation logistics, keeping in mind that this product must be mobilized in containers. Countries in the Caribbean Area The Dominican Republic demands small amounts of coke which are supplied by Colombian producers. Cuba is a natural market for Colombian coke since this country lacks other suppliers in the Caribbean region. Ispat has a branch office in Trinidad and Tobago called Caribbean Ispat. Venezuela In addition to coking coal, Sidor demands approximately 25,000 t/year of metallurgic coke and fine coke (finos de coque). This is normally supplied by Colombian producers. Brazil It is a market with a great potential for the sale of Colombian coke, not only metallurgic coke but also foundry coke. The centers of foundry coke consumption are located mainly in the states of Sao Paulo, Minas Gerais and Santa Catarina, in the south of the country. There are 1,140 foundries which are concentrated mainly in the state of Sao Paulo and are associated with the automotive industry, 600 of which belong to the Brazilian Foundry Association Fundición (ABIFA).
The demand for metallurgic coke is concentrated in the great Brazilian industry, which comprises companies such as Cosipa (COS), Ascetita and ACOMINAS, with a total demand of approximately 1,200 t/year. Some foundries in Brazil have purchased Colombian cokes in the past, but these have been displaced by coke coming from China, which currently has a strong presence in that country. 5.3.2 Pacific Coast Peru Currently the only supplier of coke on the Peruvian market is Colombia and the main consumer of this product is Siderperú, which consumes between 35,000 t/year and 50,000t/year. Chile Compañía Siderúrgica Huachipato (CHS) is the only integrated steel producer in Chile, with a production of 1.2 Mt of liquid steel per year; coking coal and coke are purchased through ABCAP supply marketer, which goes to the international market every year to purchase between 25,000 t and 50,000 t of metallurgic coke, under the occasional contract modality. Another important sector for coke consumption in Chile is the sugar industry, which imports approximately 7,000 t/year of Colombian coke.

CHAPTER 6
MAIN IMPORTING COMPANIES

CHAPTER 6
MAIN IMPORTING COMPANIES 6. MAIN IMPORTING COMPANIES Recent international circumstances (China´s development and oil prices), have substantially raised the freightage of thermal coal imports into the United States. This factor is a very important factor for exportation from Colombia and it represents a clear opportunity for all the national producers. Colombian coking coal exports have been accepted by some foundry coke producers in Latin America. Such is the case of Doe Run in Peru, with technical requirements which are met by the quality of the coals that are being exported. However, the steel industries have certain technical specifications for the coking coal that they use to produce coke for their processes, and Colombian exporters have not implemented them in order to become their permanent suppliers. Particularly, the requirement of homogenous quality in large amounts means a great obstacle for Colombian production as long as the coal comes from a great diversity of mine and coalfields. In order to generate informative support to coal producers and exporters from the Cundiboyacense region and Norte de Santander, we present information on countries of the American continent where market niches are perceived not only in the generation of electricity or industrial steam, but also in the demand for foundry cokes. 6.1. THERMAL COAL CONSUMING COMPANIES United States The main centers of coal entry and consumption areas recorded the following volumes in 2003:
Consumption Area Volume (Mt) Mississippi River 11. Mobile 19.0 Florida 13.0 Southern East Coast 17.0 Northern East Coast 22.0 Others 4.0 Source: U.S. International Energy Agency - IEA (2004)
The companies that already are importers of thermal coal from Colombia and Venezuela in these areas are listed in Annex C.1 (available at the Assistant Directorate of Mining Planning of the UPME), which may also become potential clients for the producers from the inland, who

could unite in order to achieve sales of larger volumes or improve the technical specifications of the coals from the Atlantic Coast by means of mixtures. Brazil Some companies of the metallurgic and steel sector in Brazil which have recently imported Colombian thermal coal are listed in Annex C.2 (available at the Assistant Directorate of Mining Planning of the UPME). Like the previous case, exporters from the inland could have access to some of these companies by means of similar mechanisms or agreements. Brazil cement producing groups are big consumers of energy in their processes, and if the price of the petroleum products that they consume with a governmental subsidy rises, they could be a potential market for Colombian thermal coal, competing mainly with South African coal, although at a disadvantage in terms of freightage. 6.2 FERROUS AND NON-FERROUS FOUNDRIES Due to the circumstances of the production of steel coals and cokes in Colombia destined for the markets of the United States, Mexico and Brazil, the exportation of cokes used in foundries seems more likely on the short and medium term. It is convenient to remember that, in general, in electric ovens it is preferable to use cokes which are produced from coking coals with a high volatile matter content, such as those available in Cundinamarca, Boyacá and Norte de Santander. However, these cokes do not have the required mechanical resistance for their use in iron and steel industries, but in foundry ovens, they contribute to the process and act as reducers. United States In Annex C.3 (available at the Assistant Directorate of Mining Planning of the UPME) is a directory with 31 foundries of ferrous and non-ferrous alloys in the United States. They are located in the states on the Gulf of Mexico and the East Coast. These companies were chosen keeping in mind that the possibility of doing business with foundry coke is concentrated in these states, in terms of the CIF foundry price compared to the cokes produced locally. In the revision carried out about the foundries of the United States, it was found that almost all of them have electric ovens. It is worth mentioning that they do not use the technology of cupola furnaces anymore. It can be inferred from the technology they use at these plants and the number of employees that consumption of foundry coke of each one of them is in the 0 to 99,000 t/year. Mexico In Annex C.4 (available at the Assistant Directorate of Mining Planning of the UPME) a directory can be found with the information on 29 foundries which are established in Mexico. It can also be inferred that, by the type of technology and the size of the plants, the individual consumption of foundry coke is in the abovementioned range of 0 to 99,000 t/year.

Brazil Annex C.5 (available at the Assistant Directorate of Mining Planning of the UPME) shows a directory with information on 72 ferrous foundries in Brazil. In this case, it can also be inferred from the technology and the work force that the consumption of foundry coke per company is in the range of 0 to 99,000 t/year. In Annex C.6 (available at the Assistant Directorate of Mining Planning of the UPME) there is a directory with information on 14 non ferrous foundries in Brazil. 6.3 COKE IMPORTING IRON AND STEEL INDUSTRIES For the case of Colombian coke producers, it is vital to advance in the solution of multiple mining issues such as washing and homogenization of coal, infrastructure, coke manufacturing processes and quality control which have an influence in the availability and quality of steel coke. This will allow producing the quality and quantity which is required by the buyers for steel furnace processes before contacting consumers in order to negotiate successfully and establish long term commercial relationaships. United States In Annex C.7 (available at the Assistant Directorate of Mining Planning of the UPME) there is a directory with information on two groups of steel producers in the United States that we know have imported steel coke in the recent past: United Steel Corporation and International Steel Group Inc. It is convenient to point out that the coke that these groups import for their steel industries is steel quality coke which is produced in Japan by companies of the Mitsubishi and Mitsui groups; this is high quality steel coke which is produced in cutting edge coking ovens that produce a reliable supply. The magnitude of the coke importations of these two corporations allow them to be classified in the range of big buyers: more than 1 Mr/year of steel quality coke. Mexico In Annex C.8 (available at the Assistant Directorate of Mining Planning of the UPME) there is a directory with the five main steel producing companies in Mexico. Brazil In Annex C.9 (available at the Assistant Directorate of Mining Planning of the UPME) there is a directory with the biggest steel producing companies in Brazil. It is convenient to bear in mind the American company Sun Coke, in Ohio, started the construction of a coke plant in Tubarao, which will start producing 1.8 Mt coke annually during

the third quarter of 2006. This production will drastically reduce the need to import steel and foundry coke in the Brazilian market.

CHAPTER 7 ESTABLISHMENT AND
CHARACTERIZATIONOF THE MAIN NICHE MARKETS

CHAPTER 7
ESTABLISHMENT AND CHARACTERIZATION OF THE MAIN NICHE MARKETS
7. ESTABLISHMENT AND CHARACTERIZATION OF THE MAIN NICHE MARKETS The main niche markets for producers from inland Colombia, from the point of view of the greatest potential volumes in sales, are found in companies such as: • Ferrous and non ferrous foundries in the United States, Mexico and Brazil for foundry coke. • Thermoelectric power plants in the United States, in the area of the Gulf of Mexico and the
East Coast for thermal coal. For the ferrous and non ferrous foundry market The characterization of these niche markets comprises the following criteria: Commercial criteria: a) We compete mainly with local companies which are specialized in producing foundry cokes
which are accredited by a ISO 9002 certification and a QS-9000 registry. b) We also compete with foundry cokes produced in China and marketed throughout the
American continent. Technical criteria: The companies which are specialized in producing foundry coke supply the market of ferrous and non ferrous foundries with the following typical quality:
Component Percentage in Weight %
Volatile matter 0.4 – 1.0 Fixed carbon 92.5 – 93.5 Ash 5.4 – 7.1 Moisture 1.0 – 5.0 Sulfur 0.5 – 0.7
Size Inches Process
More than 4 Iron foundry Between 4 and 3 Reduction

Between 3 and 1½ In industries to elevate the cabon content Between 1½ and 0 Manufacture of coke as inert
For the market of thermoelectric power plants of the United States, in the areas of the Gulf of Mexico and the East Coast The characterization of these niche markets takes into account the following: Commercial criteria: a) We compete mainly with local coal producers which have not been competitive compared to
imported Colombian coal. However, the new coal price levels and of maritime transportation that have been generated in the last two years may encourage the participation of some local companies in this niche.
b) Accreditation of producing and exporting companies with the peritnent ISO norms facilitate
reaching commercial agreements. c) The depth limitations of the ports in the United States that do not allow access of large
Capesize type ships in the zones of interest, give a price advantage to coals coming from Colombia given that for short distances small and medium sized ships are more efficient.
d) The cost of internal transportation of thermal coal from the Cundiboyacense altiplano to the
ports on the Atlantic coast are still an obstacle in spite of the high levels of the FOB price for exportation.
e) An alliance between the producers from the inland and the great exporters on the Atlantic
coast may contribute to a greater presence of thermal coals from the inland in the United States.
Technical Criteria: a) At thermoelectric power plants of the United States they generally prefer the highest
calorific values and Hardgrove index, with sulfur contents of less than 1% as it is received (NAR).
b) There are requirements about the alkaline content in the ash and about its fusion
temperature in the reducing environment. c) The Department of metallurgy of the National University has developed coal mixture
predictive software for cokes.

CHAPTER 8 ACTIONS TO FAVOR
MARKET PENETRATION OR GROWTH

CHAPTER 8
ACTIONS TO FAVOR MARKET PENETRATION OR GROWTH
8. ACTIONS TO FAVOR MARKET PENETRATION OR GROWTH The identified niche markets in ferrous and non ferrous foundries, which are cutting edge facilities, on one side, and thermoelectric power plants on the other, require that exporting companies and their products be reliable and competitive. In a highly competitive environment, a Colombian exporting company will not have stable access if it is associated with conditions such as child labor or environmental degradation, or if the quality of its product is not permanently homogenous, among other aspects. Therefore, within the productive chain of the inland it is necessary to continue with improvement and optimization actions in the following liks: a) Mining exploitation b) Social and environmental aspects c) Coal transportation and beneficiation d) Coke production e) Quality control f) Transportation g) Ports h) Trading and marketing i) Legal framework j) Financial system As there are multiple activities to develop (o continue developing), it is suggested that the recommendations contained in the studies that have been carried out be implemented. The following studies have been carried out, among others: a) “Strategic coke research program”, by Minercol, Colciencias and Fundación Tecnos, 1999. b) “Study of the potential exportable coke production in Cundinamarca and Boyacá,” by
Proexport and CIMA, 1999. c) Coal mixture predictive software for cokes, by the Departament of Metallurgy of the National
University. As fundamental specific actions to be implemented to achieve a greater share of the niche markets sugested in this document, the following two actions are proposed: a) To obtain the pertinent ISO certification for the companies that produce and export coke,
thermal coal and metallurgic coal.

b) To produce foundry coke with the typical quality that is supplied by manufacturers in the United States.
Clients target market The companies which are listed in these annexes constitute new markets for the producers and exporters from inland Colombia but their determination to be considered target clients requires marketing work which is beyond the scope of this study. However, it can be said that in these niche markets there is a potential demand for the coals from the inland which exceeds 2 Mt/year. The following is a list of the number of target market companies by their range of purchase of thermal coal and coke.
Ranges of Purchase Country
Total companies listed
(Number) < 100 Kt
(Number) 100 and 500 Kt
(Number) 500 Kt
(Number) Thermal coal United States 27 17 7 3 Brazil 6 4 2 Foundry coke United States 31 31 Mexico 72 72 Brazil 44 44 Steel coke United States 2 2 Mexico 5 4 1 Brazil 5 3 2
Source: Barber T.H., Market Analysis 2003 Internet, vía fax o telefónicamente

CHAPTER 9 MEASURES TO PROMOTE THE USE OF COAL IN THE
COUNTRY

CHAPTER 9
MEASURES TO PROMOTE THE USE OF COAL IN THE COUNTRY
9. MEASURES TO PROMOTE THE USE OF COAL IN THE COUNTRY Even though coal is the most plentiful source of energy in the country, which is distributed throughout the country, the percentage of its share of energy generation in Colombia has been declining: while in 1995 the net effective capacity corresponding to carboelectric generation was 6.2%, in 203 it was 5.4%, without including Termoguajira. For some time, the Ministry of Mines and Energy, through its companies Carbocol, Ecocarbón and Minercol respectively, carried out programs for the promotion of the use of coal in the country. These programs, however, did not achieve great advances, especially facing their energy generating competitors: natural gas, oil and hydroelectricity. These programs included proposals of legal norms, technical actions, technological research and development, follow up for new uses and promotion credit, among others Currently, the global and national panorama of energy resources shows a generalized increase of oil, gas and coal, not only thermal but alto metallurgic coal. There is also the juncture that if no petroleum is found on the short term, the country will become an importer of crude oil. This panorama means that coal could have possibilities of increasing its internal consumption, which would fundamentally depend on: Legal measures. The coal producing sector should try again to obtain the approval of the bill that favors coal-based electric power generation. This bill was aimed at making the investment in caboelectric power plants financially viable. The electrical sector is considered to be where the greatest use of coal could be expected. This sector should also carry out the pertinent actions in order that coal does not lose its independence in relation to the other sources of energy and preserve the resources that it is entitled to pursuant to the Royalties Law. By means of legal action, the sector should try to find measures that allow FOB costs to be competitive for exporters from the inland on the medium and long term. Costs. With the current costs of oil and gas, it is worth revising to determine if coal is more competitve now. It is known that coal-fired thermal power plants have a greater initial cost than gas-fired power plants, but they last much longer and that the cost of generation of kilowatts per hour is more economical than the corresponding cost of a turbogas system (Ecocarbón, 1995). Application of other technologies. The study and application of technologies such as the gasification of coal shoul continue especially in the brick and ceramic sector. Other technologies that should continue to be worked on are the coal, fuel oil, depressant and water mixtures (CCTA) to substitute petroleum products, given the juncture that the country may

become an importer of this fuel and to work again on carbochemical projects such as liquefaction. Substitution. It is advisable that the work on the substitution of firewood for coal continue in order to lower the deforestation rate. Another aspect that should be studied is the substitution of gas and petroleum products for coal in the industrial sector due to the existing prices and the possibility of an insufficient oil supply in Colombia. The following are some considerations to promote the use of coal in the country, by sectors: Rural residential sector In this sector the objective is to look for the way to reduce to a minimum the ecological impact produced by the massive use of firewood. In order to achieve this the substitution of firewood for coal briquettes has been suggested by means of studies that initially considered addressing the problem in the coffee growing areas of country, but this could be generalized to all the regions where there is knowledge of deforestation problems. However, this initiative, that different national and departmental governmental entities have been working on, is another alternative along with the effort that Ecopetrol is making to make LPG available in the same zones, particularly since this fuel has been displaced by natural gas as its network increases its coverage. According to the studies on substitutes that Ecocarbón once carried out, the marketing potential of briquettes as a replacement for firewood used as a source of energy was estimated at 1 Mt of coal per year. Industrial consumption Consumption of fuels in the industrial sector is destined for the generation of heat and steam in their processes and for the generation and cogeneration of electricity. The possibilities of substitution for coal are determined by the technology that is used in the industrial process (combined cycle boilers, boilers that allow the use of liquid, gaseous or solid fuels) and the capacity to invest in the reconversion of their facilities. Brick and ceramics sector For the promotion of the use of coal in the brick producing sector, the substitution of the use of firewood must considered especially to use suitable technology and avoid deforestation; likewise, the operating conditions of small brick kilns that consume coal should be improved in order to improve their efficiency and therefore control their environmental effects. This sector has experience and tradition in the use of coal. In some cases the technological level is precarious and the big brick producers have the highest technological level. Although they are few in number, they account for the greatest share of the production on a national level.

It is necessary to introduce programs of gradual conversion to clean technologies, in order to achieve clean and efficient production processes which guarantee the continuity of the industry in terms which are compatible with the community´s welfare. Cement sector The cement industry has been developing and implementing the construction of new plants and expansion of existing plants with an average annual growth of their effective installed capacity of production of 5.8%. This favors coal consumption; in fact; consumption grew by 8.6% in 2004 (944 Kt consumed). Panela (brown sugar loaf) agroindustry Colombia is an important producer of brown sugar loaf in the world. Brown sugar loaf is produced from sugar cane in approximately 25,000 sugar mills of which only about 500 may be called big producers with a big enough capacity to pursue industrial conversion processes that the industry requires. Evaluations made by Ecocarbón about the possibility of substitution for coal at brown sugar loaf producing mills indicate a potential of maximum 1.33 Mt/year. Paper industry This industry has increased its coal consumption significantly. On average, this industry consumed 327 Kt during 2003, when consumption increased by 9.0% and in 2004, it increased by 8.0% with a consumtion of 328 Kt. The efforts to achieve substitution in this industry are based on the development of the possibilities to use coal as a fuel to manufacture paper, as it is being done in Valle del Cauca. Textile industry This industry has traditionally consumed coal especially in the department of Antioquia. Although the levels of consumption have been stable with amounts close to 130,000 t/year, 158,000 t were consumed during 2003, which accounts for a 20.9% increase compared to 1994 when 125,000 t were consumed, and a 22.4% increase in 2004 compared to the same period. Consumption at thermoelectric power plants Colombian power plants are fueled by gas or coal. There are power plants on the Atlantic Coast which are fueled by gas from the Guajira, but their systems were designed to burn coal too; therefore, there is a high potential for the use of coal by this sector. 9.1 USE OF COAL AS AN ENERGY SUBSTITUTE
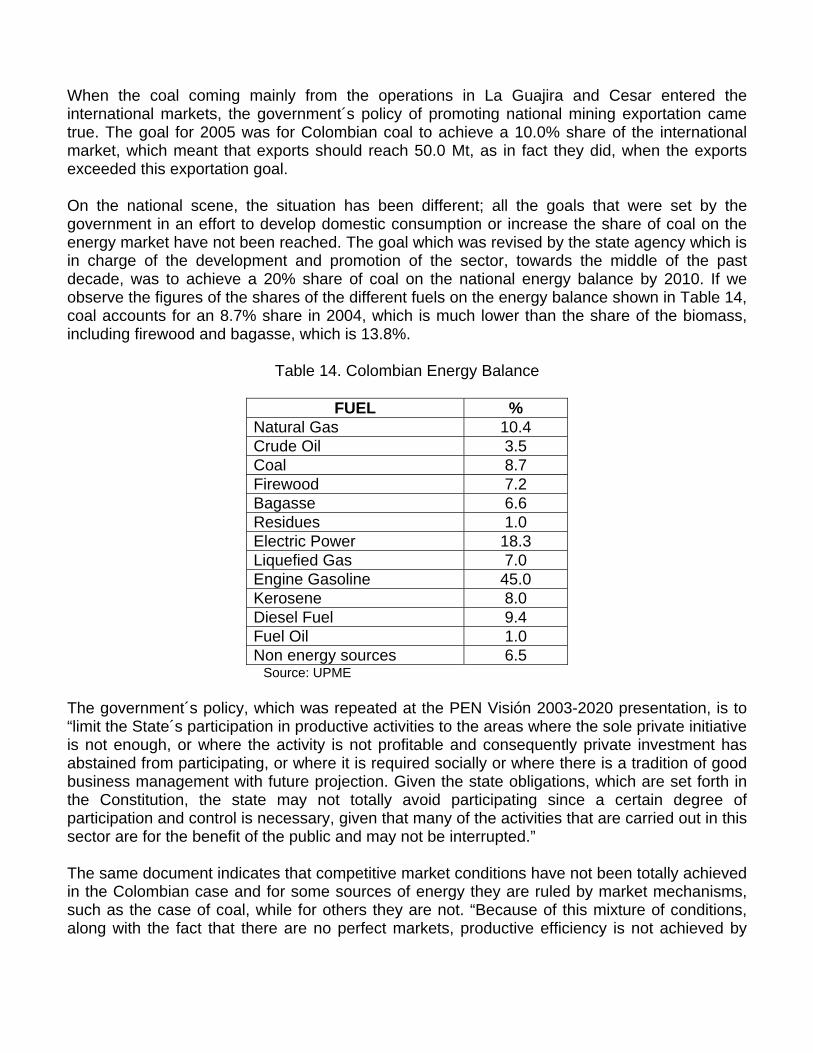
When the coal coming mainly from the operations in La Guajira and Cesar entered the international markets, the government´s policy of promoting national mining exportation came true. The goal for 2005 was for Colombian coal to achieve a 10.0% share of the international market, which meant that exports should reach 50.0 Mt, as in fact they did, when the exports exceeded this exportation goal. On the national scene, the situation has been different; all the goals that were set by the government in an effort to develop domestic consumption or increase the share of coal on the energy market have not been reached. The goal which was revised by the state agency which is in charge of the development and promotion of the sector, towards the middle of the past decade, was to achieve a 20% share of coal on the national energy balance by 2010. If we observe the figures of the shares of the different fuels on the energy balance shown in Table 14, coal accounts for an 8.7% share in 2004, which is much lower than the share of the biomass, including firewood and bagasse, which is 13.8%.
Table 14. Colombian Energy Balance
FUEL % Natural Gas 10.4 Crude Oil 3.5 Coal 8.7 Firewood 7.2 Bagasse 6.6 Residues 1.0 Electric Power 18.3 Liquefied Gas 7.0 Engine Gasoline 45.0 Kerosene 8.0 Diesel Fuel 9.4 Fuel Oil 1.0 Non energy sources 6.5
Source: UPME The government´s policy, which was repeated at the PEN Visión 2003-2020 presentation, is to “limit the State´s participation in productive activities to the areas where the sole private initiative is not enough, or where the activity is not profitable and consequently private investment has abstained from participating, or where it is required socially or where there is a tradition of good business management with future projection. Given the state obligations, which are set forth in the Constitution, the state may not totally avoid participating since a certain degree of participation and control is necessary, given that many of the activities that are carried out in this sector are for the benefit of the public and may not be interrupted.” The same document indicates that competitive market conditions have not been totally achieved in the Colombian case and for some sources of energy they are ruled by market mechanisms, such as the case of coal, while for others they are not. “Because of this mixture of conditions, along with the fact that there are no perfect markets, productive efficiency is not achieved by

means of market forces. This is when it is necessary for the State to direct and orient the policies of each one of the sources of energy...” As a result of the above, it is clear to see how the State´s participation has been fundamental in the development of energy producing sectors, such as the hydroelectric sector in past decades, the gas sector and currently the up-and-coming alcohol fuel, with financial participation o by means of direct or indirect subsidies which give greater possibilities to the development of these resources. 9.2 COAL PRICES WITH RESPECT TO OTHER SUBSTITUTES As we analyze the prices of energy resources, comparisons are limited by the participation of those whose price is administrated by the national government. Although thermal coal has traditionally had low prices, it must be kept in mind that it has a comparative disadvantage when it comes to comparing since it is the only energy resource whose trade is carried out under free supply and demand conditions. In the comparison of coal´s competitiveness compared to other energy resources, we include here some considerations about the topic which have been extracted from reports on relevant studies that were carried out by the state coal agency. Castilla crude and Rubiales crude These do not count as competitors of coal. Among the energy resources that raised their price, Castilla crude is highlighted in first instance as its price rose by 180.0%. This results from the price strategy which was implemented by the national government to eliminate its use as an energy resource, according to the environmental regulations in effect, which is aimed at mitigating environmental impacts. Prices were raised in such a way that crudes were excluded as fuels. Due to their high polluting properties, they have been directed to other processes for the production of other products such as the case of mixtures that are made to improve the quality of asphalt in the construction of pavements in national roads among others. Fuel Oil On average the price of fuel oil exceeds the price of thermal coal by 15.0%-30.0%. The prices of fuel oil and coal have risen by 21.0% and 18.0% respectively in recent years, which in real terms are very low growth rates. Due to the prices at which fuel oil is sold on the international market, most of its sales are in this market. The price of fuel oil was controlled by the MME until 1991, when it was placed under the regime of monitored price freedom. Diesel Fuel

It is the most expensive liquid fuel in the Colombian market. It is used for diesel engines in the transportation sector and preferentially in local medium size and small industries since it is an easily used and safe fuel that does not require a large infrastructure. In spite of its relatively high price and its low efficiency compared to other fuels, the variables that determine its demand are: easy storage, handling and the access that industrial consumers have with diesel fuel. Natural gas As of 1993, the price of natural gas is set in American dollars. Users pay their consumption liquidated at the representative exchange rate of the market for the month immediately prior to the date of the invoice. In the future, the deregulation of gas prices will define the relative position of this energy resource before its substitutes. The fact that main gas pipelines and local distribution pipelines cover all the regions of the country efficiently will have a great influence on prices. The price deregulation should tend to phase out the subsidy for industrial consumption, which will favor the relative position of coal as a substitute. The higher relative price of natural gas compared to thermal coal favors its permanence as a source of steam and heat generation in enterprises of the industrial sector. Liquefied petroleum gas (LPG) The price of LPG has annual adjustments by means of MME resolutions, which are driven by political, national or regional type factors, and not aspects which are inherent of its production and distribution. In terms of the price only, thermal coal has a comparative advantage over LPG. The petrochemical industry accounts for one third of the LPG consumption, for which coal in its natural state is not a suitable substitute. The residential sector accounts for the other two thirds of the consumption for cooking and heating water. In the residential sector it is being progressivelly replaced by natural gas as main and local distribution gas pipelines are extended to the inland and to the west of the country. This substitution causes LPG to be displaced towards the rural sector. From the economical point of view, this displacement may represent an opportunity for thermal coal (briquettes) as an alternate source of energy to firewood. Electric power Due to the multiplicity of applications that electric power has compared to thermal coal, the analysis of the competitiveness between the two cannot be done for final users. The relevant comparison is presented in the electric power generation stage, comparing thermal coal to alternate sources used for generation.

From the point of view of the security of the national electrical system, the position of thermal coal is insuperable. A coal-fired plant is much less vulnerable in the supply of its source of energy than a gas-fired plant. In fact, coal mining and transportation are less subject to national security problems than gas fields and gas pipelines. Technical aspects of the substitution Crude oil, the Rubiales crude and natural gas are fuels that are consumed for the generation of heat, steam or transformation processes due to their easy handling and transportation, as well as their comparative price advantage compared to other fuels. In general, if the equipment is designed to consume this type of fuels, its conversion to coal is technically possible although the costs of the conversion must be taken into account. In the substitution of boilers, besides the technical aspects of the substitution, the aspects that correspond to the environmental handling of ash, the removal of sulfur oxides (Sox) and nitrogen oxides (Nox) must be taken into account. The modification in ovens is a similar concept to that of boilers, with the difference that the walls have refractory walls. We already have the experience in Colombia with the substitution of other fuels for coal in cement producing plants. Domestic kitchens that consume firewood may use coal without any modifications. In the case of using briquettes, it would be necessary to build the corresponding ovens or the build the kitchens with refractory brick. Like wise, the firewood that is used in sugar mills may be replaced with coal, keeping in mind the handling of ash. The concept of firewood substitution for coal in bakeries is also valid, changing the type of oven for a radiant type of oven, keeping in mind the handling of ash and coal. The substitution of electric power for coal is practical in facilities that employ electricity as a heating element or as part of a process. In these cases it is necessary to consider the investment in efficient particle separation systems so as not to affect the processes, for instance in textile factories. The boilers that were built for thermoelectric power plants were designed to consume liquid and gaseous fuels besides coal. Some of them burn natural gas, such as Termocartagena, Termoguajira and Termobarranquilla on the Atlantic Coast. Termoguajira was designed to burn coal; however, its proximity to the Ballenas Cartagena gas pipeline makes it convenient to burn gas. The same thing happens with Termocartagena, which also has the facilities to burn coal. Termobarranquilla was refitted to burn natural gas, which discards the possibility of burning coal. Sugar plantations have boilers which are designed for solid fuels such as sugarcane bagasse and coal. Some of the sugar mills consume coal under an agreement with Propal S.A, based on the scheme that Propal uses the sugarcane bagasse to produce paper and trades it for coal for the sugar plantations. The sugar plantations that only consume bagasse may consume coal without having to modify their equipment.
Quantification of the substitution • Fuel oil, diesel fuel and liquid fuel for domestic use (cocinol): keeping in mind the use of
each one of these energy resources, their potential of subsitution for coal was evaluated at 1.9 Mt/year (Cocinol: 1.03, Diesel: 0.15, Fuel Oil: 0.04).
• Gas: the most widely used energy resource in industries in direct heat and steam processes. The 25 largest industrial consumers had a substitution potential of 0.93 Mt/year, mainly the cement, petrochemical and food production sectors of the Atlantic Coast.
• Firewood and bagasse: firewood and bagasse which are used in heat and steam generation processes have a 15% of the technically substitutable potential on a national level. The sole substitution of bagasse would equal 1 Mt/year of coal; the substitutable consumption of firewood in the residential sector is 0.8 Mt/year and only 5 Kt/year of coal are substitutable in industrial plants.
The sole substitution of bagasse would equal 1Mt/year of coal. Regarding the consumption of firewood, in the residential sector 0.8Mt/year is considered substitutable and only 5 Kt/year are considered substitutable in industrial plants. Technical substitution possibilities The equipment that uses solid fuels (firewood, bagasse) are easily adaptable to use coal. The convenience of the substitution will be based on economical considerations regarding the relative prices of fuels. When an attempt is made to convert equipment that uses liquid or gaseous fuels to coal, generally there is a loss in the operational capacity due to the greater volume of gases that are generated and maintenance activities are increased due to the presence of ash.

BIBLIOCHARTICAL REFERENCES
International Energy Agency, IEA. Coal Information, 1998, 1990, 1994, 1998 y CD-ROM 2004. World Bank. Annual Reports 1995-2004. Banco de la República, Revistas anuales 1998-2004. Barber Tomas Harvey 2003. Market Analysis. CEPAL. www.eclac.org Coal processing Consultants Ltd., 1980. The Effect of Physical and Chemical Properties of coals on their Acceptability for Steam Generation. Holland. DANE, Colombia estadística 1998-2003. Ecocarbón 1996. Development Plan of the Coal Subsector 1997-2005. Bogotá. Ecocarbón 1998. Evaluación técnica, económica y financiera de tecnologías para producción de electricidad con Base en Carbón. Bogotá. Ecocarbón 1998. Development Plan of the Coal Subsector 1999-2010. Fenalcarbón 2003. Encuentro por la Competitividad del Carbón Cundiboyacense en las exportaciones – Análisis de oferta. Bogotá. Gobernación de Cundinamarca 2003. Asesoría dirigida a los mineros de los sectores del carbón y materiales de construcción para la titulación minera en el departamento de Cundinamarca. Ingeominas 2004. El Carbón Colombiano. Recursos, Reservas y Calidad. Bogotá. Market & Commodity News, 2004. First Energy Capital Corp Brokers. Minercol 1999. Recuperación del tejido social de las zonas mineras del carbón del altiplano Cundiboyacense. Minercol 2000. Resultados del Fondo Nacional de Investigación del carbón FONIC. Período 1985-2000. Bogotá. Minercol 2001. Oferta y demanda de carbón del Altiplano Cundiboyacense. Bogotá. Ministerio de Comercio, Industria y Turismo. Proexport. www.proexport.com.co Ministry of Mines and Energy. Memoirs al Congreso 1990 al 2003. PNUD – MINERCOL 2002. Estudio de abastecimiento de carbón en los departamentos de Cundinamarca y Boyacá. Steel Statistical Yearbook, 2004. www.worldsteel.org UPME 2000 Alternativas a la crisis socioeconómica derivada del consumo de carbón en el interior. Bogotá. UPME 2001 Mining Energy Statisticsr 1998-2000. Bogotá. UPME 2002 Plan Nacional de Desarrollo Minero 2002-2006. UPME 2004 Plan Energético Nacional. 2003-2020. UPME junio 2004 Análisis integrado de la oferta y demanda de energía en Colombia. World Coal Institute 2000 Coal Power for progress. World Coal Institute. United Kingdom. World Energy Council 2004 Coal: Reserves at end 2003. USA.
GLOSSAR & UNITS OF MEASURE ARA Ports Ámsterdam (the Netherlands), Rótterdam (the Netherlands) y Antwerp (Belgium) ASTM American Society for Testing and Materials Standards ASEAN Association of Southeast Asian Nations (Brunei, Indonesia, Malaysia,
Philippines, Singapore y Thailand) b Barrel of oil (crude) B/L Bill of Lading BSM Brazilian Steel Mills BTU British Thermal Units Capesize Vessel with more than 80,000 t DWT Carbocol Carbones de Colombia S.A. CIF Cost, Insurance and Freight CO2 Carbon dioxide COA Contract of Afreightment Coasters Small vessels, with less than 18,000 t DWT CRI Coke Reactivity Index CSR Coke Strength After Reaction DWT Dead Weight Ecocarbón Empresa Colombiana de Carbón Ltda., hoy Minercol Ecopetrol Empresa Colombiana de Petróleos EU European Union FOB Free On Board

Fonic Fondo nacional de investigaciones para el carbón FGD Flue Gas Desulfurization GWH Gigawatt/hour (106 watt-hours) Handysize Vessels of up to 45,000 t DWT IEA International Energy Agency Ingeominas Instituto colombiano de geología y minería JSM Siderúrgicas japonesas (Japanese Steel Mills) Kcal Kilocalories (103 calories) Kg Kilogram (103 grams) Km Kilometer (103 meters) Kt Thousand tons KV Kilo volt (103 volts) Lb Pound (0.4732 Kg) LNG Liquefied Natural Gas m meter (103 centimeters) Minercol Empresa Nacional Minera Ltda. In Liquidation MME Ministry of Mines and Energy Mt Million tons (metric) Mw Megavolts(106 watts) Nandina Tariff numbering system for Andean countries NAR Net As Receive NOx Nitrogen Oxides OECD Organization for Economic Cooperation and Development

OPEC Organization of Petroleum Exporting Countries Panamax Vessel between 45.000 and 80.000 t DWT PA Tariff document GNP Gross National Product PCI Pulverized coal injection (furnaces) Inch 2,54 centimeters PRC People's Republic of China SIN National interconnected system SO Sulfur Oxide Spot Short term and occasional coal purchase and sale t Metric ton (103 Kg) TWh Terawatt-hours (1012 watt-hours) UK United Kingdom (England) US$ United States dollar US$/t Dollars per ton US$/b Dollars per barrel $ Colombian peso