ministry of forests, lands and natural … of forests, lands and natural resource operations timber...
TRANSCRIPT

MINISTRY OF FORESTS, LANDS AND NATURAL RESOURCE OPERATIONS
TIMBER PRICING OPERATIONS
Timber Measurement Information
February 14, 2012

February 14, 2012 1
INTRODUCTION The information in this document is provided as background to promote a better understanding of the volume estimates that can affect the variation between the cruise estimate and the scale + waste (experienced) in a cutting authority. This paper addresses some of the reasons why the cruise net volumes can vary from the scale + waste assessment net volumes. The information in this report does not provide legal or policy advice. For more information on the standards and methods used to measure timber for appraisal, clients may wish to reference such documents as the Cruising Manual, Scaling Manual and the Provincial Logging Residue and Waste Measurement Procedures Manual. TIMBER CRUISE The timber cruise provides an estimate of the net merchantable volume (volume) and quality of the timber in the harvest area. In the interior, quality is reported on a lumber recovery factor (LRF) basis in board feet per cubic meter (LRF), while the coast uses statutory log grades. The volume approximates wood that is in live (excluding live useless trees) and dead potential trees that are at least 50% sound wood, inclusive of saw logs, pulp logs (chips) and firm wood rejects with the following general merchantability specifications:
• Maximum stump height: 30 cm
• Minimum diameter at breast height (DBH = 1.3m above high side ground): Coast and Interior = 17.5 cm, except 12.0 cm in immature cut blocks on the coast and 12.5 cm for Lodgepole pine in the interior.
• Minimum log top diameter (inside bark), Coast and Interior: 10.0 cm, except 15.0 cm for mature cut blocks on the
coast and interior cedar >141 years of age.

February 14, 2012 2
The cruise estimates are derived by establishing plots on a random grid throughout the harvest area. Within each plot, a number of trees are carefully measured for such attributes as height, diameter and age; other information such as species and quality indicators are also collected. The Cruising Manual specifies cruise design and measurement error standards for the quality of the field information. For example, tree count can vary by 1 tree in 50 measured, tree heights can vary by 5%, and tree species identification can vary by 1 tree in 50 sampled.
The attribute information collected from the trees within the plots is summarized in a timber cruise compilation program. The program estimates the gross volume of the trees in the plots using equations that predict the form or shape of the tree
February 14, 2012 3
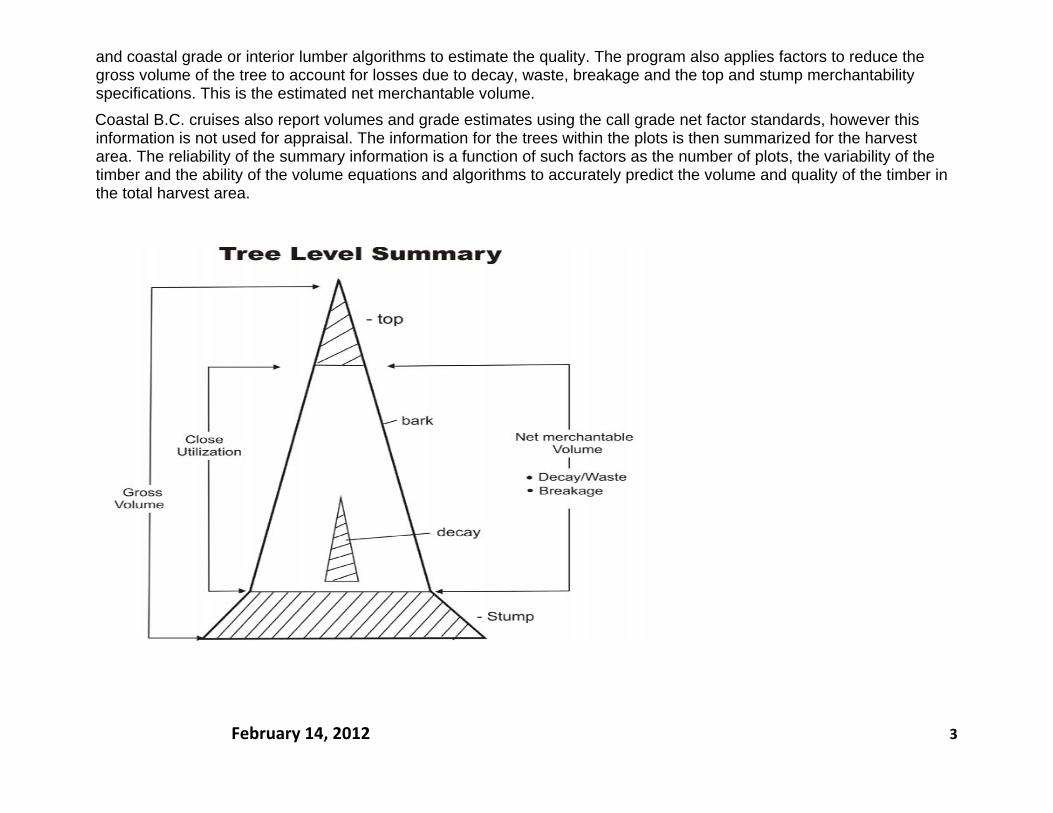
and coastal grade or interior lumber algorithms to estimate the quality. The program also applies factors to reduce the gross volume of the tree to account for losses due to decay, waste, breakage and the top and stump merchantability specifications. This is the estimated net merchantable volume. Coastal B.C. cruises also report volumes and grade estimates using the call grade net factor standards, however this information is not used for appraisal. The information for the trees within the plots is then summarized for the harvest area. The reliability of the summary information is a function of such factors as the number of plots, the variability of the timber and the ability of the volume equations and algorithms to accurately predict the volume and quality of the timber in the total harvest area.

February 14, 2012 4
The program generates statistics of the average net volume per hectare for the harvest area and the range or variability of that volume that may be expected from the cruise estimate. The amount of variability around the average volume is expressed as the sampling error. In B.C. the common sampling error target for scale based sales is 15.0% at 2 standard errors, or 19 times out of 20 for all species combined. This means that the expected volume per hectare, estimated using the information collected in the field, merchantability standards, tree volume equations used within the compiler, should be within 15.0% of the estimated average cruise volume, 19 times out of 20. For Mountain Pine cruise based sales the standard is 12.0% and for general cruise based sales the standard is 8.0%. The Cruising Manual also allows for the sampling error to be waived if a minimum number of plots per hectare and tree count per plot are achieved. In these cases, the sampling error standards may be exceeded. The sampling error for individual species volume per hectare is higher than the sampling error for all species combined. Refer to Appendix I and II for some definitions and practical uses for the interior and coast cruise compilation reports. The cruise is therefore an estimate of the net merchantable volume and quality of the trees on the harvest area and may not reflect the actual volume or quality of timber harvested. HARVEST OPERATIONS Harvesting operations may utilize and process logs to specifications that differ from the merchantability specifications (e.g. different top size, log length, bucking practices, stump height) which may increase the variation between the predicted net cruise and experienced volume. For example; changing log top size utilization from a 10.0 cm top to a 12.0 cm top may reduce the net volume by 5%. The magnitude of the volume loss will vary significantly by species, stand type, stand age and other variables. SCALING Weight scaling is a sampling method where all of the truck loads of logs are weighed and some of the loads are selected for sampling. The sample loads are piece scaled to determine a volume-to-weight ratio. The ratios derived for the sample loads are multiplied by the weight of all of the truckloads of timber to calculate the volume and grade to bill for each timber mark in the population. The target sampling error for a weight scale population is 1%.

February 14, 2012 5
The scaling regulations allow for 3% measurement variation between the original and check scale net volume and value for each sample load. If all of the timber is scaled then the procedure is known as piece scaling. Species distribution and log grade can vary by scaling site and over time due to the stratum, weight to volume ratio, number of sample loads and other factors. WASTE The Provincial Logging Residue and Waste Measurement Procedures Manual uses sampling and reporting methods to measure the logging waste. Statistics are calculated to provide an estimate of the range in the total net merchantable volume that can be expected from the sample plots. The waste survey procedures allow a 24-40% sampling error for dispersed and 52-55% sampling error for accumulations (Table 4-2 to 4-5). The waste assessment standards allow for a 10 percent measurement error in the net volume estimate. Waste is measured using timber merchantability specifications in the Waste Manual, which are different for the interior and the coast. On the coast, a plot sampling process is commonly used with the precision that is specified in the Waste Manual. In the interior, an ocular estimate method augmented with transect is used. The waste survey procedures separate waste into avoidable and unavoidable waste. Both types of waste are charged to cut control, but the unavoidable waste is not billed. Waste benchmarks are used to exclude a portion of the avoidable residue and waste volumes from billing. These benchmarks vary between 10 m3/ha to 35 m3/ha on the Coast and 4 m3/ha to 20 m3/ha in the interior. The waste survey fibre measurements do not necessarily coincide with the cruise or scale measurements.
*Scale-based = the billing is based on the scale and waste volume by species & grade. Lump sum or cruise-based = billing is based on the cruise volumes by species and grade.

February 14, 2012 6
SUMMARY The Ministry uses commonly applied statistically based sampling methods to provide estimates of timber volume and quality information to support stumpage appraisals, billing and general client information. The timber cruise provides an estimate of trees with an estimated net firm wood volume that is at least 50% sound. This volume is further reduced to account for merchantability and estimates of decay, waste and breakage. On the coast, the cruise provides an estimate of log grade, while the interior does not provide an estimate of log grade. The information from the cruise is an estimate and can be impacted by the many factors noted above. The estimated volumes of timber are derived from field measurements and computer compilation systems; there are no representations or warranties concerning the profitability of timber harvesting operations to be carried out under the Licence.
The scale plus waste volume may be higher or lower than the volume reported for the timber cruise.
Some of the Reasons for Variances in Timber Volume Estimates
1. Tree volume form equations. 2. Decay, waste and breakage loss factors and log grade or lumber algorithms. 3. Sampling intensity and sampling error. 4. Differences between cruise and harvest utilization. 5. Scaling populations, strata and volume to weight ratios. 6. Waste measurements or estimates and sampling error.

February 14, 2012 7
APPENDIX I - INTERIOR
This purpose of this document is to describe the key attributes that are found in some of the cruise compilation reports and to enhance the reader’s understanding of the reported attributes. Approved compilation programs generate the same information; however, where and how the information is presented may differ. The following descriptions illustrate the reports generated by the CruiseComp program.
1.0 Appraisal Summary Report (ASR) The appraisal summary report provides most of the cruise attributes that are used to derive the indicated stumpage rate. Some of the attributes are described in this section of the report. An example of the report is shown in figure #1.
1
Report Header Information ‐ The administrative, ownership and utilization specifications for the cutting authority are described in the text box in the example report.
2 Net Area: (All Treatment Units: XXX.X) – This is the total area in hectares for the cutting authority from which timber may be harvested and the area that has been sampled.
3 Net Volume (m3) – This is the total net merchantable volume in cubic meters for each species that was sampled in the cruise plots. The term ‘merchantable’ describes the volume between a 30cm stump and a 10 or 15cm top that is reduced to account for decay, waste and breakage. The volumes by species are listed for the live trees, the dead potential trees that are at least 50% firm‐wood and the live and dead potential trees combined.
4 Net Volume/ha (m3) – This is the total net merchantable volume expressed on a per hectare basis.
5 LRF – This is the average cruise lumber recovery factor for each species of timber expressed in board feet per m3. In calculating the stumpage rate, the cruise LRF is increased by an LRF add‐on recognizes the changes in milling efficiencies over time and in different areas of the province.
6 Average slope (%) – This is the average slope in percent for each harvest method and for the total cutting authority area. The slope is an average of the maximum slope readings taken at 15m slope distance in each cruise plot.
7 Net Volume/Tree – This is the net merchantable volume per tree for all trees. The net volume/tree is useful to estimate the felling and log handling costs.
8 All Fire % ‐ This is the percentage of the net merchantable volume that has recent scorching and charring on the bole of the tree and includes all fire damage coded trees. Most of the light and moderate fire damage is superficial scorching of the bark and stem, while heavy damage reduces the lumber recovery.
9 Heavy Fire % ‐ This is the percentage of the net merchantable volume that has recent charring on the bole of the tree. This category describes the proportion of the volume that can be expected to contain significant losses to timber volume and quality.

February 14, 2012 8
10 Down Tree % ‐ This is the percentage of the net merchantable volume that is in trees that are on the ground or standing with breakage in the merchantable portion of the tree.
11 Dead Useless % ‐ This is the percentage of the net merchantable volume that is in dead standing trees (snags) that are at least 3m tall and dead useless (less than 50% firm wood).
12 Insect Damage Net Volume (m3) ‐ This is the net merchantable volume in the total cutting authority that is in trees that are:
• Lodgepole pine trees and recently killed by the Mountain Pine Beetle (at least 5% green needles) = Green Attack. • Lodgepole pine trees killed in the previous couple of years by the Mountain Pine Beetle (< 5% green & at least 5% red needles) =
Red Attack. • Lodgepole pine trees killed several years previously by the Mountain Pine Beetle (less than 5% red needles) = Gray Attack. • All other conifers attacked by insects.
13 Lodgepole pine Red/Grey Attack ‐ % of Conifer by Block (m3) ‐ This is the percentage of the coniferous species net merchantable volume in each block that has red or gray attack in lodgepole pine.
14 Cutting Authority – 95% Confidence Interval ‐ This is the sampling error in percent that can be expected 19 times out of 20 (95%) for the ‘All species net merchantable volume per hectare’ weighted by timber type volume for all of the cruise plots in the cutting authority. For example:
• The all species volume per hectare for the cruise in Figure #1 is = 236.068 m3/ha. • The sampling error is 14.9%. • The upper limit of the volume per hectare that can be expected 19 times out of 20 is = 236.068 + (236.068 * 14.9%) = 271
m3/ha. • The lower limit of the volume per hectare that can be expected 19 times out of 20 is = 236.068 ‐ (236.068 * 14.9%) = 201 m3/ha. • The administrative, ownership and some cruise control information for the cutting authority are described in the text box in
figure #1.

February 14, 2012 9
APPRAISAL SUMMARY REPORT – FIGURE #1
1
2
3
4 5
6 78 9
1011
1312
14

February 14, 2012 10
2.0 Cutting Permit Summary Report (all cut-blocks in the cutting authority) The main attributes found in the Cutting Permit Summary Report are described in this section of the report. An example of the report is shown in figure #2.
The Cutting Permit Summary Report contains some detail that is not found in the Appraisal Summary Report, including species sampling errors, plot frequencies and average tree count information. It is important to emphasize that there can be high sampling error variations for each individual species in a cruise compilation and particularly for minor species components. The following example uses the Cutting Permit Summary report in figure #2:
1
Species – 95% Confidence Interval ‐ This is the sampling error in percent that can be expected 19 times out of 20 (95%) for each species net merchantable volume per hectare weighted by timber type volume for the cruise plots in the cutting authority. For example:
• The fir net volume per hectare for the cruise in Figure #2 is = 11 m3/ha. • The sampling error (two standard error) is 49.7%. • The upper limit of the volume per hectare that can be expected 19 times out of 20 is = 11 + (11 * 49.7%) = 16.5 m3/ha. • The lower limit of the volume per hectare that can be expected 19 times out of 20 is = 11 ‐ (11 * 49.7%) = 5.5 m3/ha.
2 Stems/Ha (Live & DP) – This is the number of trees per hectare for each species and all species combined in the cutting authority. The number of stems in the cutting authority can be calculated to provide an estimate of the log handling costs. A detailed description of the stems/ha is provided in the Stand Table Report in section 3.0.
3 Interior ‐ Average 5m Log Net (m3) – This is the average net merchantable volume for 5 meter log lengths that can be expected for each species and all species combined in the cutting authority.
4 Interior – Average# 5m Log/Tree – This is the average number of 5 meter log lengths that can be expected for each species and all species combined in the cutting authority.
5 Interior ‐ LRF and Log Summary (%) – This is an estimate of some common end products for each species and all species combined in the cutting authority. For example:
• Net Merch – Stud %: This attribute estimates the percentage of 5m logs that will make studs (8 foot 2” by 4”s) and includes logs with top diameters less than 20cm.
• Net Merch – Small Log %: This attribute estimates the percentage of 5m logs and includes logs with top diameters less than 30cm.
• Net Merch – Large Log %: This attribute estimates the percentage of 5m logs and includes logs with top diameters 30cm and larger.
• LRF (fbm/m3): This is the cruise lumber recovery factor for each species of timber. The LRF describes the number of board feet that can be produced for each cubic metre of timber (fbm/m3). The appraisal program assigns an LRF add‐on to the cruise LRF to recognize the milling efficiencies over time.

February 14, 2012 11
CUTTING PERMIT SUMMARY REPORT – FIGURE #2
1
2
3
45

February 14, 2012 12
3.0 Stand Table Report Some of the main attributes found in the Stand Table Report are described in this section of the report. An example of the report is shown in figure #3.
The Stand Table reports the average number of trees per hectare for each species in 5cm diameter at breast height (DBH) classes and the tables are segregated by treatment unit for each timber type, cut block and for the whole cutting authority. The tables are often used to model partial harvest prescriptions and report the number of trees per hectare that will be harvested. The number of stems/ha that will remain standing after harvest are reported in the Leave Tree Report. Partial harvest prescription and percent reduction input scenarios are available at the following web site:
http://www.for.gov.bc.ca/hva/manuals/percentreductionscenarios.htm
1
Species Codes ‐ each species, total (all species combined), DU (dead useless snags), DP (dead potential) and LU (live useless) number of trees/ha are reported separately.
2 DBH Classes ‐ the mid‐point of the 5cm diameter classes of the average number of trees/ha of trees in the cruise plots. For example, the 50 cm DBH class includes trees that have a DBH that are from 47.5 to 52.4 cm.
3 Stems/ha – refer to figure #3 for an example of the stems/ha. The 35cm class shows Douglas fir has 3.7 stems per hectare in the cutting authority. The cutting authority is 52.4 hectares, so we could expect 194 fir trees in the 35cm class in the cutting authority.
4 Average DBH at 5 Levels ‐ the average DBH is reported for trees that are above 5 different DBH limits.

February 14, 2012 13
STAND TABLE REPORT – FIGURE #3
2
3
4
1

February 14, 2012 14
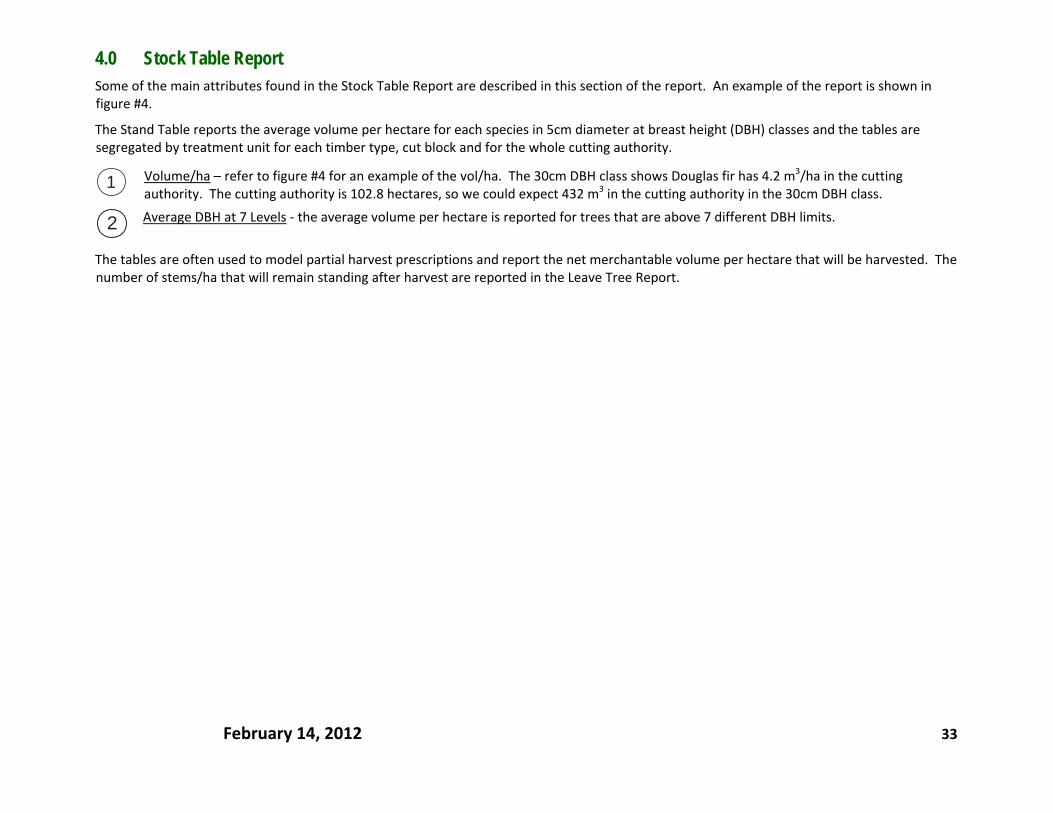
4.0 Stock Table Report Some of the main attributes found in the Stock Table Report are described in this section of the report. An example of the report is shown in figure #4.
1
The Stand Table reports the average volume per hectare for each species in 5cm diameter at breast height (DBH) classes and the tables are segregated by treatment unit for each timber type, cut block and for the whole cutting authority. The tables are often used to model partial harvest prescriptions and report the net merchantable volume per hectare that will be harvested. The number of stems/ha that will remain standing after harvest are reported in the Leave Tree Report.

February 14, 2012 15
STOCK TABLE REPORT – FIGURE #4
1
February 14, 2012 16
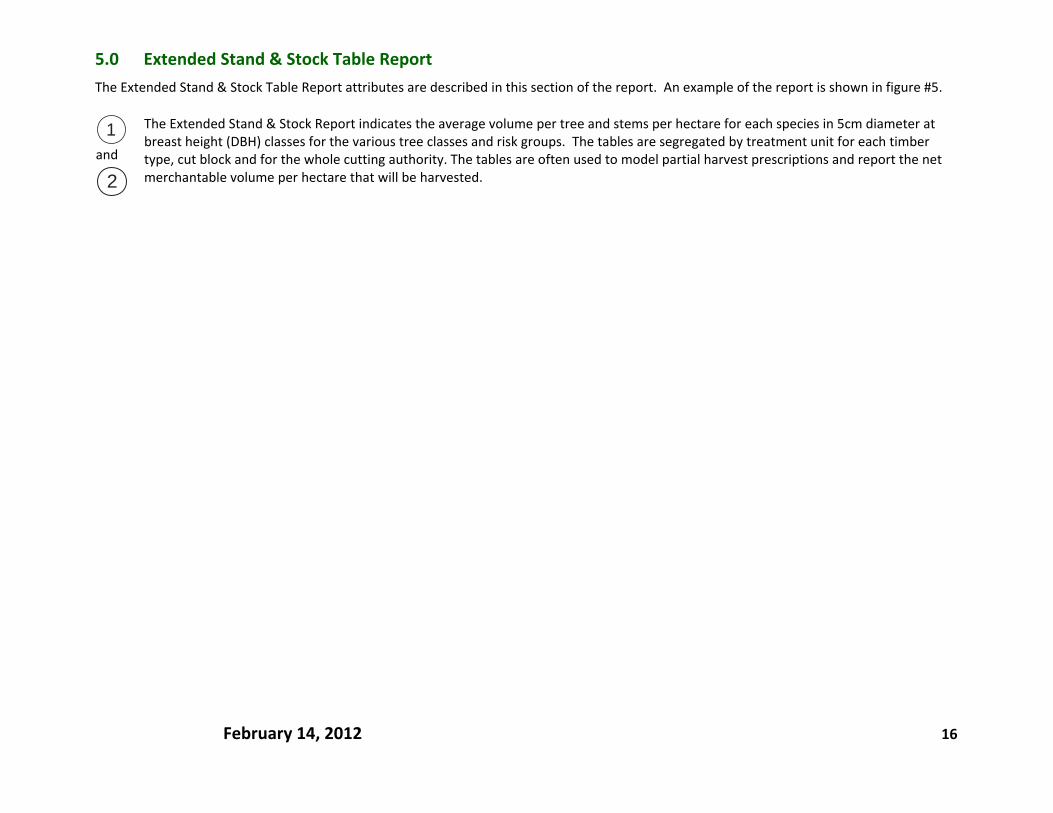
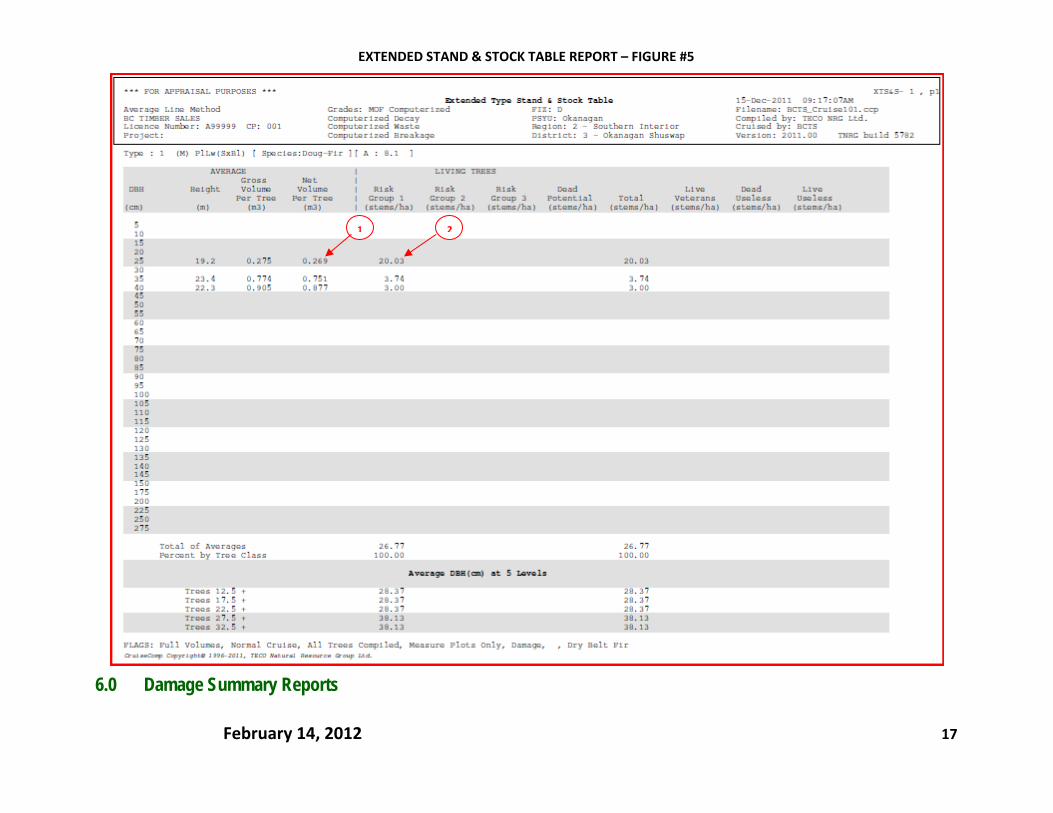
5.0 Extended Stand & Stock Table Report
The Extended Stand & Stock Table Report attributes are described in this section of the report. An example of the report is shown in figure #5.
1
and
2
The Extended Stand & Stock Report indicates the average volume per tree and stems per hectare for each species in 5cm diameter at breast height (DBH) classes for the various tree classes and risk groups. The tables are segregated by treatment unit for each timber type, cut block and for the whole cutting authority. The tables are often used to model partial harvest prescriptions and report the net merchantable volume per hectare that will be harvested.
February 14, 2012 17
EXTENDED STAND & STOCK TABLE REPORT – FIGURE #5
6.0 Damage Summary Reports
1 2

February 14, 2012 18
1
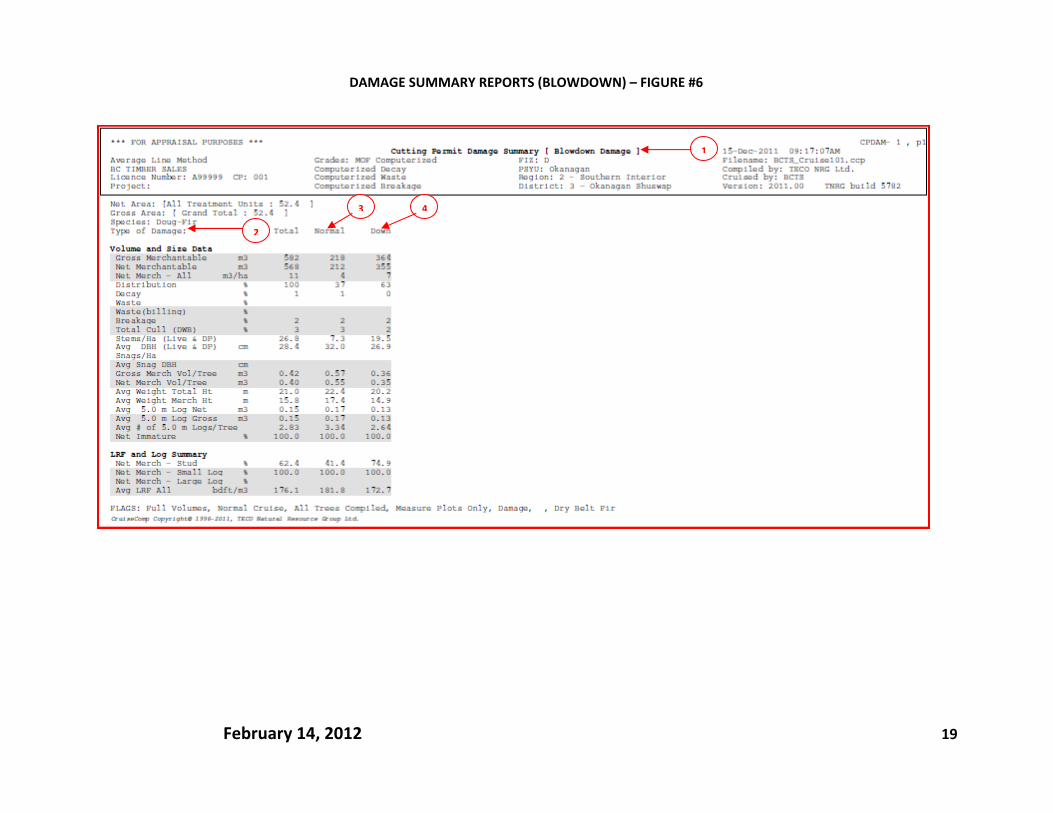
The Damage Summary Report attributes are described in this report. An example of the blow‐down damage report is shown in figure #6.
2 The damage types are listed in Table #1. The reports are summarized for each species and damage type for the cutting permit, block and timber type. The damage codes are reported in each of the damage categories as follows:
TABLE #1
DAMAGE REPORTS
Damage Type Category
Blowdown
Total
3Normal
4Down
Shatter
N/A
Fire Total Normal Light Moderate Heavy
Insect (Pine/Bal) Total Normal Green Red Grey
Insect (Fir/Sp) Total Normal Green Live Green Dead Grey Dead
Blister Rust (Pw) Total Normal Blister N/A N/A
Root Rot Total Normal Light Moderate Heavy
Defoliator Total Normal Dry Green N/A
The root rot switch must be turned on in the ‘Compilation Standard Screen’ in Cruise Comp to generate the root rot summary reports by block and timber type.
Clients should be aware that the cutting authority may have been cruised several years prior to the date when the timber sale was advertised unless the timber sale is in mountain pine beetle stands and could have updated insect damage information. The client should field review the timber sale to estimate any additional deterioration that may have occurred after the timber cruise.
February 14, 2012 19
DAMAGE SUMMARY REPORTS (BLOWDOWN) – FIGURE #6
1
2
3 4

February 14, 2012 20
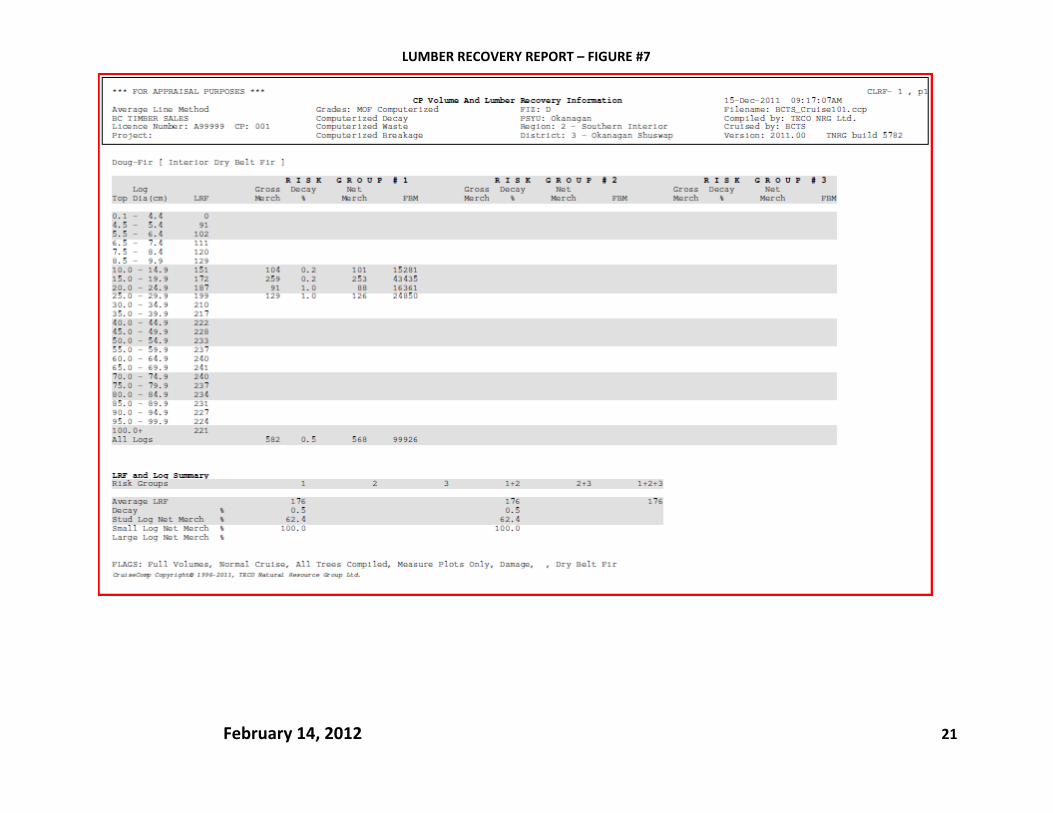
7.0 Lumber Recovery Reports The cruise Lumber Recovery Report attributes are described in this report. An example of the report is shown in figure #7.
The reports are summarized for each species by risk group for the cutting permit, block and timber type. The cruise lumber recovery factors are expressed in board feet/m3 and the cruise species LRFs receive an appraisal LRF add‐on depending on the timber pricing zone where the cutting authority is located.
The appraisal add‐ons are used to update the cruise LRFs to recognize the current milling efficiencies. Any modelling of lumber production should include the appraisal LRF add‐ons for each species by timber pricing zone.
February 14, 2012 21
LUMBER RECOVERY REPORT – FIGURE #7

February 14, 2012 22
8.0 Practical Uses for the Reports The examples in this report demonstrate some practical uses for some of the attributes in the cruise compilation reports.
Example #1
A licensee wants to estimate the volumes that may be produced for several sorts. The preferred specifications for the sorts are as follows:
a. Small Sawlogs – Coniferous logs with top diameters less than 30cm. Refer to the Cutting Permit Summary (figure 2):
• 93.4% * 12370 m3 = 11554m3
b. Large Sawlogs – Coniferous logs with top diameters at least 30cm and do not qualify as fir peeler. Refer to the Cutting Permit Summary:
• 6.6% * 12370 m3 – (c) = 816 – 285 = 531 m3.
c. Fir Poles – Douglas fir volume from live trees that are risk group #1 (no pathological indicators) and have a diameter at breast height (DBH) of at least 30cm.
• Refer to the Extended Stand & Stock Table Report: 4 timber types:
Type 1 = (0.751m3/tree * 3.74 stems/ha) + (0.877m3/tree * 3.00 stems/ha) * 8.1 ha = 44.0 m3
Type 2 = (0.751m3/tree * 3.74 stems/ha) + (0.877m3/tree * 3.00 stems/ha) * 20.7 ha = 112.6 m3
Type 3 = (0.751m3/tree * 3.74 stems/ha) + (0.877m3/tree * 3.00 stems/ha) * 3.7 ha = 20.1 m3
Type 4 = (0.751m3/tree * 3.74 stems/ha) + (0.877m3/tree * 3.00 stems/ha) * 19.9 ha = 108.2 m3
Total = 285 m3

February 14, 2012 23
Example #2
A licensee wants to estimate the number of highway truck loads of logs that they can expect to load out from the timber sale and how many logs that they will average per load. Assume that the trucks average 40m3 per load and 15m long logs.
a. Number of truckloads – Refer to the ‘Total Net Volume’ on the Cutting Permit (figure 2) or Appraisal Summary Reports (figure 1):
• 12370 m3 / 40 m3 per load = 309 loads.
b. Number of logs per load – Refer to the ‘Average Weighted Merch Height’ and the ‘Net Merch Vol/Tree’ on the Cutting Permit Summary Report:
• 40 m3 per load/ 0.35m3 per tree = 114 trees per load. • 114 trees per load * 16.8m merch height/15m logs = 128 logs per load.
Example #3
A licensee has finished logging their timber sale and they question why the 100% stick scale plus waste assessment for the Douglas fir component is nearly 1.5 times the fir cruise volume.
Refer to the two standard error(%) for the Douglas fir component in the Cutting Permit Summary:
• 49.7% * 11m3 /ha * 52.4 ha = 286m3. • 568 m3 + 286m3 = 854 m3 is 1.5 times the cruise volume estimate.
It is important to note that the minor species net volumes can have high standard errors because the cruise design standards apply to the all species total net merchantable volume before any percent reductions are applied to the cruise compilation. If fixed grid intervals and minimum tree counts are used for the cruise design in lieu of the minimum sampling error standards, then the standard errors may be even higher for each species and the whole cutting authority.
February 14, 2012 24
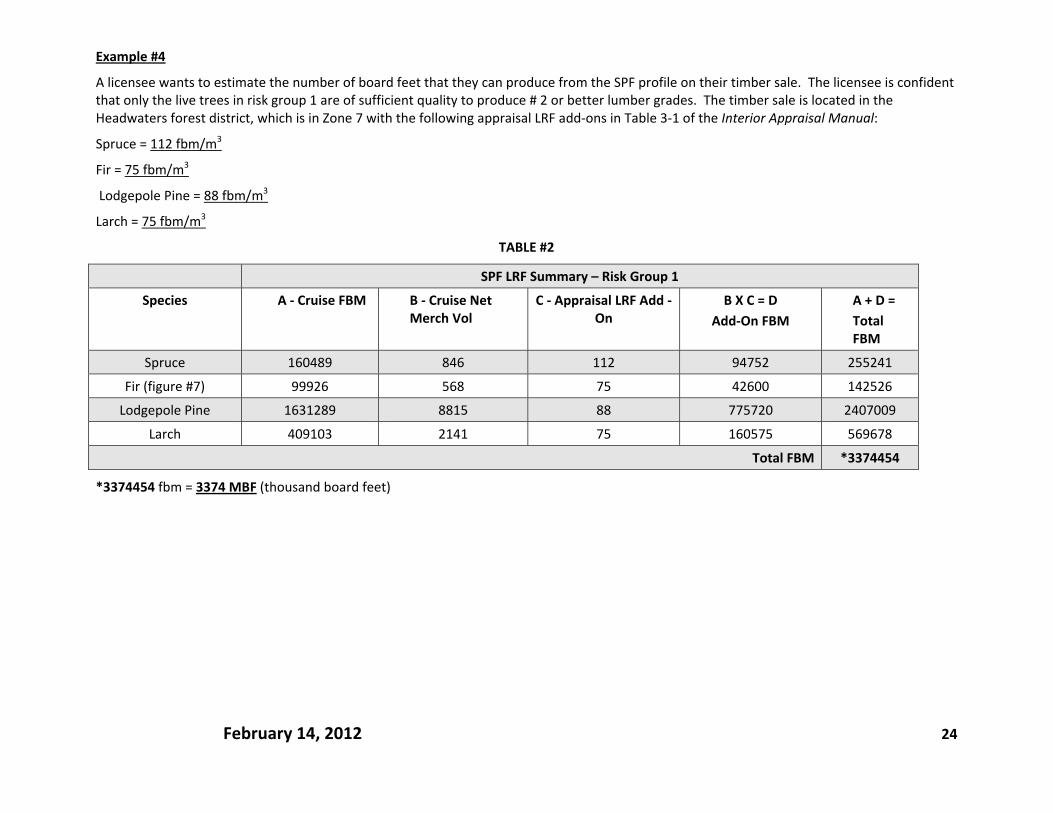
Example #4
A licensee wants to estimate the number of board feet that they can produce from the SPF profile on their timber sale. The licensee is confident that only the live trees in risk group 1 are of sufficient quality to produce # 2 or better lumber grades. The timber sale is located in the Headwaters forest district, which is in Zone 7 with the following appraisal LRF add‐ons in Table 3‐1 of the Interior Appraisal Manual:
Spruce = 112 fbm/m3
Fir = 75 fbm/m3
Lodgepole Pine = 88 fbm/m3
Larch = 75 fbm/m3
TABLE #2
SPF LRF Summary – Risk Group 1
Species A ‐ Cruise FBM B ‐ Cruise Net Merch Vol
C ‐ Appraisal LRF Add ‐On
B X C = D Add‐On FBM
A + D = Total FBM
Spruce 160489 846 112 94752 255241
Fir (figure #7) 99926 568 75 42600 142526
Lodgepole Pine 1631289 8815 88 775720 2407009
Larch 409103 2141 75 160575 569678
Total FBM *3374454
*3374454 fbm = 3374 MBF (thousand board feet)

February 14, 2012 25
Example #5
A licensee wants to estimate the pulp volumes from their timber sale. The preferred specifications for the sorts are as follows:
a. Pulp Logs – Grey attack and red attack MPB Pl trees. Refer to the Interior Appraisal Summary Report (figure 1) and read the grey and red attack volumes from the report:
• 0 m3 (red) + 280 m3 (grey) = 280m3
b. Dead Potential Coniferous Logs (minus Pl DP = grey trees). Refer to the Interior Appraisal Summary Report and read the dead potential volume from the report:
• 1119m3 ‐ 280 m3 (deduct grey Pl only because red attack is from the live tree classes) = 839 m3
c. Total Pl Pulp as percentage of the coniferous volume:
• 1119 m3/12370 m3 = 9% of the coniferous volume on the timber sale.

February 14, 2012 26
APPENDIX II - COAST This purpose of this document is to describe the key attributes that are found in some of the cruise compilation reports and to enhance the reader’s understanding of the reported attributes.
1.0 Appraisal Summary Report (ASR)
The appraisal summary report provides most of the cruise attributes that are used to derive the indicated stumpage rate. Some of the attributes are described in this section of the report. An example of the report is shown in figure #1.
1
The report header reads; ‘***For Appraisal Purposes***’. This indicates that the cruise compilation is suitable for use in a stumpage appraisal. If the cruise is compiled using Call Grading & Net Factoring (CGNF) data then the header will read; ‘***For MPS Purposes***’.
The header also reads; ‘Grades: MOF Computerized’. This indicates that the cruise is compiled using the loss factor deductions for decay, waste and breakage and the log grade algorithms to determine the statutory log grade percentages. If the cruise is compiled using CGNF data then the header will read; ‘***Cruise Called Alpha***’ and ‘Estimated decay’, ‘Estimated waste’ and ‘CGNF Breakage Table’.
Report Header Information: The administrative, ownership and utilization specifications for the cutting authority are described in the text box in the example report.
2 Net Area: (All Treatment Units: XXX.X): This is the total area in hectares for the cutting authority from which timber may be harvested and sampled.
3 Net Volume (m3): This is the total net merchantable volume expressed on per hectare basis.
4 Net Volume/ha (m3): This is the average net merchantable volume in cubic metres per hectare for each species that was sampled in the cruise. The volumes by species are listed for live trees, the dead potential trees and then all trees combined.
5 Grades: The statutory log grades are reported for each species of timber. The cruise grades are used in the calculation of the stumpage rate for BCTS timber sales. Some major licensee cutting authorities use historic scale grades for their appraisals.
6 Average slope (%): This is the average slope in percent for each harvest method and for the total cutting authority area. The slope is an average of the maximum slope readings taken at 15m slope distance in each cruise plot.
7 Heavy Fire %: This is the percentage of the net merchantable volume that has recent charring on the bole of the tree. This category describes the proportion of the volume that can be expected to contain significant losses to timber volume and quality.
8 Down Tree %: This is the percentage of the net merchantable volume that is in trees that are on the ground or standing with breakage in the merchantable portion of the tree.

February 14, 2012 27
9 Cutting Authority
10 95% Confidence Interval: This is the sampling error in percent that can be expected 19 times out of 20 (95%) for the all species net merchantable volume per hectare weighted by timber type volume for all of the cruise plots in the cutting authority. For example:
• The all species volume per hectare for the cruise in Figure #1 is = 816.929 m3/ha. • The sampling error is 10.2 %. • The upper limit of the volume per hectare that can be expected 19 times out of 20 is = 816.929 + (816.929 * 10.2 %) = 900m3/ha.• The lower limit of the volume per hectare that can be expected 19 times out of 20 is = 816.929 ‐ (816.929 * 10.2 %) = 734m3/ha. • The administrative, ownership and some cruise control information for the cutting authority are described in the text box in
figure #1.
11 Net 2nd Growth ‐ Conifer ‐ %: This is the percentage of the second growth net merchantable volume that is compiled for the cutting authority and includes all of the trees that are less than 141 years old. If the % 2nd growth is at least 80%, then the second growth average log prices are used in the calculation of the indicated stumpage rate.
12 Net Immature by Block ‐ %: This is the percentage of the immature net merchantable volume that is compiled for each block in the cutting authority and includes all of the trees that are less than 121 years old. The block maturity is used to set the minimum timber merchantability specifications that will be used for the cruise compilation and for waste assessments. The threshold for determining block maturity is 50%.
Block Utilization Limits Maturity Immature Mature
Minimum DBH 12.0 17.5 Top DIB 10.0 15.0
13 Non‐heli select conifer (m3/ha): This is the average net merchantable volume per hectare of all coniferous trees in the cutting authority that will not be harvested using a helicopter selection harvesting method. This value is used in the calculation of the indicated stumpage rate.
14 Piece Size ‐ Conifer (m3/10m Log): This is the average net merchantable volume per 10 metre log for all coniferous trees in the cutting authority. This attribute can be useful to estimate yarding, loading and other log handling costs.
515 # Plots: This is the number of plots that were cruised less than or equal to 5 years, greater than 5 years and greater than 10 years prior to the cruise compilation date. This information is useful to determine if the field data has exceeded the shelf life standards (5 years for immature and 10 years for mature cruise data).

February 14, 2012 28
APPRAISAL SUMMARY REPORT – FIGURE #1
1
23 45
6 78
9
10
11
12
13
1514

February 14, 2012 29
2.0 Cutting Permit Summary Report
1
The main attributes found in the Cutting Permit Summary Report are described in this section of the report. An example of the report is shown in figure #2. The Cutting Permit Summary Report contains some detail that is not found in the Appraisal Summary Report, including species sampling errors, plot frequencies and average tree count information. It is important to emphasize that there can be high sampling error variations for each species in a cruise compilation and particularly for minor species components. The following example uses the Cutting Permit Summary report in figure #2.
2 Species – 95% Confidence Interval ‐ This is the sampling error in percent that can be expected 19 times out of 20 (95%) for each species net merchantable volume per hectare weighted by timber type volume for the cruise plots in the cutting authority. For example:
• The fir net volume per hectare for the cruise in Figure #2 is = 140 m3/ha. • The sampling error is 32.2%. • The upper limit of the volume per hectare that can be expected 19 times out of 20 is = 140 + (140 * 32.2%) = 185 m3/ha. • The lower limit of the volume per hectare that can be expected 19 times out of 20 is = 140 ‐ (140 * 32.2%) = 95 m3/ha.
3 Stems/Ha (Live & DP) – This is the number of trees per hectare for each species and all species combined in the cutting authority. The number of stems in the cutting authority can be calculated to provide an estimate of the log handling costs. A detailed description of the stems/ha is provided in the Stand Table Report in section 3.0.
4 Average 10m Log Net (m3) – This is the average net merchantable volume for 10 meter log lengths that can be expected for each species and all species combined in the cutting authority.
5 Average# 10m Log/Tree – This is the average number of 10 meter log lengths that can be expected for each species and all species combined in the cutting authority.
6 Algorithm Grade (%) – This is an estimate of the statutory log grade percentages for the cruised trees for each species and all species combined in the cutting authority. For example, the predicted net merchantable volumes for the Douglas fir grades in figure #2 are:
3% B‐grade * 14374m3 = 431.2m3 / 7% C‐grade * 14374m3 = 1006.2m3 / 14% D‐grade * 14374m3 = 2012.4m3 / 8% F‐grade * 14374m3 = 1114.9m3 / 13% H‐grade * 14374m3 = 1868.6m3 / 24% I‐grade * 14374m3 = 3449.8m3 / 14% J‐grade * 14374m3 = 2012.4m3 / 10% U‐grade * 14374m3 = 1437.4m3 / 4% X‐grade * 14374m3 = 575.0m3 / 3% Y‐grade * 14374m3 = 431.2m3

February 14, 2012 30
CUTTING PERMIT SUMMARY REPORT – FIGURE #2
1
2
3
4
5
6

February 14, 2012 31
3.0 Stand Table Report
1
Some of the main attributes found in the Stand Table Report are described in this section of the report. An example of the report is shown in figure #3. The Stand Table reports the average number of trees per hectare for each species in 5cm diameter at breast height (DBH) classes and the tables are segregated by treatment unit for each timber type, cut block and for the whole cutting authority. The tables are often used to model partial harvest prescriptions and report the number of trees per hectare that will be harvested. The number of stems/ha that will remain standing after harvest are reported in the Leave Tree Report. Partial harvest prescription and percent reduction input scenarios are available at the following web site:
http://www.for.gov.bc.ca/hva/manuals/percentreductionscenarios.htm Species Codes ‐ each species, total (all species combined), DU (dead useless snags), DP (dead potential) and LU (live useless) number of trees/ha are reported separately. DBH Classes ‐ the mid‐point of the 5cm diameter classes of the average number of trees/ha of trees in the cruise plots. For example, the 50 cm DBH class includes trees that have a DBH that are from 47.5 to 52.4 cm.
2 Stems/ha – refer to figure #3 for an example of the trees/ha. The 35cm class shows Douglas fir has 20.0 stems per hectare in the cutting authority. If the cutting authority is only 1.0 hectare, we could expect 20 fir trees in the cutting authority. The total number of live and dead potential Douglas fir trees/ha is 73.6 trees/ha.
3 Average DBH at 5 Levels ‐ the average DBH is reported for trees that are above 5 different DBH limits.
The number of stems/ha that are projected to remain standing after harvest are reported in the Leave Tree Report.

February 14, 2012 32
STAND TABLE REPORT – FIGURE #3
2
3
1
February 14, 2012 33
4.0 Stock Table Report Some of the main attributes found in the Stock Table Report are described in this section of the report. An example of the report is shown in figure #4.
The Stand Table reports the average volume per hectare for each species in 5cm diameter at breast height (DBH) classes and the tables are segregated by treatment unit for each timber type, cut block and for the whole cutting authority.
1
Volume/ha – refer to figure #4 for an example of the vol/ha. The 30cm DBH class shows Douglas fir has 4.2 m3/ha in the cutting authority. The cutting authority is 102.8 hectares, so we could expect 432 m3 in the cutting authority in the 30cm DBH class.
2 Average DBH at 7 Levels ‐ the average volume per hectare is reported for trees that are above 7 different DBH limits.
The tables are often used to model partial harvest prescriptions and report the net merchantable volume per hectare that will be harvested. The number of stems/ha that will remain standing after harvest are reported in the Leave Tree Report.

February 14, 2012 34
STOCK TABLE REPORT – FIGURE #4
2
1
February 14, 2012 35
5.0 Extended Stand & Stock Table Report
1
The Extended Stand & Stock Table Report attributes are described in this section of the report. An example of the report is shown in figure #5.
2
and
3
The Extended Stand & Stock Report indicates the average volume per tree and stems per hectare for each species in 5cm diameter at breast height (DBH) classes for the various tree classes and risk groups. The tables are segregated by treatment unit for each timber type, cut block and for the whole cutting authority. The tables are often used to model partial harvest prescriptions and report the net merchantable volume per hectare that will be harvested.

February 14, 2012 36
EXTENDED STAND & STOCK TABLE REPORT – FIGURE #5
1
2 3

February 14, 2012 37
6.0 Damage Summary Reports
1
The Damage Summary Report attributes are described in this report. An example of the blow‐down damage report is shown in figure #6.
2 The damage types are listed in Table #1. The reports are summarized for each species and damage type for the cutting permit, block and timber type. The damage codes are reported in each of the damage categories as follows:
TABLE #1
DAMAGE REPORTS Damage Type Category
Blowdown
Total
3Normal
4Down
5Shatter
N/A
Fire Total Normal Light Moderate Heavy Insect (Pine/Bal) Total Normal Green Red Grey Insect (Fir/Sp) Total Normal Green Live Green Dead Grey Dead Blister Rust (Pw) Total Normal Blister N/A N/A
Root Rot Total Normal Light Moderate Heavy Defoliator Total Normal Dry Green N/A
The root rot switch must be turned on in the Compilation Standard Screen in CruiseComp to generate the root rot summary reports by block and timber type.

February 14, 2012 38
DAMAGE SUMMARY REPORTS (BLOWDOWN) – FIGURE #6
2
3
4
5
1

February 14, 2012 39
8.0 Practical Uses for the Reports The examples in this report demonstrate some practical uses for some of the attributes in the cruise compilation reports.
Example #1
A licensee wants to estimate the volumes that may be produced for several sorts. The preferred specifications for the sorts are as follows:
a. Small Fir Sawlogs – Live Douglas fir logs with diameters less than the 32.5 cm DBH class. Refer to the CP Stock Table (figure #4):
• 4.2 m3/ha * 102.8 ha = 432 m3
b. Large Sawlogs – Live Coniferous logs with DBH that are in the 32.5 cm DBH class or larger. Refer to each coniferous species in the 32.5 class at the bottom of the CP Stock table (excluding alder (D)):
• (129.7 m3/ha + 219.4 + 300.8 + 70.7 + 16.0) * 102.8 ha = 736.6m3
c. Fir Peelers – Douglas fir volume.
• Refer to the Appraisal Summary Report (Figure #1), Grade Code C: 14374 m3 * 7% = 1006 m3

February 14, 2012 40
d. Cedar Poles – The licensee wants to determine the potential cedar volume that might produce poles. The rough criteria are live trees that are risk group #1 (no pathological indicators) and have a DBH of 45cm to 55cm.
Refer to cedar in all 11 timber types in the Extended Stand & Stock Table Reports (not shown):
Timber Type #2 (45cm class) – 1.162m3/tree * 6.79 stems/ha * 14.8ha = 117m3
Timber Type #3 (55cm class) – 1.948m3/tree * 6.03 stems/ha * 11.0ha = 129m3
Timber Type #10 (50cm class) – 2.022m3/tree * 10.64 stems/ha * 5.7ha = 123m3
Timber Type #10 (55cm class) – 2.968m3/tree * 9.28 stems/ha * 5.7ha = 157m3
Total = 526m3
Example #2
A licensee wants to estimate the number of highway truck loads of logs that they can expect to load out from the timber sale and how many logs that they will average per load. Assume that the trucks average 40m3 per load and 15m long logs.
c. Number of truckloads – Refer to the ‘Total Net Volume’ on the Appraisal Summary Report:
• 83980 m3 / 40 m3 per load = 2100 loads.
d. Number of logs per load – Refer to the ‘Net Merch Vol/Tree’ and the ‘Average Weighted Merch Height’ on the Cutting Permit Summary Report:
• 40 m3 per load/ 2.30 m3 per tree = 17.4 trees per load. • 17.4 trees per load * 37.3m merch height per tree/15m logs = 43 logs per load.

February 14, 2012 41
Example #3
A licensee has finished logging their timber sale and they question why the 100% stick scale plus waste assessment for the yellow cedar component is less than ½ the yellow cedar cruise volume. The licensee did not utilize the dead potential yellow cedar component because it was Y‐grade due to weather checking and dry Y‐grade logs are not measured in the waste survey estimate.
Refer to two standard error (%) and the net volumes for the yellow cedar component in the Appraisal Summary:
• 46.8% * 1922 m3 cruise volume = 899 m3. • 1922 m3 – 899 m3 = 1023 m3 , which approximates the cruise volume.

February 14, 2012 42
APPENDIX III Cruise Compilation Report Nomenclature
CruiseComp Report Name Claymore Report Name IFS Report Name Appraisal Summary Report Appraisal Summary Appraisal Summary Report Cutting Permit Summary Summary of Cruise Data Stand Summary Report Timber Type Summary Summary of Cruise Data by Type Stand Summary Report
Block Summary Summary of Cruise Data by Block Stand Summary Report All Method Summary Summary of Cruise Data Stand Summary Report
Harvesting Method Summary Summary of Cruise Data by Harvest Method
Harvest Method Report
Plot Summary Per Hectare Plot Summary (detailed) Plot Volume Report Volume Statistical Analysis Cruise Summary Cruise Statistics
Basal Area Statistical Analysis Per Hectare Statistical Summary Cruise Statistics CP, Type & Block Stand Table (stems/ha) Stand and Stock Table Stand Summary Report CP, Type & Block Stock Table (m3/ha) Stand and Stock Table Stock Summary Report
CP, Type & Block Basal Area Table (m2/ha) Stand and Stock Table Basal Area Report CP, Type & Block Stand Damage Table (stems/ha) Stand and Stock Table Stand Summary Report CP, Type & Block Stock Damage Table (m3/ha) Stand and Stock Table Stock Summary Report
CP, Type & Block Basal Area Damage Table (m2/ha) Stand and Stock Table Basal Area Report Extended Type Stand & Stock Table Stand and Stock Tables Extended Stand/Extended Stock Report Leave Tree Reports –when compiled Leave Tree Reports – when compiled Leave Tree Reports – when compiled
Percent Reductions Applied Percent Reduction Applied Selection Factor Report CP, Type & Block Volume & Lumber Recovery Info. Lumber Recovery Report Lumber Recovery Report CP, Type & Block Damage Summary (damage type) Summary of Cruise Data by Damage Stand Summary Report CP, Type & Block Root Rot Summary (root rot) Summary of Cruise Data by Damage Stand Summary Report

February 14, 2012 43
GLOSSARY Coniferous – softwood tree species (except Larch) that do not lose their needles during the winter.
Cutting Authority – the whole license or cutting permit identified by a unique timber mark.
DBH – diameter at breast height is measured for measured trees in cruise plots. The diameter is an outside bark measurement 1.3m from the high side of ground.
Deciduous – hardwood tree species that lose their leaves during the winter.
Grade – letters or numbers that describe the size and quality of a log and the potential products that can be made from the log.
Harvesting Method – describes the type of equipment or animal that is used for yarding the trees to roadside after they are felled.
Hectare – a metric unit of area that is 100m by 100m or 10,000 m2.
Immature Timber – coniferous trees that are less than 121 years old and deciduous trees that are less than 41 years old.
Leave Tree Report – Reports the number of stems per hectare by species that will remain standing inside a cut‐block after the harvesting is complete.
Loss Factors – the decay, waste and breakage volume (m3) that is deducted from the gross merchantable volume of each measure tree in a compilation.
Mature Timber – coniferous trees that are at least 121 years old and deciduous trees that are at least 41 years old.
Merchantable Volume – this is the volume in a tree between the 30cm stump height and the minimum tree top diameter.
Partial Harvest Prescription – a professional assessment of the soil moisture, nutrient, plant communities and the preferred tree species that should be replanted. The prescription is a key document that supports the percent reduction (leave trees) on partial harvest cutting authorities.
Pathological Indicators – the 8 indicators of decay that cruisers record for loss factor cruises: conk, blind conk, scar, frost crack, fork/crook, mistletoe, large rotten branch and dead/broken top. The indicators are one component of the decay/waste and breakage deduction used in the cruise compilation.
Percent Reduction Input – this is the input data for the cruise compilation. The data describes the trees that are intended to be retained from harvesting.

February 14, 2012 44
Risk Groups – The cruise compilation program uses the cruise location, tree species, age, Dbh and pathological indicators to determine the loss factors that will reduce the net volume of each measure tree. The risk groups are sub‐sets of the loss factors and the pathological indicators recorded for the tree to determine the risk group that will be used to compile each tree.
Second Growth ‐ coniferous trees that are less than 141 years old.
Timber Type – A spatial grouping of trees with common species and age characteristics. Volumes and statistics are calculated for each timber type. Grouping similar timber characteristics can improve the sampling efficiency.
Timber Merchantability Requirements – the contractual cutting standards for a cutting authority. (e.g. ‐ 30cm stump height, minimum Dbh = 12.0cm for immature and 17.5cm for mature cut‐blocks).
Treatment Unit – spatial units that forest professionals use to describe common treatments on the land base. The cruise compilation reports provide a breakdown of the cruise attributes for each treatment unit for each of the reporting levels (Timber Type, Block, Harvesting Method, Cutting Permit).
Tree Classes – a tree class number is assigned to each tree in the measure cruise plots by the timber cruiser as follows:
Tree Class Description ‐ Using an age in 10s = 11 on the plot card for loss factor cruises 1 Older immature live trees without pathological indicators. 2 Older immature live trees with pathological indicators. 3 Dead potential trees that contain at least 50% sound wood. 4 Dead useless trees that contain less than 50% sound wood. 5 Mature live trees. 6 Live useless trees – live trees that are very defective (typically firmwood rejects). 7 Mature dead potential trees. 8 Younger immature live trees. 9 Younger immature dead trees.