minimum cost solar power systems for lte macro base...
TRANSCRIPT

Computer Networks 112 (2017) 12–23
Contents lists available at ScienceDirect
Computer Networks
journal homepage: www.elsevier.com/locate/comnet
Minimum cost solar power systems for LTE macro base stations
Yi Zhang
a , Michela Meo
a , ∗, Raffaella Gerboni b , Marco Ajmone Marsan
a , c
a Department of Electronics and Telecommunications, Politecnico di Torino, Italy b Department of Energy, Politecnico di Torino, Italy c IMDEA Networks Institute, Leganes (Madrid), Spain
a r t i c l e i n f o
Article history:
Received 23 September 2015
Revised 30 March 2016
Accepted 8 October 2016
Available online 26 October 2016
Keywords:
Cellular networks
Green networking
Renewable energy
Optimization
a b s t r a c t
This paper proposes an algorithm for the identification of the minimum cost solution over a 10 year time
horizon to power an LTE (Long-Term Evolution) macro base station, using a photovoltaic solar panel, a
set of batteries, and optionally also a secondary power source, which can be a connection to a (possibly
unreliable) power grid, or a small Diesel generator. The optimization is formalised as an Mixed Integer
Programming (MIP) problem, which, after linearization, can be solved with CPLEX. A heuristic algorithm
is also proposed, with the objective of decreasing the computational complexity of the optimization. Nu-
merical results show that a hybrid solar-grid (or solar-diesel) power system saves a significant fraction
of the total cost, compared to a pure solar system, and to the traditional power-grid system, over the
investigated 10-year period, in a south European city, like Torino in Italy, as well as in a location close to
the tropic, like Aswan in Egypt. Our proposed heuristic algorithm can be used to obtain a solution within
10–20% of the optimum, at a computational speed 200 times faster than the MIP solution.
© 2016 Elsevier B.V. All rights reserved.
g
r
t
t
B
o
n
o
fi
h
m
t
s
f
m
a
i
e
i
u
1. Introduction
Energy-efficient (or green) networking has been a hot re-
search topic in the last decade. Several large international research
projects have been launched in this field, like EARTH [1] , TREND
[2] , and ECONET [3] , funded by the European Commission under
its 7th Framework Programme, and GreenTouch [4] , the largest
industry-driven initiative so far. In addition, many smaller initia-
tives, and curiosity-driven research, have contributed to the gen-
eration of a wide body of results in this area. Research has con-
cerned all fields of networking, from access to core, from wired
to wireless, but has surely focused mostly on cellular radio access
networks, due to the increased relevance of wireless access, and
to the recent introduction of the LTE technology, aiming at pro-
viding high bandwidth ubiquitous Internet access to an ever grow-
ing number of smart user terminals. Research has considered many
different aspects, from more energy-efficient components and sys-
tems, to less energy-hungry application protocols, to greener net-
work management procedures, and architectural variations [5–8] .
However, in spite of all the attention given to energy consump-
tion in networks, recent data indicate that the amount of energy
used by networks keeps increasing. Probably, energy consumption
∗ Corresponding author.
E-mail addresses: [email protected] (Y. Zhang), [email protected]
(M. Meo), [email protected] (R. Gerboni).
e
(
i
c
c
http://dx.doi.org/10.1016/j.comnet.2016.10.008
1389-1286/© 2016 Elsevier B.V. All rights reserved.
oes up at a lower rate than it would have, without all the recent
esearch in the field, but up it goes. The main reasons for this con-
inuing growth in the case of cellular networks are (among others)
hat: i) the deployment of the new and more energy-parsimonious
ase Station (BS) models is slower than expected, due to lagging
perator investments because of the economic slowdown; ii) the
ew energy-aware network management procedures, mostly based
n the switch-off of parts of the equipment in periods of low traf-
c, are not being adopted by operators, who fear that coverage
oles may be generated, that QoS may be degraded, and that faults
ay occur at switch-on; and iii) more and more BSs are necessary
o satisfy the exploding volume of traffic requests.
It thus becomes interesting to tackle the issue of energy con-
umption in communication networks from a different perspective,
ocusing on the type of energy which is consumed, since, if we can
ake networks green by consuming energy produced by renew-
ble sources, the amount of consumed energy becomes less crit-
cal. Actually, the combination of renewable energy sources with
nergy-efficient equipment, protocols, and algorithms is extremely
mportant, since only through an optimised system integration the
se of renewable energy sources becomes viable.
In this paper we study the use of solar energy to power an
nergy-efficient LTE macro base station. By coupling a photovoltaic
PV) solar panel with batteries that can store the energy produced
n high solar radiation periods, to be used during nights, as well as
loudy days, solar panels can power base stations at very limited
ost, and thus provide an interesting option for both areas where

Y. Zhang et al. / Computer Networks 112 (2017) 12–23 13
t
p
m
o
m
a
w
w
c
m
e
b
d
l
6
i
t
c
m
a
I
t
a
w
a
a
e
i
d
d
t
a
i
d
w
s
a
b
l
B
t
b
(
r
t
p
t
l
p
o
p
t
a
r
2
p
T
s
t
e
s
w
t
a
e
s
a
n
c
F
v
a
d
p
o
t
B
v
e
C
t
a
b
a
c
s
t
i
f
w
t
w
t
w
i
3
a
t
3
a
p
a
i
s
P
“
A
n
t
l
d
he power grid is not present or not reliable, and areas where the
ower grid is ubiquitous, but energy costs are high, and regulations
ay make it inconvenient to connect a BS to the power grid.
Today, especially in remote locations, a number of BSs already
perate with no connection to the power grid. The most com-
on solution to power off-grid base stations consists in installing
Diesel power generator, which requires large amounts of fuel,
hich is expensive in itself, but becomes extraordinarily costly
hen transport is problematic (helicopters are necessary when lo-
ations are really remote), and when fuel thefts occur.
In the recent literature, PV panels have been proved to be much
ore cost-effective than diesel generators (in some areas, differ-
nces in cost are as high as an order of magnitude [5] ). Some Mo-
ile Network Operators (MNOs), Orange for example, have already
eployed over 20 0 0 solar-powered BSs serving more than 3 mil-
ion people in Africa, with a saving of 25 million liters of fuel and
7 million kg of CO 2 in 2011 [9] . These experiences, coupled with
ncreasing energy costs, are making solar energy an interesting op-
ion also for countries where the access to the power grid is typi-
ally ubiquitous and reliable.
We investigate the cost of different solutions to power a LTE
acro BS: i) the case of access to the power grid, ii) the case of
Diesel generator, and iii) the case of a PV panel with batteries.
n addition, we also explore hybrid solutions, which consist in: iv)
he use of a PV panel with batteries, coupled with a grid access, or
small Diesel generator.
In particular, in this paper, refining our previous works [10,11] ,
e focus on the optimization of the total cost (including CapEx
nd OpEx) of the solar energy system that is installed to power
macro LTE base station. We consider a 10-year life span of the
quipment, and over such period we account for expected changes
n conditions, including the strong growth of the end user traffic
emand, as well as the increase of the grid electricity price; in ad-
ition, we also consider the evolution of battery technology, and
he reduction of the solar panel efficiency from year to year. Two
re the reasons why we select a 10-year horizon. The first reason
s that PV panels are designed to last at least 10 years. Therefore,
uring the 10-year horizon, there is no need to change PV panels,
hich would imply a complete replacement of the PV system. The
econd reason is that, up to now, new generations of mobile radio
ccess technologies had an opportunity window of about 10 years
efore the deployment of a newer technology, as can be seen by
ooking at the cases of GSM and 3G. The currently deployed LTE
Ss will probably be replaced by 5G technology in about the same
ime frame. Finally, predicting the energy consumption of 5G BSs
eyond year 2025 is not within the scope of this paper.
We study the system through a Mixed Integer Programming
MIP) approach, aiming at cost minimization over the 10-year pe-
iod, and we design a heuristic algorithm that allows compu-
ational complexity to be drastically reduced. Numerical results
rove that minimum cost solar energy systems are a viable choice
o power a LTE macro BS, and that hybrid energy systems (so-
ar+grid or solar+diesel) can be the most effective choice.
This paper is organized as follows. Section 2 briefly overviews
revious work in the field. Section 3 describes the architecture of
ur proposed hybrid BS power system. Section 4 formulates the
roblem of optimizing the total cost of the hybrid BS power sys-
em. Section 5 proposes a heuristic algorithm to solve the problem
nd reduce computation complexity. Section 6 shows simulation
esults, and Section 7 concludes the paper.
. Related work
Research on the use of renewable energy sources (RES) to
ower BSs of radio access networks started only a few years ago.
he authors of [12] provide quite a comprehensive survey of the
tate of the art in this field.
Several works focused on the allocation of resources in a por-
ion of a network comprising a few BSs, some of which are pow-
red by RES. For example, the authors of [13] propose optimal BS
witch-on/off strategies to save energy within a radio access net-
ork, when some of the BSs are powered by RES. In [14] , the au-
hors propose an optimized method for RES utilization in a radio
ccess network, based on a 2-BS model, considering hybrid pow-
ring systems comprising RES and access to the power grid. The
ame authors also investigate a green-energy-aware and latency-
ware user association problem in [15] . However, these works do
ot consider in detail how energy is captured from RES, stored and
onsumed, and how RES can be combined with power grid use.
urthermore, these works do not account for the solar radiation
ariation during different portions of a day, and different season of
year, and thus with the corresponding variation in energy pro-
uction.
If we look into the details of a hybrid energy system (RES and
ower grid), although several works were published in the area
f energy engineering (e.g., [16,17] ), only few papers appeared in
he context of telecommunications with the aim to optimize the
S power system, including the variation of energy consumed for
ariable traffic load. A recent work proposes a hybrid diesel-solar
nergy system to power a BS [18] , but does not try to optimize
apEx and OpEx. The authors of [19] propose the optimization of
he cost of a PV-wind hybrid system to power a GSM/CDMA BS,
ccounting for wind and solar energy variations during the year,
ut do not consider the traffic variation during the day. In [20] the
uthors propose a service-adaptive method (i.e., the adaptation of
apacity and coverage) for managing the PV and grid power re-
ources to power a BS, and propose an implementation; however,
hey do not investigate the system CapEx and OpEx.
The novelties of our work with respect to previous papers are:
) we focus on the global optimization of both CapEx and OpEx
or a hybrid LTE BS power system (with PV and power grid); ii)
e consider the variation of solar radiation in different times of
he day, different seasons of the year, and different locations of the
orld; iii) we assume an evolutionary perspective for both the sys-
em efficiency and the BS traffic load, over the 10-year period; iv)
e optimize the total cost over the 10-year time span before the
ntroduction of a newer radio access network technology.
. The BS power system
This section introduces the elements of the solar power system,
s well as the overall BS power system architecture, and discusses
he parameters that are used in our study.
.1. Photovoltaic panels
Photovoltaic (PV) or solar panels are used to convert solar radi-
tion into electricity. The PV panel instantaneous output power de-
ends on the level of solar radiation, on the conversion efficiency,
nd on the power loss factor, that accounts for system losses dur-
ng the power transformation. In this paper we assume a conver-
ion efficiency equal to 16%, which is today common for standard
V panels.
The peak output power of a PV panel, usually measured in
kilowatt-peak” (kWp), is directly proportional to the panel size.
1 kWp PV panel is defined as a PV module. The instanta-
eous output power of a 1 kWp PV module is directly related to
he corresponding solar radiation, and can be expressed as P =G
10 0 0 A η(G, T m
) , where A is the module area in m
2 , G is the so-
ar radiation in W / m
2 , and η( G, T m
) is the module efficiency, which
epends on radiation and temperature [10] . Therefore, the trend of

14 Y. Zhang et al. / Computer Networks 112 (2017) 12–23
i
g
a
b
t
e
f
3
m
w
P
w
o
R
s
t
e
R
a
t
L
s
3
i
d
p
o
d
p
F
I
a
d
3
B
y
r
t
t
i
a
c
a
8
c
t
t
T
t
C
P
t
T
a
t
the variation of the instantaneous power production of a PV panel
is the same as the trend of the variation of the instant solar radi-
ation (although the relation is non-linear). The amount of energy
produced by a PV panel also depends on the location, which de-
termines the amount of solar radiation, due to latitude, tilt, and
weather conditions. The National Renewable Energy Laboratory of
the United States has made available online a software named
“PVWatts” [21] , which allows the estimation of the different en-
ergy production patterns of PV panels located in different positions
of the earth. We use the software “PVWatts” to obtain the amount
of energy produced during a typical meteorologic year, and select
two locations as examples: Torino in Italy and Aswan in Egypt. The
climate and solar radiation patterns in these two cities are quite
different. Torino has a typical cycle of four different seasons; in
winter it is rainy and cold, while during the summer it is hot and
sunny. Aswan locates near the Tropic of Cancer; it is usually hot
and dry during the whole year, with limited seasonal variations.
Our solar power system is tested in these two cities to analyse the
most suitable conditions of the different power options.
3.2. Batteries
Batteries are used to store the energy which is not immedi-
ately used to run the BS, but becomes necessary at night or dur-
ing the days when solar radiation is too low (i.e., rainy days or
cloudy days, or days of short solar radiation in winter) to obtain
enough electricity to power the BS. In our optimization of the BS
power system, we simulate the battery charge and discharge to
compute how many batteries are needed to avoid energy short-
age at the BS. We consider a power loss factor equal to 85%, which
means that 15% of the power is lost during the transition of charg-
ing/discharging batteries. Usually, the battery charge level (i.e., the
percentage of energy inside the batteries with respect to the max-
imum) needs to stay above 30% to keep the batteries in a healthy
condition for the lead-acid batteries we use in this paper.
We define a parameter named PT , as the percentage of time dur-
ing the whole year when the batteries charge level is above 30%.
For pure solar BS power systems, we need PT = 100%. For hybrid
solar-grid or solar-diesel systems, we can consider lower values of
PT , since we assume that the BS can obtain energy from either
the power grid or a small Diesel generator when the batteries are
empty (i.e., their charge level reaches 0%). In this paper, we inves-
tigate three hybrid scenarios, with PT equal to 70%, 80%, and 90%.
An additional issue to be considered in the study of the BS
power system over a 10-year period is the battery life. We as-
sume that the system uses traditional lead-acid batteries, whose
life is around 500 cycles [22] . This means that a battery must be
replaced when the cumulative depth of discharge of the battery
reaches 500 times its capacity. We account for the improvement of
battery technology during the 10-year period. The lifetime of bat-
teries improves when new batteries come to the market. According
to [23] , battery life is predicted to improve from 500 cycles at this
moment to 30 0 0 cycles in 2030.
3.3. The architecture of the BS power system
Fig. 1 shows the high-level architecture of the BS power sys-
tem. A controller manages the energy flow from the three power
sources (i.e., PV panel, batteries, and possibly grid/diesel as an ad-
ditional power source) to the two power consumers (i.e., BS and
batteries). The algorithm running on the controller dynamically
switches the energy intake from the PV panel to the batteries
to the additional power source, if present. Whenever the power
generated by the PV panel is more than what needed to oper-
ate the BS, the extra power is sent to the battery. When the PV
panel produces less power than needed by the BS, some energy
s taken from batteries. If batteries are depleted, and the power
enerated by the PV panel is not sufficient to operate the BS, the
dditional power source is used, if present; otherwise, the BS must
e switched off. In addition, if the BS power system is connected
o the power grid, it may be possible to sell back the extra en-
rgy which is generated by the PV panel when the batteries are
ull (100% charge).
.4. Power model of the LTE base station
The power consumption of the LTE macro BS can be approxi-
ated as a function of the output power of the power amplifier
ithin the Radio Frequency (RF) module, [1] :
(ρ) = N T X ( P 0 + �p P max ρ) 0 ≤ ρ ≤ 1 , (1)
here N TX is the number of antennas, P max is the maximum power
ut of the RF power amplifier, P 0 is the power consumed when the
F output is null, �p is the slope of the emission-dependent con-
umption. The power out of the RF power amplifier is proportional
o the traffic load of the BS.
To reduce the power consumption of LTE base stations, one
ffective technological choice consists in the adoption of Remote
adio Units (RRU), i.e., in the placement of radio units close to
ntennas, so as to reduce the power losses inherent in long an-
enna feed cables. In this paper, we use the power model of a
TE macro base station with RRU, as reference to conduct our
tudy.
.5. Traffic profile of the mobile users
A detailed daily profile of the traffic generated by mobile users
s necessary to compute, together with the BS power model, the
aily energy consumption of the BS. This quantity and the PV
ower generation during the day allow us to obtain the amount
f energy which can be stored in the batteries, or needs to be
rained from batteries (depending if the balance between the PV
anel generation and the BS consumption is positive or negative).
ig. 2 shows the normalized traffic profile measured on a cell of an
talian mobile network operator, distinguishing between weekends
nd weekdays. The profile refers to a residential area, with peaks
uring the evening.
.6. Evolution of the parameters over 10 years
In this paper, we focus on the computation of the cost of the
S power system, including CapEx and OpEx for a period of 10
ears; during such a long time span, many of the key system pa-
ameters are bound to change, some by a significant amount. It is
hus necessary to account for these variations in the cost computa-
ion, in order to achieve a careful assessment of the relative mer-
ts of the possible alternative solutions. The price of solar panels
nd batteries can be estimated from a recent report by NREL [24] ,
oncluding that the price of a lead-acid battery (12 V, 200 Ah) is
pproximately 150 €, and the price of 1 kWp PV panel is around
00 €. We collected data from reports and forecasts about the
urrent levels and the predicted future evolution of PV and bat-
ery prices, traffic profiles, electricity prices, diesel fuel prices, bat-
ery technologies and PV panel efficiency, etc., in both Aswan and
orino. Table 1 shows the foreseen evolution of the BS power sys-
em parameters. We assume that the traffic load will follow a 50%
AGR from 2% in the first year to 76.8% in the 10th year [25] ; the
V efficiency is known to degrade 1% each year [26] ; the elec-
ricity and diesel prices are forecasted to increase 3% per year in
orino [27] and 20% per year in Aswan [28] . The gap between the
ctual and the predicted electricity and diesel prices between the
wo cities comes from the fact that Egypt has rich oil storage and

Y. Zhang et al. / Computer Networks 112 (2017) 12–23 15
Fig. 1. Architecture of the BS power system.
Table 1
Prediction of the values of the parameters of the BS power system in the 10-year period.
Year Peak traffic load PV efficiency reduction Electricity price [€ /kWh] Diesel price [€ /liter]
Torino Aswan Torino Aswan
1 0 .020 1 0 .217 0 .070 1 .600 0 .490
2 0 .030 0 .99 0 .223 0 .084 1 .648 0 .588
3 0 .045 0 .98 0 .230 0 .098 1 .696 0 .686
4 0 .067 0 .97 0 .236 0 .112 1 .744 0 .784
5 0 .101 0 .96 0 .243 0 .126 1 .792 0 .882
6 0 .151 0 .95 0 .249 0 .140 1 .840 0 .980
7 0 .227 0 .94 0 .256 0 .154 1 .888 1 .078
8 0 .341 0 .93 0 .262 0 .168 1 .936 1 .176
9 0 .512 0 .92 0 .269 0 .182 1 .984 1 .274
10 0 .768 0 .91 0 .275 0 .196 2 .032 1 .372
0 4 8 12 16 20 240
0.2
0.4
0.6
0.8
1
Time(hour)
Nor
mal
ized
traf
fic lo
ad
WeekdaysWeekends
Fig. 2. Traffic profiles measured on an operational cellular network.
e
o
t
n
r
4
4
o
v
a
u
t
f
�
t
g
w
xploitation, while Italy imports from other countries most of its
il and electricity. However, because of the economic globaliza-
ion, the gap is forecasted to become smaller and smaller in the
ext years, therefore the prices in Aswan follow a higher increase
ate.
. Mathematical formulation
.1. Optimization of the yearly cost
For starters, we formulate the cost minimization problem over
ne year (the system parameters are kept constant in this inter-
al), and then we extend our optimization to the 10-year period,
ccounting for the evolution of the system parameters.
The time granularity is defined by the parameter �, which is
sed to calculate energy production and consumption. Since the
raffic and the energy production profiles that we use contain data
or every half hour, the finest time granularity that we can use is
= 30 min. With this choice, the number of intervals in one year,
hat is denoted by T , becomes T = 17 , 520 . If we reduce the time
ranularity to � = 120 min, we get T = 4380 . For each interval �
e define appropriate variables in the mathematical formulation.
The following is the definition of the problem.
Parameters :
• S i : Energy production of 1 kWp solar panel in the i th interval, i
∈ [1, T ]; S i is measured in Wh.
• E i : Energy consumed by the BS in the i th interval, i ∈ [1, T ]; E i is measured in Wh.
• B : Capacity of energy storage for one battery; B is measured in
Wh.
• C PV : Cost of 1 kWp PV solar panel; C PV is measured in
Euro/kWp.
• C : Cost of one battery; C is measured in Euros.
batt batt
16 Y. Zhang et al. / Computer Networks 112 (2017) 12–23
o
o
t
c
u
fi
v
p
s
t
t
2
a
c
t
s
t
p
i
f
s
e
4
p
r
c
S
t
r
p
O
c
f
t
o
o
o
t
d
a
a
i
(
c
c
i
a
b
i
i
o
r
c
m
p
g
r
t
r
n
p
• C grid : Cost of 1 Wh of electricity obtained from the power grid.
Alternatively, we can use C diesel : Cost of 1 Wh of electricity ob-
tained from a Diesel generator. C grid and C diesel are measured in
Euro/Wh.
Variables :
• x i : Charge of batteries normalized to the capacity B, x i ∈ [0, 1],
i ∈ [1, T ].
• y i : Variable used to define the battery charge and possible en-
ergy deficit after the generation and consumption in time slot
i, i ∈ [1, T ]. y i is measured in Wh.
• n : Number of batteries, n > 0.
• p : Size of the solar panel; p is measured in kWp.
• a i : Variable that indicates if the battery charge is above 0.3;
needed to define the constraint on PT for hybrid systems.
• b i : Amount of energy taken from the grid or the Diesel genera-
tor in the i th interval, i ∈ [1, T ]; b i is measured in Wh.
Objective function :
minimize : (2)
C total = C PV × p + C batt × n + C grid /d iesel ×T ∑
i =1
b i (3)
Constraints :
y i = min { B × n × x i −1 + p × S i − E i , B × n } (4)
B × n × x i = max { y i , 0 } (5)
b i = max {−y i , 0 } (6)
x 1 = 1 (7)
0 ≤ x i ≤ 1 , i ∈ [2 , T ] (8)
a i =
{0 if x i < 0 . 3
1 if x i ≥ 0 . 3
(9)
T ∑
i =1
a i /T ≥ P T (10)
Constraint (4) imposes that each battery cannot be charged
above its capacity B ; (5) , instead, defines the actual battery charge.
In the case of a pure solar BS power system (i.e., no connection
to the grid, and no Diesel generator), P T = 100 %, and constraint
(10) imposes that all variables a i are equal to 0, i.e., x i ≥ 0.3. This
means also that y i is never below 0, and b i is always 0. Indeed, in
the pure PV case, no energy is bought from the grid or supplied
by the diesel generator; the battery charge is never below 30%. In-
stead, in the case of a hybrid BS power system, some variables a i can go to 0, meaning battery charge below 30%, and in some cases
the variables y i become negative, meaning that the batteries are
depleted ( x i = 0) and some energy corresponding to b i is purchased
from the grid.
4.2. Analysis of computational complexity and linearisation
The complexity of solving this MIP problem is very high, be-
cause of the large number of variables and constraints, especially
when a fine granularity (small values of �) is chosen.
The formulation above contains two kinds of non-linearities.
One stems from the min and max functions that appear in the
equations. For instance, constraint (4) includes a min function that
defines a limit for the battery charge. CPLEX can deal with this
kind of nonlinearities, as long as the solution set is convex. The
ther non-linearity derives from the product of two variables. In
ur case, the term n × x i in constraint (4) is the product of two of
he problem variables. CPLEX cannot handle this kind of non-linear
onstraints. It is thus necessary to introduce a linearization, or to
se a fixed point approach. We decided to use the latter option,
xing the value of n and solving the MIP problem for the chosen
alue, and then changing the value of n and again solving the MIP
roblem. We let the value of n vary in the range [0, 50], and we
elect the value of n that provides the best result (i.e., the lowest
otal cost) as the final optimal solution.
For a PC with Intel i5 dual-core CPU and 4 GB of main memory,
he process of finding the solution in the case � = 30 min takes
–3 h. In the case � = 120 min, the computation time reduces to
round 10–15 min. Obviously, this implies some sacrifice in the ac-
uracy of the final results. To investigate the sensitivity of the op-
imization solution to the chosen time granularity, in Table 2 we
how an example of the results obtained with the two values of
ime granularity in the case of Torino, under full traffic load, and
ure solar system. The results show that the sacrifice in accuracy
s only around 1%, which seems acceptable. Other cases, with dif-
erent choices of the load, presented similar accuracy. In the next
ections, we will report the results of CPLEX for a time granularity
qual to � = 120 min.
.3. Dimensioning over a 10-year period
In the previous section, we have discussed the minimization
roblem over a one-year period. When looking at the 10-year pe-
iod, the system parameters must be modified year by year, ac-
ording to the evolution of the parameters that was described in
ection 3 and reported in Table 1 . To optimally dimension the sys-
em for a 10-year period of operation, we proceed as follows. We
epeat the system dimensioning process up to 10 times, using the
arameters referring to each year, from the 10-th, down to the 1-st.
nce the dimensioning is obtained for a set of parameters’ values
orresponding to a given year, the system evolution is simulated
or the 10-year period. During this simulation, it may happen that
he dimensioning obtained for a given year is not sufficient for an-
ther year (for example, because of the violation of the constraint
n PT). This typically happens when the parameters refer to one
f the first years of the 10-year period, where traffic is low and
he PV panel is at the peak of its efficiency, so that the system
imensioning is not sufficient for a later year with higher traffic
nd lower PV panel efficiency. This is why we start with year 10,
nd we go down until we find a year for which the dimensioning
s insufficient. When this happens, the dimensioning for such year
say year k ), as well as for all other previous years (all years i ≤ k )
an be considered inapplicable. During this simulation, the possible
ost of battery replacements, due to batteries reaching the max-
mum number of charge and discharge cycles, is also taken into
ccount. Finally, the best dimensioning is decided as the applica-
le one with the minimum total cost, taking into account initial
nvestment, battery replacements, and energy purchase (if any).
For the case of Torino, whose detailed results will be discussed
n Section 6 , we found that the system dimensioning is possible
nly when the one-year optimization is performed using the pa-
ameters of the 9th or 10th year. In order to better explain why,
onsider an example. Assume that the system dimension is opti-
ized using the parameters for the first year. When a 10-year long
eriod is simulated, as time goes by, the PV panel efficiency de-
rades and the traffic load increases to such an extent that the
equested constraint on PT cannot be met in the years following
he first. For this reason, more conservative assumptions on the pa-
ameters (such as values corresponding to the 9th or 10th year) are
eeded to guarantee that the constraint on PT is met for the whole
eriod. When considering the total cost, the dimensioning for the

Y. Zhang et al. / Computer Networks 112 (2017) 12–23 17
Table 2
Impact of time granularity �, case of Torino.
Time granularity �[ hour ] PV size [kWp] No. batt. PV+batt. cost [k€ ] Total cost [k€ ] Gap [%]
0 .5 4 .5 15 5 .807 8 .115 1 .34%
2 4 .8 14 5 .853 8 .007 0
9
1
t
o
p
t
t
5
m
m
t
l
e
t
a
c
s
t
t
R
r
e
t
s
5
A
s
c
s
e
s
n
e
n
i
m
i
m
b
t
5
p
h
t
o
p
t
a
Table 3
Dimension of PV panel and batteries from 1st year to 10th year, case
of Torino with PT = 100% and PT = 90% , one-year optimization done
with CPLEX for parameters of the 9th year.
Year PT = 100% PT = 90%
PV size [kWp] No. batt. PV size. [kWp] No. batt.
1 12 .8 36 7 .6 10
2 12 .8 36 7 .6 10
3 12 .8 38 7 .6 11
4 12 .8 41 7 .6 12
5 12 .8 41 7 .6 12
6 12 .8 42 7 .6 12
7 12 .8 43 7 .6 12
8 12 .8 44 7 .6 12
9 12 .8 45 7 .6 13
10 12 .8 47 7 .6 15
Fig. 3. Comparison of PV size and number of batteries between the solution ob-
tained with CPLEX and the heuristic algorithm; PT = 100%, case of Torino.
w
t
5
p
t
p
s
o
i
1
s
s
c
b
t
c
P
th year results more convenient than the dimensioning based on
0th year parameters. The best dimensioning is thus the one ob-
ained by running the one-year optimization with the parameters
f the 9th year.
In the case of Aswan, the second location we consider in this
aper, the optimization with the parameters of the 10th year is
he only one that guarantees that the constraint on PT is met for
he whole 10 year period.
. A heuristic algorithm
Although the reduction of the time granularity in the MIP
akes the computation time for one instance of the one year opti-
ization as low as about a quarter of an hour, the total computa-
ion time necessary to obtain solutions using CPLEX remains very
ong. Indeed, each problem instance has to be solved 50 times for
ach of the admissible values of the number of batteries, due to
he non-linear constraints resulting from the products of two vari-
bles, as we mentioned in the previous section. Therefore, the total
omputation time to obtain the global optimum is of the order of
everal hours. While this can be acceptable for the final tuning of
he selected option, it is clearly too long for the what-if analysis
hat is necessary to explore possible variable settings in terms of
AN technology, network deployment, BS layout (e.g., small cells),
esource allocation algorithms (e.g., sleep modes), service offering,
tc. With the objective of a consistent reduction of the computa-
ion time, we propose a heuristic algorithm for the approximate
olution of the optimization problem.
.1. Pseudocode
The pseudo code of the heuristic algorithm is reported in
lgorithm 1 .
The heuristic can handle both the pure solar and the hybrid
olar-grid (or solar-diesel) BS power systems. The algorithm in-
ludes 3 layers of nested loops. The most external loop spans the
ize of the PV panel, starting from 0 up to the maximum consid-
red PV panel size in kWp. The most internal loop spans the con-
idered number of time slots in the year. The third loop spans the
umber of batteries, starting from 0 up to the maximum consid-
red number. During the loop execution, if the battery charge does
ot meet the PT constraint, the program jumps out of the most
nner loop and one more battery is considered. The middle and
ost external loops stop when the minimum number of batteries
s found. Thus, for the different admissible values of PV size, the
inimum required number of batteries is calculated. Finally, the
est PV panel size is selected, according to the lowest value of to-
al cost.
.2. Computational complexity
The proposed heuristic has much lower complexity as com-
ared with the MIP solution through CPLEX. In the worst case, the
euristic algorithm examines each value of the 3 loop layers, so
hat the total number of examined cases is equal to the product
f three integer values: the maximum PV panel size in kWp multi-
lied by the maximum number of batteries, and by the number of
ime intervals in a year. In practice, this amounts, in the worst case
nd for the finer considered time granularity, to 20 × 50 × 17 , 520 ,
hich is about 17 million. The search for the global optimum with
his heuristic approach requires about 1 minute.
.3. Gap between CPLEX and algorithm
We now assess the accuracy of the heuristic algorithm by com-
aring the results with those we obtain through the MIP formula-
ion.
Table 3 shows the evolution of the system size over the 10-year
eriod for the case of Torino and P T = 100 % or P T = 90% ; the re-
ults are obtained using CPLEX to solve the MIP formulation. The
ne-year optimization is performed, as previously explained, us-
ng the 9th year parameters. The panel size is constant over the
0-year period because panels are not changed, once they are in-
talled. The number of batteries, instead, increases year by year to
ustain the increased need for energy due to growing load. In the
ase of P T = 100% , the system needs larger panel size and more
atteries, due to the tighter constraint.
To show the difference between the solution obtained through
he MIP formulation and the heuristic approach, Fig. 3 reports the
hosen PV size and number of batteries in the 10-year period, for
T = 100%. The results for CPLEX have smaller size of PV panel

18 Y. Zhang et al. / Computer Networks 112 (2017) 12–23
Algorithm 1 Pseudocode of the heuristic algorithm: Find the com-
bination of PV size and number of batteries that minimizes the to-
tal cost of the BS power system.
1: %%%%% Start initialization
2: P T = 70% or 80% or 90% or 100% ;3: length = 17520 ;4: Battery _ capacity = 2 . 4(kW h ) ;5: Max _ P V = 20(kW p) ;6: Max _ battery = 50 ;7: Array Unit _ production [ length ] are pre-calculated;
8: Array Consumption [ length ] are pre-calculated;
9: Sum _ P T [ p] = 0 ;10: Gr id _ ener gy = 0 ;11: %%%%% End initialization
12: %%%%% Main loop: Try different values of PV size, for each PV
size find minimum no. of batteries
13: for p = 0 ; p < Max _ P V ∗ 10 ; p + + do
14: P V _ size [ p] = p ∗ 0 . 1 ;15: Number _ of _ batteries [ p] = 1 ;16: while Number _ of _ batteries [ p] < Max _ battery do
17: Bat tery _ stat us [ p][0] = Number _ of _ batteries [ p] ∗Battery _ capacity ;
18: for i = 0 ; i < length ; i + + do
19: if Bat tery _ stat us [ p][ i ] /Bat tery _ stat us [ p][0] < 0 . 3 then
20: P T _ f lag[ p][ i ] = 1 ;21: else
22: P T _ f lag[ p][ i ] = 0 ;23: end if
24: Sum _ P T [ p] = sum _ P T [ p] + P T _ f lag[ p][ i ] ;25: if Sum _ P T > = (1 − P T ) ∗ length then
26: F l ag _ f easibl e = 0 ;27: else
28: Bat tery _ stat us [ p][ i + 1] = MIN{ (Bat tery _ stat us [ p][ i ]+
P V _ size [ p] ∗ Unit _ production [ i ] −Consumption [ i ]) ,
Bat tery _ stat us [ p][0] };29: F l ag _ f easibl e = 1 ;30: end if
31: if Bat tery _ stat us [ p][ i ] < 0 then
32: Gr id _ ener gy [ p] = Gr id _ ener gy [ p] − Bat tery _ stat us [ p][ i ] ;33: end if
34: end for
35: if F l ag _ f easibl e == 0 then
36: Number _ of _ batteries [ p] = Number _ of _ batteries [ p] + 1 ;37: else
38: Break ;39: end if
40: end while
41: cost[ p] = Cost _ P V ∗ P V _ size [ p] + Cost _ battery ∗Number _ of _ batteries [ p] + Cost _ gr id _ ener gy ∗ Gr id _ ener gy [ p] ;
42: end for
43: %%%%% End main loop
44: %%%%% Among the found solutions look for the minimum cost
one
45: for m = 0 ; m < Max _ P V ∗ 10 ; m + + do
46: Find the smallest cost[ m ] ;
47: end for
48: return cost[ m ] , Gr id _ ener gy [ m ] , P V _ size [ m ] and Number _ of _
batteries [ m ] ;
Fig. 4. Comparison of PV size and number of batteries between the solution ob-
tained with CPLEX and the heuristic algorithm; PT = 90%, case of Torino.
Fig. 5. Comparison between CPLEX and the heuristic algorithm in the case of Torino
with no energy sell-back.
o
s
a
y
r
w
u
p
t
l
f
a
t
a
h
t
P
b
s
t
a
a
f
(y-axis on the left), but larger number of batteries (y-axis on the
right). Similar results for the case of P T = 90% are shown in Fig. 4 .
Although the dimension for P T = 90% is much smaller than the di-
mension for P T = 100%, the comparison of CPLEX and algorithm is
the same: CPLEX results require smaller PV size but larger number
of batteries.
We now consider the difference between the solutions in terms
f the total cost of the system. The total cost is computed as the
um of the initial investment, including the cost of the PV panel
nd batteries, and the additional cost that occurs during the 10-
ear period to increase the number of batteries, if needed, and to
eplace the batteries once they are exhausted. In order to compute
hen the batteries are exhausted, the battery charge status is sim-
lated over the whole period. A detailed discussion of this will be
rovided in Section 6 . Moreover, when PT < 100%, some cost due
o energy purchase from the power grid is also taken into account.
Fig. 5 shows the comparison between the total cost for the so-
utions obtained with CPLEX and the heuristic algorithm. The gap
or P T = 90% is within 10%, while the gap for P T = 100% is within
bout 20%. Larger gaps appear from the moment in which the bat-
eries are being replaced, e.g., from the 8th year for P T = 100% ,
nd the 3rd year for P T = 90% . For the solution obtained from the
euristics, the number of battery replacements is higher than for
he CPLEX solution. This is because the heuristics returns a larger
V panel size and lower number of batteries, which means more
attery cycles and more frequent battery replacements. Note that
ometimes the results of the heuristics are more convenient than
hose of CPLEX. This is due to two reasons: 1) the CPLEX results
re calculated by relaxed granularity, i.e. 2 h, which reduces the
ccuracy of the optimum solution; 2) the optimization is only done
or one year and not over the whole 10-year period, because, as al-

Y. Zhang et al. / Computer Networks 112 (2017) 12–23 19
Fig. 6. Comparison between CPLEX and the heuristic algorithm in the case of Torino
with energy sell-back.
Fig. 7. Comparison between CPLEX and the heuristic algorithm in the case of
Aswan, no energy sell-back.
r
m
r
p
t
9
s
b
c
s
t
C
a
T
t
c
t
t
t
n
Fig. 8. Example of battery status for a system with kWp = 16.6, 27 batteries,
PT = 100% (i.e., without grid power), during the 9th year under the residential traffic
profile, in Torino.
t
c
l
C
6
c
m
q
r
r
d
6
6
o
p
p
c
g
T
1
s
I
t
w
P
c
o
i
g
T
v
t
n
i
w
s
B
eady discussed, the parameter evolution and battery replacements
ake the formulation non-linear and infeasible. Hence, the CPLEX
esults are not always the true optimum over the whole 10-year
eriod.
Fig. 6 shows the comparison between the results of CPLEX and
he results of heuristics, with energy sell-back ( P T = 100% and
0%). This means that when energy is produced that cannot be
tored because the battery is fully charged, the energy can be sold
ack to the power grid. We assume that the selling price is half the
ost at which energy is purchased from the power grid. The figure
hows that the gaps between CPLEX and heuristics are similar to
hose of the case without energy sell-back, shown in Fig. 5 .
Similar to what we do with Torino, we compare the results of
PLEX and the heuristic algorithm for the case of Aswan; results
re reported in Fig. 7 , assuming that energy cannot be sold-back.
he largest gap, in this case, is around 30%, but the differences at
he end of the 10-year period are within 15%. The results for the
ase with energy sell-back are very similar and omitted here for
he sake of brevity.
The results show that while the solutions obtained with the
wo approaches are similar, there is a systematic difference with
he heuristic solutions selecting larger PV panel size and smaller
umber of batteries. However, when the total cost is considered,
he differences between the solutions become rather small. We can
onclude that the heuristic approach leads, in shorter time, to so-
utions whose cost is comparable with the solutions obtained with
PLEX. Hence, in the following, we will use the heuristic approach.
. Comparing powering systems
In this section, we compare the effectiveness of the different
onsidered powering systems for both Torino and Aswan. As we
entioned in previous sections, the two considered cities have
uite different solar radiation patterns that lead to quite different
esults. Given the good accuracy provided by the heuristic algo-
ithm and its lower computational complexity, in what follows we
erive all results using the heuristic algorithm.
.1. The case of Torino
.1.1. System dimensioning
We start by considering the case of Torino for different values
f PT , focusing on the one year optimization, that, for Torino, is
erformed using the system parameters of the 9th year. Table 4 re-
orts the PV panel size, the initial number of batteries, the initial
ost, the cost due to the amount of energy bought from the power
rid (when PT < 100%) and the reward due to sold-back energy.
he results show that the hybrid solar-grid energy system ( PT <
00%) saves a lot in terms of cost and PV panel dimension with re-
pect to the pure PV case ( P T = 100%); savings are from 50% to 70%.
f 1 kWp PV panel roughly corresponds to 5 m
2 [21] , the size of
he PV panel of the hybrid system with P T = 70% is around 20 m
2 ,
hich is much more feasible for installation than the size of the
V panel for the pure solar energy system that is about 80 m
2 .
For the same case, Fig. 8 shows the simulation of the battery
harge status for the pure solar system ( P T = 100%). The red part
f the curve refers to the amount of energy that cannot be stored
nside the batteries. This part of energy is sold back to the power
rid, if this is possible, and it is wasted otherwise.
The green part in Fig. 8 represents the battery charge status.
he battery status is kept above 30%, which is a threshold that pro-
ides a safety margin in the design. The figure also clearly shows
hat the energy production bottleneck is in winter (at the begin-
ing and the end of the year) where the discharge of the battery
s much deeper. Therefore, to satisfy the requirement during the
inter season, more batteries and larger PV panels have to be in-
talled, and this leads to a larger energy wastage during summer.
y integrating the percentage of battery charging and discharging,

20 Y. Zhang et al. / Computer Networks 112 (2017) 12–23
Table 4
Size and cost of the powering system for the 9-th year dimensioning case, in Torino.
PT PV size [kWp] No. batt. PV+batt. cost [k€] Grid cost [k€ /y] Pay back [k€ /y]
70% 4 .3 5 4 .07 0 .16 0 .240
80% 4 .3 7 4 .38 0 .12 0 .229
90% 9 .1 7 8 .07 0 .05 0 .850
100% 16 .6 27 16 .92 0 1 .832
Fig. 9. Example of battery status for a system with kWp = 4.3, 5 batteries, PT = 70%,
during the 9th year under the residential traffic profile, in Torino.
Fig. 10. Total cost for some values of PT , no energy sell-back, in Torino.
Fig. 11. Total cost for some values of PT , with extra-energy sell-back, in Torino.
t
s
w
t
r
e
w
b
t
o
we compute how many battery cycles are consumed during the
year. Then, the time when the battery is exhausted can be com-
puted.
Fig. 9 shows the battery status of the hybrid solar-grid energy
system (the case P T = 70% is shown as an example). Similar to
Fig. 8 , the red part on the top stands for the wasted (or, if possible,
sold back) energy and the green part represents the battery status.
For P T = 70% the percentage of time in which the battery status
is above 30% is 70% of the entire year. The red part at the bot-
tom stands for the amount of energy that is taken from the power
grid. We assume that the BS uses energy from the power grid only
when the battery is empty. The battery discharge in this figure is
more balanced during the whole year with respect to Fig. 8 . The
discharging of the battery is much deeper, leading to a shorter
life time of the battery. However, the savings of the dimension-
ing of the system is large due to smaller CapEx (smaller PV panel
size and fewer batteries) and the larger number of battery replace-
ments does not impair the advantage of the hybrid system. We will
discuss the cost on 10 year periods in the next section.
6.1.2. Capex and opex in a 10 year period
Now we focus on the system cost during the whole 10 year pe-
riod. Fig. 10 reports the case in which energy sell-back is not pos-
sible, i.e., the energy that is produced, but cannot be stored in the
battery or consumed, is wasted. The figure shows the comparison
between the cases of pure solar, hybrid solar-grid, grid only and
diesel generator. The break-even point between the hybrid systems
with P T = 80% and 90% and the grid only case is around the 8th
year, meaning that taking all costs into account (CapEx and OpEx)
the hybrid system starts being cheaper than the grid-only pow-
ering from the 8th year. As previously observed, hybrid systems
cost much less than the pure solar system, with savings from 50%
to 70%. The case with diesel generator is the most expensive one,
even more expensive than the pure solar system from the 5th year.
These results demonstrate that the proposed hybrid systems not
only have the advantage of renewable energy which is clean and
sustainable, but are also cost effective with respect to the tradi-
tional power grid.
Fig. 11 shows the results for the case with energy sell-back. In
hese cases, hybrid systems reduce cost from the 6th year with re-
pect to the power grid. The pure solar system, being dimensioned
ith larger panels, results more convenient than the hybrid sys-
ems. However, the pure solar systems are usually deployed in ru-
al areas where there is no access to the power grid, so that extra-
nergy cannot be sold back. Therefore, for comparison purposes,
e also show the pure solar energy system without energy sell-
ack. The hybrid system with sell-back saves about 70% to 80% of
he cost by the 10th year compared to the pure solar system with-
ut sell-back.
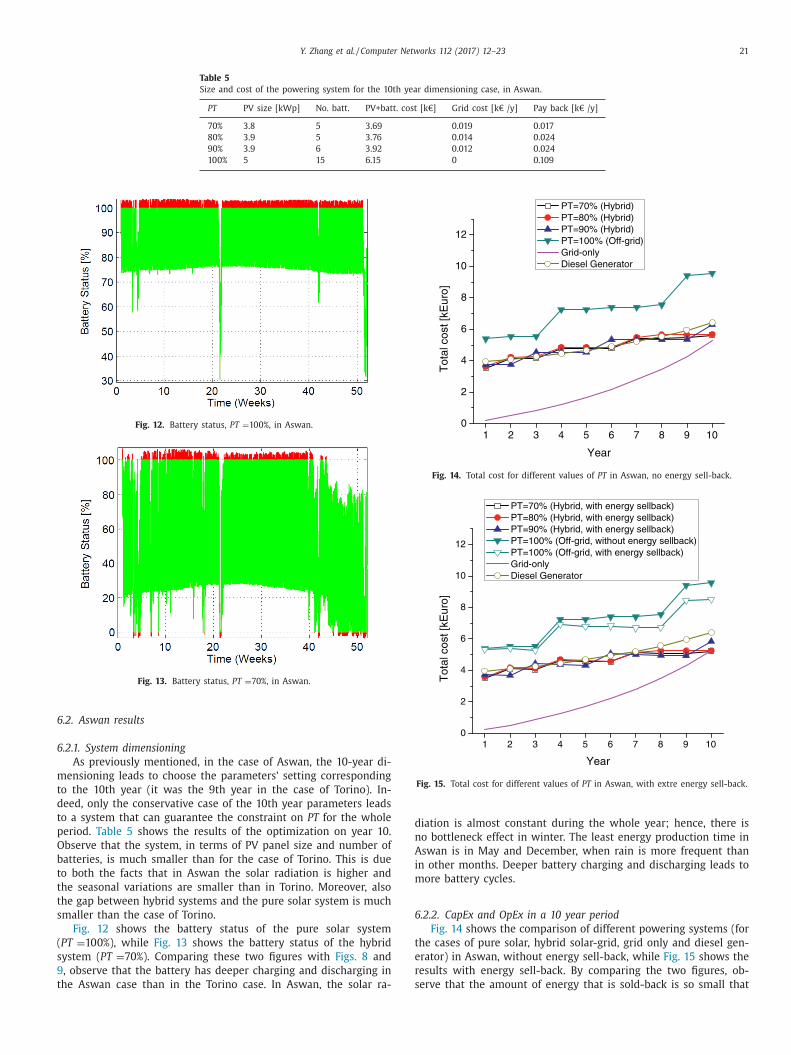
Y. Zhang et al. / Computer Networks 112 (2017) 12–23 21
Table 5
Size and cost of the powering system for the 10th year dimensioning case, in Aswan.
PT PV size [kWp] No. batt. PV+batt. cost [k€] Grid cost [k€ /y] Pay back [k€ /y]
70% 3 .8 5 3 .69 0 .019 0 .017
80% 3 .9 5 3 .76 0 .014 0 .024
90% 3 .9 6 3 .92 0 .012 0 .024
100% 5 15 6 .15 0 0 .109
Fig. 12. Battery status, PT = 100%, in Aswan.
Fig. 13. Battery status, PT = 70%, in Aswan.
6
6
m
t
d
t
p
O
b
t
t
t
s
(
s
9
t
1 2 3 4 5 6 7 8 9 100
2
4
6
8
10
12
Tot
al c
ost [
kEur
o]Year
PT=70% (Hybrid) PT=80% (Hybrid) PT=90% (Hybrid) PT=100% (Off-grid) Grid-only Diesel Generator
Fig. 14. Total cost for different values of PT in Aswan, no energy sell-back.
1 2 3 4 5 6 7 8 9 100
2
4
6
8
10
12
Tot
al c
ost [
kEur
o]
Year
PT=70% (Hybrid, with energy sellback) PT=80% (Hybrid, with energy sellback) PT=90% (Hybrid, with energy sellback) PT=100% (Off-grid, without energy sellback) PT=100% (Off-grid, with energy sellback) Grid-only Diesel Generator
Fig. 15. Total cost for different values of PT in Aswan, with extre energy sell-back.
d
n
A
i
m
6
t
e
r
s
.2. Aswan results
.2.1. System dimensioning
As previously mentioned, in the case of Aswan, the 10-year di-
ensioning leads to choose the parameters’ setting corresponding
o the 10th year (it was the 9th year in the case of Torino). In-
eed, only the conservative case of the 10th year parameters leads
o a system that can guarantee the constraint on PT for the whole
eriod. Table 5 shows the results of the optimization on year 10.
bserve that the system, in terms of PV panel size and number of
atteries, is much smaller than for the case of Torino. This is due
o both the facts that in Aswan the solar radiation is higher and
he seasonal variations are smaller than in Torino. Moreover, also
he gap between hybrid systems and the pure solar system is much
maller than the case of Torino.
Fig. 12 shows the battery status of the pure solar system
P T = 100%), while Fig. 13 shows the battery status of the hybrid
ystem ( P T = 70%). Comparing these two figures with Figs. 8 and
, observe that the battery has deeper charging and discharging in
he Aswan case than in the Torino case. In Aswan, the solar ra-
iation is almost constant during the whole year; hence, there is
o bottleneck effect in winter. The least energy production time in
swan is in May and December, when rain is more frequent than
n other months. Deeper battery charging and discharging leads to
ore battery cycles.
.2.2. CapEx and OpEx in a 10 year period
Fig. 14 shows the comparison of different powering systems (for
he cases of pure solar, hybrid solar-grid, grid only and diesel gen-
rator) in Aswan, without energy sell-back, while Fig. 15 shows the
esults with energy sell-back. By comparing the two figures, ob-
erve that the amount of energy that is sold-back is so small that

22 Y. Zhang et al. / Computer Networks 112 (2017) 12–23
[
[
[
the two figures are almost the same. This is due to the dimension-
ing of the PV system that well fits the energy need of the BS.
From the two figures, we also see that the hybrid system saves
with respect to the pure solar system, as in the case of Torino,
and it is almost equivalent in cost to the diesel generator (consider
however that we only account for the cost of fuel, which in Egypt
is very low, excluding transport, etc). The cost for the hybrid sys-
tems is instead higher (about 10% higher at the end of the 10-year
period) than for the connection to the power grid; this is because
in Egypt the price of grid power is quite low. Again, consider that
we do not include the cost of connecting the BS to the power grid,
which can be marginal within the city of Aswan, but very high in
the surrounding rural areas.
The increase of cost for the power grid with time in Aswan is
faster than in Torino (see Figs. 10 and 11 ), because the price in-
crease rate (20% per year) is much higher than the one in Torino
(3% per year).
7. Conclusion
In this paper we studied powering systems for LTE macro BSs
that make use of solar energy, either relying on renewable energy
only, or using a mix of renewable energy and traditional supply.
We formulated the problem of the optimal choice of the PV panel
size and number of batteries with a Mixed Integer Programming
problem of cost minimization. We also proposed a heuristic algo-
rithm which is much more computationally efficient than the MIP
problem solution, while being reasonably accurate.
To discuss the effectiveness of the investigated BS powering sys-
tems, we considered two locations, Torino and Aswan, with quite
different solar ener gy generation patterns. The results show that
hybrid systems are much more effective than pure solar energy
system. In addition, in the case of Torino, hybrid systems also re-
duce cost with respect to the traditional power-grid system and
to a diesel generator. In Aswan, hybrid systems are economically
equivalent to diesel generators, and somewhat more expensive
than an existing connection to the power grid, because the elec-
tricity and diesel prices are both very low in Aswan.
Our study shows that powering BSs with renewable energy
sources is today not only possible at reasonable costs, but also in
many cases less expensive with respect to more traditional power
supply approaches. The forecast technology advances in both solar
cells and batteries will make the solar solution even more attrac-
tive in the years to come.
Acknowledgment
This work was supported by the European Union through the
Xhaul project (H2020-ICT-671598).
References
[1] fp7-EARTH project (Energy Aware Radio and neTwork tecHnologies) URL https:
//www.ict-earth.eu/ . [2] fp7-TREND project (Towards Real Energy-efficient Network Design) URL http:
//www.fp7-trend.eu/ .
[3] fp7-ECONET project (low Energy COnsumption NETworks) URL http://www.econet-project.eu/ .
[4] GreenTouch consortium URL http://www.greentouch.org/ . [5] Z. Hasan , H. Boostanimehr , V. Bhargava , Green cellular networks: a survey,
some research issues and challenges, IEEE Commun. Surv. Tut. 13 (4) (2011)524–540 .
[6] A.D. Domenico , E.C. Strinati , A. Capone , Enabling green cellular networks: asurvey and outlook, Comput. Commun. 37 (1) (2014) 5–24 .
[7] L. Budzisz , F. Ganji , G. Rizzo , M.A. Marsan , M. Meo , Y. Zhang , G. Koutitas ,
L.T.S. Lambert , B. Lannoo , M. Pickavet , A. Conte , I. Haratcherev , A. Wolisz , Dy-namic resource provisioning for energy efficiency in wireless access networks:
a survey and an outlook, IEEE Commun. Surv. Tut. 16 (4) (2014) 2259–2285 . [8] G. Foundation , Greentouch technical solutions for energy efficient mobile net-
works: improving the nationwide energy efficiency in 2020 by more than afactor of 10 0 0 0 in relation to the 2010 reference scenario, A GreenTouch White
Paper, Version 1.0 (2015) .
[9] Orange , Orange green strategy for AMEA zone, 2nd ITU Green Standards Week,Paris, France, 2012 .
[10] M.A. Marsan , G. Bucalo , A.D. Caro , M. Meo , Y. Zhang , Towards zero grid elec-tricity networking: powering BSs with renewable energy sources, in: Proc. IEEE
International Conference on Communications 2013: IEEE ICC’13 - Workshop onGreen Broadband access, Budapest, Hungary, 2013 .
[11] M. Meo , Y. Zhang , R. Gerboni , M.A. Marsan , Dimensioning the power supply
of a LTE macro bs connected to a pv panel and the power grid, in: Proc. IEEEInternational Conference on Communications 2015: IEEE ICC’15, London, UK,
2015 . [12] H. Hassan , L. Nuaymi , A. Pelov , Renewable energy in cellular networks: a sur-
vey, in: Proc. IEEE OnlineGreenComm, 2013 . [13] J. Gong , J.S. Thompson , S. Zhou , Z. Niu , Base station sleeping and resource al-
location in renewable energy powered cellular networks, IEEE Trans. Commun.
62 (11) (2014) 3801–3813 . [14] T. Han , N. Ansari , On optimizing green energy utilization for cellular networks
with hybrid energy supplies, IEEE Trans. Wireless Commun. 12 (8) (2013a)3872–3882 .
[15] T. Han , N. Ansari , Green-energy aware and latency aware user associations inheterogeneous cellular networks, in: Proc. IEEE Globecom 2013, Atlanta, GA,
USA, 2013b .
[16] G. Mereia , C. Berger , D.U. Sauer , Optimization of an off-grid hybrid pvwind-diesel system with different battery technologies using genetic algorithm, Sol.
Energy 97 (2013) 460473 . [17] S. Sinha , S. Chandel , Review of software tools for hybrid renewable energy sys-
tems, Renewable Sustainable Energy Rev. 32 (2014) 192205 . [18] S. Chowdhury , S. Aziz , Solar-diesel hybrid energy model for base transceiver
station (BTS) of mobile phone operators, in: Proc. 2nd International Confer-
ence on the Developments in Renewable Energy Technology (ICDRET), Dhaka,Bangladesh, 2012 .
[19] P. Nema , R. Nema , S. Rangnekari , PV-Solar / wind hybrid energy system forGSM/CDMA type mobile telephony base station, Int. J. Energy Env. 1 (2) (2010)
359–366 . [20] D. Valerdi , Q. Zhu , K. Exadaktylos , S. Xia , M. Arranz , R. Liu , D. Xu , Intelligent
energy managed service for green base stations, in: Proc. IEEE Globecom Work-shop on Green Communications, Miami, USA, 2010 .
[21] NREL, Pvwatts calculator URL http://pvwatts.nrel.gov/index.php .
[22] Apple, Determining battery cycle count for mac notebooks URL http://support.apple.com/kb/ht1519 .
[23] EASE/EERA, Joint EASE/EERA recommendations for a european energy storagetechnology development roadmap towards 2030 URL http://www.ease-storage.
eu/ . [24] NREL, Photovoltaic (pv) pricing trends: Historical, recent, and near-term pro-
jections URL http://www.nrel.gov/docs/fy13osti/56776.pdf .
25] Cisco, Cisco visual networking index: Global mobile data traffic forecast up-date, 2013–2018 URL http://www.cisco.com/ .
26] NREL, Photovoltaic degradation rates - an analytical review URL http://www.nrel.gov/docs/fy12osti/51664.pdf .
[27] EU energy trends to 2030 URL https://ec.europa.eu/energy/sites/ener/files/documents/trends _ to _ 2030 _ update _ 2009.pdf .
28] Dynamic, Egypt electricity tariffs URL http://www.dynamic-ews.com/Tariffs/
Electricity%20Tariffs/Egypt.pdf .

Y. Zhang et al. / Computer Networks 112 (2017) 12–23 23
partment of Electronic Engineering, Tsinghua University, Beijing, China, in 2007 and 2012,
of California, Davis, U.S.A. from September 2008 to August 2010. He was a postdoctoral 012 to May 2015. From June 2015 he has been a postdoctoral researcher at Trinity College
ent wireless networks and optical networks. He has co-authored over 5 IEEE and Elsevier
mittee member for over 10 IEEE and ACM conferences.
ineering in 1993, and the Ph.D. degree in Electronic and Telecommunications Engineering
November 2006, she is associate professor at the Politecnico di Torino. She co-authored ecial issues of international journals, including ACM Monet, Performance Evaluation, and
IEEE OnlineGreenComm and the International Advisory Council of ITC. She was program
iM, IEEE Online GreenComm, IEEE ISCC, IEEE Infocom Miniconference, ITC. Her research
modeling, green networking and traffic classification and characterization.
gineering in 20 0 0 and a PhD in Energy Engineering in 2006 both from the Politecnico
er at the Energy Department of Politecnico where she has been also a Post Doc Fellow
ook chapter with Woodhead–Elsevier and co-authored a book chapter with Springer. She
al of Contemporary Energy and serves as a reviewer for 3 Elsevier Journals. Her expertise efficient energy technologies. She has been responsible for MSc and Specializing Master
ll Professor at the Department of Electronics and Telecommunications of the Politecnico rks Institute (Spain). He earned his graduate degree in Electrical Engineering from the
lectrical Engineering at the University of California at Los Angeles (USA) in 1978. In 2002,
ation Networks from the Budapest University of Technology and Economics. From 2003 to ronics, Information and Telecommunication Engineering of the National Research Council
arch, Innovation and Technology Transfer at Politecnico di Torino. Marco Ajmone Marsan groups: He was Chair of the Italian Group of Telecommunication Professors (GTTI); the
mmittee of the EC’s 7th Framework Programme. He is a Fellow of the IEEE and he is s in Computer Science. He has been principle investigator for a large number of research
nal and international research projects.
Yi Zhang received his B.E. and Ph.D. degree both from De
respectively. He was a visiting Ph.D. student at Universityresearcher at Politecnico di Torino, Italy from November 2
Dublin, Ireland. His research interest includes energy-effici
journal papers. He has served as a Technical Program Com
Michela Meo received the Laurea degree in Electronic Eng
in 1997, both from the Politecnico di Torino, Italy. Since about 200 papers and edited a book with Wiley and six sp
Computer Networks. She chairs the Steering Committee ofco-chair of several conferences among which ACM MSW
interests include the field of performance evaluation and
Raffaella Gerboni received the MSc in Energy Nuclear En
di Torino. She received a five year contract as a ResearchResearcher for more than five years. She has authored a b
is member of the Editorial Board of the International Journis focused on energy systems analysis and on clean and
Courses.
Marco Ajmone Marsan holds a double appointment as Fudi Torino (Italy), and Research Professor at IMDEA Netwo
Politecnico di Torino in 1974 and completed his M.Sc. in E
he was awarded a “Honoris Causa” Ph.D. in Telecommunic2009 he was Director of the IEIIT–CNR (Institute for Elect
of Italy). From 2005 to 2009 he was Vice-Rector for Reseis involved in several national and international scientific
Italian Delegate in the ICT Committee and in the ERC Colisted by Thomson-ISI amongst the highly-cited researcher
contracts with industries, and coordinator of several natio