minimization of defects in sewing section at garment …ieomsociety.org/ieom2017/papers/406.pdfv...
TRANSCRIPT

Minimization of defects in sewing section at Garment and Textile Factories through
DMAIC methodology of Six Sigma,
(Case: MAA Garment and Textile Factory)
By
Hewan Taye Beyene
Submitted to School of Mechanical and Industrial Engineering in partial fulfillment of the
requirement for the award of Master of Science degree in Quality Engineering and Management
Advisor: Fasil Taddesse (PhD)
Co Advisor: AssefaMisgun (MSc.)
School of Mechanical and Industrial Engineering
Ethiopian Institute of Technology-Mekelle
Mekelle University
August 2016
1533

ii
Declaration
This is to certify that this title entitled “Minimization of defects in sewing section at Garment and
Textile Factories through DMAIC methodology of six sigma.” submitted for partial fulfillment
of the requirement for the award of degree of MSc in Industrial Engineering (Quality
Engineering and Management) Mekelle University through the school of Mechanical and
Industrial Engineering done by Hewan Taye Beyene under my guidance. The work contained in
this thesis has not been previously submitted for a degree at any other higher educational
institutions to the best of my knowledge and belief.
Student_________________________________________________________
Hewan Taye Beyene Date
Advisor ________________________________________________________
Fasil Taddese (PhD) Date
1534

iii
Mekelle University
Ethiopian Institute of Technology-Mekelle
School of Mechanical and Industrial Engineering
Master’s program final thesis acceptance approval form
1. Student Name: Hewan Taye Beyene
Thesis Topic:Minimization of defects in sewing section at Garment and Textile Factories
through DMAIC methodology of Six Sigma, (Case: MAA Garment and Textile Factory)
2. This is to certify that Hewan Taye Beyene has incorporated all the comments forwarded to
her by the external and internal examiners during the thesis defense held on
_________________,2016
2.1. Student _________________________ __________________________
Hewan Taye Beyene Date
2.2. Advisor________________________ _________________________
Fasil Taddese (PhD) Date
2.3. Internal Examiner __________________ ________________________
Date
2.4. External Examiner ___________________ ______________________
Date
2.5. School head ______________________ _______________________
Date
1535

iv
Acknowledgement
First of all, I would like to thank God of our ancestors, for what he has done to me I, definitely
believe that nothing could have been done without his guidance and help. Thank be to HollyVirgin
Mary, and His saints too, for helping me during those hard times.
I am very grateful to my advisor Dr.FasilTaddeses Assistant professor in school of Mechanical and
Industrial Engineering for exposing me to such kind of explorative and investigative thesis work. His
encouragement, excellent guidance, creative suggestions and critical comments have greatly
contributed to the thesis work. The readers who know Dr. Fasil will see his influence in this thesis.
All I can say is: Boss, thank you. I hope this rewarding co-operation will continue for many more
years. I would also like to thank my co-advisor Ato Assefa Misgun for such great knowledge and
experience in the quality domain and have given me very valuable advice along the way and I would
like also to express my deepest thanks to Mr.Goitom for the guidance he shared me and
Mr.AbrehaHaile for his continuous support and EyerusalemAdefris. I am having highly gratitude and
reverence to Professor (Dr.) Ashish Thakur, Mechanical Engineering Department for his continuous
encouragement and support during plentiful searching of research material and helped me in different
way in formatting and editing part setting my goals to enrich award master degree. I shall remain
grateful to Dr. Ashish supporting me throughout this M.Sc course duration.
During my study, I have been give due attention, special cooperation and continual support by our
coordinator Ing.Aregawi. I would also like to thank MAA Garment and Textile factory employees
and management for their cooperativeness; I sincerely appreciate their supports and participations in
carrying out this study. Many thanks goes toAtoAlula Hadush Quality manager ,AtoGebru
w/georgies garment production manager, AtoFiseha W/Gebriel assistant quality mgr, w/roAlem
G/medhin quality assurance department manager , Fiseha Belay HR and administration manager ,
KibromKiros (DGM),Daniel Gezae system and kaizen manager.
Lastly,The most important people for me in my everyday life, and therefore also important as
inspiration and support when I do my research, are my personal friends and most importantly, my
family deserves credit. The support and guidance I receive from them helps me to choose the best
path to take when the road leads in many different directions. Thank you. Finally special thanks go to
my father Ato Taye Beyene and my brother Engidawerek Taye for their encouragement, continual
support and love during my study.
1536

v
Abstract
The study explores the use of DMAIC methodology ofsix sigma to minimize the defect rate in
MAA Garment.This is a systematic approach towards defects minimization through five phases
of DMAIC methodology named Define, Measure, Analyze, Improve and Control which focuses
on reduction/elimination of four basic types of defects such as stain, skip stitch, broken stitch,
and slip out in sewing section of MAA-garment. Different six sigma tools were used in different
phases.The define phase rolls out the tools such as SIPOC which clearly show the process map
that includes suppliers, inputs, outs, customers and based on this the entire quality is judged. The
measure phase process capability was done.In analyzingphase, continuous assessment of sewing
process, with intense brainstorming sessions for the cause and effect diagram.Root causes of
those defects were detected by cause and effect analysis and Pareto analysis was done to identify
the major types of defects, the vital root causes that impact the defects by using regression,
ANOVA, why-why. The improve phase concentrates on optimizing the vital root causes which
impact the defects with their factors and levels, results of experimentation had been analyzed by
using Analysis of Variance (ANOVA) and regression for studying the variation and where does
the variation came from? In control phase, control chart has been used to control the variation
within acceptable levels in the process.Finally some potential solutions are suggested to
overcome those causes. The result of the proposed solutions of the defect level in the section has
been reduced as well as the result found to be very significant because the average amount of
broken stitch before optimization where 3.51852 and has been reduced to 1.51852 after
optimization. At the same time the prediction value of skip stitch also reduced from 14.8125 to
3.8125 as the result from the prediction shows.
.
Keywords: Garment, Defects, Rework, DMAIC, ANOVA, SIPOC DPMO, Cause and Effect
diagram, Pareto analysis
1537

vi
List of contents Declaration .................................................................................................................................................... ii
Acknowledgement ....................................................................................................................................... iv
Abstract ......................................................................................................................................................... v
List of Figures…………………………………………………………………………………...viii
List of Table………………………………………………………………………………………ix
List of Acronyms ........................................................................................................................................ x
CHAPTER ONE ........................................................................................................................................... 1
INTRODUCTION ......................................................................................................................................
1.1. Background of the case company ................................................................................................. 1
1.2. Back ground of the study .............................................................................................................. 1
1.3. Problem statement ......................................................................................................................... 3
1.4. Objective ....................................................................................................................................... 4
1.4.1. General objective ...................................................................................................................... 4
1.4.2. Specific objective ...................................................................................................................... 4
1.5. Significance of the study ............................................................................................................... 4
1.6. Scope of the study ......................................................................................................................... 4
1.7. Methodology………………………………………………………………………….....4
1.7.1 Data Collection………………………………………………………………………......4
1.7.2 Data Analysis and Interpretation…………………………………………………………5
CHAPTER TWO .......................................................................................................................................... 6
LITERATURE REVIEW ......................................................................................................................... 6
2.1. Meaning of defect ......................................................................................................................... 6
2.2. Quality Improvement Tools .......................................................................................................... 6
2.3. Six sigma implementation ............................................................................................................. 7
2.4. Sewing defects .............................................................................................................................. 8
2.5. Alternative measurement method for determining the sigma level in six sigma .......................... 8
2.6. Process optimization methodology ............................................................................................. 10
2.7. Six sigma DMAIC methodology ................................................................................................ 10
2.8. Different six sigma tools ............................................................................................................. 12
CHAPTER THREE .................................................................................................................................... 14
1538

vii
RESULTS AND DISCUSSION ............................................................................................................. 14
3.1. Introduction………………………………………………………………………………..14
3.2. Define Phase: .............................................................................................................................. 15
3.3. Measure Phase ............................................................................................................................ 17
3.4. Cost of Rework ........................................................................................................................... 19
3.5. Analyze Phase ............................................................................................................................. 20
3.6. Six month data causes for skip stitch .......................................................................................... 22
3.7. Why- Why analysis ..................................................................................................................... 27
3.8. Six month data causes for broken stitch……………………………………………………………33
3.9. Improve Phase ............................................................................................................................. 31
3.10. Control Phase .............................................................................................................................. 35
CHAPTER FIVE ........................................................................................................................................ 38
CONCLUSION AND RECOMMENDATION ...................................................................................... 38
4.1. Conclusion .................................................................................................................................. 38
4.2. Recommendation ........................................................................................................................ 39
REFERENCE .............................................................................................................................................. 40
1539
viii
List of Figures
Figure: 1.1. Sewing section………………………………………………………………..3
Figure: 1.2. Billy T-shirt……………………………………………………………........18
Figure: 1.3. Most common sewing defects……………………………………………...20
Figure: 1.4. Binomial process capability reports for rework…………………………….22
Figure: 1.5. Pareto chart for sewing defects …………………………………………….25
Figure: 1.6. Defect amount and cumulative defect percentage of skip stitch……………26
Figure: 1.7. Cause and effect diagram for skip stich…………………………………….27
Figure: 1.8. Skip stitch…………………………………………………………………...28
Figure: 1.9.Stain………………………………………………………………………….28
Figure: 2.0. Defect amount and cumulative defect percentage of stain………………….29
Figure: 2.1. Cause and effect diagram for stain………………………………………….30
Figure: 2.2.Broken stich………………………………………………………………….30
Figure: 2.3. S/N ratio for skip stitch…………………………………………………….37
Figure: 2.4. S/N ratio for broken…………………………………………………………38
Figure: 2.5. P-chart of rework for May month…………………………………………...42
Figure: 2.6. Final P chart of rework for May month……………………………………..43
1540

ix
List of Tables
Table: 1.1. Current manpower in MAA-garment and textile factory .......................................... 2
Table: 1.2. Defect rate of different sections…………………………………………………….3
Table: 1.3. Rating criteria……………………………………………………………………...17
Table: 1. 4.SIPOC……………………………………………………………………………..19
Table: 1.5. Process capability for six months………………………………………………….21
Table: 1.6. Binomial Capability study for June month………………………………………..22
Table: 1.7. Overall defects types percentage…………………………………………………..25
Table: 1.8. Defect location indicator…………………………………………………………..32
Table: 1.9. Selected parameters or skip stitch…………………………………………………34
Table: 2.0. Analysis of Variance for skip stitch……………………………………………….35
Table: 2.1. Broken selected parameters………………………………………………………36
Table: 2.2. Response table for signal to noise ratios…………………………………………36
Table: 2.3. Analysis of variance for broken…………………………………………………..37
Table: 2.4. Prediction value for broken before and after optimization……………………….39
Table: 2.5. Suggested solutions for all major defects with corresponding causes…………….41
Table: 2.6. May month defect rate…………………………………………………………….42
1541

x
List of Acronyms
SIPOC Supplier Input Process Output Customer
ANOVA Analysis of variance
DPMO Defect Parts per Million Opportunities
RCA Root Cause Analysis
VOC Voice of customer
S/N Signal Noise to Ratios
DOE Design of Experiment
USD United States Dollar
FGD Focus Group Discussion
DMAIC Define-Measure-Analyze-Improve-Control
DD Dull-Dull
DS Dull-Sharp
SD Sharp-Dull
SOP Standard Operating Procedure
WIP Work in Process
CP Process Capability
RPM Revolution per Minute
GSM Grams Square Meter
DF Degree of freedom
SMV Standard Minute Value
1542

1
CHAPTER ONE: INTRODUCTION
1.1. Back ground of the study
If a defect is detected in the final inspection, the cost of the production process for a defective
garment is totally wasted as the product cannot be exported. Sometimes the defective pieces can
be made exportable with alterations, but it costs more money, as utilizes more resources to
produce the same items. In MAA garment factory, defects usually come from sewing section.
Among those, the sewing section is the leading and most difficult in operation. In this context,
the sewing section defects such as stain, broken, skip stich slip out, wavy stiches etc., hamper the
total quality of the factory, because of these defects the rework rate reaches greater than 5%based
on the company daily rework rate and this rework rate is caused due to various reasons such as
poor quality of the thread, flagging of fabrics, needle deflection and others. Therefore the
required quality standards will not be fulfilling the VOC and to avoid this rework rate, it is
necessary to avoid defects by prioritizing them. Different authors propose several quality
strategies among them DMAIC is one and the reason DMAIC is selected itis a structured tool in
defining phase the problem can be easily defined in measuring phase.Current performance of the
company can be measured in analyze phase where the root causes of problems will be analyzed in
improve phase improving the process for eliminating the root cause and the final phase is the control
phase in order for sustaining the gains controlling the process is crucial and under all phases there are
various tools and techniques for minimizing the rework rate.
1.2. Background of the case company
Kebire Enterprises is a privately owned company established and registered in April 2001 under
the commercial laws of the Federal Democratic of Ethiopia. MAA Garment Factory began its
operation in June 2004 in the northern part of Ethiopia, Tigray, Mekelle.It is spearheaded by
dynamic local staffs combined with expatriate from Turkey, Pakistan & Philippines.The
production set-up is fully equipped with state of the art machineries & equipment from
renownedEmbedding methods and solutions to the production system has allowedblending in
more quickly in the international market. It intends to incorporate and upgrade the infrastructure,
maintaining the concern with its environmental and social responsibilities.MAA Garment and
1543

2
Textile factory is one of the modern private owned factories in Ethiopia. It is established in 2004
and equipped with state of art production facilities producing textile (yarn, griege and finished
dyed fabric), woven and knitted garments (T-shirt, Polo-shirt, trouser, Bed-sheet, Pack-out,
Pants, Pajamas etc). The vision of the company is to become an exemplary organization in local
as well as international textiles and apparel markets. To achieve this vision, the company has set
strategies on the area of developing a strong customer relationship, engaging in a continuous
product development, implementing methods for reduction in cost of production without
affecting quality of products, providing continuous personnel training and capacity building.
MAA has suppliers from domestic and international. Its market is targeted to USA & European
countries, with customers like H & M, Kik, Takko, Hahns and the like. There are domestic
(Almiko, Amibara, etc.) and overseas (Hantsman, Thies, Juki, etc.) suppliers of the raw material
used in the process in the company. The daily production is 10,000 garment pieces and to
produce these articles it has to pass the following processes production units: cutting-embroidery
and printing-sewing-packing department is the responsible entity to control and monitor the
quality status of each material, process and products of the company. To do its task properly, the
department has deployed the following qualified personnel in the sewing section.
Table: 1.1. Current manpower in MAA-garment and textile factory
S/N Department Current manpower
1 Spinning & knitting 266
2 Dyeing & finishing 78
3 Garment production 709
4 Quality assurance 131
5 Technical/maintenance 139
6 Planning & cost controller 61
7 Marketing & merchandising 11
8 Supply & procurement 7
9 Finance department 15
10 HRD department 59
11 Sample& design 10
12 System & kaizen 2
13 Deputy general manager 1
14 General manager 1
Total 1488
1544

3
Table 1.1 shows clearly the number of employees working in the MAA garment and textile
factory.
1.3. Problem statement
There are four sections under Garment wing of the company such as cutting, sewing, finishing,
embroidery and printing. Among those sections the sewing section highly suffering from rework
due to the existence of different defects.
Figure: 1.1.Sewing Section
Figure 1.1 shows the selected department from the rest sections.
Table: 1.2.Defect rate of different sections
S/N Section Rework Rate
1 Cutting section 0.5%
2 Sewing section 6%
3 embroidery and printing 2%
4 Finishing section 3.5%
However, this amount of rework rate 36489 is there the last 7 months from the section’s recorded
data. Thetrial to distinguish between the most influential and least influential defects is not found
yet. Their respective root causes are not clearly figured out. This in turn paves the way for the
problem to remain inherent and make difficulty in solving them. Therefore, this work
1545

4
incorporates the process of finding the leading defect with their particular root cause and in turn
solving them accordingly.
1.4. Objective
1.4.1. General objective
The general objective is to investigate thedefects in the sewing section and propose a
solution how to tackle itminimize the defects in sewing section by using DMAIC
Approach
1.4.2. Specific objective
To Identify and measure the frequency of occurrence of the critical defects;
To assess the contributing factors for each defect types using RCA;
To maintain improvements using appropriate control charts.
1.5. Significance of the study
The primary merits of the study goes to the Ethiopian textile industries. The researcher
believes that Ethiopian textile companies will be motivated to implement results of the
study. To be competent in the local and international markets, enhancecustomer satisfaction,
increase the productivity of the companies, and avoid poor utilization ofresources.
1.6. Scope of the study
The scope of this thesis work is to focus on MAA Garment and Textile Factoryfor minimizing
the defects in the sewing section so that overall activities of the companies affecting the rework
at the same time the quality of the product are undercontrol. The purpose of methodology will
only serve as a starting point.Thus it requires regular updating based upon the current situation
on the ground.
1.7. Methodology
1.7.1 Data Collection
In this research different methods of data collection were employed for gathering primary and
secondary data.Primary data was collected through, Check sheet were prepared for knowing the
causes of skip and stain .Questioner and direct observation for 20 days were used for identifying
1546

5
the causes for the critical defects by using 4M.Informal interview for the brainstorming session
for specifying the root causes of each defect. Secondary data was obtained from various sources
such as, journals, articles, books, internet sources, reviewing manual and reports as
references.Secondary data were used Six month production data for forming the pareto.
1.7.2 Data analysis and interpretations
The collected data were analyzed using Microsoft excel and Mini tab software for forming
ANOVA, Pareto diagram, Binomial process capability ,Control chart and DOE .SIPOC Cause
and effect diagram Why-why Population size30 participant's-25 answered because they were
related persons with the work. The Sampling size 240 Billy T-shirt were checked for the
location of the defects
1547

6
CHAPTER TWO: LITERATURE REVIEW
2.1. Fabric defects
Most of the products in the garment industry have a short lifespan. With new products, new
defects arise. Even after knowing the products in & out, it is very hard to keep defects from
finding their way to the finished product (Ojasvi,2015).According toKalayu(2014)the four
critical fabric defects (Needle line, Hole, Yarn variation and Lycra jump) are achieved and these
fabric defects need to be corrected to minimize the rejection rate by 80%. The output of the
research indicated that the existing 7.87% rejection rate can be reduced to 1.574% which resulted
in the net difference of 6.296.
2.2. Quality Improvement Tools
A large number of studies have determined major quality improvement tools According to
(Mazedul,2012;Maroof, 2012; Mashiur, 2012) their paper discusses the quality and productivity
improvement in a manufacturing enterprise through practical study. This paper deals with an
application of methodology in an industry which provides a framework to identify quantify and
eliminate sources of variation in an operational process, to optimize the operation variables,
improve and sustain process performance with well-executed control plans. The application of
the paper also improves the process performance of the critical operational process, leading to
better utilization of resources, decreases variations & maintains consistent quality of the process
output. The outcome of this observation reflected that an industry may gain higher productivity
and profitability with improved quality product by minimizing reworks activities. It also
minimizes cost and improves internal throughput time. Finally a general overview over this
development is given. Matthew(2008) stated that strong understanding of Six Sigma
management philosophy, concepts, and practices and to apply this knowledge to creating a Six
Sigma academic course or training program. This was done through three main methods:
preliminary research and data collection, the creation of a design model for Six Sigma academic
course/training program establishment, and the creation of a Six Sigma academic course/training
program syllabus.Jeannine(2005)also focuses on the joint use of two popular improvement
initiatives: Capability Maturity Model Integration (CMMI®) and Six Sigma. This report contains
a brief summary of each initiative and then outlines the connections between frameworks
commonly used in Six Sigma and the CMMI process areas (Steven, 2007)has make
1548

7
recommendations that would improve the performance of six sigma within the ford motor
company.Peter( 2007) stated that a longitudinal case study describing the evolution of ‘Six
Sigma Management’ at Siemens in Sweden. The success of the programmer was to a large
degree built on previous failures, confirming Juran’s old saying ‘Failure is a gold mine’. From
the case study, success factors for implementing Six Sigma at Siemens are identified and
compared to those given in the literature. The evaluation of sewing threads consumption in jeans
and classic pants clothingsix different input parameters are chosen and used for investigation. To
objectively evaluate their contributions, a Taguchi design analysis was applied. Jaouachi,
(2012),the research methodology concentrates the implementation of DMAIC and cause and
effective diagram are used for eliminating garment defectives and 5S Concepts for reducing
defects and motion (Vijayakumar, 2016).
2.3. Six sigma implementation
Many of the SMEs are not aware of six sigma and many do not have the resources to implement
six sigma projects. It was also found that lean sigma was not generally popular among SMEs.
Management involvement and participation, linking six sigma to customers and linking six
sigma to business strategies are the most critical factors for the successful deployment of six
sigma in SMEs according to(Christian, 2005).
Quality Improvement can play a vital role for improving productivity as well as economic
development for the country. They have used the tools of TQM such as Flow chart, Check sheet,
and Histogram, Pareto Chart, Scatter Diagram, Control Chart, Cause and effect diagram in a
garment industry of Bangladesh and it is found that a significant amount of rework and scrap per
style, per month has minimized by applying this method (Rahman, 2011).Senaviratna (2013)
Conducted to improve efficiency of the sewing process in apparel industry through the reduction
of defectives. This study is focused in three major defect types; run off stitches, unbalanced
shape and wavy seams. They have developed generalized linear models for each defect type to
find the significant factors affecting on the proportion of occurrence of defects the pros of
implementing the quality tools; review the issues related to the implementation of such tools and
finally understand the role of such tools in the framework of TQM. Kairong(2010), Detail
investigation on quality improvement of a garment factory by applying Pareto Analysis and
Cause-Effect Diagram,the aim of the study was to minimize defects that will reduce rework and
rejection rate (Tanvir, 2013).
1549

8
2.4. Sewing defects
According toDengzler( 2008) The SPC methods such as check list, pareto analysis, cause-effect
diagram and P control chart were used. The frequencies of sewing defects in the operations at the
sewing department are determined by check list. The operations which have highest sewing
defect rates and the effects of these operations to the defect rate are examined by using the pareto
analysis. The reasons of the defects are analyzed with the cause-effect diagram for the operation
which has the highest sewing defect rate. The rate of defect in the sewing department is
examined statistically by p control chart whether it’s under control or not. Sampling based
statistical quality control system is proposed in finishing section to eliminate 100% inspection by
sampling based inspection(Mohibul, 2013) .according to (Varsha, 2014) provide an easy
introduction of 7 QC tools and to improve the quality level of manufacturing processes by
applying it. An application of methodology in an industry which provides a framework to
identify quantify and eliminate sources of variation in an operational process, to optimize the
operation variables, improve and sustain processperformance with well-executed control
plans.Mazedul(2013), empirical evidence on Six Sigma implementation in service industries in
Singapore According to (Chakrabarty, 2010), Six Sigma case study analysis involving three
service organizations of Singapore the organizations are a local hospital, a construction and
related engineering service, and a consultancy service. Pantano(2006) designed to test the
application of a novel Six Sigma deployment programme specifically for SMEs. Introduction a
new notion, which we call six sigma supply chains to describe and quantify supply chains with
sharp and timely deliveries, and develop an innovative approach for designing such
networks.Garg(2004).Both total productive maintenance (TPM) and Six Sigma are key business
process strategies, which are employed by companies to enhance their manufacturing
performance. Therefore, will be to develop and implement an integrated Six Sigma Maintenance
(SSM) model for manufacturing industry (Andrew, 2008).
2.5. Alternative measurement method for determining the sigma level in six sigma
Tractable results are obtained by using statistical congruent method and concept of Taguchi
methodSong(2008) the authors analyze the principles and results of lean production and compare
the lean production philosophy with the six sigma quality process and the principles of total
quality management (TQM). At the end of the paper, it is discussed how to build the necessary
company culture for having success with these principles/management philosophies.Jens(2000)
1550

9
how organizational culture influences the implementation of different practices incorporated in
the recent Six Sigma approach as well as those associated with traditional total quality
management (TQM). (Xingxing, 2010).Pukhraj( 2011)the objective of this research is to
investigate the application and benefits of lean six sigma in the recycling industry Using XP with
Six Sigma can provide means of analyzing XP data and systematically improve process
performance. In order to prove our point, we map Six Sigma tools to activities involved at each
phase of XP and show that Six Sigma technique can be used with XP to measureand improve the
performance of XP process.Sajid(2010) identifying what criteria are considered for selecting six
sigma projects and how six sigma projects are selected in organizations in the
UK.Ricardo(2000).Application of Six Sigma usingDMAIC viz. Define, Measure, Analyze,
Improve & Control model for the defect reduction at amanufacturing concern based at Surat,
Gujarat, India(Tushar, 2010) thegrounded theory approach and the scant literature available to
propose an initial definition and theory of Six Sigma (Roger, 2007) Six sigma has enabled the
company to eliminate a wide range of long standing process variation problems. The importance
of a structured process and the importance of data collection, only when working with the facts,
rather than on “gut feeling” do the real causes become clear and solutions
effective.Andrew(2006), Six Sigma effective handling of deep rooted, 2006 the fundamentals of
Six Sigma and its use in education.Six Sigma is a set of methodologies used by businesses to
achieve extremely low failure rates in any process. (Varsha, 2006). Jones(2007)to offer a practice
guide for where to apply six sigma process improvement methodology to the corporate real
estate function (Jaruek, 2010)Six sigma programs are raging through corporations worldwide,
with some corporations citing savings in the $US billions resulting from six sigma
implementation(Bengt, 2001).Jiju(2008) the fundamental and critical differences between two of
the most powerful philosophies of modern quality management(Satya, 2009) develop an
effective implementation model which consists of six steps. The first step is to perform strategic
analysis driven by the market and the customer. A software tool that could be used at any stage
of lean implementation, including facilities with no existing.Philip(2004),sixsigma can be
implemented in manufacturing SMEs. Moreover, the motivation for adopting Six Sigma by
Australian manufacturing SMEs. It was found that a normative isomorphic change mechanism,
under institutional theory, is exclusively involved in the adoption of the Six Sigma methodology.
This study also discusses various critical success factors and impeding factors involved in the
1551

10
implementation of quality improvement initiatives, in general, as well as of Six Sigma, in
particular.Khawaja(2012), In this study an emphasis is given on human angle in context with
Indian Culture and work environment because experienceshows that for implementation of any
new initiatives in organizations, the successof implementation depends on soft skills of people of
organizations.Thomas(2011) provides an overview of success rates, success factors and existing
concepts and tools for business strategy implementation.
2.6. Process optimization methodology
Six Sigma and examines its possible applications to business strategy implementation through an
analysis of existing literature sources and expert interviews.Hongbo(2010) reviews some related
literatures to describe methodology, implementation and future researches. The present paper
summaries four issues within the sub-category of the initial Six Sigma concepts: basic concept,
DMAIC, DFSS and deployment (Henry,2011).This study adopted the Six Sigma methodology to
try to identify what factors/parameters are influencing the occurrence of web-flutter during paper
production processes at SCA Edet mill. It also highlighted other root causes for the unwanted
folding in the final product of tissue paper at the paper mill.Jiju(2009) present the results from an
empirical investigation of Six Sigma status in the Indian industry and underrepresented region of
investigation on Implementation. How both the traditional quality management and Six Sigma
literatures and identified three new practices that are critical for implementing Six Sigma’s
concept and method in an organization. These practices are referred to as: Six Sigma role
structure, Six Sigma structured improvement procedure, and Six Sigma focus on
metrics.Xingxing(2008), how the principles of total quality management can actually be used to
design and operate processes to assure supply chain security,the central theme of the quality
movement––that higher quality can be attained at lower cost by proper management and
operational design––is also applicable in supply chain security. By using the right Management
approach, new technology, and re-engineered operational processes, we can also achieve higher
supply chain security at lower cost.
2.7. Six sigma DMAIC methodology
According to Hau(2003), The quality and productivity improvement in a manufacturing
enterprise through a case study, the paper deals with an application of Six Sigma DMAIC
(Define–Measure-Analyze-Improve-Control) methodology in an industry which provides a
1552

11
framework to identify, quantify and eliminate sources of variation in an operational process in
question, to optimize the operation variables, improve and sustain performance viz. process yield
with well-executed control plans. Six Sigma improves the process performance (process yield) of
the critical operational process, leading to better utilization of resources, decreases variations &
maintains consistent quality of the process output.Tushar(2008)A few researchers
(Duraković,2012).(Benjamin(2012) conducted research on analyzing the manufacturing process
and considers the possibilities of using DMAIC methodology to the textile cutting process. The
points of discussion in this paper are the possibilities of selecting and implementing Six Sigma
projects as well as algorithms of continuous improvement after implementation of the projects.
Taking into account all characteristics of the production process, a systematic continuous
improvement process solution is designed as a first step in implementing Six Sigma quality
system. From the standpoint of feasibility and cost-effectiveness, the selected model is applicable
for small and medium-sized organizations, and is considered as a solution that will provide
positive results investigating the interactive phenomena of KM concepts with the Six Sigma
deployment process, and how KM concepts including updated elements could be integrated in a
structured, systematic and effective way with Six Sigma framework for project deployment. At
first different existing approaches related to Six Sigma and KM integration are analyzed in order
to identify the leveraging effects. Then a structured integrated conceptual model; namely
DMAIC- KM model has been proposed. (Mohan,2014).Chintan(2015) the author review the
previous published papers, and give the where the industry have to work, this paper mainly
focusing on the general overview of publication and the case industry, this paper gives which
methodology adopted by industry, discuss on the various tools and techniques used by the
company and how much benefits got by the company by using DMAIC methodology.(Thouraya,
2015)proposes a method for analyzing a process in a garment manufacturer. By applying
DMAIC Six Sigma methodology, Alsico’s factories in Tunisia expect to identify key root causes
of delivery delays. The project report outlines a method for defining, measuring, analyzing,
improving, and controlling the delivery metric, and illustrates this process with an example
(Varun, 2015).The main purpose of the work is to reduce the defects, which will also minimize
the rejection and reworks rate .This work provides the guidelines for the betterment and control
of wastes in garment industry for shorts and pants by using six sigma methodologies. The
DMAIC methodology is introduced and implemented in the Karle garment industry, by that
1553

12
major factor for the defects are determined, along with that the corrective actions are performed,
and the defective % is compared before and after the implementation of corrective actions, where
the sigma level has been increased from 2.8 to 3.38(Uddin, 2014) explores the use of DMAIC
methodology of six sigma to minimize the defects rate in a selected garment factory. This is a
systematic approach towards defects minimization through five phases of DMAIC methodology
named define, measure, analyze, improve and control.
2.8. Different six sigma tools
Quality improvement study applied at a yarn manufacturing company based on six sigma
methodologies. More specifically, the DMAIC (Define, Measure, Analyze, Improve, and
Control) project management-methodology & various tools are utilized to streamline processes
& enhance productivity.Neha(2013) implementation of the Six Sigma Methodology in an apparel
plant, that has provided an increase of 13% in the manufacturing productivity of trousers by
minimization of sewing thread breakage. This accomplishment has been obtained by reducing
the thread breakages in the process of the sewing trademark label to the rear center of a trouser
(Kürşat, 2014).Enamul(2013) study and evaluate processes of the case organization, to find out
current sigma level and finally to improve existing sigma level through productivity
improvement current sigma level has been calculated and given suggestions for improvement.
This has been done by using six-sigma DMAIC cycle. (Muhammad, 2010) is to give the
understanding of different problems in different departments in quality point of view and how to
reduce the problems by taking preventive action against any defects produce during process. For
quality of product and enhance the customer satisfaction, it is decided to more work on final end
product in the form of DMAIC tool to reduce the defects rate of product before going to
customer. Neha(2013) this article presents a quality improvement study applied at a yarn
manufacturing company based on six sigma methodologies. More specifically, the DMAIC
(Define, Measure, Analyze, Improve, and Control) project management-methodology & various
tools are utilized to streamline processes & enhance productivity how to minimize the defects
rate by introducing and implementing the DMAIC Methodology of Six Sigma into a sewing
section of a selected garment factory. This is a systematic approach towards defects
minimization through five phases of DMAIC methodology named Define, Measure, Analyze,
Improve and Control.Syed(2014), prosperity of implementing Six Sigma at Company XYZ on a
1554

13
particular product line by capitalizing on the DMAIC. According to Justin(2009), there are
various related problems which affect the processes and quality of the final product during paper
production. This study adopted the Six Sigma DMAIC methodology to try to identify what
factors/parameters are influencing the occurrence of web-flutter during paper production
processes at SCA Edit mill. It also highlighted other root causes for the unwanted folding in the
final product of tissue paper at the paper mill.Henery(2011) this research work develops an
application guideline for the assessment, improvement, and control of wastes in garment industry
using six-sigma improvement methodology. Chethan(2002) production defects in textile
manufacturing. The DMAIC approach has been followed to solve an underlying problem of
reducing process variation and the associated high defect rate. This paper explores how to use a
systematic and disciplined approach to move towards the goal of Six Sigma quality level. The
application of the Six Sigma methodology resulted in a reduction in the overall quality level
from 7.7 % to 2%. (Mohammed,2012).Srinivasan(2014)This case study narrowly focuses on
reduction/elimination of two imperative responses in spray painting process producing shock
absorbers, namely peel off and blisters using the Six Sigma Define-Measure-Analyze-Improve-
Control (DMAIC) approach that highly impacts quality at customer end.
1555

14
CHAPTER THREE: RESULTS AND DISCUSSION
3.1 Introduction
The aim of the work is to minimize the defect percentage by using DMAIC approach of Six
Sigma methodology. Based on brain storming session first out of the 3 main competitive factors
by using different criteria from the selected problems the most crucial problem has been
prioritized for doing the research.
Table: 1.3.Ratingcriteria
Rating 0-5 0-low 5-high
Selected problems Low productivity Quality
problem
Delivery date
Existing situation 4 5 3
Time condition 5 5 4
State of
Urgency
5 5 5
Cost 4 5 4
Work bottleneck 4 5 4
Complexity 4 4 4
Implementation time 4 4.5 3
Total 30 33.5 27
Rate 2 1 3
From Table 1.3, the three main competitive factors such as low productivity, quality problem and
delivery date with their corresponding selected criteria’s like Existing situation, time condition,
state of urgency, cost, work bottleneck, complexity ,implementation time the result from the
rating shows the quality problem is the leading having 33.5 rate and the second one is the low
productivity with a rate of 30 and the last becomes late delivery date with 27 rating factor so
from these the quality problem pays a significant role in the factory and doing the research in this
competitive factor can change. Since the aim of the work is to reduce the rework rate in sewing
garment production.
1556
15
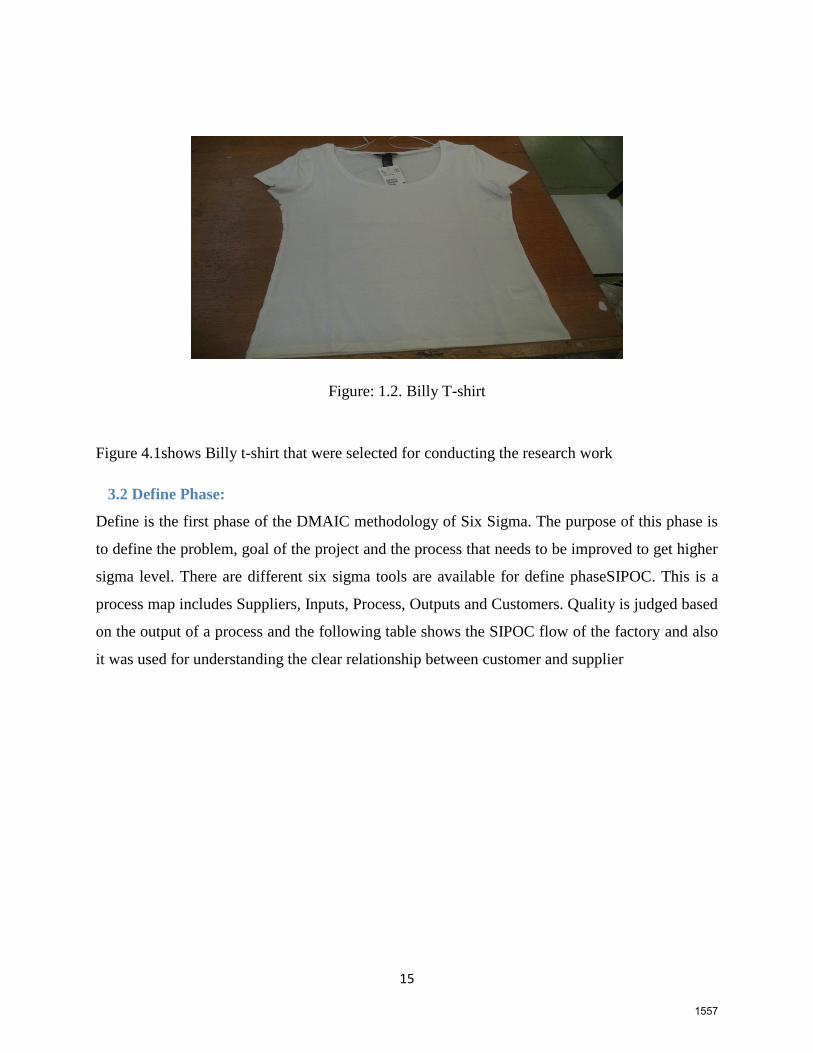
Figure: 1.2. Billy T-shirt
Figure 4.1shows Billy t-shirt that were selected for conducting the research work
3.2 Define Phase:
Define is the first phase of the DMAIC methodology of Six Sigma. The purpose of this phase is
to define the problem, goal of the project and the process that needs to be improved to get higher
sigma level. There are different six sigma tools are available for define phaseSIPOC. This is a
process map includes Suppliers, Inputs, Process, Outputs and Customers. Quality is judged based
on the output of a process and the following table shows the SIPOC flow of the factory and also
it was used for understanding the clear relationship between customer and supplier
1557

16
Table: 1.4.Suppliers-input-process-output-customer (SIPOC)
Suppliers Inputs Processes Outputs Customer
Juki middle east
Fabric inspection T-shirts Edwards
Schmetz Spreading Polo Walls/walls
mart
Onursha Cutting Single jersy Obermeyer,
Mayer&cie Ticketing/bundling Bob Hanhs
Groz-Beckert kg Fusion Billy Usa
Shimasieki Cutting audit Kicki Germany
Monforts Unstitched cloth Preparatory Rooney MOC
Corino Machinery Quality check R-strech DVH apparels
Thies Thread Assembly V-strech China
Inplan Needles Quality check Basic T-
shirt Belk stores
Endeco Button Buttoning Polo T-shirt Siggi
Mahlo Zipper Thread trimming Brief Klowt Africa
Muratec Label Ironing Pajama George
Luwa air engineering
ag Man Quality check
Classical
shirt H&M
Ssse Materials Folding Classical
trouser Local
Ugolini
Pinning Casual
trouser Nj
Riter Packaging and
shipment Work wear
Blanks and
primark
Military
uniform TESCO
Caps TAKKO
Jeans shirt KIKS
Jeans
trouser HANHS
BERNE
CID
RESOURCES
Table: 1.4. shows different suppliers may provide different raw material one may be a raw
material with high quality and the other might be poor raw material and this may result high
effect on the final product for this reason the SIPOC will help us in differentiating the variability
place whether it comes from supplier, input, process, output or customer and also it will be very
easy for taking corrective action.
1558

17
Figure: 1.3.Most common sewing defects
Figure1.3.Shows that the most common defects that are encountered in the sewing section the
arrow indicates the location of the defects that are seen in Billy T-shirt
3.3 Measure Phase
At this phase, percentage of defects, capability study existing DPMO (Defect per Million
Opportunity) and Sigma Level of the selected factory were calculated the frequency of defects of
the inspected shirts was also calculated and recorded in the Table 1.5.
Table: 1.5.Process capability for six months records
Checked pieces Conforming pieces
263,101 239,710
239,487 221,947
171,949 161,364
328,892 311,165
291,936 273,352
275,269 260,256
8160 7754
1,578,794 1,475,548
Pleated
1559
18
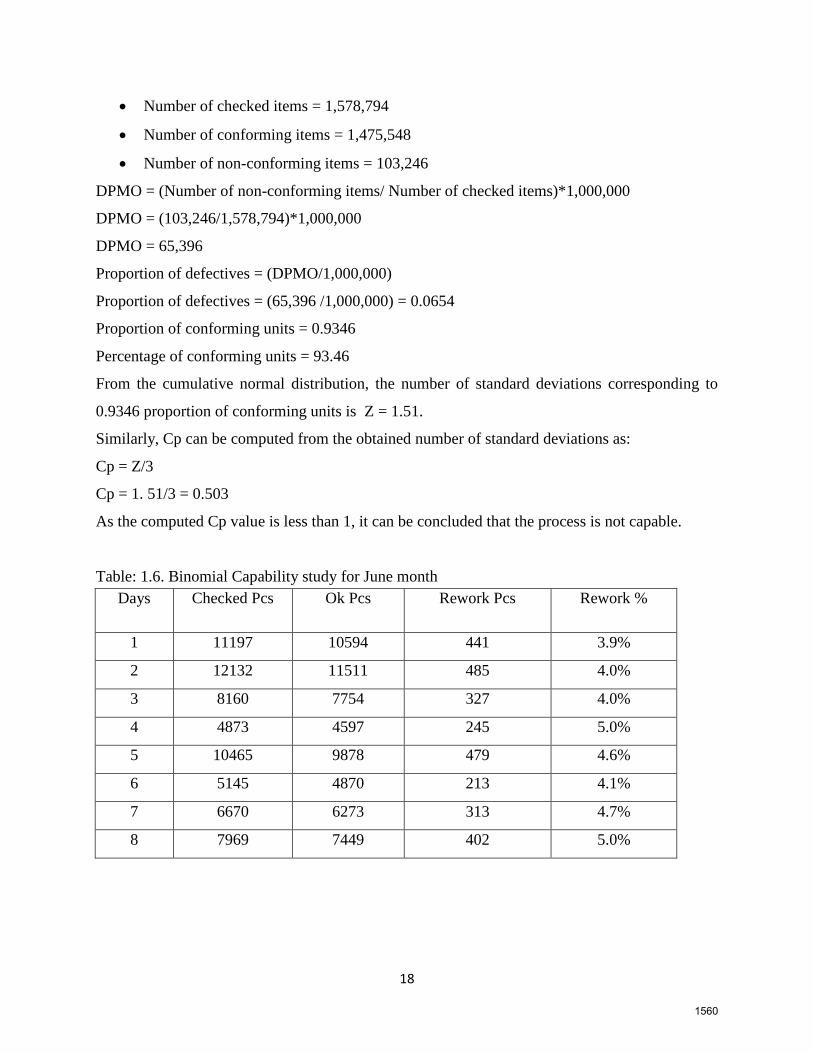
Number of checked items = 1,578,794
Number of conforming items = 1,475,548
Number of non-conforming items = 103,246
DPMO = (Number of non-conforming items/ Number of checked items)*1,000,000
DPMO = (103,246/1,578,794)*1,000,000
DPMO = 65,396
Proportion of defectives = (DPMO/1,000,000)
Proportion of defectives = (65,396 /1,000,000) = 0.0654
Proportion of conforming units = 0.9346
Percentage of conforming units = 93.46
From the cumulative normal distribution, the number of standard deviations corresponding to
0.9346 proportion of conforming units is Z = 1.51.
Similarly, Cp can be computed from the obtained number of standard deviations as:
Cp = Z/3
Cp = 1. 51/3 = 0.503
As the computed Cp value is less than 1, it can be concluded that the process is not capable.
Table: 1.6. Binomial Capability study for June month
Days Checked Pcs Ok Pcs Rework Pcs Rework %
1 11197 10594 441 3.9%
2 12132 11511 485 4.0%
3 8160 7754 327 4.0%
4 4873 4597 245 5.0%
5 10465 9878 479 4.6%
6 5145 4870 213 4.1%
7 6670 6273 313 4.7%
8 7969 7449 402 5.0%
1560
19
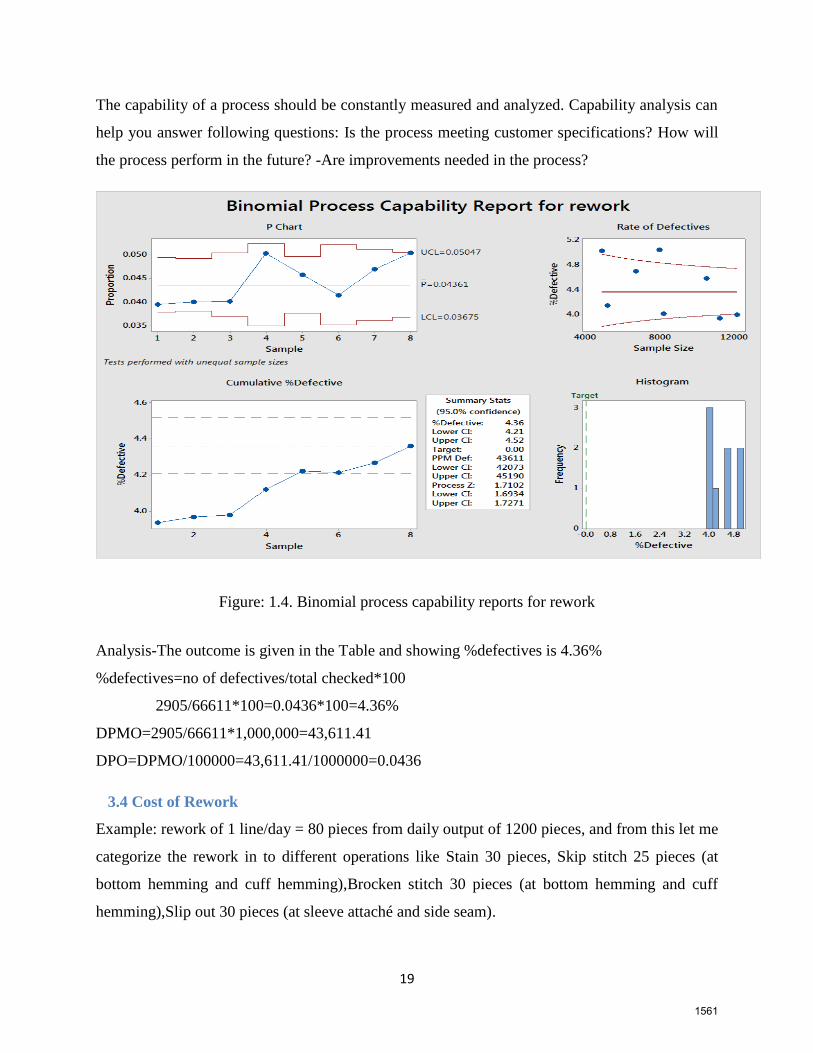
The capability of a process should be constantly measured and analyzed. Capability analysis can
help you answer following questions: Is the process meeting customer specifications? How will
the process perform in the future? -Are improvements needed in the process?
Figure: 1.4. Binomial process capability reports for rework
Analysis-The outcome is given in the Table and showing %defectives is 4.36%
%defectives=no of defectives/total checked*100
2905/66611*100=0.0436*100=4.36%
DPMO=2905/66611*1,000,000=43,611.41
DPO=DPMO/100000=43,611.41/1000000=0.0436
3.4 Cost of Rework
Example: rework of 1 line/day = 80 pieces from daily output of 1200 pieces, and from this let me
categorize the rework in to different operations like Stain 30 pieces, Skip stitch 25 pieces (at
bottom hemming and cuff hemming),Brocken stitch 30 pieces (at bottom hemming and cuff
hemming),Slip out 30 pieces (at sleeve attaché and side seam).
1561

20
The estimated time per operation is for instance as per above, in garment industries reworking a
piece of garment takes 3 times more than making first time a good pieces. Having these 80
pieces of daily rework at one operation is equivalent to stitching 240 pieces at exactly that
specific operation. So let’s take an average operation time is 25 seconds. Total time on rework is
25 sec*240pieces= 6000 seconds=1.67 hours
Garment minute value is 0.03 USD/ minute
=1.67*60*.03
=3.006 USD will be the cost of one operation/ garment. If we have to rework may be critical
operation per garment we have to see SMV of a product i.e. for Billie 6.25 minutes
6.25*80*.03usd/minute =15 USD equivalent to 315 birr to make a rework of 80 pieces.
3.5 Analyze phase
The goal of the analyze phase is to go through the data to find out the root causes of the problems
and seek improvement opportunities. At the measure phase 3 major types of defects were
identified and the target of this phase is to find out all the potential causes of those defects.
Fourproblems solving six sigma tools were used at analyze phase and these were: cause effect
diagram, Regression, pareto, why-why. In order to identify the potential causes of the defects and
their respective solutions in the Brainstorming session large number of creative & useful ideas
were generated and it was arranged at the selected session and carried out by the presence of the
following members that is shown the appendix.
1562
21
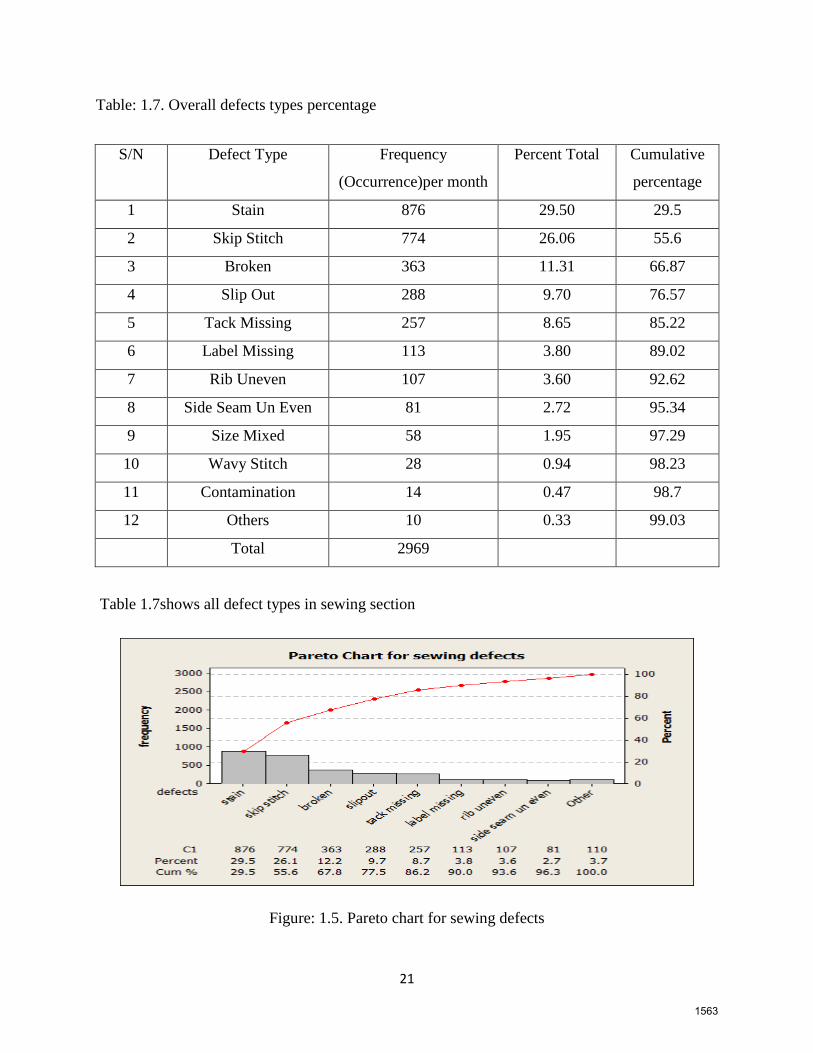
Table: 1.7. Overall defects types percentage
S/N Defect Type Frequency
(Occurrence)per month
Percent Total Cumulative
percentage
1 Stain 876 29.50 29.5
2 Skip Stitch 774 26.06 55.6
3 Broken 363 11.31 66.87
4 Slip Out 288 9.70 76.57
5 Tack Missing 257 8.65 85.22
6 Label Missing 113 3.80 89.02
7 Rib Uneven 107 3.60 92.62
8 Side Seam Un Even 81 2.72 95.34
9 Size Mixed 58 1.95 97.29
10 Wavy Stitch 28 0.94 98.23
11 Contamination 14 0.47 98.7
12 Others 10 0.33 99.03
Total 2969
Table 1.7shows all defect types in sewing section
Figure: 1.5. Pareto chart for sewing defects
1563

22
The chart visually shows which defects are more significant. By using Pareto Chart major
sewing defects were identified. i. stain , ii. Skip stitch, iii. Broken Among all, only these 3
defects are responsible for 68% of total defects percentage. Observations from the pareto
Analysis stain is the most frequent defect type with 29.5%. Among other defect types
contribution of skip stitch is 26.1% and broken stitch is 12.2%. So these three defect types are
responsible for 66.87% of the total sewing defects
3.6. Six month data causes for skip stitch
The Pareto Analysis performed based on six months combined defect data from the sewing
section. From this analysis we can identify the “Vital few” areas where maximum defects
occur. The analysis is shown in figure represents defect amount and defect percentage and
cumulative defect percentage.
Figure: 1.6. Defect amount and cumulative defect percentage of skip stitch
Figure.1.6. shows all defects that where coming from the material, method, machine, and man
are listed and prioritized and the pareto indicates that the quality of the thread plays significant
role for the cause of skip stitch the second one looper to needle timing the cause that comes from
the machine also has a great effect for the skip stitch and also the others can contribute with the
1564

23
same case with the quality of the thread and looper to needle timing the only difference is in their
frequency of their occurrence. for Top machine Defect looper to needle timing is the most
frequent machine defect, needle bent or dull the second most frequent machine defect, skill
problem, long time needle usage are the vital few machine defect that play great role for the
occurrence of skip stitch further Pareto Analysis for the material defects can be seen on those top
defect positions to identify the vital few defect types that are responsible for maximum amount
of defect.
Figure: 1.7.Cause and effect diagram for skip stitch
Figure1.7. shows the cause and effect diagram for skip stitch and then the potential causes
wereidentified by online inspections and root cause analysis of defectsfrom Pareto Analysis top
three defect types such as Skipped Stitch, Broken Stitch and stain have been identified. By our
own observation and data provided by supervisors from five production lines through
questionnaires the causes for each specific defect types have been identified. Then these causes
are ordered in a hierarchy according to the frequency of the feedback provided by QC
supervisors.out of all causes the critical root causes were Absence of scheduled maintenance,
1565

24
Lack of autonomous maintenance, Spare part shortage, Lack of skill, Machineadjustment, Low
thread quality, Long time needle usage. The critical causes of each acute defect were sorted out
and the respective remedies are set as it is discussed here below.
Figure: 1.8. Skip stitch
Irregular stitching along the seam and it appears due to improper handling of cut pieces or
machine usage. Improper threading, ,Machine dirty, Wrong setting ,Long time needle usage
Needle bent or dull ,Incorrect needle insertion ,Skill problem ,Poor quality needle, Poor quality
thread ,High speed ,Handling problem.
Figure: 1.9. Stain
1566

25
Figure: 2.0. Defect amount and cumulative defect percentage of stain
From Figure 2.0 same conclusion can be drawn for the stain.After Pareto Analysis the result it is
found that top defect types are identified and also they are responsible for maximum amount of
defects. Staincan be classified into four the first one is oil stain it is caused when the oil falls on
to the fabric by various reasons and the appropriate remedies can be after oiling ensuring the oil
does not falls on the fabric as well as proper oiling .Rust stain can be caused If any rust on the
machine parts is there and to avoid this the operator should check if any rust on the machine
parts are there and then clean it as well as proper maintenance. the third type of stain dirt stain
and can be caused when there is too much dirt on the knitting floor that is flying to and the
appropriate solution would be cleaning all types of dust continuously and the final type of stain is
handling stain and it can be caused by poor handling of the fabric and can be avoided by properly
handling and there are also other several causes such as Packing, Numbering stain, Uncleaned
machine ,Lack of sop ,Transportation problem ,Standardization the detail causes and remedies
are stated in the fish bone diagram.
1567

26
Figure: 2.1. Cause and effect diagram for stain
Out of all stain causes the most critical one from all are lack of stop, poor handling, lack of skill
absence of scheduled maintenance and lack of training.
Figure: 2.2. Broken stitch
The third type of defect is broken stitches and caused when the thread run out during sewing and
broken stitch during following of the finished product, high speed, operatorcarelessness, and low
quality of thread. Low quality scissor and to minimize thread breakage using a better quality
1568

27
sewing thread .make sure sewing machines are properly maintained and adjusted for the fabric
and observe sewing operations for correct material handling techniques. Suggested Solutions,
this study tried to suggest some potential solutions to minimize the causes of defects through
Brainstorming, direct observation and literature review. The solutions with their corresponding
causes are given in table.
Table: 1.8.Defect location indicator
Defect category Defect location
Stain Back and front
Skip stitch Bottom and cuff hem
Broken Bottom and cuff hem
From Table 1.8, the place where the most critical defects found to beis at the back and front and
in the bottom and cuff hem.
3.7. Why- Why analysis
An important component of root cause analysis is a thorough understanding of “what happened.
The information-gathering process includes interviews with staffs and workers who were directly
and indirectly involved with the physical environment where the event and other relevant
processes took place, along with observation of usual work processes. This information is
synthesized into a “final understanding”, which is further used by the team to begin the “why”
portion of the analysis in a logical sequence to find a logical solution to the problem. It is one of
the many brainstorming methodology of asking “why” five times repeatedly to help in
identifying the root cause of a problem. If a problem is repeatedly questioned, each time an
alternative solution comes out which is linked to the root cause. However, asking why may be
continued till getting an agreeable solution. Five is an arbitrary figure. The theory is that after
asking “why” five times one is likely to arrive at the root cause also it wasemployed in
developing critical thinking in identifyingthe root causes of the problem & recognizing
therelationship among them. The process of askingquestions was continued till the root cause of
theproblem has been identified. (i) Why operators increase the speed? Forfinishing the work fast.
(ii) Whythey want to finish the work fast?Due to not known the effect and dissatisfaction by the
set speed. (iii) Why dissatisfaction by the setspeeds and not knowing the effect? Due tolack in
1569

28
awareness of problemand over confidence. Why over confidence and awareness problem due to
lack of continuous training and high experience (iv) why lack ofcontinuous training and high
experience? Because they are only trained when they are hired. (v) Why they are trained when
they ae hired? Due to there is high cost for training. Detail can be seen in theappendix
Table: 1.9.Parametersfor skip stitch
Parameter level A:needle time B :speed C:needle
insertion
direction
D : thread
quality
Level 1 3 3000 correct Polyester
Level 2 6 3500 incorrect Cotton
Level 3 9 4000
Level 4 12 4500
According to the Table1.9, It is clear that the needle time, speed, needle insertion and the thread
quality are factors that affect the occurrence of skip stitch. Each factors has levels to start from
the needle time in the first level it indicates changing the needle.
General Regression Analysis: Mean Skip stitch versus needle insertion, thread quality,
Regression Equation
Needle insertionThread quality
CorrectlyPolyesterMean Sk.St.= -7.3125 + 0.141667 Needle time + 0.00391667 Speeds
Correctly Cotton Mean Sk.St. = -2.1875 + 0.141667 Needle time +0.00391667 Speeds
Incorrectly PolyesterMeanSk.St. = -7.35417 + 0.141667 Needle time +0.00391667 Speeds
Incorrect Cotton Mean Sk.St.= -2.22917 + 0.141667 Needle time +0.00391667 Speed
1570

29
The controlled factors under consideration are both categorical and continuous type,the
categorical ones are needle insertion direction and thread quality whereas the needle time and its
corresponding speed are of type continuous because the latter two parameters can assume any
numerical values in their operating ranges. The above regression equation shows that when
correct -polyester becomes the combined subject, the skip stich will increase by a factor of
0.141667 and 0.00391667 for an increase of needle time and speed respectively by one unit.
Similar conclusions can be drawn in this manner for correct-cotton, incorrect –polyester and
incorrect-cotton shown above.
Table: 2.0.Analysis of Variance for skip stitch
Source Seq SS Adj SS Adj MS F P
Needle time 3.613 3.613 3.613 0.24288 0.631824
Speed 76.701 76.701 76.701 5.15688 0.044239
Needle insertion 0.007 0.007 0.007 0.00047 0.983148
Thread quality 105.063 105.063 105.063 7.06368 0.022276
Error 163.610 163.610 14.874
Total 348.993
For the ANOVA Analysis according Montgomery for a factor to be considered significant the
computed p values needs to be less than or equal to the selected alpha value. For the selected
alpha value of 0.05 and it is selected because it fits with the data the factors speed and thread
quality plays a significant role for the occurrence of skip stich as they assumed a value of
0.044239 and 0.022276 respectively.
3.8.Six month data causes for brokenstitch
Table: 2.1.Broken selected parameters
Parameter level A:scissor edge B :thread type C :fabric specification
Upper Lower
Level 1 Dull Dull Thin 2
Level 2 Dull Sharp Normal 3
Level 3 Sharp Dull Thick 4
1571

30
For broken stitch the relevant factors are scissor edge, thread type and fabric
specificationtheirrespective levels for scissor edge is dull on both edge, upper edge dull and
lower edge sharp while lower edge is dull and upper edge sharp. And for thread type the
appropriate levels are thin normal and thick while the levels of fabric specification can assume
continuous values of 2, 3 and 4 for level s 1, 2 and 3.
Table: 2.2. Response table for signal to noise ratios
Level Scissor edge Thread type Fabric Speci.
1 -13.58 -14.47 -12.88
2 -13.81 -10.06 -15.26
3 -11.47 -14.34 -10.72
Delta 2.34 4.41 4.54
Rank 3 2 1
General Regression Analysis: mean broken versus fabric speci, scissor edge
Regression Equation
Scissor thread
Edge type
dd thin mean broken = 7.42593 - 0.611111 fabric specification
dd normal mean broken = 5.31481 - 0.611111 fabric specification
dd thick mean broken = 7.09259 - 0.611111 fabric specification
ds thin mean broken = 7.42593 - 0.611111 fabric specification
ds normal mean broken = 5.31481 - 0.611111 fabric specification
ds thick mean broken = 7.09259 - 0.611111 fabric specification
sd thin mean broken = 6.64815 - 0.611111 fabric specification
sd normal mean broken = 4.53704 - 0.611111 fabric specification
sd thick mean broken = 6.31481 - 0.611111 fabric specification
1572

31
Table: 2.3.Analysis of variance for broken
Source DF Seq SS Adj SS Adj MS F P
Regression 5 11.1790 11.1790 2.23580 0.82008 0.606344
Scissor edge 2 1.2099 1.2099 0.60494 0.22189 0.813074
Thread type 2 7.7284 7.7284 3.86420 1.41736 0.368682
Fabric specification 1 2.2407 2.2407 2.24074 0.82189 0.431462
Error 3 8.1790 8.1790 2.72634
Total 8 19.3580
3.9. Improve Phase
The purpose of the DMAIC Improve phase is to discover a solution to the problem that the task
aims to address. This involves brainstorming potential solutions, selection of solutions to test and
evaluating the results of the implemented solutions.
12963
-18.0
-19.5
-21.0
-22.5
4500400035003000
IncorrectCorrect
-18.0
-19.5
-21.0
-22.5
CottonPolyster
Needle time
Mea
n of
SN
rati
os
Speed
Needle insertion Thread quality
Main Effects Plot for SN ratiosData Means
Signal-to-noise: Smaller is better
Figure: 2.3. S/N ratio for skip stitch
Often a pilot implementation is conducted prior to a full-scale rollout of improvements. Since a
defect is an unwanted feature in a product or absence of a desired feature or a feature existing in
distorted or wrong way. There are two main types of defects happened in the garment industry.
These are none sewing defect and sewing defect.
1573

32
The selected parameter setting for attaining smaller amount of skipped stiches, higher S/N ratio
in this case, is A1B1C1D1. This indicates that the needle time should be at its lowest level which
is three days, stitching speed at 3000 rpm, correct needle insertion and polyester thread type.
The predicted amount of skipped stiches after the process parameters are set at their optimum
levels has been determined to validate if the optimal process parameter setting brings about a
significant reduction in the level of skipped stiches. The following table shows a comparison of
the average skipped stiches before and after the optimal setting.
Figure: 2.4. S/N ratio for broken
The selected parameter setting for attaining smaller amount of broken stiches, higher S/N ratio in
this case, is A3B2C3. This indicates that the scissor edge should be both sharp and dull. , thread
type must be normal and trimming based on the specification which is 4mm. The predicted
amount of broken stiches after the process parameters are set at their optimum levels has been
determined to validate if the optimal process parameter setting brings about a significant
reduction in the level of broken stitch. The following table shows a comparison of the average
broken stitches before and after the optimal setting.
1574

33
Table: 2.4. Prediction value for broken before and after optimization
S/N Average amount of broken
stiches before optimization
(A1B3C1)
Average amount of broken
stiches before optimization
(A2B3C1)
Average amount of broken
stiches after optimization
(A3B2C3)
1 5.29630 3.51852 1.51852
S/N Average amount of skipped
stiches before optimization
(A3B2C1D2)
Average amount of skipped
stiches before optimization
(A3B2C2D2)
Average amount of skipped
stiches after optimization
(A1B1C1D1)
1 14.8542 14.8125 3.8125
Table: 2.5. Suggested solutions for all major defects with corresponding causes
Areas Causes Suggested solutions
Human Inadequate training and
operator inefficiency
Technical Training for the operators
Carelessness Improve supervision.
Machine Machine is threaded
incorrectly
or excessive thread tension
Rethread machine and maintain
proper thread tensions. Make sure the
thread
passes through the tension discs
Dull or bent sewing machine
Needle and knife.
Replace the needle and knife with a
new one.
Excessive pressure on the
presser foot
Lessen the pressure on the presser
foot. Slacken both tensions.
Machine dirty Autonomous maintenance
Wrong setting Proper setting
Long time needle usage Changing the needle frequently
Numbering stain Proper numbering
1575

34
Uncleaned machine Cleaning the machine frequently
Method Incorrect size of the needle
and
thread for operation
The size of the needle and thread
should be synchronized. Ensure both
the
needle and bottom (looper) positions
are rightly fed by the correct thread
type and size.
Incorrectly inserted needle Insert the needle on correct position.
Check that the bobbin is wound
correctly and no loose threads or
loops sticking out.
Comparatively long stitch for
the type of fabric in work.
Shorten the stitch length by means of
the stitch regulator, especially when
Sewing fine fabrics.
Poor handling Proper handling fabric
Lack of SOP Structured SOP
Lack of Transportation Use appropriate Transportation
Standardization Every work should be standardized
Packing Use Proper packaging material
Material Poor quality thread Use good quality thread.
Poor quality needle Use high quality needles from
another brand. Needle should have
high heat
Resistance capacity.
Poor quality scissor Good quality scissor
From the Table 2.5.there can be many reasons behind the problems that arise while sewing and
knowing the cause of these problems and a solution for each particular cause is essential. These
problems can be minimized by avoiding errors during handing of materials and machines by
following the right working methods.
1576
35
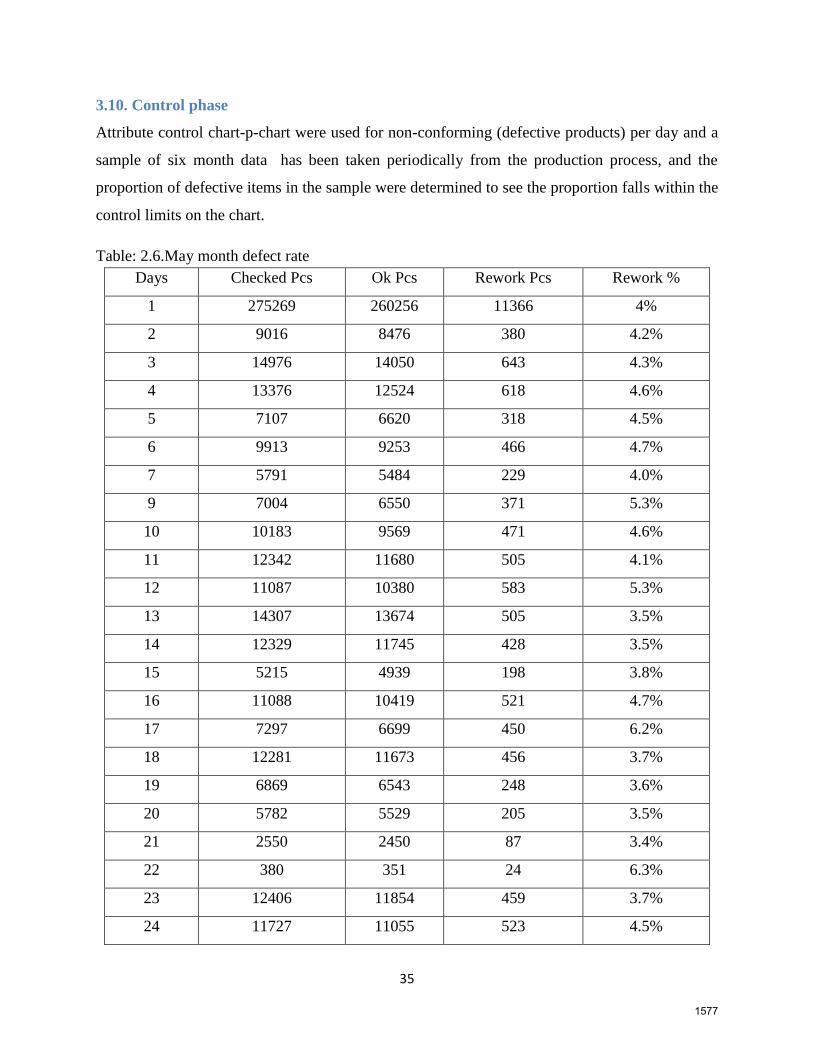
3.10. Control phase
Attribute control chart-p-chart were used for non-conforming (defective products) per day and a
sample of six month data has been taken periodically from the production process, and the
proportion of defective items in the sample were determined to see the proportion falls within the
control limits on the chart.
Table: 2.6.May month defect rate
Days Checked Pcs Ok Pcs Rework Pcs Rework %
1 275269 260256 11366 4%
2 9016 8476 380 4.2%
3 14976 14050 643 4.3%
4 13376 12524 618 4.6%
5 7107 6620 318 4.5%
6 9913 9253 466 4.7%
7 5791 5484 229 4.0%
9 7004 6550 371 5.3%
10 10183 9569 471 4.6%
11 12342 11680 505 4.1%
12 11087 10380 583 5.3%
13 14307 13674 505 3.5%
14 12329 11745 428 3.5%
15 5215 4939 198 3.8%
16 11088 10419 521 4.7%
17 7297 6699 450 6.2%
18 12281 11673 456 3.7%
19 6869 6543 248 3.6%
20 5782 5529 205 3.5%
21 2550 2450 87 3.4%
22 380 351 24 6.3%
23 12406 11854 459 3.7%
24 11727 11055 523 4.5%
1577

36
25 13144 12491 515 3.9%
26 14863 14262 452 3.0%
27 9161 8698 339 3.7%
29 1691 1581 41 2.4%
30 11236 10529 568 5.1%
31 12327 11707 441 3.6%
Figure: 2.5. P chart of rework for May month
From the Figure 2.5, the process were below the upper and lower limit, the process is out of
control and the cause has been detected and there were assignable cause of variation that affects
the process. Since the process being below the lower limit is good because since reducing the
rework rate is our target. process were above the upper control limit during day 10, 18,20,26,28
thethese shows that something was wrong and from the inspection results of the company shows
that in day 10 a defective cotton raw material were purchased from new supplier, in day 18
different operatorsproblems, in day 20 un proper needle adjustment problem by the operator, in
day 26 poor handling problem and in day 28 there were a spare part shortage. Already the nature
of the assignable cause of variation has been identified and after this counter measures should be
taken for making the process stable.
1578

37
Figure: 2.6.Final P chart of rework for May month
From Figure 2.6 assuming that Actions were taken so that the processes remain in control after
the improvement plans have been implemented, out of control state has been quickly detected &
associated special causes were determined so that actions can be taken to correct the problem
before non-conformities are produced.Now the process is in control and the company needs to
sustain the stable process and also control plans should be prepared for specifying
processmonitoring & corrective actions. To summarize in define phase the problem were
identified, in measure phase the current performance were measured, inanalyze phase the root
cause of the problem were analyzed, in improve phase to eliminate the root causes the process
were improved finally in control phase the process to sustain the gains controlling the process
due to this reason the methodology so effective.
1579

38
CHAPTER FOUR: CONCLUSION AND RECOMMENDATION
4.1 Conclusion
Most difficult thing in manufacturing is producing right quality product for all the time. Still it is
important to work on improving product quality to satisfy customers, to control production cost
and to save energy. Improving product quality is generally not difficult, but requires deliberate
and ongoing attention, and it requires the commitment of every individual within the
manufacturing company, from the person who cleans the floors to the most senior manager.
Quality of product plays an important role in any industry. Manufacturing the quality product is
mandatory to sustain in this global competitive market If a consumer does not like the quality of
the product then the chances of sales become very less. Today, clothes play a very important role
in the society. They help in creating an impression and define the human being in some aspects.
Therefore it is very important to see to it that garments are made of high quality. In garment and
textile factory, sewing is one of the major processes. It plays an important role in maintaining the
quality of clothes. Hence it is important that all defects have to be avoided during sewing any. In
this paper, various faults or defects that can take place during sewing along with different
remedies or methods to solve these defects are discussed. Minimizing defect is very important
for ensuring the quality of products. From the Pareto Chart total three defects were identified
those were responsible for more than 80% of total defects occurring in the sewing section of the
MAA garment factory for the item of T-shirt. After finding the major defects, brainstorming tool
was used to identify the probable causes and then potential root causes were identified by online
inspections and root cause analysis. This method is very effective to the minimization of defects.
As the minimization of defects is a continuous process further implementation of this
methodology will help the company enjoying more reduction on defect rate and improvement on
productivity. This study is concentrated only the sewing section, an integrated study of other
sections of the factory such as knitting, dying, cutting and finishing can be more effective on the
minimization of defects. Many garment factories in Ethiopia are not conscious about the Six
Sigma concepts and this study will start a positive surge across the garment industries and make
them more competitive.
1580

39
4.2 Recommendation
This research has been carried out on sewing section of MAA-garment factory to improve its
level of quality status. Currently analyzed data indicates that the rework rate is very high when it
is evaluated with the company‘s quality target. To improve its quality of product the study
focused in reducing the rework rate. The factory need to address the critical causes of defects to
improve its quality based on the following recommendations. The factory need to focus on the
critical identified fabric defects and their respective causes to improve its quality and Preventing
defects will be given more priority than correcting defects and it is recommend that Standard
Operating Procedure (SOP) is used as it is the best prevention tool to minimize defect rate while
operating production and it also keeps machine healthy and also the factory need to monitor
machine operation, machine cleaning, Replacement of dull or bent sewing machine needles and
knives with new ones , Insert the needles to the correct position, Provide adequate training to the
Operator, Improve supervision, Change faulty machine parts, Develop a proper quality
management system in order to quick detection and solution of the quality problems. Always use
good quality thread and finally The Company needs to assist further research in the section
periodically to reduce the rework rate continuously.
1581

40
REFERENCE
1. A. Chakrabarty , K. C. Tan(2007)”A Survey On Six Sigma Implementation in Singapore
Service Industries” Proceedings Of The IEEE
2. A. Chakrabarty And K.C. Tan(2008),” Case Study Analysis Of Six Sigma In Singapore
Service Organizations” Department Of Industrial And Systems Engineering, National
University Of Singapore, Singapore
3. Andrew Thomas, Richard Barton, Paul Byard (2008)”Methodology And Theory
Developing A Six Sigma Maintenance Model” Journal Of Quality In Maintenance
Engineering Vol. 14 No. 3, Pp. 262-27
4. Andrew Lee-Mortimer(2006)”Six Sigma: Effective Handling Of Deep Rooted Quality
Problems” Assembly Automation 26/3 200– 204 Emerald Group Publishing Limited
5. B. Jaouachi1, F. Khedher , F. Mili (2012)” Consumption Of The Sewing Thread Of Jean
Pant Using Taguchi Design Analysis” Autex Research Journal, Vol. 12, No 4,
6. Bengt Klefsjoè, HaêKanWiklund And Rick L. Edgeman(2001)”Six Sigma Seen As A
Methodology For Total Quality Management” Measuring business excellence 5,1, pp
31-35
7. Benjamin Durakovic , HazimBašić(2012)”Textile Cutting Process Optimization Model
Based On Six Sigma Methodology Ina Medium-Sized Company” Journal Of Trends In
The Development Of Machinery And Associated Technology Vol. 16, No. 1, Issn 2303-
4009 , P.P. 107-110
8. ClaudiuVasileKifor(2014)” Engineer Lal Mohan Baral” Chintan C. Rao , Darshak A.
Desai(2015)”A Review Of Six Sigma Implementation In Small Scale
Foundry”International Journal Of Innovative Research In Science, Engineering And
Technology Vol. 4, Issue 12
9. D. Garg, Y. Narahari, , N. Viswanadham(2004) “Design Of Six Sigma Supply Chains”
Ieee Transactions On Automation Science And Engineering, Vol. 1, No. 1
10. Dr. JaruekChookittikul, Dr. WajeeChookittikul(2008)” Six Sigma Quality Improvement
Methods For Creating And Revising Computer Science Degree Programs And
Curricula” 38thasee/Ieee Frontiers In Education Conference F2e-15
1582

41
11. G. Vijayakumar, Y. Robinson(2016) “Impacts Of Lean Tools And Techniques For
Improving Manufacturing Performance In Garment Manufacturing Scenario: A Case
Study” International Journal Of Advanced Engineering Technology E-Issn 0976-3945
12. Hau L. Lee , Seungjin Whang(2005)”Higher Supply chain Security with Lower Cost:
Lessons From Total Quality Management” Int. J. Production Economics 96 , 289–300
13. Hongbo Wang(2008)”A Review Of Six Sigma Approach: Methodology, Implementation
And Future Research, Ieee
14. Henry Savage Olugbenga, Robbie Hällås (2011) “Investigation On Defects Occurring In
Pap production Process A Six Sigma Black Belt Project At ScaEdet Mill”
15. InciDengizlerKayaalp ,Ege U. Emel Akın MeslekYuksekokulu(2009)” Decreasing
Sewing Defects By Using Statistical Process Control Methods In The Apparel Factory”
TekstilVeKonfeksiyon
16. Jeannine Siviy ,M. Lynn Penn ,Erin Harper(2015)”, Relationships Between Cmmi and
Six Sigma”Department of Technology Management and Economics ,Chalmers
University Of Technology,Sweden
17. Jiju Antony Maneesh Kumar Christian N. Madu, (2005),"Six Sigma In Small and
18. Medium-Sized Uk Manufacturing Enterprises", International Journal Of Quality &
Reliability Management, Vol. 22 Iss 8 Pp. 860- 874
19. Jens J. Dahlgaard, Su MiDahlgaard-Park (2006)”Lean Production, Six Sigma quality,
Tqm And Company Culture” The TQM Magazine Vol. 18 No. 3, Pp. 263-281 Emerald
Group Publishing Limited
20. Jiju Antony (2008)”Reflective Practice Six Sigma Vs Tqm: Some Perspectives From
Leading Practitioners And Academics” International Journal Of Productivity And
Performance Management vol. 58 No. 3, Pp. 274-279 ,Emerald Group Publishing
Limited 1741-040
21. Jiju Antony, Darshak A. Desai (2009),”Assessing The Status Of Six Sigma
Implementation In The Indian Industr Y Results From An Exploratory Empirical Study
Management Research News Vol. 32 No. 5, Pp. 413-423 Emerald Group Publishing
Limited 0140-9174
22. Justin E. Faust(2009)”Increase Efficiency Using Six Sigma Methodologies”
1583

42
23. K.Srinivasan, S.Muthu , N.K.Prasad , G.Satheesh(2014)”Reduction Of Paint Line
Defects In Shock Absorber Through Six Sigma DMAIC Phases” 12th Global Congress
On Manufacturing And Management, Gcmm ,Procedia Engineering 97 ( 2014 ) 1755
– 1764
24. Khawaja KhurramKhurshid(2012)” Implementation Of Six Sigma In Australian
Manufacturing Small And Medium Enterprises”,University of the Punjab
25. KalayuGebru (2014)”, Identifying Defect Causes Of Weft Greige Knitted Fabric: The
Case Of Maa-Garment and Textiles Factory”Ethiopian Institute of Technology, Mekelle
26. Md. EnamulKabir, S. M. Mahbubul Islam Boby, Mostafa Lutfi(2013)” Productivity
Improvement By Using Six-Sigma” International Journal Of Engineering And
Technology Volume 3 No. 12,
27. Muhammad Adnan Abid ,Atiq Ur Rehman ,Muhammad Anees (2010),” How To
Minimize The Defects Rate Of Final Product In Textile Plant By The Implementation Of
Dmaic Tool Of Six Sigma”
28. Md. Mazedul Islam ,Adnan Maroof Khan ,Md.Mashiur Rahman Khan( 2014)”
Minimization Of Reworks In Quality And Productivity Improvement In The Apparel
Industry” International Journal Of Engineering And Applied Sciences Vol. 1, No.4 Issn
2305-8269
29. Md. Mohibul Islam And Md. Mosharraf Hossain(2013), Statistical Quality Control
Approach Intypical Garments Manufacturing Industry In Bangladesh: A Case Study”
Proceedings Of 9th Asian Business Research Conference 20-21 , Biam Foundation,
Dhaka, Bangladesh
30. M. M.Rahman And A.K.M. Masud(2011) “Quality Improvement In garments Industry
Through TQM Approach” Proceedings Of The International Conference On Mechanical
Engineering (Icme2011) 18-20 , Dhaka, Banglades
31. Matthew Mccarthy , Eric Zuendoki(2008) ,“Six Sigma Analysis: The Design and
Implementation",Worcester Polytechnic Institute
32. ,Md.Mazedul Islam ,Adnan Maroof Khan, Md.Mashiur Rahman Khan
(2013)”Minimization Of Reworks In Quality And Productivity Improvement In The
1584

43
Apparel Industry” International Journal Of Engineering and Applied Sciences ,Vol. 1,
No.4
33. N.A.M.R.Senaviratna(2013),”Application Of Generalized Linear Model To The
Minimization Of Defectives In Sewing Process Of Apparel Industry” International
Journal Of Scientific And Research Publications, Volume 3, Issue 7, Issn 2250-3153
34. Neha Gupta, Dr. P. K. Bharti(2013)” Implementation Of Six Sigma For Minimizing The
Defects Rate At A Yarn Manufacturing Company” International Journal Of Engineering
Research And Applications vol. 3, Issue 2, Pp.1000-101
35. Neha Gupta,(2013)” An Application Of DMAIC Methodology For Increasing The Yarn
Quality In Textile Industry” Iosr Journal Of Mechanical And Civil Engineering (Iosr-
Jmce) Volume 6, Issue 1, Pp 50-65
36. Ojasvi Srivastava (2015) ,“Garment Defect Analysis, Remedies, and Introduction To
Machine Learning At A Retail Chain” ,National Institute of Fashion Technology,
Mumbai
37. Peter Cronemyr (2007)”, Six Sigma Management Action Research With Some
Contributions To Theories and Method” Göteborg, Sweden , Chalmers University Of
Technology Thesis
38. PukhrajBarnala(2011)” Optimization Of Operating Parameters Of A Material Recovery
Facility Using Lean Six Sigma Techniques”
39. Philip Stephen(2004),” Application Of Dmaic To Integrate Lean Manufacturing And Six
Sigma”,faculty of the Virginia Polytechnic Institute and State University,Blacksburg,
Virginia
40. RajeshkumarPatil(2010)” A Study Of Six Sigma Implementation Process At An
Organization In Mumbai To Develop A Model For Effective Implementation Of The Six
Sigma In Indian Organizations For Achieving Process Excellence,
41. Roger G. Schroedera, Kevin Linderman , Charles Liedtke, Adrian S. Chooc,(2008)” Six
Sigma: Definition And Underlying Theory “Journal Of Operations Management 26 536–
554
42. Ricardo Banuelas, Charles Tennant, Ian Tuersley And Shao Tang(2006)”Selection Of Six
Sigma Projects In The Uk” The TqmMagazinevol. 18 No. 5, Pp. 514-527 ,Emerald
Group Publishing Limited 0954-478x
1585

44
43. Song-Kyoo Kim(2008)”Enhanced Evaluation Method Of Sigma Level In Six-Sigma
Activities” Mobile Communication Division, Samsung Electronics, 94-1 Imsudong,
Gumi, Gyeongbook 730-350, South Korea
44. Sajid Ibrahim Hashmi And JongmoonBaik(2008)”Quantitative Process Improvement In
Xp Using Six Sigma Tools” Seventh IeeeAcis International Conference On Computer
And Information Science
45. Satya S. Chakravorty (2009)”Six Sigma Programs: An Implementation Model” Int. J.
Production Economics 119 , 1 –16
46. Syed Misbah Uddin*, Rashidul Hasan, Md. Saddam Hosen (2014)”Defects Minimization
Through DMAIC Methodology Of Six Sigma” International Conference On Mechanical,
Industrial And Energy Engineering , Khulna, BANGLADESH
47. Tushar N. Desai And Dr. R. L. Shrivastava(2008),”Six Sigma – A New Direction To
Quality And Productivity Management”, Proceedings Of The World Congress On
Engineering And Computer Science Wcecs San Francisco, USA
48. ThourayaHamdi , FatenFayala, Mohamed Jmali , Nizar Saidane(2015)”Reducing
Delays In Delivering Garments Using Dmaic-Six Sigma Methodolog” International
Journal Of Emerging Engineering Research And Technology Volume 3, Issue 9,
September , Pp 25-40
49. Thomas D. Mccarty And Sally A. Fisher (2007)”Six Sigma: It Is Not What You Think”
Journal Of Corporate Real Estate Vol. 9 No. 3, Pp. 187-196 Emerald Group Publishing
Limited 1463-001
50. Thomas Pirker-Krassnig ,Paul Tj James ,Vincent Ribière (2008)” Applying Six Sigma To
Business Strategy Implementation”
51. Tushar N. Desai, Dr. R. L. ShrivastavaB(2008)”Six Sigma: A Break Through Business
Improvement Strategy For Achieving Competitive Advantage – A Case Study” First
International Conference On Emerging Trends In Engineering And Technology
52. Tanvir Ahmed, Raj Narayan Acharjee, Md.Abdur Rahim, Noman Sikder, TaslimaAkther,
Mohd. Rifat Khan, Md.Fazle Rabbi, AnupSaha( 2013) International Journal Of Modern
Engineering Research Vol. 3, Issue. 6, Pp-3700-3715
1586

45
53. Uddin S.M And Rahman C.M.L(2014)”Minimization Of Defects In The Sewing Section
Of A Garment Factory Through Dmaic Methodology Of Six Sigma” Research Journal
Of Engineering Sciences Vol. 3(9), 21-26,
54. Varun, S.Appaiah , ChethanKumar.C.S(2015)”Enhancing The Operational Effectiveness
Of Sewing Segment In Garment Industry By DMAIC Approach” International Research
Journal Of Engineering And Technology (Irjet) Volume: 02
55. Varsha Hemant Patil, Snehal M. Kamlapur, Manikrao L. Dhore (2006)”Six Sigma In
Education: To Achieve Overall Excellence In The Field Of Education” Proceedings Of
The Third International Conference On Information Technology: New Generations
(Itng'06) 0-7695-2497-4/06
56. V. Pantano, P. O’kane And K. Smith (2006)”Cluster-Based Six Sigma Deployment In
Small And Medium Sized Enterprises” International Automotive Research Centre
Warwick Manufacturing Group, University Of Warwick Coventry
57. Varsha M. Magar , Dr. Vilas B. Shinde(2014)” Application Of 7 Quality Control (7 Qc)
Tools For Continuous Improvement Of Manufacturing Processes” International Journal
Of Engineering Research And General Science Volume 2, Issue 4, Issn 2091-2730
58. XingxingZu, Tina L. Robbins , Lawrence D. Fredendall (2008)” Mapping The Critical
Links Between Organizational Culture And TQM /Six Sigma Practices” Int. J.
Production Economics 123 (2010) 86–106
59. XingxingZu A , Lawrence D. Fredendall B, Thomas J. Douglas (2008)” The Evolving
Theory Of Quality Management The Role Of Six Sigma” Journal Of Operations
Management 26, 630–650
1587

46
APPENDIX 1
Questionnaire format
S/N Employee
name
Job title List down all T-shirt
defects that you are
encountered in your
daily production
And also mention all the
possible root causes for
each defects
1
2
3
4
5
6
7
8
9
10
APPENDIX 2
Check sheet for skip stitch
S/N
Machines 2-3 3-4 4-5 5-6 6-7 7-8 8-9 9-10 10-
11
Total
1 Improper feeding
2 Pre adjustment
3 Machine setting
4 Long time usage
5 Needle bent or dull
6 Needle insertion
1588

47
7 Skill problem
8 Improper
threading
9 Worn defective
thread guides or
eyelets
10 Looper to needle
timing
11 Spare part shortage
12 Wear out looper
S/N manpower 2-3 3-4 4-5 5-6 6-7 7-8 8-9 9-10 10-
11
Total
1 Fatigue
2 Wrong setting
3 Increase in speed
S/N Method 2-3 3-4 4-5 5-6 6-7 7-8 8-9 9-10 10-
11
Total
1 Improper
threading
2 Machine
adjustment
3 Improper
threading
4 Operator skill
5 Types of operation
6 Tension
adjustment
1589

48
S/N Material 2-3 3-4 4-5 5-6 6-7 7-8 8-9 9-10 10-
11
Total
1 Fabric type
2 Types of
thread
3 Thick or thin
4 Neaps on the
thread
5 Quality of the
thread
APPENDIX 3
Check sheet for stain
s/n Machines 2-3 3-4 4-4 5-6 6-7 7-8 8-9 9-
10
10-
1`1
Total
1 Measuring type
2 Numbering machines
3 Lack of scheduled
maintenance
4 Machine break down
5 Un cleaned machines
S/N Method 2-3 3-4 4-5 5-6 6-7 7-8 8-9 9-
10
10-
11
Total
1 Lack of stop
2 Lack of standard
3 Transportation
4 Poor handling
1590

49
5 Lack of training
6 Awareness
7 Standardization
8 Work place
s/n Man 2-3 3-4 4-5 5-6 6-7 7-8 8-9 9-10 10-
11
Total
1 Skill of operation
2 Lack of operation
hygiene
3 Lack of training
4 Lack of awareness
5 Lack of ownership
6 Not satisfied
S/N Material 2-3 3-4 4-5 5-6 6-7 7-8 8-9 9-10 10-
11
Total
1 Material handling
2 Material type
3 transportation
1591

50
APPENDIX 4
Summarized monthly rework rate with their percentage
Defect rate (December)
January
Days Checked Pcs Ok Pcs Rework Pcs Rework%
1 7567 7065 436 5.8%
2 2737 2543 167 6.1%
4 7477 6967 436 5.8%
5 8721 8179 461 5.3%
6 5736 5345 326 5.7%
8 9559 8706 724 7.6%
9 6949 6361 471 6.8%
11 9777 8925 712 7.3%
12 13792 12836 839 6.1%
13 13418 12550 766 5.7%
14 13587 12524 950 7.0%
15 12167 10989 994 8.2%
16 8813 7943 692 7.9%
18 11479 10798 573 5.0%
19 11988 11146 751 6.3%
21 11386 10573 712 6.3%
22 10475 9952 668 6.2%
23 4469 4089 315 7.0%
25 10048 9153 759 7.6%
26 12356 11467 713 5.8%
27
28 13052 12265 702 5.4%
29 14306 13376 802 5.6%
30 9822 9187 542 5.5%
1592

51
February
Days Checked Pcs ok Rework Pcs Rework%
1 171949 161364 8953 5%
2 14136 13133 860 6.1%
3 9539 8917 543 5.7%
4 7768 7270 432 5.6%
5 8098 7596 433 5.3%
6 3017 2816 173 5.7%
8 191 159 28 14.7%
9 8977 8433 459 5.1%
10 6659 6127 451 6.8%
11 673 620 45 6.7%
12 85 82 3 3.5%
13 1532 1470 54 12.8%
15 1076 986 68 6.3%
16 2793 2554 202 7.2%
17 2452 2263 151 6.2%
18 4707 4376 277 5.9%
19 18131 17464 558 3.1%
20 10180 9640 470 4.6%
21 8037 7608 368 4.6%
22 14691 13738 767 5.2%
23 7264 6754 415 5.7%
24 2833 2668 128 4.5%
25 11896 10886 876 7.4%
26 11327 10495 708 6.3%
27 8850 8305 479 5.4%
28 8136 7588 480 5.9%
29 18780 17762 841 4.5%
1593

52
March
Days Checked Pcs Ok Pcs Rework Pcs Rework %
1 6250 5803 347 5.6%
2 5509 5143 330 6.0%
3 13985 13118 750 5.4%
4 14936 14022 738 4.9%
5 8890 8296 511 5.7%
6 8030 7516 438 5.5%
7 12797 12167 530 4.1%
8 12332 11704 551 4.5%
9 14300 13690 531 3.7%
10 10407 9892 431 4.1%
11 9819 9251 490 5.0%
12 6583 6203 321 4.9%
14 4951 4675 236 4.8%
15 10532 101277 343 3.3%
16 15080 14516 488 3.2%
17 15719 15112 521 3.3%
18 15100 14491 535 3.5%
19 12007 11533 400 3.3%
21 19031 18233 694 3.6%
22 18361 17410 849 4.6%
23 15395 15097 0 0%
24 11532 10847 557 4.8%
25 7540 7093 378 5.0%
26 9566 8888 579 6.1%
28 8455 7613 745 8.8%
29 11950 11163 682 5.7%
30 13634 12719 782 5.7%
31 11943 11110 707 5.9%
1594

53
April
Days Checked Pcs Ok Pcs Rework Pcs Rework%
1 12060 11316 634 5.3%
2 8919 8382 449 5.0%
4 14590 13516 932 6.4%
5 14822 13810 879 5.9%
6 15704 14829 769 4.9%
7 14743 14101 548 3.7%
8 9090 8438 576 6.3%
9 8899 8131 705 7.9%
10 783 633 125 16.0%
11 11695 10960 629 5.4%
12 12709 11719 836 6.6%
13 9351 8719 547 5.8%
14 7572 7085 391 5.2%
15 10795 10198 496 4.6%
16 10052 9449 522 5.2%
17 7370 7003 299 4.1%
18 11794 11010 669 5.7%
19 11342 10228 1016 9.0%
20 8353 7840 438 5.2%
21 8632 8109 439 5.1%
22 10462 9874 477 4.6%
23 10118 9626 391 3.9%
24 1610 1489 95 5.9%
25 10011 9555 374 3.7%
26 13873 12955 707 5.1%
27 14162 12991 940 6.6%
28 17084 16206 639 3.7%
1595

54
May
Days Checked Pcs Ok Pcs Rework Pcs Rework %
1 275269 260256 11366 4%
2 9016 8476 380 4.2%
3 14976 14050 643 4.3%
4 13376 12524 618 4.6%
5 7107 6620 318 4.5%
6 9913 9253 466 4.7%
7 5791 5484 229 4.0%
9 7004 6550 371 5.3%
10 10183 9569 471 4.6%
11 12342 11680 505 4.1%
12 11087 10380 583 5.3%
13 14307 13674 505 3.5%
14 12329 11745 428 3.5%
15 5215 4939 198 3.8%
16 11088 10419 521 4.7%
17 7297 6699 450 6.2%
18 12281 11673 456 3.7%
19 6869 6543 248 3.6%
20 5782 5529 205 3.5%
21 2550 2450 87 3.4%
22 380 351 24 6.3%
23 12406 11854 459 3.7%
24 11727 11055 523 4.5%
25 13144 12491 515 3.9%
26 14863 14262 452 3.0%
27 9161 8698 339 3.7%
29 1691 1581 41 2.4%
30 11236 10529 568 5.1%
31 12327 11707 441 3.6%
1596

55
June
Days Checked Pcs Ok Pcs Rework Pcs Rework %
1 11197 10594 441 3.9%
2 12132 11511 485 4.0%
3 8160 7754 327 4.0%
4 12249 11345 758 6.2%
5 4873 4597 245 5.0%
6 10465 9878 479 4.6%
7 5145 4870 213 4.1%
8 6670 6273 313 4.7%
9 7969 7449 402 5.0%
10 8198 7556 464 5.7%
APPENDIX 5
Monthly rejection and rework rate
Months
Custome
r Style
Checke
d Ok
Rejec
t
Rewor
k
Ok
%
Rejec
t %
Rewor
k %
Decembe
r
George
GD
1493 48968 45027 517 3424 92% 1% 7%
H&M
Billie 27744 25411 200 2133 92% 1% 8%
CTN
stretch 35675 32330 451 2894 91% 1% 8%
Lima 24175 21457 295 2423 89% 1% 10%
Ronny 60001 54502 700 4799 91% 1% 8%
NJ
GD
1736 476 451 2 23 95% 0% 5%
GD 10735 9533 178 1024 89% 2% 10%
1597

56
1744
Tekeze
Pack
out 1003 856 38 109 85% 4% 11%
Primark
GD
1609 28300 25896 296 2108 92% 1% 7%
Total 237077
21546
3 2677 18937
91
% 1% 8%
Months
Custome
r Style
Checke
d Ok
Rejec
t
Rewor
k
Ok
%
Rejec
t %
Rewor
k %
January
George
GD
1493 41285 38815 383 2087 94% 1% 5%
H&M
CTN
stretch 18719 17582 120 1017 94% 1% 5%
Lima 27771 24701 289 2781 89% 1% 10%
Ronny 77317 71667 834 4816 93% 1% 6%
NJ
GD
1735 5982 5632 42 308 94% 1% 5%
GD
1736 5067 4834 31 202 95% 1% 4%
Tezeni's
GD
1609 53486 49397 797 3292 92% 1% 6%
Total 229627
21262
8 2496 14503
93
% 1% 6%
Months
Custome
r Style
Checke
d Ok
Rejec
t
Rewor
k
Ok
%
Rejec
t %
Rewor
k %
February George
GD
1493 5130 4738 71 321 92% 1% 6%
H&M Billie 47728 45164 535 2029 95% 1% 4%
1598

57
CTN
stretch 21744 19538 272 1934 90% 1% 9%
Lima 11460 10183 118 1159 89% 1% 10%
Ronny 41959 39580 358 2021 94% 1% 5%
NJ
GD
1811 29761 28562 122 1077 96% 0% 4%
Total 157782
14776
5 1476 8541
94
% 1% 5%
Months
Custome
r Style
Checke
d Ok
Rejec
t
Rewor
k
Ok
%
Rejec
t %
Rewor
k %
March
George
GD
1493 63242 59110 620 3512 93% 1% 6%
H&M
Billie 68342 66125 449 1768 97% 1% 3%
Bob 244 236 0 8 97% 0% 3%
Kicki 8808 7816 47 945 89% 1% 11%
Lima 14026 13171 73 782 94% 1% 6%
Ronny 47770 45620 511 1639 95% 1% 3%
CTN
stretch 28975 26982 311 1682 93% 1% 6%
NJ
GD
1811 54552 51659 250 2643 95% 0% 5%
Be
connect
Bat
man 15750 15048 17 685 96% 0% 4%
Little
pony 5443 5103 14 326 94% 0% 6%
Primark
GD
1609 18889 17476 262 1151 93% 1% 6%
Total 326041
30834
6 2554 15141
95
% 1% 5%
1599

58
Months
Custome
r Style
Checke
d Ok
Rejec
t
Rewor
k
Ok
%
Rejec
t %
Rewor
k %
April
George
GD
1493 16346 15337 146 863 94% 1% 5%
H&M
Billie 32562 31527 264 771 97% 1% 2%
Bob 31159 30224 170 765 97% 1% 2%
Kicki 25360 22593 248 2519 89% 1% 10%
Lima 47480 44850 521 2109 94% 1% 4%
Ronny 46173 43856 549 1768 95% 1% 4%
Kik Ladies 29782 26023 531 3228 87% 2% 11%
NJ
GD
1483 39727 37643 252 1832 95% 1% 5%
Poly
concept
Men's
t-shirt 6117 5476 101 540 90% 2% 9%
Primark
GD
1609 11891 10643 121 1127 90% 1% 9%
Total 286597
26817
2 2903 15522
94
% 1% 5%
Months
Custome
r Style
Checke
d Ok
Rejec
t
Rewor
k
Ok
%
Rejec
t %
Rewor
k %
May
George
GD
1493 42609 39937 384 2288 94% 1% 5%
H&M
Billie 39004 37253 678 1073 96% 2% 3%
Kicki 4607 2786 468 1353 60% 10% 29%
Lima 52222 50079 771 1372 96% 1% 3%
Ronny 39141 37120 613 1408 95% 2% 4%
Kik
Regla
n 28734 26725 367 1642 93% 1% 6%
1600

59
NJ
GD
1811 11232 10748 64 420 96% 1% 4%
GD
1483 6866 6606 14 246 96% 0% 4%
Poly
concept
Men's
t-shirt 10202 9248 198 756 91% 2% 7%
Primark
GD
1609 10831 10283 62 486 95% 1% 4%
Tekeze T-shirt 9821 9471 28 322 96% 0% 3%
Total 255269
24025
6 3647 11366
94
% 1% 4%
APPENDIX 6
Questionnaire format (ቃለመሕተትቕጥዒ)
Personal information :(ናይግሊመረዳእታ)
Name: (ስም)___________________________
Job title :(ናይስራሕመደብ)_____________________________
Sign :(ፌርማ)__________________________________________
Make a tick mark based on the selection defect source (ኣብዝመረፅዎዓይነትችግር (✓) ቲክይግበሩ)
እዚቃለመሕተትእዚንመመርቂፅሑፍጥራሕዝጥቀመሉእምበርንካሊእነገርዝውዕልከምዘይኮነብትሕትናከፍልጠኩምይደሊ፡፡
S/
N
(ተ
.ቁ
List down all
sewing
defects(ኩሎምናይስፌ
ትሪወርክታትዝርዝር)
Machine(ብማሽንም
ክንያትዝመፁችግራት)
Material(
ብጨርቂ
ምክንያትዝ
መፁችግራት
)
Method(ብናይኣስራ
ርሓዝመፁችግራት)
Man(ብናይሰራሕተ
ኛዝመፁችግራት)
1601

60
)
1602

61
APPENDIX 7
Questionnaire format
Personal information________________________________
Name: ___________________________________________
Job title:__________________________________________
Make a tally for all defects.
S/N List down all sewing defects machine material method man
1603

62
APPENDIX 8
Table six month production report
Months Customer Style Checked Ok Reject Rework Ok
%
Reject
%
Rework
%
December George GD
1493
48968 45027 517 3424 92% 1% 7%
H&M Billie 27744 25411 200 2133 92% 1% 8%
CTN
stretch
35675 32330 451 2894 91% 1% 8%
Lima 24175 21457 295 2423 89% 1% 10%
Ronny 60001 54502 700 4799 91% 1% 8%
NJ GD
1736
476 451 2 23 95% 0% 5%
GD
1744
10735 9533 178 1024 89% 2% 10%
Tekeze Pack
out
1003 856 38 109 85% 4% 11%
Primark GD
1609
28300 25896 296 2108 92% 1% 7%
Total 237077 215463 2677 18937 91% 1% 8%
Stain Skip Brocken total Material machine man Method
5176 2405 707
27% 13% 4% 44% 25% 55% 10% 10%
Months Customer Style Checked Ok Reject Rework Ok
%
Reject
%
Rework
%
January George GD 41285 38815 383 2087 94% 1% 5%
1604

63
1493
H&M CTN
stretch
18719 17582 120 1017 94% 1% 5%
Lima 27771 24701 289 2781 89% 1% 10%
Ronny 77317 71667 834 4816 93% 1% 6%
NJ GD
1735
5982 5632 42 308 94% 1% 5%
GD
1736
5067 4834 31 202 95% 1% 4%
Tezeni's GD
1609
53486 49397 797 3292 92% 1% 6%
Total 229627 212628 2496 14503 93% 1% 6%
Stain Skip Brocken total Material machine man method
4433 3226 1168
31% 22% 8% 61% 34% 39% 15% 12%
Months Customer Style Checked Ok Reject Rework Ok
%
Reject
%
Rework
%
February George GD
1493
5130 4738 71 321 92% 1% 6%
H&M Billie 47728 45164 535 2029 95% 1% 4%
CTN
stretch
21744 19538 272 1934 90% 1% 9%
Lima 11460 10183 118 1159 89% 1% 10%
Ronny 41959 39580 358 2021 94% 1% 5%
NJ GD
1811
29761 28562 122 1077 96% 0% 4%
Total 233855 219307 1476 12144 94% 1% 5%
1605

64
Stain Skip Brocken total Material Machine Man Method
3790 3183 983
31% 26% 8% 66% 31% 42% 14% 13%
Months Customer Style Checked Ok Reject Rework Ok
%
Reject
%
Rework
%
March George GD
1493
63242 59110 620 3512 93% 1% 6%
H&M Billie 68342 66125 449 1768 97% 1% 3%
Bob 244 236 0 8 97% 0% 3%
Kicki 8808 7816 47 945 89% 1% 11%
Lima 14026 13171 73 782 94% 1% 6%
Ronny 47770 45620 511 1639 95% 1% 3%
CTN
stretch
28975 26982 311 1682 93% 1% 6%
NJ GD
1811
54552 51659 250 2643 95% 0% 5%
Be
connect
Bat
man
15750 15048 17 685 96% 0% 4%
Little
pony
5443 5103 14 326 94% 0% 6%
Primark GD
1609
18889 17476 262 1151 93% 1% 6%
Total 326041 308346 2554 15141 95% 1% 5%
1606

65
Stain Skip Brocken Total Material Machine Man Method
2285 1704 379
15% 11% 3% 29% 30% 42% 17% 11%
Months Customer Style Checked Ok Reject Rework Ok
%
Reject
%
Rework
%
April George GD
1493
16346 15337 146 863 94% 1% 5%
H&M Billie 32562 31527 264 771 97% 1% 2%
Bob 31159 30224 170 765 97% 1% 2%
Kicki 25360 22593 248 2519 89% 1% 10%
Lima 47480 44850 521 2109 94% 1% 4%
Ronny 46173 43856 549 1768 95% 1% 4%
Kik Ladies 29782 26023 531 3228 87% 2% 11%
NJ GD
1483
39727 37643 252 1832 95% 1% 5%
Poly
concept
Men's
t-shirt
6117 5476 101 540 90% 2% 9%
Primark GD
1609
11891 10643 121 1127 90% 1% 9%
Total 286597 268172 2903 15522 94% 1% 5%
Stain Skip Brocken Material Machine Man Method
4961 3687 734
32% 24% 5% 60% 36% 44% 8% 12%
1607

66
Months Customer Style Checked Ok Reject Rework Ok
%
Reject
%
Rework
%
May George GD
1493
42609 39937 384 2288 94% 1% 5%
H&M Billie 39004 37253 678 1073 96% 2% 3%
Kicki 4607 2786 468 1353 60% 10% 29%
Lima 52222 50079 771 1372 96% 1% 3%
Ronny 39141 37120 613 1408 95% 2% 4%
Kik Reglan 28734 26725 367 1642 93% 1% 6%
NJ GD
1811
11232 10748 64 420 96% 1% 4%
GD
1483
6866 6606 14 246 96% 0% 4%
Poly
concept
Men's
t-shirt
10202 9248 198 756 91% 2% 7%
Primark GD
1609
10831 10283 62 486 95% 1% 4%
Tekeze T-shirt 9821 9471 28 322 96% 0% 3%
Total 255269 240256 3647 11366 94% 1% 4%
Stain Skip Brocken Material Machine Man Method
1194 3674 799
11% 32% 7% 50% 19% 63% 7% 11%
1608

67
APPENDIX 9
Participants at the Brainstorming Session
Table: Categorizing the defect types based on 4M
Quality
Manager
Assistant manager
Quality officer
5 Section head
Production
Production manager
Assistant manager
4 section head
Maintenance
Manager
Assistant manager
Industrial engineering Planning department
IE officer
Kaizen officer System manager
(Questioner)
S/N Machine Material Method Man
Stain 25 21 20 20
Skip stitch 25 6 8 11
Broken 17 3 12 20
1609

68
APPENDIX 10
Table: Defect location indicator
Defect category Defect location
Stain Back and front
Skip stitch Bottom and cuff hem
Broken Bottom and cuff hem
Appendix 11
Forpareto six month data
Skip stitch causes
Table: Machine causes for skip stitch
Total number of defects 65049
Machine defects 32524
Machine Amount Amount
cumulative.
Cumulative.%
Looper to needle timing 5004 5004 15%
Needle bent or dull 4587 9591 29%
Skill problem 4170 13760 42%
Long time usage 3752 17512 54%
Machine setting 3336 20848 64%
Pre adjustment 2919 23767 73%
Improper feeding 2502 26269 81%
Needle insertion 2085 28354 87%
Worn defective thread guides or
eyelets
1668 30022 92%
Spare part shortage 1251 31273 96%
Wear out of looper 834 32107 99%
Improper threading 417 32524 100%
1610

69
Total number of defects 65049
Material defects 16262
Material Amount Amount cumulative. Cumulative%
Quality of the thread 5421 5421 33%
Types of thread 4337 9757 60%
Fabric type 3252 13010 80%
Thick or thin 2168 15178 93%
Neaps on the thread 1084 16262 100%
Total number of
defects
65049
Method defects 9757
Method Amount Amount cumulative. cumulative%
Machine adjustment 2788 2788 29%
Types of operation 2323 5111 52%
Operator skill 1859 6970 71%
Tension adjustments 1394 8363 86%
Improper feeding 929 9293 95%
Improper threading 465 9757 100%
Total number
of defects
65049
Man causes 6505
Man power Amount Amount
cumulative
cumulative %
increase in 3252 3252 50%
1611

70
speed
Wrong setting 2168 5421 83%
Fatigue 1084 6505 100%
Problem
causes
Amount Amount
cumulative
Cumulative %
Machine 32525 32525 50%
Material 16262 48787 75%
Method 9757 58544 90%
Man 6505 65049 100%
Total 65049
Stain causes
Total number of defects 83841
Machin defects 20960
Machine Amount Amount
cumulative
cumulative %
Un cleaned machines 6987 6987 33%
Machine break down 5589 12576 60%
Lack of scheduled
maintenance
4192 16768 80%
Machine type 2795 19563 93%
Numbering machines 1397 20960 100%
1612

71
Total number of defects 83841
Material causes 20960
Material Amount Amount
cumulative
cumulative %
Material handling 10480 10480 50%
transportation 6987 17467 83%
Material type 3493 20960 100%
20960
Total number of
defects
83841
Method defects 20960
Method Amount Amount
cumulative
cumulative %
Lack of sop 5240 5240 25%
transportation 4491 9732 46%
Poor handling 3743 13474 64%
Lack of training 2994 16469 79%
Awareness 2246 18715 89%
standardization 1497 20212 96%
Work place 749 20960 100%
1613

72
Total number of defects 83841
Man defects 20960
Man power Amount Amount
cumulative
Cumulative %
Skill of operation 5989 5989 29%
Lack of personal
hygiene
4991 10979 52%
Lack of training 3992 14972 71%
Lack of awareness 2994 17966 86%
Lack of ownership 1996 19962 95%
Not satisfied 998 20960 100%
Types of
defect
Amount Amount
cumulative
Cumulative %
Machine 20960 20960 25%
Material 20960 41921 50%
Method 20960 62881 75%
Man 20960 83841 100%
Total number
of defects
83841
1614

73
APPENDIX 12
Why –Why analysis for skip stitch
Potential causes for Skip stitch
category Why? Why? Why? Why? Why?
Machine
Improper
threading
Not
knowing
the
threading
system
Un skilled
operator
Lack of
awareness of
not knowing
the effect
Lack of
training
Spare
part
shortage
Suffering
from
higher
cost
Company
ability
Wrong
setting
Un
skilled
Operator
Technical
training
Work load Company
strategy
High
cost
carelessn
ess
Not having a
trainer
Training cost
Suffering
from hiring
employee
Improper
machine
set up
Skill gap
Awarene
ss
problem
Long
time
needle
usage
High cost
of needle
For
minimizin
g cost
Competitive
advantage
Need for High
profit
To
achieve
the
settled
target
Needle carelessne High needle The Company
1615

74
bent
Improper
needle
adjustme
nt
ss time usage considering it
as culture of
using needle
throughout its
life time
High
cost
and
Compa
ny
ability
Low
skilled
Lack of
technical
training
Work load The
strategi
c plan
of the
compan
y not
focusin
g on
mainten
ance
and not
providi
ng
expert
who
will
train
Skill
problem
Lack of
training
trainer Not skilled Not trained Compa
ny
strategy
not
focusin
g on
training
and
1616

75
lack of
experie
nce
sharing
trained Low ability
in receiving
training
personality Nature
of the
person
or not
concent
rating
Dissatisfactio
n by work
Low
salary
Dull
needle
No
preparati
on
Awarenes
s problem
and no
self
checking
Selection
of needle
versus
fabric
type
Skill gap
Mis
aligned
during
fixing
Skill gap
Awareness
problem
Life time There is no
proper
recording
1617

76
No
consisten
t
schedule
maintena
nce
Rush
productio
n
Poor
company
wise
planning
Less
feeding
Poor
follow up
and
giving
feedback
Wear out
machine
parts
Due to
preventiv
e
maintena
nce
Awarenes
s problem
Delay in
supply
Supply
chain
system
Late request
Financial
problem
Delay in
custom
process
All items not
locally
available
Life time
man Speed
increase
For
finishing
fastly
Not
knowing
the effect
Awareness
problem
Lack of
continuous
training
Trained
only
when
they are
hired
1618

77
Dissatisfa
ction by
the setted
speed
Over
confidence
High
experience
Fatigue
Work
load
Operation
system
complex
Not using
the latest
way of
working
Due High
rework
and
rejection
rate
Long time
working
Planning
problem ,hig
h order
Not assuming
the down time
To achieve
the setted
target or to
fulfill the
delivery date
Customer
satisfaction
Loyal
custom
er and
build
compan
y image
and to
increase
the
profit
of the
compan
y
For not
incurrin
1619

78
g
unneces
sary
expense
s
Skill gap Lack of
continuo
us
training
Handling
problem
Carless
attention
for work
Lack of
corrective
action
training
Disciplinary
action
material
Fabric
type
Low
GSM
The
nature of
the fabric
type
Poor
thread
quality
There is
no
Thread
quality
tester
Carelessn
ess of the
managem
ent
Not
knowing the
effect
For
minimizing
the cost
Defects
passing
from
cutting
Checker
negligenc
e and
awarenes
s
Follow up
problem
Invisible
defects
Back side
error
Method More
WIP
Poor
follow up
1620

79
Line
color
Wise
plan
Input not
required
as
planned
Lack of
SOP
Skill gap
and lack
of
experienc
e
No
consistent
training
and
follow up
1621

80
APPENDIX 13
Why-Why analysis for stain
Potential causes for Stain
Category Why? Why? Why? Why? Why? Why?
Machine Stain due to
numbering
machines
Fabric dust The
chemical
that came
from dying
for
avoiding
the neaps
The
nature of
the
process
Uncleaned
machine
No
autonomou
s
maintenanc
e
High
work load
Wrong
target
setting
Wrong
time
study
carelessne
ss
There is no
continuous
cleaning
There is no
regular
schedule
Numbering
machine
problem
Due to the
machine
design
Problem of
ink &
sticker
Poor
quality of
material
purchased
Method Lack of SOP the ability
of the
company
The
potential or
knowledge
of the
workers on
Lack of
training
Lack of
expert
1622

81
preparing
SOP
transportation Old
transportati
on
materials
Large
operation
Gap
between
department
to
department
Layout
problem
Not
planning
Nature
of the
work
Poor handling Carelessnes
s
Working
environmen
t
Poor
infrastructu
re
Not
planned
Lack of
knowled
ge
awarene
ss
standardizatio
n
No
sustainabilit
y
Work load Need for
high
demand
from
departmen
t to
departmen
t
For not
being
asked
Not
accepting
Not
thinking
as it’s the
best way
Not
showing
the
advantag
e
Oil stain due to
cutting machines
Improper
cleaning
Low
motivation
Not
identifyin
1623

82
after
corrective
maintenanc
e
while
cleaning
g impact
on
resource
Due to
lack of
hard
currency
No
scheduled
preventive
maintenanc
e
Lack of
spare parts
Delay in
purchasin
g process
Due to
negligen
ce
Due to
out of
controlli
ng (bank,
custom)
Delay in
request
No
follow
up on
stock
controlli
ng
Man Employee not
satisfied
Less salary
and
incentive
High
income
need
High
profit
Material Defects from fabric Passed due
to 4-point
system
Inspector
error
Skill gap
and
1624

83
negligence
Intentionall
y to meet
delivery
time
Defects due to
transportation
Poor
handling
Lack of
awareness
on final
impact
Damaged
trolley
Lack of
preventive
maintenanc
e
Lack of
spare
parts
No pallet or
shelf to
keep the
fabric
There is no
demand
still now
No trolley
or moving
tray in
cutting
There is no
demand
still now
Defects due to
packing materials
It is not
properly
covered
Covering
material is
not a like a
bag
There is
no
demand
still now
1625

84
APPENDIX 14
Table: December month Defect rate
Days Checked Pcs Ok Pcs Rework Pcs Rework %
1 263101 239710 20319 8%
2 6165 5654 428 6.9%
3 8934 7996 817 9.1%
4 10110 9088 895 8.9%
5 7322 6522 721 9.8%
7 8811 7943 785 8.9%
8 11178 9886 1156 10.3%
9 10303 9185 963 9.3%
10 11448 10218 1060 9.3%
11 8189 7213 886 10.8%
12 7395 6547 784 10.6%
14 8229 7388 737 9.0%
15 14275 12940 1189 8.3%
16 14437 13271 1036 7.2%
17 12924 11912 871 6.7%
18 14229 13245 848 6.0%
19 7560 6924 544 7.2%
21 10527 9670 744 7.1%
22 6860 6270 525 7.7%
24 2138 1997 101 4.7%
25 6516 6025 415 6.4%
26 4523 4122 347 7.7%
28 7880 7151 632 8.0%
29 8572 8036 474 5.5%
30 8835 8151 565 6.4%
31 10595 9887 596 5.6%
1626

85
Figure P-chart for December month
Due to 3 points (4, 24, 28) fail out of control the process is not stable due to the operator
carelessness, machine break down, needle breakage.
New revised P chart
Figure Revised-1: P-chart for December month
1627

86
Figure Revised-2: P-chart for December month
Figure Final P-Chart for December Month
1628

87
Table January Month Defect Rate
Days Checked Pcs Ok Pcs Rework Pcs Rework%
1 7567 7065 436 5.8%
2 2737 2543 167 6.1%
4 7477 6967 436 5.8%
5 8721 8179 461 5.3%
6 5736 5345 326 5.7%
8 9559 8706 724 7.6%
9 6949 6361 471 6.8%
11 9777 8925 712 7.3%
12 13792 12836 839 6.1%
13 13418 12550 766 5.7%
14 13587 12524 950 7.0%
15 12167 10989 994 8.2%
16 8813 7943 692 7.9%
18 11479 10798 573 5.0%
19 11988 11146 751 6.3%
21 11386 10573 712 6.3%
22 10475 9952 668 6.2%
23 4469 4089 315 7.0%
25 10048 9153 759 7.6%
26 12356 11467 713 5.8%
28 13052 12265 702 5.4%
29 14306 13376 802 5.6%
30 9822 9187 542 5.5%
1629

88
Figure P-chart for January month
Figure. Revised-1: P-chart for January month
1630

89
Figure Final: P-chart for January month
Table: February month Defect rate
Days Checked Pcs Ok Rework Pcs Rework%
1 171949 161364 8953 5%
2 14136 13133 860 6.1%
3 9539 8917 543 5.7%
4 7768 7270 432 5.6%
5 8098 7596 433 5.3%
6 3017 2816 173 5.7%
8 191 159 28 14.7%
9 8977 8433 459 5.1%
10 6659 6127 451 6.8%
11 673 620 45 6.7%
12 85 82 3 3.5%
13 1532 1470 54 12.8%
15 1076 986 68 6.3%
16 2793 2554 202 7.2%
17 2452 2263 151 6.2%
18 4707 4376 277 5.9%
19 18131 17464 558 3.1%
1631

90
20 10180 9640 470 4.6%
21 8037 7608 368 4.6%
22 14691 13738 767 5.2%
23 7264 6754 415 5.7%
24 2833 2668 128 4.5%
25 11896 10886 876 7.4%
26 11327 10495 708 6.3%
27 8850 8305 479 5.4%
28 8136 7588 480 5.9%
29 18780 17762 841 4.5%
Figure. P-chart for February month
1632

91
Figure Revised-1: P-chart for February month
Figure Final: P-chart for February month
1633
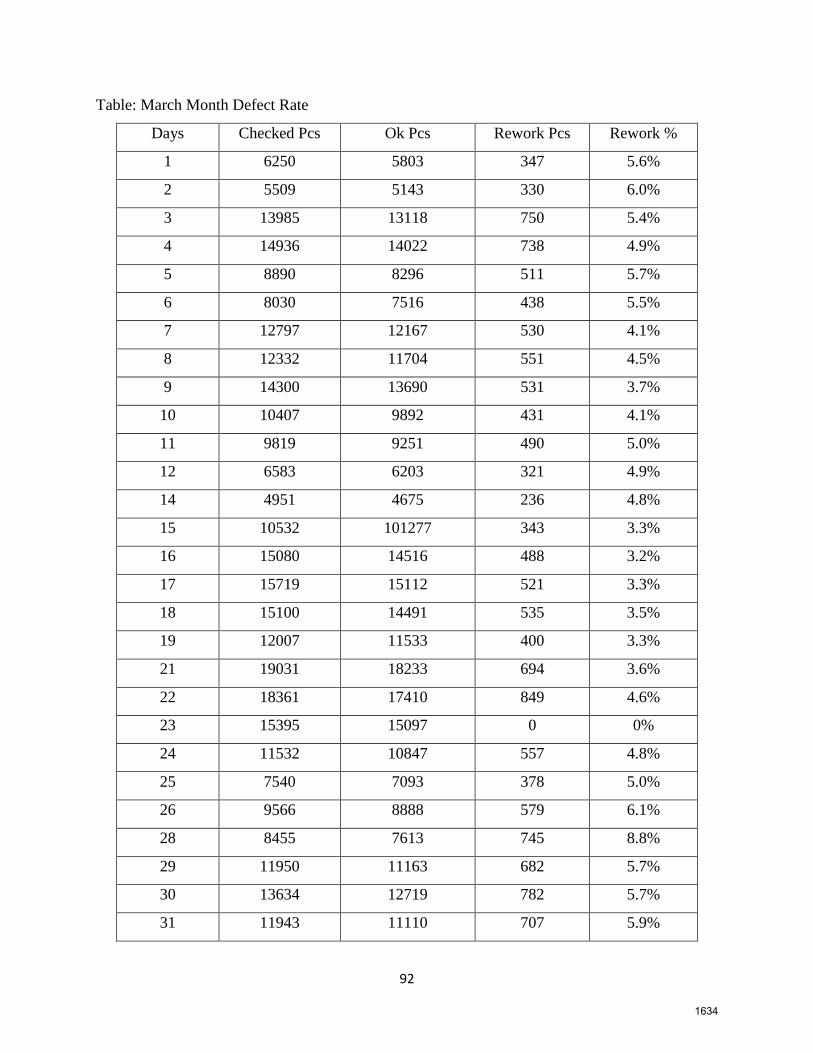
92
Table: March Month Defect Rate
Days Checked Pcs Ok Pcs Rework Pcs Rework %
1 6250 5803 347 5.6%
2 5509 5143 330 6.0%
3 13985 13118 750 5.4%
4 14936 14022 738 4.9%
5 8890 8296 511 5.7%
6 8030 7516 438 5.5%
7 12797 12167 530 4.1%
8 12332 11704 551 4.5%
9 14300 13690 531 3.7%
10 10407 9892 431 4.1%
11 9819 9251 490 5.0%
12 6583 6203 321 4.9%
14 4951 4675 236 4.8%
15 10532 101277 343 3.3%
16 15080 14516 488 3.2%
17 15719 15112 521 3.3%
18 15100 14491 535 3.5%
19 12007 11533 400 3.3%
21 19031 18233 694 3.6%
22 18361 17410 849 4.6%
23 15395 15097 0 0%
24 11532 10847 557 4.8%
25 7540 7093 378 5.0%
26 9566 8888 579 6.1%
28 8455 7613 745 8.8%
29 11950 11163 682 5.7%
30 13634 12719 782 5.7%
31 11943 11110 707 5.9%
1634

93
Figure-chart for March month
Figure Revised-1: P-chart for March month
1635

94
Figure Final P-chart for March month
Table:April Month Defect Rate
Days Checked Pcs Ok Pcs Rework Pcs Rework%
1 12060 11316 634 5.3%
2 8919 8382 449 5.0%
4 14590 13516 932 6.4%
5 14822 13810 879 5.9%
6 15704 14829 769 4.9%
7 14743 14101 548 3.7%
8 9090 8438 576 6.3%
9 8899 8131 705 7.9%
10 783 633 125 16.0%
11 11695 10960 629 5.4%
12 12709 11719 836 6.6%
13 9351 8719 547 5.8%
14 7572 7085 391 5.2%
15 10795 10198 496 4.6%
16 10052 9449 522 5.2%
17 7370 7003 299 4.1%
1636

95
18 11794 11010 669 5.7%
19 11342 10228 1016 9.0%
20 8353 7840 438 5.2%
21 8632 8109 439 5.1%
22 10462 9874 477 4.6%
23 10118 9626 391 3.9%
24 1610 1489 95 5.9%
25 10011 9555 374 3.7%
26 13873 12955 707 5.1%
27 14162 12991 940 6.6%
28 17084 16206 639 3.7%
Figure P chart of rework for April month
1637

96
Figure: Revised-1: P chart of rework for April month
Points 12 fail out of control
Figure: Revised-1:P chart of rework for April month
1638

97
Figure: Final P chart of rework for April mont
1639

98
1640