minimal impact design standards
TRANSCRIPT

Memorandum To: MIDS Work Group
From: Barr Engineering Company
Subject: Regional Hydrologic Metrics – Precipitation (Item 3, Work Order 1)
Date: December 27, 2010
Project: 23/62 1050 MIDS
Precipitation is a key factor in designing stormwater management facilities so that a developed site‟s
hydrology will mimic‟s its natural hydrology. Annual precipitation amounts and the intensities of storm
events (inches per hour) vary throughout the State of Minnesota. These factors must be considered when
developing a single state-wide stormwater management standard. This memorandum provides
background on the variability of precipitation in the form of rainfall and snowfall, evaporation, and
transpiration throughout the State of Minnesota.
Normal Precipitation Patterns
Figure 1 shows the 1971-2000 arithmetic mean
(climatologists call this 30-year arithmetric
mean, which is updated once per decade, the
“normal”) annual precipitation throughout the
State of Minnesota. A notable pattern of
increasing precipitation from 18 inches per year
in the far northwest corner of the state to
34 inches per year in the far southeast corner is
shown.
Figure 1. 1971-2000 Mean Precipitation Throughout
Minnesota
p-gen3-12c
To: MIDS Work Group
From: Barr Engineering Company
Subject: Regional Hydrologic Metrics – Precipitation (Item 3, Work Order 1)
Date: December 27, 2010
Page: 2
Project: 23621050 MIDS
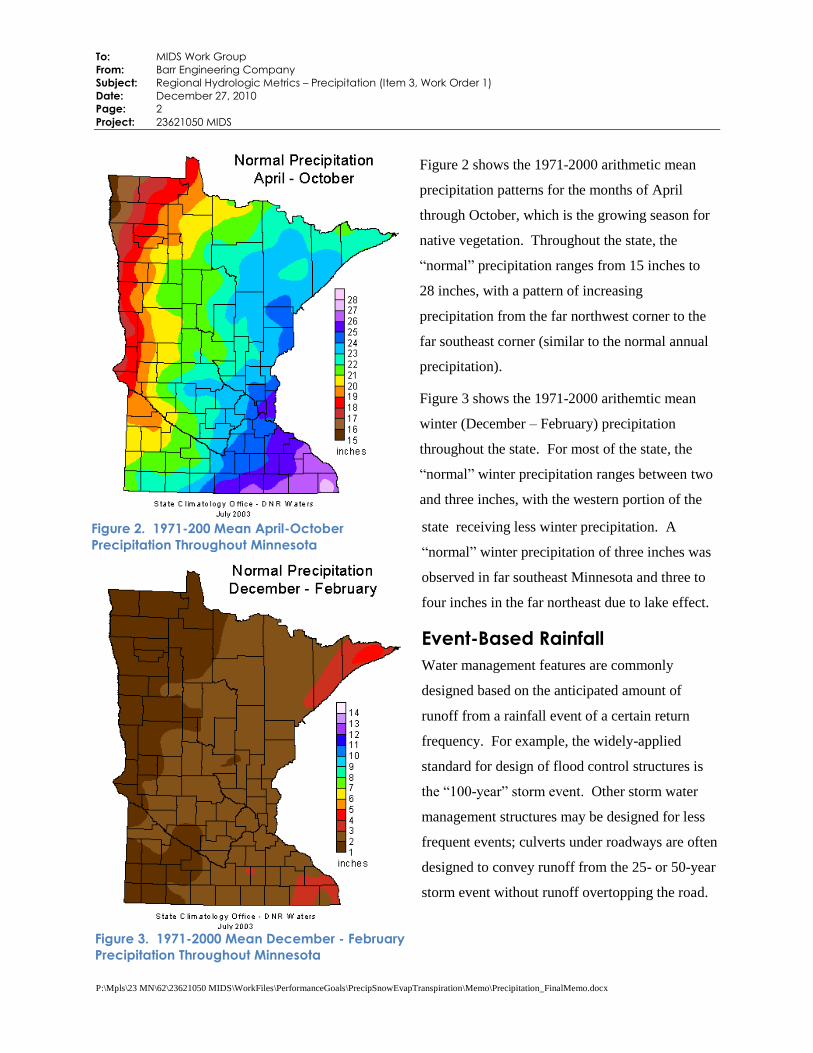
Figure 2. 1971-200 Mean April-October
Precipitation Throughout Minnesota
Figure 2 shows the 1971-2000 arithmetic mean
precipitation patterns for the months of April
through October, which is the growing season for
native vegetation. Throughout the state, the
“normal” precipitation ranges from 15 inches to
28 inches, with a pattern of increasing
precipitation from the far northwest corner to the
far southeast corner (similar to the normal annual
precipitation).
Figure 3 shows the 1971-2000 arithemtic mean
winter (December – February) precipitation
throughout the state. For most of the state, the
“normal” winter precipitation ranges between two
and three inches, with the western portion of the
state receiving less winter precipitation. A
“normal” winter precipitation of three inches was
observed in far southeast Minnesota and three to
four inches in the far northeast due to lake effect.
Event-Based Rainfall
Water management features are commonly
designed based on the anticipated amount of
runoff from a rainfall event of a certain return
frequency. For example, the widely-applied
standard for design of flood control structures is
the “100-year” storm event. Other storm water
management structures may be designed for less
frequent events; culverts under roadways are often
designed to convey runoff from the 25- or 50-year
storm event without runoff overtopping the road.
Figure 3. 1971-2000 Mean December - February
Precipitation Throughout Minnesota
P:\Mpls\23 MN\62\23621050 MIDS\WorkFiles\PerformanceGoals\PrecipSnowEvapTranspiration\Memo\Precipitation_FinalMemo.docx

To: MIDS Work Group
From: Barr Engineering Company
Subject: Regional Hydrologic Metrics – Precipitation (Item 3, Work Order 1)
Date: December 27, 2010
Page: 3
Project: 23621050 MIDS
Although design storms are often referenced using terms like “100-year storm,” a more appropriate way
to characterize the storm is a “one percent probability of occurrence,” indicating that the rainfall totals
have a one percent probability of occurring at that location that year.
The duration of rainfall is an important consideration in hydrologic design. The storm duration that
results in the highest peak rate and/or largest total volume is the “critical duration” storm. The critical
duration is important to know when determining flood levels, sizing culverts, designing roads, etc. The
critical duration will vary by watershed, depending on the size, drainage characteristics, and water
management infrastructure. It is determined by comparing various durations of the specified storm
frequency and calculating the peak rate and/or volume of runoff for each. For example, a 30-minute
event might be the critical storm duration for sizing catch basin inlets and storm sewers from small
watersheds. However, longer duration events such as the 3-hour, 12-hour, or 10-day runoff events might
be the event durations that result in the most severe flood levels for lakes. Some regulators in Minnesota
require that several storm durations be evaluated for determining the impacts from development projects.
Many require the 24-hour design storm.
To accommodate the variation in critical storm duration, precipitation frequency analyses have been
conducted and summarized for a range of rainfall durations. The commonly referenced Technical
Paper 40 (TP 40) Rainfall Frequency Atlas of the United States (U.S. Weather Bureau, 1961), published
by the National Weather Bureau, includes rainfall isopleths of varying frequency intervals for durations
between 30-minutes and 24-hours (30-minutes, 1-, 2-, 3-, 6-, 12-, and 24-hour durations). An electronic
copy of TP 40 is available at the following National Weather Service (NWS) website, which lists the most
current NWS precipitation frequency documents and related studies for each state in the United States:
http://www.weather.gov/oh/hdsc/currentpf.htm. Table 1 compares rainfall amounts in Minneapolis –
St. Paul for two durations (30-minute and 24 hour) for several recurrence periods, based on TP 40.
P:\Mpls\23 MN\62\23621050 MIDS\WorkFiles\PerformanceGoals\PrecipSnowEvapTranspiration\Memo\Precipitation_FinalMemo.docx

To: MIDS Work Group
From: Barr Engineering Company
Subject: Regional Hydrologic Metrics – Precipitation (Item 3, Work Order 1)
Date: December 27, 2010
Page: 4
Project: 23621050 MIDS
Table 1. Comparison of rainfall amount for 30-minute and 24-hour duration events
Recurrence Period 30-minute Rainfall (inches) 24-hour Rainfall (inches)
1-year 0.9 2.3
2-year 1.1 2.8
5-year 1.45 3.5
10-year 1.65 4.1
25-year 1.9 4.8
50-year 2.1 5.3
100-year 2.4 5.9
Updates to the precipitation frequency and duration estimates for the Midwestern region are currently
being prepared by the National Oceanic and Atmospheric Administration (NOAA). The project area
includes Minnesota, North Dakota, South Dakota, Nebraska, Kansas, Oklahoma, Colorado, Iowa,
Missouri, Wisconsin, and Michigan. The NOAA is currently in the process of reviewing and
reformatting precipitation data from numerous local, state, and federal sources. Precipitation frequency
analysis is expected to occur in upcoming months, with draft results to be peer reviewed in the summer of
2011, and final results expected in the spring of 2012.
A common practice in rainfall-runoff
analysis is to utilize synthetic rainfall
distributions in lieu of actual rainfall
events. The Natural Resource
Conservation Service (NRCS), formerly
known as the Soil Conservation Service
(SCS), developed four 24-hour synthetic
rainfall distributions that represent the
various geographic regions of the nation
(Figure 4). As described in the HEC-HMS
User‟s Manual, each distribution contains
Figure 4. SCS 24-hour Rainfall Distributions (USDA, 1986)
P:\Mpls\23 MN\62\23621050 MIDS\WorkFiles\PerformanceGoals\PrecipSnowEvapTranspiration\Memo\Precipitation_FinalMemo.docx

To: MIDS Work Group
From: Barr Engineering Company
Subject: Regional Hydrologic Metrics – Precipitation (Item 3, Work Order 1)
Date: December 27, 2010
Page: 5
Project: 23621050 MIDS
rainfall intensities arranged to maximize the peak runoff for a given total storm rainfall amount. The
distribution is designed to „nest‟ all storm durations (24 hours and less) and related peak intensities into a
single 24-hour distribution that can be applied to watersheds of varying size. A storm period of 24 hours
was chosen by the SCS for the synthetic distribution because, while longer than needed for determining
peak runoff from most watersheds, the longer duration was appropriate for determining runoff volumes
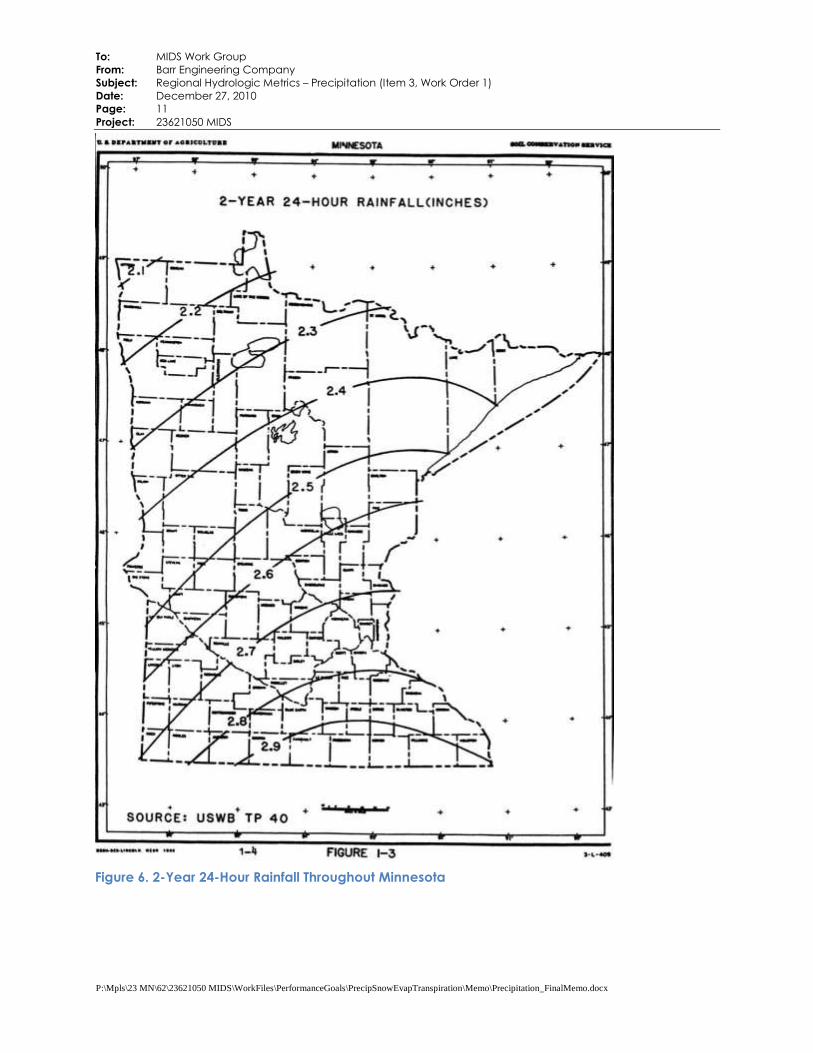
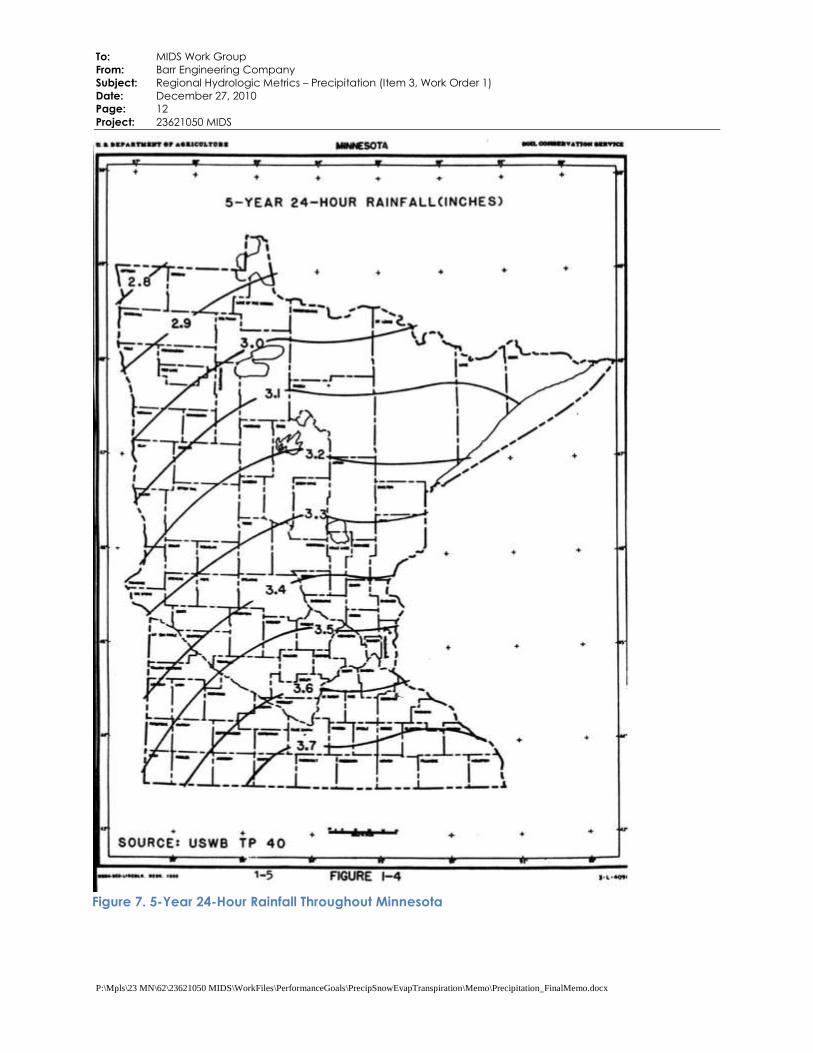
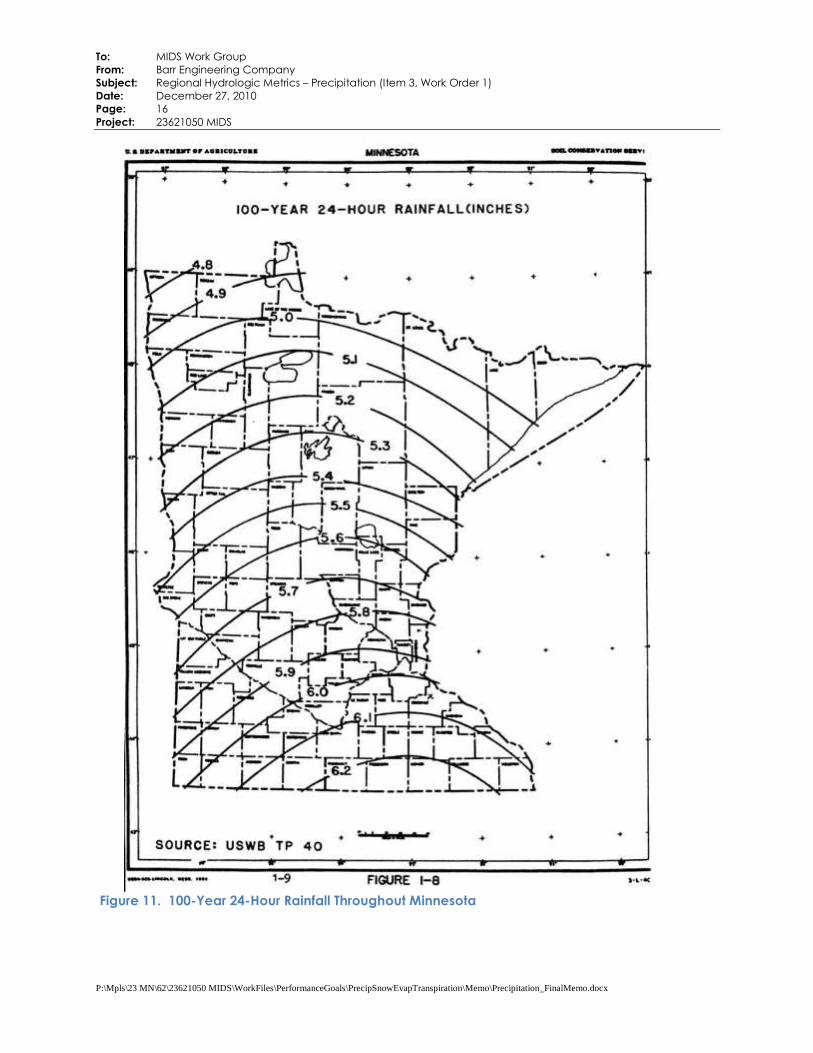
(USDA, 1986). The TP 40 24-hour duration rainfall isopleths for Minnesota for the 1-, 2-, 5-, 10-, 25-,
50-, and 100-year frequency rainfall are presented in Figures 5 through 11 on pages 8 through 14 of this
memorandum, respectively.
Similar to “normal” annual precipitation, there is significant variation in 24-hour precipitation throughout
the state. Table 2 summarizes the variability in 24-hour precipitation throughout the state for the 1-, 2-,
5-, 10-, 25-, 50-, and 100-year.
Table 2. Variability of 24-hour duration precipitation amounts throughout Minnesota
Recurrence Period Range of Precipitation throughout Minnesota
(inches)
1-year 1.8 – 2.6
2-year 2.1 – 2.9
5-year 2.8 – 3.7
10-year 3.3 – 4.4
25-year 3.9 – 5.0
50-year 4.4 – 5.6
100-year 4.8 – 6.2
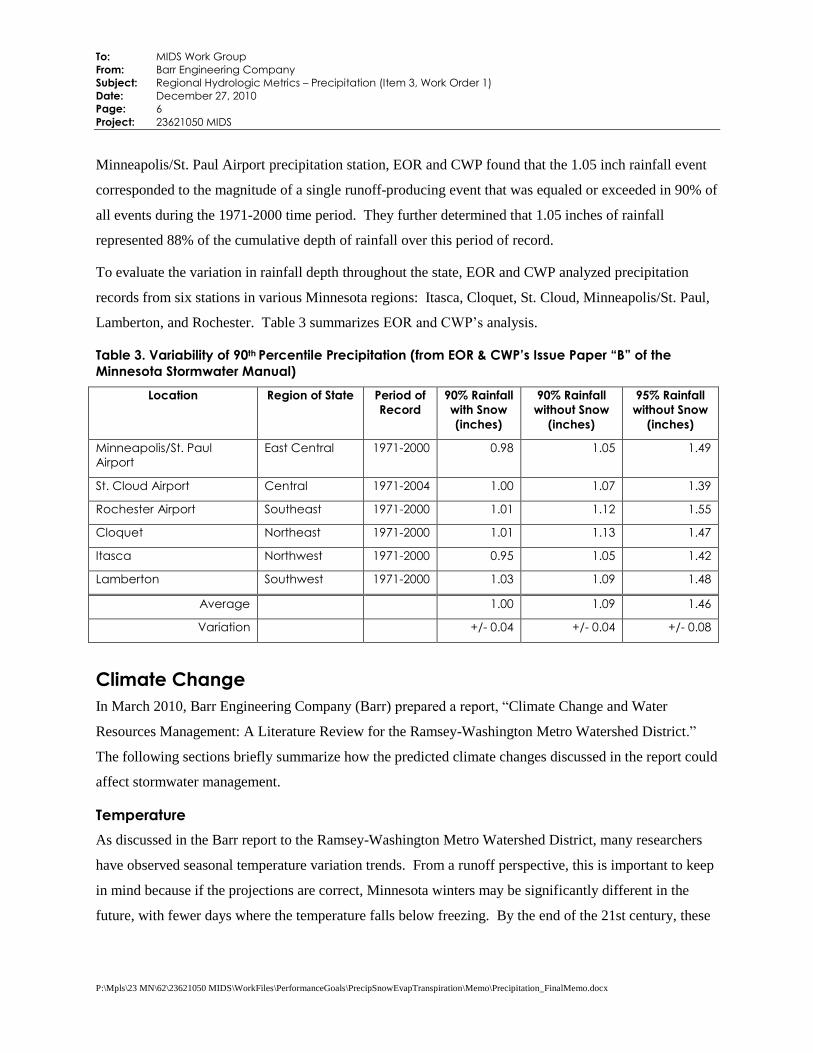
90th Percentile Precipitation Frequency
In Issue Paper “B” of the MPCA‟s Minnesota Stormwater Manual
(http://www.pca.state.mn.us/index.php/view-document.html?gid=8939), Emmons & Olivier Resources
(EOR) and the Center for Watershed Protection (CWP) analyzed rainfall frequency to determine the 90th
percentile rainfall depth. The 90th percentile rainfall depth represents the depth of rainfall in which 90%
of the runoff-producing rainfall events were less than or equal to for the time period analyzed. For the
P:\Mpls\23 MN\62\23621050 MIDS\WorkFiles\PerformanceGoals\PrecipSnowEvapTranspiration\Memo\Precipitation_FinalMemo.docx
To: MIDS Work Group
From: Barr Engineering Company
Subject: Regional Hydrologic Metrics – Precipitation (Item 3, Work Order 1)
Date: December 27, 2010
Page: 6
Project: 23621050 MIDS
Minneapolis/St. Paul Airport precipitation station, EOR and CWP found that the 1.05 inch rainfall event
corresponded to the magnitude of a single runoff-producing event that was equaled or exceeded in 90% of
all events during the 1971-2000 time period. They further determined that 1.05 inches of rainfall
represented 88% of the cumulative depth of rainfall over this period of record.
To evaluate the variation in rainfall depth throughout the state, EOR and CWP analyzed precipitation
records from six stations in various Minnesota regions: Itasca, Cloquet, St. Cloud, Minneapolis/St. Paul,
Lamberton, and Rochester. Table 3 summarizes EOR and CWP‟s analysis.
Table 3. Variability of 90th Percentile Precipitation (from EOR & CWP’s Issue Paper “B” of the
Minnesota Stormwater Manual)
Location Region of State Period of
Record
90% Rainfall
with Snow
(inches)
90% Rainfall
without Snow
(inches)
95% Rainfall
without Snow
(inches)
Minneapolis/St. Paul
Airport
East Central 1971-2000 0.98 1.05 1.49
St. Cloud Airport Central 1971-2004 1.00 1.07 1.39
Rochester Airport Southeast 1971-2000 1.01 1.12 1.55
Cloquet Northeast 1971-2000 1.01 1.13 1.47
Itasca Northwest 1971-2000 0.95 1.05 1.42
Lamberton Southwest 1971-2000 1.03 1.09 1.48
Average 1.00 1.09 1.46
Variation +/- 0.04 +/- 0.04 +/- 0.08
Climate Change
In March 2010, Barr Engineering Company (Barr) prepared a report, “Climate Change and Water
Resources Management: A Literature Review for the Ramsey-Washington Metro Watershed District.”
The following sections briefly summarize how the predicted climate changes discussed in the report could
affect stormwater management.
Temperature
As discussed in the Barr report to the Ramsey-Washington Metro Watershed District, many researchers
have observed seasonal temperature variation trends. From a runoff perspective, this is important to keep
in mind because if the projections are correct, Minnesota winters may be significantly different in the
future, with fewer days where the temperature falls below freezing. By the end of the 21st century, these
P:\Mpls\23 MN\62\23621050 MIDS\WorkFiles\PerformanceGoals\PrecipSnowEvapTranspiration\Memo\Precipitation_FinalMemo.docx
To: MIDS Work Group
From: Barr Engineering Company
Subject: Regional Hydrologic Metrics – Precipitation (Item 3, Work Order 1)
Date: December 27, 2010
Page: 7
Project: 23621050 MIDS
changes could result in a shortening of the frost season in the Midwest by moving the date of autumn frost
35 days later and the date of the last spring frost 15 to 35 days earlier (Wuebbles and Hayhoe, 2004).
Precipitation
Generally, precipitation in Minnesota has been rising (though not uniformly) since the dust bowl years of
the 1930s. Research shows that the observed increase in annual precipitation in North America during the
20th century is due to an increased frequency of heavy to extreme precipitation events (Karl and Knight
1998). Groisman et al (2001) reported a 50% increase during the 20th century in the frequency of days
with precipitation exceeding four inches in the upper Midwest. In response to the question, “Are larger
precipitation events as portions of the total precipitation in a year changing?,” the State Climatologist
responded, “Yes, the amount of precipitation occurring as large events has been increasing for decades
but about 100 years ago that fraction was similar to or even higher than what it is today.”
Increases in the intensity and/or frequency of extreme flood-producing precipitation events is a plausible,
though not certain, outcome of global warming. The most recent assessment of the Intergovernmental
Panel on Climate Change (IPCC) asserts that increases in North American extreme precipitation events
are highly likely in the future as a result of climate forcing by increasing greenhouse gas concentrations
(Kunkel, 2003).
Changes to annual average precipitation in the Midwest could be as minor as 0 to 10% (Christiansen et al
2007), but many model projections indicate that there will be a shift in the seasonal distribution of the
precipitation. Average winter precipitation across the region is likely to increase (up by 30% at the end of
the century), while summer precipitation will likely remain the same or increase (Wuebbles and Hayhoe,
2004). Coupled with model projections of little net change in annual average precipitation but increased
occurrence of precipitation intensity, this indicates that although rain may fall in more intense events, it
may also fall less frequently, leaving drier periods between events and possibly increasing the risk of
drought as well (Wuebbles and Hayhoe, 2004).
From a stormwater management perspective, if these predicted changes in precipitation occur, water
quality treatment and flood protection Best Management Practices (BMPs) may need to be sized larger to
capture and treat the runoff from the predicted more intense events. In addition, the predicted longer dry
periods between precipitation events may result in greater stress to the vegetation in vegetated BMPs.
P:\Mpls\23 MN\62\23621050 MIDS\WorkFiles\PerformanceGoals\PrecipSnowEvapTranspiration\Memo\Precipitation_FinalMemo.docx

To: MIDS Work Group
From: Barr Engineering Company
Subject: Regional Hydrologic Metrics – Precipitation (Item 3, Work Order 1)
Date: December 27, 2010
Page: 8
Project: 23621050 MIDS
Figure 12. Estimated Mean Evapotranspiration
(in inches) throughout Minnesota
Evaporation and Evapotranspiration
Precipitation falling to the ground surface generally
either runs off the land to nearby surface waters or is
stored in the soil. A significant portion of the water
stored in the soil will return to the atmosphere as
vapor through evapotranspiration1 (when plants are
present) or evaporation2, with the remaining
infiltrating through the soil profile and replenishing
groundwater supplies. The average water budget in
Minnesota was approximated in a 1979 study, in
which it was estimated that 76% of the annual
precipitation is returned to the atmosphere through
evapotranspiration, with 24% running off to surface
water and infiltrating to groundwater (Baker, et al,
1979). Evapotranspiration is difficult to directly and
accurately measure, and is most often estimated
using a water balance approach. Mean evapotranspiration estimates made based on the difference
between precipitation and runoff indicate that annual evapotranspiration varies significantly throughout
the state, with the greatest rates in the southern part of Minnesota (Baker, et al, 1979) (Figure 12).
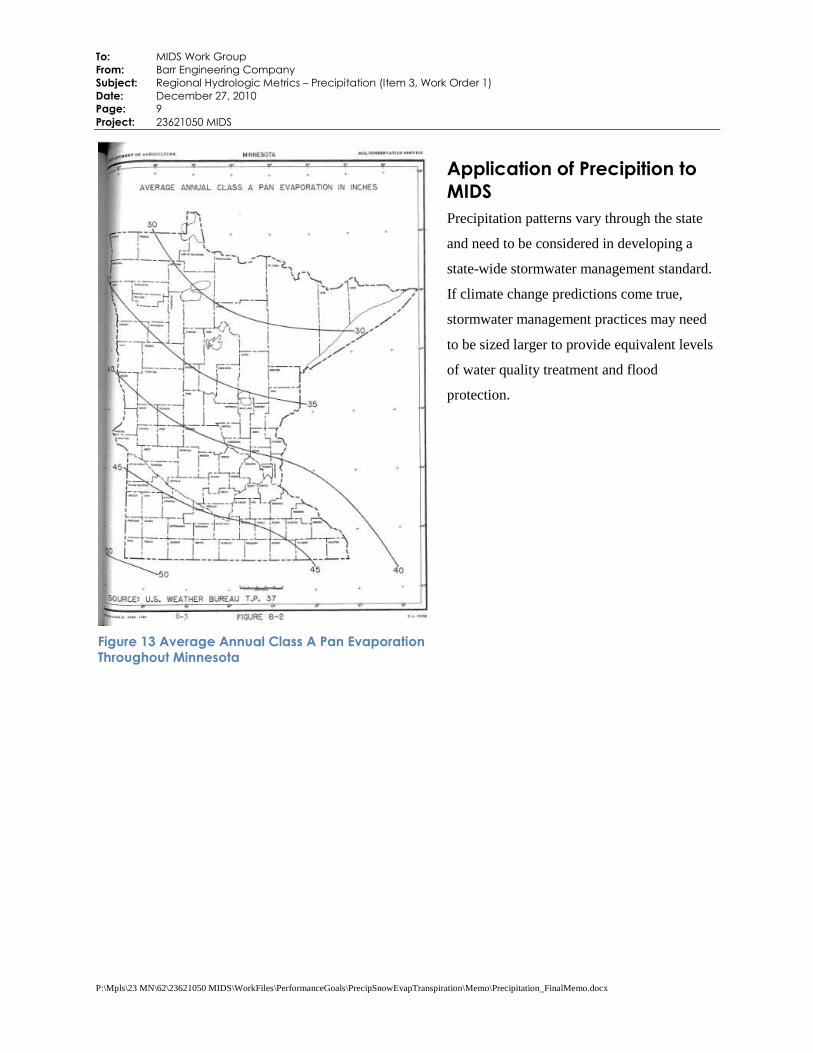
Evapotranspiration can also be approximated based on evaporation of water from pans. Average annual
Class A pan evaporation throughout the state, shown in Figure 13, increases in a general pattern from the
northeast corner of the state toward the southwest corner (U.S. Weather Bureau T.P. 37).
1 Evapotranspiration is the process by which plants remove soil moisture through roots and release it back to the
atmosphere. 2
Evaporation is the when solar energy vaporizes water from water bodies, soil, and other source of water.
P:\Mpls\23 MN\62\23621050 MIDS\WorkFiles\PerformanceGoals\PrecipSnowEvapTranspiration\Memo\Precipitation_FinalMemo.docx
To: MIDS Work Group
From: Barr Engineering Company
Subject: Regional Hydrologic Metrics – Precipitation (Item 3, Work Order 1)
Date: December 27, 2010
Page: 9
Project: 23621050 MIDS
Application of Precipition to
MIDS
Precipitation patterns vary through the state
and need to be considered in developing a
state-wide stormwater management standard.
If climate change predictions come true,
stormwater management practices may need
to be sized larger to provide equivalent levels
of water quality treatment and flood
protection.
Figure 13 Average Annual Class A Pan Evaporation Throughout Minnesota
P:\Mpls\23 MN\62\23621050 MIDS\WorkFiles\PerformanceGoals\PrecipSnowEvapTranspiration\Memo\Precipitation_FinalMemo.docx

To: MIDS Work Group
From: Barr Engineering Company
Subject: Regional Hydrologic Metrics – Precipitation (Item 3, Work Order 1)
Date: December 27, 2010
Page: 10
Project: 23621050 MIDS
Figure 5. 1-Year 24-Hour Rainfall Throughout Minnesota
P:\Mpls\23 MN\62\23621050 MIDS\WorkFiles\PerformanceGoals\PrecipSnowEvapTranspiration\Memo\Precipitation_FinalMemo.docx
To: MIDS Work Group
From: Barr Engineering Company
Subject: Regional Hydrologic Metrics – Precipitation (Item 3, Work Order 1)
Date: December 27, 2010
Page: 11
Project: 23621050 MIDS
Figure 6. 2-Year 24-Hour Rainfall Throughout Minnesota
P:\Mpls\23 MN\62\23621050 MIDS\WorkFiles\PerformanceGoals\PrecipSnowEvapTranspiration\Memo\Precipitation_FinalMemo.docx
To: MIDS Work Group
From: Barr Engineering Company
Subject: Regional Hydrologic Metrics – Precipitation (Item 3, Work Order 1)
Date: December 27, 2010
Page: 12
Project: 23621050 MIDS
Figure 7. 5-Year 24-Hour Rainfall Throughout Minnesota
P:\Mpls\23 MN\62\23621050 MIDS\WorkFiles\PerformanceGoals\PrecipSnowEvapTranspiration\Memo\Precipitation_FinalMemo.docx

To: MIDS Work Group
From: Barr Engineering Company
Subject: Regional Hydrologic Metrics – Precipitation (Item 3, Work Order 1)
Date: December 27, 2010
Page: 13
Project: 23621050 MIDS
Figure 8. 10-Year 24-Hour Rainfall Throughout Minnesota
P:\Mpls\23 MN\62\23621050 MIDS\WorkFiles\PerformanceGoals\PrecipSnowEvapTranspiration\Memo\Precipitation_FinalMemo.docx

To: MIDS Work Group
From: Barr Engineering Company
Subject: Regional Hydrologic Metrics – Precipitation (Item 3, Work Order 1)
Date: December 27, 2010
Page: 14
Project: 23621050 MIDS
Figure 9. 25-Year 24-Hour Rainfall Throughout Minnesota
P:\Mpls\23 MN\62\23621050 MIDS\WorkFiles\PerformanceGoals\PrecipSnowEvapTranspiration\Memo\Precipitation_FinalMemo.docx

To: MIDS Work Group
From: Barr Engineering Company
Subject: Regional Hydrologic Metrics – Precipitation (Item 3, Work Order 1)
Date: December 27, 2010
Page: 15
Project: 23621050 MIDS
Figure 10. 50-Year 24-Hour Rainfall Throughout Minnesota
P:\Mpls\23 MN\62\23621050 MIDS\WorkFiles\PerformanceGoals\PrecipSnowEvapTranspiration\Memo\Precipitation_FinalMemo.docx
To: MIDS Work Group
From: Barr Engineering Company
Subject: Regional Hydrologic Metrics – Precipitation (Item 3, Work Order 1)
Date: December 27, 2010
Page: 16
Project: 23621050 MIDS
Figure 11. 100-Year 24-Hour Rainfall Throughout Minnesota
P:\Mpls\23 MN\62\23621050 MIDS\WorkFiles\PerformanceGoals\PrecipSnowEvapTranspiration\Memo\Precipitation_FinalMemo.docx
To: MIDS Work Group
From: Barr Engineering Company
Subject: Regional Hydrologic Metrics – Precipitation (Item 3, Work Order 1)
Date: December 27, 2010
Page: 17
Project: 23621050 MIDS
References
Baker, Donald, G.W. Nelson, and E. Kuenast. Technical Bulletin 322. Climate of Minnesota Part XII-
The Hydrologic Cycle and Soil Water. 1979.
Barr Engineering Company. Climate Change and Water Resources Management: A Literature Review
for the Ramsey-Washington Metro Watershed District. March 2010.
Christiansen, J.H., B. Hewitson, A. Busuioc, A. Chen, X. Gao, I. Held, R. Jones, R.K. Kolli, W.T. Kwon,
R. Laprise, V.M. Rueda, L. Mearns, C.G. Menendez, J. Raisanen, A. Rinke, A. Sarr and P. Whetton.
2007. Regional Climate Projections, in The Physical Science Basis. Contribution of Working Group I
to the Fourth Assessment Report of the Intergovernmental Panel on Climate Change, edited by S.
Solomon, et al. Cambridge University Press, New York, NY.
Emmons & Olivier Resources and Center for Watershed Protection. Issue Paper “B,” Precipitation
Frequency Analysis and Use. January 5, 2005.
Groisman P.Y., R.W. Knight and T.R. Karl. 2001. Heavy Precipitation and High Streamflow in the
Contiguous United States: Trends in the Twentieth Century. Bulletin of the American Meterological
Society. Volume 82, No. 2. Pages 219 to 246.
Karl, T.R. and R.W. Knight. 1998. Secular trends of precipitation amount, frequency, and intensity in the
U.S.A. Bulletin of the American Meterological Society. 79: 231-241.
Kunkel, K.E. 2003. North American Trends in Extreme Precipitation. Natural Hazards 29: 291-305.
Kluwer Academic Publishers.
U.S. Department of Agriculture (USDA) National Resources Conservation Service. Urban Hydrology for
Small Watersheds Technical Release (TR) 55. June 1986.
U.S. Weather Bureau, Technical Paper (T.P.) No. 37. Evaporation Maps of the United States. 1959
U.S. Weather Bureau, Technical Paper (T.P.) No. 40. Rainfall Frequency Atlas of the United States for
Durations from 30 Minutes to 24 Hours and Return Periods from 1 to 100 Years. 1961
Wuebbles, D.J. and K. Hayhoe. 2004. Climate Change Projections for the United States Midwest.
Mitigation and Adaptation Strategies for Global Change 9: 335-363. Kluwer Academic Publishers.
P:\Mpls\23 MN\62\23621050 MIDS\WorkFiles\PerformanceGoals\PrecipSnowEvapTranspiration\Memo\Precipitation_FinalMemo.docx