mini-course series - mutual funds (part 5)
DESCRIPTION
The information included in the "Mini-Course Series - Mutual Funds" is representative of the Institute of Business & Finance materials used in the Certified Fund Specialist designation program.TRANSCRIPT
Copyright © 2012 by Institute of Business & Finance. All rights reserved.
MINI-COURSE SERIES
MUTUAL FUNDS
Part V
MUTUAL FUNDS 1
PART V
IBF MINI-COURSE SERIES
FUND SELECTION
Before investing in a mutual fund, the following six questions should be answered:
1. Does the fund fulfill the investor’s objective?
2. How has the fund performed?
3. What has been the fund’s risk level?
4. Who manages the fund?
5. What does it cost to own the fund?
6. What other funds are in the same fund family?
If you want to make sure that you are going to be comfortable with a fund, do a simple
check to see whether you can tolerate those periods when the fund is in the red. Look at
how much the fund has lost in the past and ask yourself if your client could hold on dur-
ing those periods.
Every mutual fund has one or more objectives and so should every investor. Each fund’s
objective is appreciation, income, or a combination of both. A fund’s objective (point #1
above) is usually more important than the skills of its manager(s). Most performance
is related to being in the right category at the right time. If a category is doing well, even
a mediocre manager is likely to turn in good numbers.
MANAGER OWNERSHIP
Manager ownership can be found in the fund’s SAI (SEC form 485 BPOS). The infor-
mation can also be obtained by going to the SEC database www.sec.gov/edgar.shtml. Ac-
cording to a 2006 study, the fund family with the highest average manager investment in
one or more of its funds was Janus ($1,000,000 average); Royce Funds ranked number
two ($900,000). American Funds diversified domestic stock managers averaged
$600,000, while T. Rowe Price investment averaged $500,000 per manager.
The next two highest fund groups were Fidelity ($450,000) and Vanguard ($400,000).
The study gives a special mention to Oakmark, a comparatively small fund company;
their employees collectively had roughly $150 million of their own money in Oakmark
funds.

MUTUAL FUNDS 2
PART V
IBF MINI-COURSE SERIES
At the other end of the spectrum are TIAA-CREF and Federated funds. For Federated,
the average amount invested by a manager was $110,000 (with over half of their funds,
there was no management investment); in the case of TIAA-CREF, the average was just
$10,000. According to a July 2006 article in The Wall Street Journal, fewer than half of
U.S. mutual funds included investments by managers.
A study done by Georgia Institute of Technology and London Business School found that
funds with managers who owned some fund shares at the end of 2004 delivered an
average return of 8.7% in the following year. This exceeded the 6.2% average re-
turn by funds without management ownership over the same period. As of the begin-
ning of 2007, of the 500 mutual funds most highly recommended by Morningstar, more
than 150 managers had each invested more than $1 million in their funds.
MANAGEMENT EXPERIENCE
In a past study, we looked at the 25 largest funds, and found that the typical big fund
boasts a management team with more than eight years’ tenure. A good rule of thumb
is to search out managers who have logged at least 10 years as an analyst or manager; at a
bare minimum, you want a manager who was on board during the 2000-2002 bear market
as well as the heady days of the late 1990s.
Experience alone is not enough; where a manager was trained is just as important. Seek
out managers who learned to invest from skilled managers, or who learned at a company
with lots of great funds. The key to get a handle on the quality of a manager’s support
team is to look at the records of funds from the same firm. If you are considering buying
a growth fund, be sure to check out all the growth funds managed by the family to see if
the firm excels at growth investing. You might find that the fund you are considering is a
gem, but it is surrounded by mediocrity.
According to a study by Standard & Poor’s, the average tenure of a large company stock
fund was 5.6 years, for the five years ending 12/31/2006. The managers whose perfor-
mance consistently ranked in the top half had an average tenure of 9.5 years. In a
different S&P study, manager tenure was “a primary differentiator” of the funds that beat
their peers.
MUTUAL FUNDS 3
PART V
IBF MINI-COURSE SERIES
MUNICIPAL BOND DEFAULT RATES
High-yield municipal bond funds generally do not assume as much credit risk as their
corporate counterparts. This reflects the fact that there simply are not as many seriously
troubled municipalities as there are companies. Some junk funds may move a portion of their
assets into better-grade bonds when the yield spread between the two narrows to the point
where there is not enough to compensate investors for the added risk.
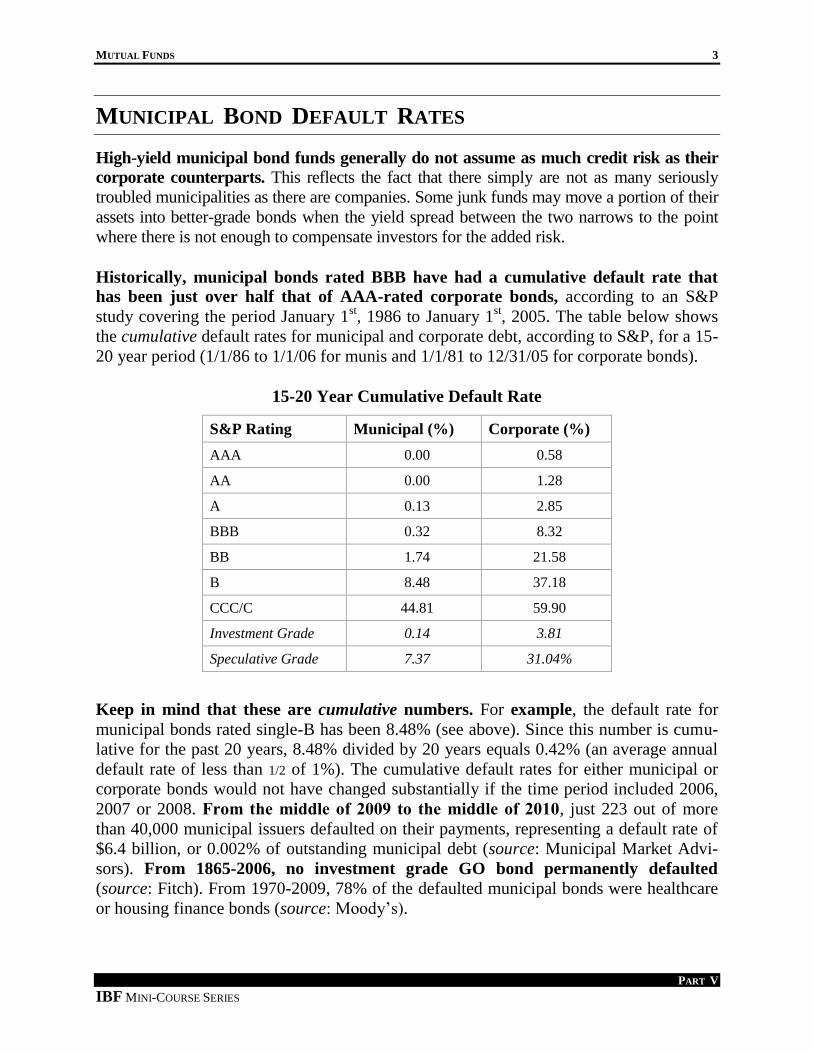
Historically, municipal bonds rated BBB have had a cumulative default rate that
has been just over half that of AAA-rated corporate bonds, according to an S&P
study covering the period January 1st, 1986 to January 1
st, 2005. The table below shows
the cumulative default rates for municipal and corporate debt, according to S&P, for a 15-
20 year period (1/1/86 to 1/1/06 for munis and 1/1/81 to 12/31/05 for corporate bonds).
15-20 Year Cumulative Default Rate
S&P Rating Municipal (%) Corporate (%)
AAA 0.00 0.58
AA 0.00 1.28
A 0.13 2.85
BBB 0.32 8.32
BB 1.74 21.58
B 8.48 37.18
CCC/C 44.81 59.90
Investment Grade 0.14 3.81
Speculative Grade 7.37 31.04%
Keep in mind that these are cumulative numbers. For example, the default rate for
municipal bonds rated single-B has been 8.48% (see above). Since this number is cumu-
lative for the past 20 years, 8.48% divided by 20 years equals 0.42% (an average annual
default rate of less than 1/2 of 1%). The cumulative default rates for either municipal or
corporate bonds would not have changed substantially if the time period included 2006,
2007 or 2008. From the middle of 2009 to the middle of 2010, just 223 out of more
than 40,000 municipal issuers defaulted on their payments, representing a default rate of
$6.4 billion, or 0.002% of outstanding municipal debt (source: Municipal Market Advi-
sors). From 1865-2006, no investment grade GO bond permanently defaulted
(source: Fitch). From 1970-2009, 78% of the defaulted municipal bonds were healthcare
or housing finance bonds (source: Moody’s).
MUTUAL FUNDS 4
PART V
IBF MINI-COURSE SERIES
The overall (cumulative) default rate for all municipal bonds, including “junk,” was
1/10th
of 1% from 1970-2005. The 2005-2009 cumulative default rate for investment
grade municipal bonds was 3/100th
of 1% (6/1000th
of 1% a year). From 1970-2009, 78%
of the municipal bonds that defaulted were healthcare or housing finance bonds (source:
Moody’s). Mutual funds and ETFs manage 70% of the $2.9 trillion municipal bond mar-
ket.
Recent Default Rates The 2010 default rate for all municipal bonds was < 1/10
th of 1%
The 2009 default rate for all municipal bonds was < 3/1000th
of 1%
The 2008 default rate for all municipal bonds was < 3/1000th
of 1%
CLOSED-END MUNI PORTFOLIOS
Introduced in 1987, closed-end municipal bond funds have proven to be quite popular
and now constitute the largest segment in the closed-end universe. Closed-end fund mu-
nis include national, single-state, insured, and high-yield varieties. With these lesser-known
products, you can sometimes buy a dollar's worth of selected munis for 90-95¢. Closed-end
muni funds have several potentially attractive attributes compared to their open-end rela-
tives:
They appeal to traders who like to buy at a discount and sell when the markdown nar-
rows or turns to a premium.
Closed-end managers are not forced to sell bonds to raise cash to meet redemptions dur-
ing unfavorable times. In addition, because they do not need to maintain a cash cushion,
they can remain fully invested in the hopes of generating a higher return.
By assuming more risk, leveraged closed-end products can outperform unleveraged mu-
tual funds during periods of stable or declining rates.
Bill Gross of PIMCO, considered to be one of the very best bond fund managers,
owns a number of discounted closed-end municipal bond funds.
MUTUAL FUNDS 5
PART V
IBF MINI-COURSE SERIES
CUSHION AGAINST STOCK DECLINES
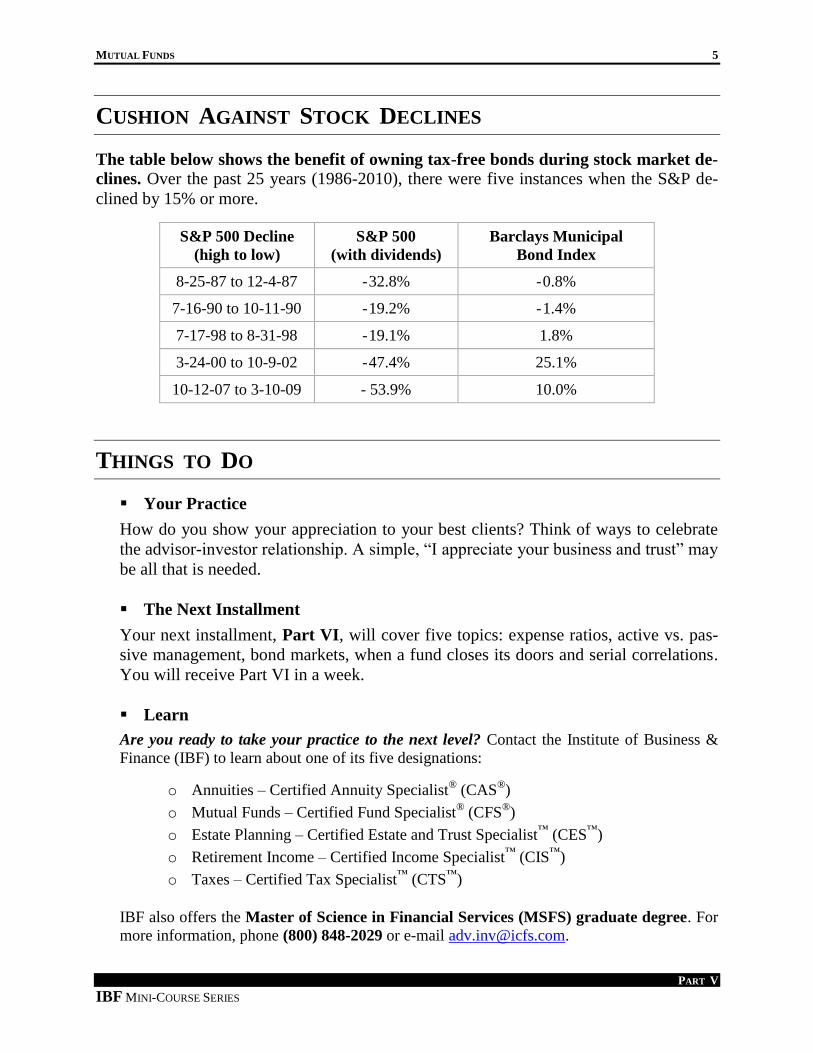
The table below shows the benefit of owning tax-free bonds during stock market de-
clines. Over the past 25 years (1986-2010), there were five instances when the S&P de-
clined by 15% or more.
S&P 500 Decline
(high to low)
S&P 500
(with dividends)
Barclays Municipal
Bond Index
8-25-87 to 12-4-87 - 32.8% - 0.8%
7-16-90 to 10-11-90 - 19.2% - 1.4%
7-17-98 to 8-31-98 - 19.1% 1.8%
3-24-00 to 10-9-02 - 47.4% 25.1%
10-12-07 to 3-10-09 - 53.9% 10.0%
THINGS TO DO
Your Practice
How do you show your appreciation to your best clients? Think of ways to celebrate
the advisor-investor relationship. A simple, “I appreciate your business and trust” may
be all that is needed.
The Next Installment
Your next installment, Part VI, will cover five topics: expense ratios, active vs. pas-
sive management, bond markets, when a fund closes its doors and serial correlations.
You will receive Part VI in a week.
Learn
Are you ready to take your practice to the next level? Contact the Institute of Business &
Finance (IBF) to learn about one of its five designations:
o Annuities – Certified Annuity Specialist®
(CAS®)
o Mutual Funds – Certified Fund Specialist® (CFS
®)
o Estate Planning – Certified Estate and Trust Specialist™
(CES™
)
o Retirement Income – Certified Income Specialist™
(CIS™
)
o Taxes – Certified Tax Specialist™
(CTS™
)
IBF also offers the Master of Science in Financial Services (MSFS) graduate degree. For
more information, phone (800) 848-2029 or e-mail [email protected].