mineralogy and radiation effects of microlite from the...
TRANSCRIPT

American Mineralogist, Volume 71, pages 569-588, 1986
Mineralogy and radiation effects of microlite from the Harding pegmatite'Taos County, New Mexico
G. R. LurvrpxrN. B. C. CnlxouMAKos" aNo R. C. EwINcDeparfinent of Geology, University of New Mexico, Albuquerque, New Mexico 87131
Ansrucr
Microlite, rangrng from crystalline to metamict, is a principal accessory in several lith-ologic units of the Harding pegmatite, Taos County, New Mexico. From the sequence oflithologic units within the pegmatite, crystallization of microlite from the pegmatite magmais inferred to have begun relatively late, after the formation of the beryl and quartz zones,and continued throughout the formation of the core zones and subsolidus replacementunits. Over 200 chemical analyses of microlite determined by electron microprobe arereported, and they are consistent with the accepted structural formula, A2-^B2X6Y.-,'pHrO, where principally A : Ca, Na, IJ, Mn; B : Ta, Nb, Ti; X : O; and Y : F, OH, O.General features of microlite crystal chemistry identified include (l) a positive correlationbetween A-site vacancies and the maximum Y-site vacancies, (2) a positive correlationbetween Na and F, and (3) a negative correlation between U and F. The latter is consistentwith the interpretation that U at the A site in the pyrochlore structure is analogous to theuranyl group , UO3* , requiring O in place of F at the Y site. Microlite compositions fromfour of five lithologic units examined are chemically distinct in terms of linear combinationsof the variables IJ, Fe, Ti, Bi, Ca, Ce, Pb, F, Mn, Ba, Sb, Th, Ta, and Na. The cleavelandite-unit microlites, the exception, not surprisingly have chemistries like those of the quartz-
lath spodumene zone, which the cleavelandite unit in part has replaced. The earliest-formedmicrolites from the quartz-lath spodumene zone have the highest Ta, Na, and F and arelow in U and Mn. In contrast, microlites from the later microcline-spodumene zone andthe replacement units are generally higher in Ti, Mn, and U and lower in F and Na.Chemical changes ascribed to primary hydrothermal alteration from residual pegmatitic
fluids include increases in Ca, Mn, and Ti and an overall loss of A-site cations. Alterationeffects and chemical zoning within crystals, analyzed in terms of simple end members,identifies the following principal substitution schemes: BNb- BTa,BTa - BNb, ACaYO +ANaYF and AEYE - aNaYF for core-to-rim zoning in crystals and ACaYO - ANaYF andACaYO - AEY! for primary alteration. Secondary (weathering) alteration results in de-creases in Na, Ca, and F and increases in HrO.
The effects of alpha-recoil damage due to the decay of constituent U have been examined.Because of the wide variation in U content (0.1-10 wto/o UOr), the microlites exhibit thefull range of structural periodicity from completely crystalline (< I dpa), partially crystalline(up to lf20 dpa) to completely X-ray and electron diffraction amorphous (>20 dpa).Based on X-ray and electron ditrraction analysis, the progressive structural modificationof microlite udth increasing alpha dose involves (1) formation of isolated defect aggregates(i.e., individual alpha-recoil tracks) up through doses of l0'4 alphas/mg with no detectableeffect on the materials's ability to diffract X-rays or electrons, (2) continued damage andoverlap of these defect aggregates yielding coexisting regions of amorphous and crystallinedomains at l0rs to 1016 alphas/mg, and (3) complete amorphization at doses greater than10'7 alphas/mg.
IxrnonucrroN
Minerals of the pyrochlore group (Fd3m, Z: 8) havethe general formula Ar-. B rXuY ,-,'pHrO, where A : Na,Ca, IJ, Pb, Sr, Th, REE, Bi, Sn2+, Ba, Mn, Fe2+;B: Ta,Nb, Ti, h, Fe3+, Sna+, W; X : O; and Y : O, OH, F.Hogarth (1977) defined the microlite subgroup to haveTa > Nb and Nb + Ta > 2Ti. Most natural composi-
0003-o04x/86/0304-0569$02.00 569
tions have <10 molo/o Ti and <25 molo/o Nb (Lumpkinand Ewing, 1985). Except for a single report of microliteoccurring in a granite (Sitnin and Bykova, 1962), mostmicrolites are found in granitic pegmatites of the rare-element class (Grnj', 1982; Cernf and Burt, 1984). Thetypical accessory minerals associated with microlite in-clude zircon, stibiotantalite, bismutotantalite, columbite-

570 LUMPKIN ET AL.: MICROLITE FROM HARDING PEGMATITE
tantalite, rynersonite, wodginite, and simpsonite (VonKnorring and Fadipe, l98l; Foord, 1982).
Microlite was first described from the Harding peg-matite by Hirschi (1931), and during the period 1942-1947 over I I tons were produced by hand-mining meth-ods (Jahns and Ewing, 1976, 1977). The microlite con-centrates averaged 68 wto/o TarO, and 7 wto/o NbrOr. Thefirst complete chemical analyses correlated the change fromlight to dark color in five microlites with decreasing TalNb ratio and increasing OH/F ratio and the U, Ti, andMn content (Jahns and Ewing, 1976). Partial electron-microprobe analyses (Suchomel, 1976) confirmed thesetrends for Ta,/Nb, Ti, and Mn. Suchomel did not analyzefor F and U, so the analyses do not conform to the py-rochlore structural formula (Chakoumakos, I 97 8).
Microlites are stable from ca. 500'C and 5 kbar downto ambient, near-surface conditions and can accommo-date a variety of rare elements as a function T, P, andmelVfluid composition. Microlites from African localitieswere broadly classified as primary, secondary, and uran-iferous types by Von Knorring and Fadipe (1981). Theysuggested that with time, microlites generally show de-creasing amounts of Ta, Ca, and F with increasing con-centrations of Ti, U, Sb, Bi, Pb, and HrO. However, littleis known about chemical variations in microlites withinindividual pegmatites (cf., Mih6lik, 1967; Foord,, 1976).The abundance of microlite in several lithologic units ofthe Harding pegmatite provides an excellent opportunityto examine these chemical trends.
Prior to this work, Suchomel (1976) noted higherNbrO,and lower TarO, contents in microlites from the micro-cline-spodumene zone ("spotted rock") relative to thosefrom other units. Chakoumakos ( I 978) made an extensivepetrographic and X-ray diftaction study of 30 locatedsamples, three high-grade ore samples, and two analyzed,samples. No relationship between degree of crystallinityand lithologic unit was noted, implying that U does notvary systematically within the pegmatite. Most of Chak-oumakos' samples have been used in this study, alongwith additional specimens donated by Arthur Montgom-ery. The purpose of this paper is threefold: (l) to discussgeneral features of microlite crystal chemistry, (2) to ex-amine relationships between composition and lithologicunit using statistical analysis, and (3) to describe radiationeffects in microlites.
L,oc.c.rroN AND GENERAL GEoLocyThe Harding pegmatite is located in the Picuris Range
l0 km east ofDixon and 30 km southwest ofTaos in sec.29, T23N, Rl lE. The pegmatite lies within Precambrianrocks of the Vadito Group. The main dike is about 370m Iong and up to 80 m wide in outcrop. The body isroughly tabular in shape with a maximum thickness of 25m and an average plunge of I 0"S (Jahns and Ewing, I 976,1977). Exposures occur primarily along the boundary be-tween amphibolite (hanging wall) on the south and peliticschists (footwall) on the north (Long, 1974; Jahns and
Ewing, I 976). Bedding (So) and transposition layering (So/S,) trend N8"E in Vadito rocks north of the pegmatite.The primary foliation is slaty cleavage or schistosity (Sr)which trends Nl0'W and intersects bedding at a low angle(Holcombe and Callender, 1982). The pegmatite truncatesSo/S, and S, and must postdate F, and F, folding.
Several types ofgranitic rocks are present in the area.On the basis of field evidence and limited radiometricdating, Long (1974) considered the Harding and otherpegmatites to be late in the history ofgranitic magmatism.He suggested a separate magmatic event for the pegmatites100 m.y. later than the youngest (unfoliated) granite andas much as 300-400 m.y. later than the oldest (foliated)granitic rocks. Aldrich et al. (1958) determined K-Ar andRb-Sr ages of 1260 m.y. for lepidolite from the Hardingmine. Recent Rb-Sr ages of 1336 + 73 for the "spottedrock" core unit,1264 + 1 28 for rose muscovite, and 1246+ 40 m.y. for lepidolite were determined by Register (inBrookins el al., 1979).
INrnnNx, zoNING AND REpLACEMENT uNrrs
The main pegmatite dike is characterized by an asym-metric sequence of lithologic units from top to bottom.These consist of six primary zones and two replacementunits. The following description has been condensed fromJahns and Ewing (1976, 1977), Suchomel (1976), Chak-oumakos (1978), and Norton (1983).
The hanging-wall portion of the pegmatite consists ofthree primary zones. The continuous beryl zone includesa thin, fine-grained border rind and coarser-grained wallzone composed ofquartz, albite, and muscovite. Commonaccessory minerals are beryl, microcline, apatite, and co-lumbite-tantalite. Below this is the quartz zone, a fairlycontinuous unit of massive quartz with accessory mus-covite, microcline, and albite. The quartz zone is under-lain by a spectacular quartz-lath spodumene zone characleized by spodumene crystals up Io 2 m in length (seeFig. 6, Jahns and Ewing, 1976). Microlite, beryl, apatite,microcline, and lepidolite are common accassory mineralsnear the base ofthe discontinuous zone. The core ofthepegmatite in the western thick end is dominated by themicrocline-spodumene zone, otherwise known as "spottedrock." Microcline, spodumene, and quartz are the majorminerals with minor amounts of apatite, albite, microlite,and columbite-tantalite. Fine-grained lepidolite and Li-bearing muscovite commonly replace microcline andspodumene. Locally, the unit grades into nearly puremasses of lepidolite. Two primary zones occur beneaththe microcline-spodumene zone in the footwall portionof the pegmatite.The perthite zone is a discontinuous unitof blocky, perthitic microcline with minor quartz and al-bite. Beneath this is the aplite zone, composed of fine-grained albite and quartz with accessory beryl, apatite,and columbite-tantalite.
The primary zones have been replaced to varying de-grees by two units. The cleavelandite unit is composed ofplaty albite, qluarlz, and minor muscovite. It occurs pri-

LUMPKIN ET AL,: MICROLITE FROM HARDING PEGMATITE
t \
l ' . . F ' .1. 1
,F
. 8 -
w4I
Fig. 1. Photomicrographs of microlite from the quartz-lath spodumene zone (a, b, c), cleavelandite replacement unit (d)' and
microcline-spodumene zone ("spotted rock") (e, 0. Scale bars : 0.3 mm (a) Euhedral microlite (270) and columbite-tantalite (CT)
in quartz (a). 0) A cluster of subhedral microlite crystals (271) typical of high-grade ore. (c) Microlite in cleavelandite (Ab)
pr.udo111orpi1ic after spodumene. Crystals are zoned (arrows) toward the quartz interface. (d) An altered (A) microlite (P05.1) from
a cleavelandite mass in the beryl zone. Matrix minerals are cleavelandite and lepidolite (Lp). (e) Anhedral microlite (Pl5.1) showing
hydrothermal alteration along grain boundaries and fractures. Matrix mineral is microcline (Mc). (f) Altered and microfractured
microlite (P17.1) in a microcline matrix. Unaltered areas of some grains are Pb-rich (see text).
571
l . _ . ,
at
i2, . ' , |
A!
I

Q ----r-r
t c m
572 LUMPKIN ET AL.: MICROLITE FROM HARDING PEGMATITE
kerFig. 2. Schematic cross sections of cleavelandite (C) replace-
ments along possible pre-existing spodumene (S) laths. The ma-trix is pale smoky quartz (Q), which is dark smoky color (darkerQ) adjacent to microlite (M) crystals segregated along the baseof each "pseudomorph." The photomicrograph in Fig. lc is anenlarged detail of the microlite. Sketches are from hand samplesPl 1.3 (Chakoumakos, 1978).
marily in the core of the pegmatite, but also is found asscattered masses in the beryl zone (Chakoumakos, 1978).The rose mu"scovitHleavelandite unit mainly replacedparts of the quartz-lath spodumene zone (Heinrich andLevinson, 1953).
Mrcnor,rrn pETRocRApHy
The major occurrence of microlite is within the quartz-Iath spodumene and microcline-spodumene ("spottedrock") zones, It is rare in the quartz zone where it occursas honey-brown, microcrystalline aggregates along grainboundaries of accessory apatite (Suchomel, 1976). Mi-crolite occurs with columbite-tantalite in the quartz-lathspodumene zone as euhedral to subhedral crystals (0.1-5mm) poikilitically enclosed by quartz (Fig. I a). The quartzfills interstices between interlocking spodumene laths. Mi-crolite crystals tend to form dense aggregates (Fig. lb)which provided most of the high-grade Ta-Nb ore. Colorsrange from pink, colorless, and pale green to shades ofyellow and brown. Some crystals are zoned with light coresand dark rims. Lepidolite pods occurring near the base ofthe unit contain abundant, euhedral to subhedral, yellowmicrolite crystals (Montgomery, 1950).
In the microcline-spodumene zone, microlite is foundas disseminated, euhedral to anhedral crystals enclosed incoarse-grained microcline (Figs. le, lf). The color is darkbrown to black. Mostgrains are 1.0 to 5.0 mm in size.Associated minerals include columbite-tantalite, hafnianzircon, and lepidolite. The Ta-Nb minerals average 0.150/oin the microcline-spodumene zone, enough to considerthis as low-grade ore (Jahns and Ewing, 1976, 1977). Themost prominent alteration effects are observed in thesemicrolites. Reddish, hydrothermal (primary) alterationcommonly occurs along grain margins and may or maynot show fracture control. Brownish (secondary) alterationis confined to <2o-pm-wide regions along fractures andis believed to be the result of weathering (Lumpkin andEwing, 1985; Ewing, 1975; Van Wambeke, 1970).
Replacement units also contain microlite as an acces-sory phase. The microlites are enclosed in bladed albite
and associated with minor lepidolite, muscovite, andquartz within the cleavelandite unit (Fig. ld). Large eu-hedral crystals (up to I 5 mm) occur where the unit replacesthe beryl zone. They are often zoned from yellow coresto dark brown rims. Other crystals display an unusualmottled yellow/brown exterior coloration. In the core ofthe pegmatite, the cleavelandite unit mainly replaces thequartz-lath spodumene zone. Microlite is found in thisunit as euhedral to subhedral crystals (up to 3 mm) rangingin color from pale yellow to black. Many crystals showthis color change in core-to-rim zoning. Submillimeteryellow and brown microlites are associated with cleave-landite pseudomorphs after spodumene (Fig. 2). Crystalstend to be aligned near the edges of pseudomorphs whereadjacent quartz is darker in color. Color zoning is notprevalent, but a few grains show nonconcentric zoninginvolving a light-to-dark color change toward the cleave-landite-quartz interface (Fig. lc).
Microlite also occurs within a lepidolite-cleavelanditesubunit in eastern extensions of the pegmatite dike (Chak-oumakos, 1978). The microlite is distributed as brown toblack, 0.5 to 5.0 mm, euhedral to subhedral crystals in amatrix of lepidolite, bladed albite, and quartz. Accessorycolumbite-tantalite completes the association.
ExprnrvrnNTAl PRoCEDURES
X-ray diffraction studies
A variety of analyses was performed using either a Philips ora Scintag diffractometer and CuKa radiation: (1) A suite of singlecrystals was hand picked from a microlite concentrate, mountedon a Gandolfi attachment, and X-rayed in a 114.6-mm Debye-Scherrer camera. Films were corrected for shrinkage, and latticeconstants were refined by least-squares analysis. The crystals werethen mounted and polished for electron-microprobe analysis. (2)Powder-diftactometer traces were recorded for larger specimenswith the Philips unit. Patterns were calibrated with BaFr(a :
0.6198 nm) as an external standard, and lattice constants wererefined by least-squares analysis. (3) Powder-ditrraction patternsfor five microlites ranging from crystalline to metamict werecollected with a Scintag difractometer (see Fig. l2), and latticeconstants were refined using the program LATCoN (Scintag soft-ware). In addition, samples annealed during the course of TGAmeasurements were X-rayed and found to have recrystallized tomicrolite plus minor CaTarOu and CaTaoO,,.
Transmission electron microscopy
Three microlite samples (highly crystalline, partially metamict,and fully metamict) were dispersed onto holey carbon grids inmethanol. The samples were examined with a rrol 2000 rx rBvroperated at an accelerating potential of200 keV. Standard bright-field (BD, selected-area diffiaction (SAD), and high-resolution(HRTEM) techniques were employed. SAD patterns were cali-brated using a gold film under the same instrumental conditions.A double-tilting stage was used to bring the [1 I l] zone axis intothe diffracting condition such that HRTEM images show pri-marily 0.6-nm (l 1l) and 0.3-nm (222) finges.Image resolutionand magnification were checked using a graphitized carbon (0.34nm) standard. HRTEM images were taken at magnifications of410000 or 500000. The samples appeared to be stable for atleast l0 min under normal operating conditions.
'! y'r{ i1l' i t o r . ' / / /

LUMPKIN ET AL.: MICROLITE FROM HARDING PEGMATITE 573
Thermogravimehic analysis
Water contents were estimated for a few samples using a DuPont
951 TGA and 990 Recorder. Samples weighing 10 to 20 mg were
heated in air to 1000"C at a rate of 10'/min. The system was
calibrated with a calcium oxalate standard using the same op-
erating parameters. The calibration was checked by reweighing
each sample after cooling to room temperature. The percentage
of weight loss calculated in this way was usually within 50/o of
that measured.
Elecbon microprobe analysis
Over 200 microlite analyses have been obtained using an au-tomated r/Eor733 operated at an accelerating voltage of 15 keV
and a sample current of 20 nA. Standards include natural samplesof microlite (F, Na, Ca, Nb, Ta), manganotantalite (Mn), stibi-otantalite (Sb, Bi), benitoite (Ti, Ba), olivine (Fe), cerussite (Pb),pollucite (Cs), and cassiterite (Sn). Synthetic crystals of CaWOn'YPO., CePOo, ThSiO., and UO, were used for W, Y, Ce, Th,
and U. Each element was counted until a relative standard de'viation of 1.00/o was reached, up to a maximum counting timeof 30 s. To minimize volatilization induced by electron-beamheating, all analyses were performed with a beam diameter of l0pm. Data were corrected for drift, deadtime, absorption, fluo-rescence, and atomic number efects using a theoretical (ZAF)procedure based on the program MAGIC IV (Colby, 1968)' The
complete set ofanalyses is presented in Table I .1 Average analyses(including HrO) are given in Table 2, and representative analysesare grouped according to lithologic unit in Table 3.
Structural formulas
All microlite analyses were converted to a structural formulabased on a total of2.0 B-site cations (cf., Borodin and Nazarenko,1957; Van Wambeke, 1970). This allows an estimate of the A-
site vacancies for each analysis. The major problem in assigninga structural formula is determination of the oxidation state ofFe, which can enter either the A site (Fe'?+) or the B site (Fe3*).
Chemical analyses by C. O. Ingamells (in Jahns and Ewitg,1976)reported Fe as FeO and/or FerO, in no systematic fashion; how-ever, for all five analyses, FeO averages 0.07 and FerO, averages0.02 wt0/0. Consequently, we report all Fe as FeO and allocate itto the A site, which minimizes A-site vacancies. This effect willbe slight since the Fe content is very low in most of the probe
analyses. On the basis of chemical analyses in Jahns and Ewing(1976), all U is calculated as UOr, which increases the calculatedO content in the anion group and minimizes Y-site vacancies.
The amount of O, OH, and F can be calculated in conjunctionwith HrO contents estimated by TGA. A major difrculty is thedetermination of whether the water is present as OH or molecularHrO. Our TGA data alone are not sufrcient in this respect. Waterreleased at ca. 150'C is most likely molecular HrO, but much ofthe water was released gradually up to 1000'tC and cannot bedistinguished as OH- or molecular HrO. Borodin and Nazarenko(1957) assumed a total ofseven anions and calculated the amountof OH necessary to achieve charge balance. Excess water wasallocated as HrO. In general, this procedure is not strictly valid
because of anion vacancies at the Y site [Pyatenko, I 959 (l 960);
I To receive a copy of Table I, order Document AM-86-297from the Business Office, Mineralogical Society of America, 1625I Street, N.W., Suite 414, Washington, D.C. 20006. Please remit$5.00 in advance for the microfiche.
Aleshin and Roy, I 962; Subramanian et al., I 983; Chakoumakos'
19841. We calculate two end-member formulas that bracket the
range of possible anion chemistries: one that maximizes OH and
anoiher that includes all water as molecular HrO and maximizes
Y-site vacancies (Table 2). For the analyses in which HrO has
not be€n estimated by TGA, a single formula is calculated and
Y-site vacancies are allocated when F and O are less than 7'0
(Tables I and 3). Assumptions involved in calculating structural
iormulas mainly affect O, OH, and HrO and Y-site vacancies'
The reader should be aware ofthese uncertainties in the following
discussion.
Mrcnor.rrn cHEMrsrRY
General relationshiPs
Excluding alteration effects, the major-element contents
are not unusual when compared to analyzed microlites
from other localities (Bonshtedt-Kupletskaya, 1966; Von
yses where HrO is not determined (Tables I and 3)' Major
elements nearly cover the range of known microlite com-
positions.Certain minor elements appear to be enriched or de-
WOr.
Stoichiomehy
B-site cations. Pentavalent Ta and Nb are the dominant
cations occupying the octahedral B site (Fig. 3). The amount
of Ta ranges from 1.35 to l'85 and Nb ranges from 0.10
to 0.45 atoms per formula unit. Substitution of Ti is lim-
ited to a maximum of 0.25 atoms per formula unit. The
contents of W and Sn rarely attain 0.01 and 0.003 atomsper formula unit, respectively.

574 LUMPKIN ET AL.: MICROLITE FROM HARDING PEGMATITE
Table 2' Average electron-microprobe analyses for Harding pegmatite microlites v/ith HrO contents estimated by TGA(formulas based on >B : 2.00 include two possible anion distributions; see text)
288I 5 41 5 3I 4 9I 4 8 1 5 0
wo"
Ta^O-
Nb^o-z )T102
Sn02
Tho2
uo.
Y 2o3c.203
sb203
Bi203
Mn0
FeO
CaO
Ba0
Pb0
Na2O
csroF
Hzo
sttl4
TOTAL
o , 2 6
7 5 . r
5 . 6 8
o . o 2
0 . 0 I
0 . 0 3
0 , 0 0
0 . 0 0
0 . 1 4
0 . 0 9
0 . 0 4
0 , 0 3
0 . 0 3
I 0 . 4
0 . 0 0
0 . 0 4
5 . r 0
0 . 0 0
3 . 4 r
0 . 1
r 0 0 . 4 8- 1 . 4 39 9 . 0 5
0 .0061 . 7 7 0o . 2 2 30 . 0 0 1c . 0 0 0
0 . 0 0 10. 0000 . 0 0 00 . 0 0 40 . 0 0 30 . 0 0 10 , 0 0 20 . 0 0 20 . 9 6 50 . 0 0 00 , 0 0 10 . 8 5 70 . 0 0 I0 . 1 6 0 . 1 6
5 . 9 2 5 . 9 5
0 . 0 0 0 . 0 00 . 0 7 0 . 0 00 . 9 3 0 . 9 30 . 0 0 0 . 0 70 . 0 0 0 . 0 3
0 . 0 8
7 4 . 1
4 . 3 6
0 . 0 3
0 . 0 0
0 . 0 4
2 . 2 0
0 . 0 7
0 . 0 9
0 . 1 1
0 . 0 0
0 . 1 9
0 . 0 0
I 1 . 0
0 . 0 0
0 . 0 3
4 . 2 5
0 . 0 4
2 . 0 4
1 . 1
r00 . 34- 0 . 8 69 9 . 4 8
0 . 0 0 21 . 8 2 00 . t 7 70 . 0 0 20. 000
0 , 0 0 10 . 0 4 10 . 0 0 30 , 0 0 30 . 0 0 40. 0000 . 0 1 40 . 0 0 01 . U ) )0 . 0 0 00 . 0 0 10 . 7 3 80 . 0 0 20 . 1 4 0 . 1 4
6 . 0 0 6 . 0 0
0 . 0 8 0 , 2 90 . 3 4 0 . 0 00 . 5 8 0 , 5 80 . 0 0 0 . 1 30 . 1 2 0 . 3 3
0 . 03
7 5 . 6
0 . 20
0 . 0 0
0 . 00
0 . 69
0 , 1 0
0 . 1 2
0 , 09
0 . 0 5
0 . 060 . 00
I 1 , 6
0 , 03
0 . 0 2
3 . 7 0
0. 00
2 . 4 4
o . 7
r00 .65- r . 0299 .63
0 , 0 0 1r . 7 8 20 .2040 . 0 I 30. 000
0 .0000 . 0 1 30 . 0050 . 0040 . 0030 . 0 0 10 . 0040 . 000r . o 7 10. 0000 . 000o . 6 2 20 . 000o . 2 7 0 . 2 7
5 . 9 4 6 . 0 0
0 . 0 0 0 . 1 10 . 3 3 0 . 0 00 . 6 1 0 . 6 70 . 0 0 0 , 2 20 . 04 0 . 20
o . 2 3
7 4 . 1
5 . 6 6
0 . 0 5
0 . 0 t
0 . 0 4
I . 8 4
0 . 0 2
0 . I 8
0 . 0 8
0 . 1 0
0 . 0 3
0 , 0 4
9 . 6 5
0 . 0 0
0 , 1 0
4 . 7 7
0 . 0 0
2 . 5 1'1 .2
t 0 0 . 6 I- r . 0 59 9 . 5 6
0 . 0 0 5t . 1 6 70 . 2 2 50 . 0 0 30. 000
0 . 0 0 I0 . 0 3 50 . 0 0 10 . 0 0 60. 0030 . 0 0 20 . 0 0 20 . 0 0 20 . 9 1 00. 0000 . 0 0 30 . 8 I 20 . 0 0 00 . 2 2 0 . 2 2
5 . 9 5 6 . 0 0
0 . 0 0 0 . I 10 . 3 i 0 . 0 00 . 6 9 0 . 6 90 . 0 0 0 . 2 00 . 2 0 0 . 3 5
0 . 0 6
7 0 . 2
4 . 7 7
0 . 4 0
0 , 0 0
0 . 0 0
9 . 0 7
0 . 0 0
0 . 1 3
0 . 0 5
0 . l 7
0 . 0 9
0 . 0 6
8 . 6 2
0 . 0 0
1 , 8 5
0 . 0 2
1 . 2 5
t . 2
to t .26
1 0 0 . 7 4
0 . 0 0 Ir . 7 7 |0 . 2000 . 0280 . 000
0 .0000 . 1 7 70 .0000 .0040 . 0020 . 0040 . 0070 .00s0 . 8560 . 0000 . 046o .5970 . 0010 . 30 0 . 30
6 . 00 6 . 00
o . 2 5 0 . 5 50 , 3 9 0 . 0 00 . 3 7 0 . 3 70 . 0 0 0 . 0 70 . 0 6 0 . 3 7
0 . 0 7
6 r . 7
7 . 6 1
0 . 9 0
0 .00
0 . 1 0
1 0 . 0
0 . 08
0 . 2 0
0 . 08
0 . 0 2
0 . 5 4
0 .04
1 0 , 5
o , 2 9
3 . 1 , 7
0 . 00
r , 4 3
4 , 0
r00 . 73- 0 . 5 0
i 0 0 . 1 3
0 . 0021 .607o.3280 . 0 6 30 . 000
0 . 0 0 20 . 2 1 30 .0040 .0070 . 0030 , 0000 .0440 . 003L . O 7 7
0 .0080 . 5850 . 0000 , 0 5 0 . 0 5
6 . 5 6 6 . 2 8
0 . 0 0 0 . 5 70 . 5 7 0 . 0 00 . 4 3 0 . 4 30 . 0 0 0 . 0 00 . 9 9 r . 2 8
0 . 2 0
7 r . 2
5 . 2 8
o . 5 2
0 . 00
0 .05
3 . 0 7
0 . 0 7
0 . 1 7
0 . 1 4
0 .00
0 . 1 6
0 . 1 2
I l . 9
0 . 00
0 . 0 6
3 . 09
0 . 00
1 . 6 5
3 . 2
r00 .98-0 . 69
100 . 29
0 . 0 0 51 . 7 3 9o .2 t40 .0420 .000
0 .00 t0 .0580. 0030 . 0060 .0050. 0000 . 0 1 20 . 009r . 1 4 50 .0000 . 0 0 10 . 5380 .0000 . 2 2 0 . 2 2
5 . 0 0 6 . 0 0
0 . 0 0 0 . 3 80 . 5 3 0 . 0 0o . 4 7 0 . 4 70 , 00 0 . 150 . 6 9 0 . 9 5
t^'
NbT iS n
ThUYCesbB itinFeCaBaPbNaC s!A
o
0ott
uYH ^ O
A-site cations. The major cations in the eight-coordi-nated A site are Ca and Na (Fig. 4). Typical ranges forthese cations are 0.85 to 1.30 for Ca and 0.30 to 0.95 forNa. No other cations achieve 20o/o of the A-site total:therefore, all of the Harding samples are microlite, asdefined by Hogarth (1977). The minor elements U, Mn,Fe, and Pb approach maximum amounts of 0.25, 0.15,0.06, and 0.10 atoms per formula unit, respectively. Feis below 0.01 in most of the formulas. The maximumcontent of Sb is 0.02 atoms per formula unit. y, Ce, Bi,and Cs are usually less than 0.01 and Ba is below 0.003
atoms per formula unit. Based on total A-site cations, thenumber of vacancies ranges from 0.0 to nearly 0.4. A fewof the analyses of hydrothermally altered microlites fromthe microcline-spodumene zone give A-site totals in ex-cess of2.00 (up to 2.13). These A-site excesses could bedue to either B-site vacancies or an A-site cation locatedat the B site. Because Fe and Sb are low in these samples,the most likely candidates are Mn3+ and U6* (Subraman-ian et al., 1983; Chakoumakos, 1984; Chakoumakos andEwing, 1985). Although site occupancy determinationsare needed to prove this, enough Mn is present to account

LUMPKIN ET AL.: MICROLITE FROM HARDING PEGMATITE
Table 3. Representative electron-microprobe analyses of microlites from lithologic units of the Harding pegmatite (formulas
based on >B : 2.00){'
575
Quartz - Lath Spodumene zone2 6 I c 2 6 1 1 2 7 l c 2 7 L E 2 7 2 c 2 7 2 r
C l e a v e L a n d i t e U n i t ( r e p 1 . Q u a r t z - L a t h S p o d u n e n e Z o n e )
2 6 7 2 6 5 P 0 3 ' l c P 0 3 . 1 r P 0 4 c P O 4 r
ThUYCeSbB 1MnFeC aBaPbNaC sEA
oF
md o s e
0 . L 4
7 4 . 9
5 . 0 r
0 . 1 6
0 . 0 0
0 . 0 0
0 . 7 8
0 . 0 8
0 . 0 8
0 . 1 4
0 . 1 6
0 . 0 60 . 0 0
r 1 . 7
0 . 0 r4 . 2 70 . 0 02 . 4 7
9 9 . 9 6- r .o49 8 . 9 2
0 . 0 0 3r . 7 8 80 . 1 9 90 . 0 1 I0 . 0 0 0
0 . 0 0 00 . 0 1 40 , 0 0 40 . 0 0 30 . 0 0 50 . 0 0 40 . 0 0 40 . 0 0 01 . 1 0 0
0 . 0 0 00 . 7 2 60 . 0 0 00 . 1 4
6 . 1 90 . 6 90 . t 2
" o 3 0 . 1 4 0 . 1 6
T a Z o 5 7 5 . 1 6 7 . 7
N b 2 0 5 6 ' 0 8 9 . 3 5
T i o 2 0 ' 0 3 0 . 3 0
S n O 2 0 , 0 0 0 . 0 0
T h o 2 0 . 0 0 0 . 0 0
u o 3 0 . 0 6 2 . 1 8
Y z O 3 0 , 0 0 0 . 0 0
c e 2 0 3 O , 2 5 0 . 2 I
s b 2 o 3 0 . 1 7 0 . 3 1
B i 2 o 3 0 . r 2 0 . 2 0
M n o 0 . 0 3 0 , 1 0F e O 0 . 0 0 0 . 0 4C a O 1 0 . 7 1 1 . 0Ba0P b o 0 , 0 0 0 . 0 3N a r O 5 . 2 8 4 . 6 4c s i o 0 , 0 4 0 . 0 0F ' 3 . 2 3 2 , 3 3s u M 1 0 1 . 2 3 9 8 . 5 90 = F - 1 , 3 6 - 0 . 9 8
TOTAL 99.87 97 ,6 r
l , J 0 .003 0 ,004T a L 7 5 8 1 . 6 0 8N b 0 . 2 3 7 0 . 3 6 9T i 0 . 0 0 2 0 . 0 2 0s n 0 . 0 0 0 0 . 0 0 0
0 . 3 8 0 . 2 8 0 . 1 4
1 4 . 4 7 7 . 3 7 4 , 7
5 , 6 6 2 . 7 2 5 . 2 7
0 . 0 7 0 . 4 2 0 . 0 0
0 . 0 i 0 . 0 4 0 . 0 0
0 . 0 3 0 . 0 0 0 , 0 7
0 , 3 1 0 , 6 6 0 . 0 3
0 . 0 5 0 . 0 s 0 . 0 s
0 . 0 0 0 . 0 5 0 . 1 , 2
0 . 1 I 0 , 1 9 0 . 0 9
0 , 1 2 0 . 0 0 0 . 0 9
0 , 0 3 0 , t 2 0 . 2 00 , 0 0 0 . 0 1 0 . 0 0
1 I . 7 I 2 . 8 1 1 . 80 , 0 0 0 . 0 00 . 0 3 0 . 0 3 0 . 0 04 . 3 8 2 . 2 5 4 . 3 40 . 0 0 0 . 0 2 0 . 0 02 . 9 4 2 . 4 5 3 . 0 3
r 0 0 . 2 3 9 9 . 3 9 9 9 . 8 4- r . 2 3 - 1 . 0 3 - r . 2 79 9 . 0 0 9 8 . 3 6 9 8 . 5 7
0 . 0 0 8 0 . 0 0 6 0 . 0 0 3t . 7 6 4 I . 8 5 6 r . 7 8 7o . 2 2 3 0 . 1 0 9 0 . 2 1 00 . 0 0 5 0 . 0 2 8 0 . 0 0 00 . 0 0 0 0 . 0 0 1 0 . 0 0 0
0 . 0 0 I 0 . 0 0 0 0 . 0 0 r0 . 0 0 6 0 . 0 1 2 0 . 0 0 10 . 0 0 3 0 . 0 0 2 0 . 0 0 20 . 0 0 0 0 . 0 0 2 0 . 0 0 40 , 0 0 4 0 . 0 0 7 0 . 0 0 30 . 0 0 3 0 . 0 0 0 0 . 0 0 20 . 0 0 2 0 . 0 0 9 0 . 0 1 50 . 0 0 0 0 . 0 0 1 0 . 0 0 01 . 0 9 3 1 , 2 1 0 I . I 1 2
0 . 0 0 0 0 . 0 0 00 . 0 0 I 0 . 0 0 1 0 . 0 0 00 . 7 4 0 0 . 3 8 5 0 . 7 4 00 . 0 0 0 0 . 0 0 1 0 . 0 0 00 . 1 5 0 . 3 7 0 . 1 2
6 . 0 9 6 . 1 1 6 . 1 00 . 8 1 0 . 6 8 0 . 8 40 . 1 0 0 . 2 r 0 . 0 6
0 . 2 5 0 . 2 3 0 . 4 8
7 5 . 2 6 7 , 4 7 2 . 8
5 . 5 1 9 . 9 6 7 . 4 9
o . 0 2 0 . 4 7 0 . 0 3
0 . 0 3 0 . 0 0 0 . 0 1
0 . 0 5 0 . 0 4 0 . 0 0
0 . 0 0 2 . 7 5 1 . 2 8
0 . 0 2 0 . 0 3 0 . 0 9
0 . r 2 0 . 1 6 0 . 2 1
o . 1 2 0 . 1 5 0 . 2 1
0 . 0 2 0 . 0 6 0 . 1 2
0 . o 2 0 . 1 8 0 . 0 00 . 0 0 0 . 0 0 0 . 1 4
I l . l 1 1 . 4 1 0 . 40 . 0 1 0 . 0 0
0 . 0 3 0 . 1 2 0 . 0 65 . 5 7 4 . 2 6 5 . 0 90 . 0 0 0 . 0 0 0 , 0 13 . 4 0 2 . 2 5 2 . 8 8
1 0 1 , 4 6 9 9 . 4 1 l o t . 3 6- L , 4 3 - 0 . 9 5 - 1 . 2 r
1 0 0 . 0 3 9 8 . 5 2 i 0 0 . I 5
0 . 0 0 6 0 . 0 0 5 0 . 0 i I| , 7 7 6 \ . 5 7 7 r . 6 9 7o . 2 t 6 0 . 3 8 7 0 , 2 9 00 . 0 0 r 0 . 0 3 0 0 , 0 0 20 . 0 0 1 0 . 0 0 0 0 . 0 0 0
0 . 0 0 1 0 , 0 0 1 0 , 0 0 00 . 0 0 0 0 . 0 5 0 0 . 0 2 30 . 0 0 1 0 . 0 0 1 0 , 0 0 40 . 0 0 4 0 . 0 0 5 0 . 0 0 70 . 0 0 4 0 . 0 0 s 0 . 0 1 00 . 0 0 0 0 . 0 0 r 0 . 0 0 30 . 0 0 1 0 . 0 I 3 0 , 0 0 00 , 0 0 0 0 . 0 0 0 0 . 0 1 0r . 0 3 2 r . 0 5 1 0 . 9 5 5
0 . 0 0 0 0 . 0 0 00 . 0 0 I 0 . 0 0 3 0 . 0 0 I0 . 9 3 8 0 . 7 1 1 0 . 8 4 60 . 0 0 0 0 . 0 0 0 0 . 0 0 00 . 0 2 0 . 1 6 0 . 1 4
5 . 0 5 6 . 2 7 6 . 1 I0 . 9 3 0 . 6 1 0 . 7 80 . 0 2 0 . 1 2 0 . 1 1
< 0 . 0 1 1 , 1 0 . 5 1< 0 . I L 4 6
0 . 2 5 0 . 3 8 0 . 2 9
6 2 . 0 7 6 . 0 7 3 . 4
r 0 . 5 5 . 6 4 4 . 4 8
r . 5 9 0 . 0 3 0 . 6 7
0 . o 2 0 . 0 0 0 , 0 3
0 . 0 4 0 , 0 3 0 , 0 1
4 . 2 3 0 . 0 5 2 . 6 1
0 . 0 7 0 . 0 6 0 . 0 7
0 . i 1 0 . 1 4 0 . 2 1
0 . 4 8 0 , 1 4 0 . 2 3
0 . 0 0 0 . 0 7 0 . 0 6
0 . 3 6 0 . 0 0 0 . 0 20 . 3 4 0 . 0 5 0 . 1 1
r 3 . 1 1 0 . 4 1 0 . 50 . 0 1 0 . 0 0 0 . 0 10 . 1 0 0 . 0 3 0 . 0 72 . 9 0 5 . 2 4 4 . 6 80 . 0 0 0 . 0 3 0 . 0 22 . L 2 3 . 3 5 2 . 4 1
9 8 . 2 2 r o t . 6 4 9 9 , 8 8- 0 . 8 9 - 1 . 4 1 - 1 , 0 1
9 7 . 3 3 1 0 0 . 2 3 9 8 , 8 7
0 . 0 0 6 0 . 0 0 8 0 . 0 0 7I . 4 7 4 1 . 7 7 r 1 . 7 6 80 . 4 1 5 0 . 2 1 8 0 . 1 7 90 . I 0 5 0 . 0 0 2 0 , 0 4 50 . 0 0 r 0 . 0 0 0 0 . 0 0 1
0 . 0 0 1 0 . 0 0 1 0 . 0 0 00 . 0 7 8 0 . 0 0 1 0 . 0 4 80 . 0 0 3 0 . 0 0 3 0 . 0 0 30 . 0 0 4 0 . 0 0 4 0 . 0 0 70 . 0 1 7 0 . 0 0 5 0 . 0 0 80 . 0 0 0 0 . 0 0 2 0 . 0 0 10 . 0 2 7 0 . 0 0 0 0 . 0 0 20 . 0 2 5 0 . 0 0 4 0 . 0 0 8r . 2 2 7 0 , 9 5 5 0 , 9 9 60 . 0 0 0 0 . 0 0 0 0 . 0 0 00 . 0 0 2 0 . 0 0 1 0 . 0 0 20 . 4 9 1 0 . 8 7 0 0 . 8 0 40 . 0 0 0 0 . 0 0 1 0 . 0 0 10 . 1 2 0 . 1 5 0 . r 2
6 . 4 1 5 , 9 7 6 . 2 20 . 5 9 0 , 9 1 0 . 6 80 . 0 0 0 . 0 9 0 . I 0
r , 7 0 . 0 2 I . 12 L 0 . 3 1 3
0 , 0 0 0 0 . 0 0 00 . 0 0 1 0 . 0 4 00 . 0 0 0 0 . 0 0 00 . 0 0 8 0 . 0 0 70 . 0 0 6 0 , 0 I 10 . 0 0 3 0 . 0 0 50 . 0 0 2 0 . 0 0 70 . 0 0 0 0 , 0 0 30 . 9 8 7 r . 0 2 9
0 . 0 0 0 0 . 0 0 10 . 8 8 I O . 7 9 20 . 0 0 I 0 . 0 0 00 . 1 1 0 . 1 1
6 . 0 2 6 . 2 60 . 8 8 0 . 6 40 . I 0 0 , 1 0
0 . 0 2 6 0 . 9 0 0 , 1 2 0 . 2 7 0 . 0 1 3 0 . 0 3 2o . 2 4d p a 0 . 3 I l
* " = " o r " , r = r l n , p = p r l p r y a t t e r a t t o n , s = s e c o n d a r y a l t e r a t l o n , d o s e x l 0 l T a l p h a s / m g , d p a = d i s p l a c e m € n t s p e r a t o h .
for )A in excess of 2.00 in each case and is positivelycorrelated with >A. Furthermore, the ionic radius (Shan-non, 1976) of Mn3+(r":0.0645 nm) is nearly identicalto those of Nb5+ and Tas+(r" : 0.064 nm). The radius ofU6+ is significantly larger (r" : 0.073 nm).
Anion group. The only anion determined by analysiswas F, which ranges from 0. I to 0.9 atoms per formulaunit. The calculated amount of O ranges from 5.9 to 6.9atoms per formula unit. Formulas presented in Table 2bracket the OH content at 0.M.6 atoms and HrO at 0.0-1.3 molecules per formula unit. The maximum numberofY-site vacancies approaches 0.4. )Y tends to be greaterthan 1.00 where IA exceeds or is near 2.00. The highestcontents of F occur in microlites from the quartz-lath
spodumene zone and the cleavelandite unit which ap-proach stoichiometric NaCa(Ta' BNbo.r)O5F. Microlitesfrom lepidolite pods near the base ofthe quartz-lath spod-umene zone are virtually identical in composition. Themost unusual microlites are rich in Pb and poor in F.They occur in the microcline-spodumene zone, approach-ing the composition trdNa".Cao Jbo 'Mno 'U8.f (Ta' 'Nbo ,)OuuFo,trIr. l.2H2O (HrO estimated by difference).
Alteration effects
Processes ofgeochemical alteration are generally divid-ed into primary (hydrothermal) and secondary (weath-ering) types (e.9., Van Wambeke, 1970; Ewing, 1975). Forthe complex, ,{8206, Ti-Nb-Ta oxides Ewing (1975) ob-

s o o 6 @ o € s. . € o I I 4 | I - | - o n l N - ! N . . o € - o I l - | l o t o o o l - 6 l 6 N o N. . | | | I | . . | . . | . o o € . . . | | . | | I . | . I
r o : o 6 0 6 | d o : o o c o o o o o o o @ o o
LUMPKIN ET AL.: MICROLITE FROM HARDING PEGMATITE
o 6 € s a : <o - : 6 - O O O S 0 O S : 6 @ 6 N O i O 6 - d
| | s I I N | € { o l N s o f 6 s € o r N o l l o l l o l o o - l o { l - n { ot . t t . t . . . t . , . . , . 1 . t t . t . . . t . . t .
o N 6 O N O O N O : O O o O i O O O O ao l 6
6 6 0 € r 6 @ E 3 X 3 3 3 : 3 3 3 3| | - | | - | ^ o N t 6 6 o N N o I l o I l c l o o o l o N l o N € o
o - 6 o c o : o : o o o o - o a o o o ::
r -
o 6 N 4 6 0 r i N € O n N Oc o 6 s 6 r o 6 - o o : o : h @ r o @ o : o o 6 o o o o € o o o o 6 0 o @ o oo o o o : o o o o 6 0 i o o € 6 6 N o 4 6 0 0 0 d o o o o o o i o o 4 0 0 r s o
o i 6 o o o N o o o o : o r o o o o i 4 o 6 o : o o o o o o o o o o o : o o o o o a o o
@ o @ @ oo c N s 6 r o 6 o 6 o o o o : o o o o o o oo o N o i o o : o s o € r o @ o o o o i o o o o o o 6 o o r o N
o € N o o o @ o o o o o o 6 0 0 0 0 : @ o r o i o o o o o o o o o o o o o o o o o€ 6 t 6
: i : 3 h 5 3 S 3 5 ? 6 0 € os N 6 o | | 6 | l - I - o o l € o l 4 6 N o o e - o I t - | t o t o 6 n l 0 6 l - € - 6
o n F o N o o o i c N o N o : o o o o o o d o o o o o o6 t 6 S
i s o 4 o o @ 6 r @ r N 4 o N s € o: o o o N o € h o o 6 r 6 o o 6 s o o N o o o o i N o o o 6 o s
o s o € o o 6 i o : o i 6 o € € N $ o r N o o o o o o o o o o 6 o o o o - @ : @
o @ € o o c o o o o o o o s o o o o o r o F o : o o o o o o o o o o o o o o o o i 4 o o6 @ t @
o 6 i r c i 6 j 6 r d o 6 s o N N oo $ o @ r o : f o j o i c 0 1 0 0 0 0 : : : 0 o r o 6 < 9 oo o N o : : o i - r o d 6 0 o € o r o 9 o o o o o o o o o o o o o o s o :
o € r o o o + o o o o o o o o o - c N @ o N o i o o o o o o o o o o o i o o o o c @ o o
o j 6 ; o - s : 6 o o r 6 : i r o oo o o 6 6 € o o o r i 6 o o N r o o 6 o o : o N 6 @ o o @ o 6o + : o o o s o i N o 6 N @ o N N o { N a € o 6 + o o o : o o o o o o o o o h o : 6 $ o
o 6 0 : o o 6 0 0 0 0 0 0 6 0 0 - o 3 0 0 6 0 : o o o o o o o o o o o o o o o o o
i o o s 6 t s o 6 NN 6 S O O O { O N 6 O : $ O € N € O
o 6 r o o o o o o 6 0 0 0 0 i N o F€ o t o
!o o o o o o c o
r N N C O C 6 0 N N N O O C O O N N E T Fo s ! . i I E o E o s 6 ! 6 @ = i l r o3 t z + v . | = > o o . o E E a { r z u t s o o F
o 6 6 6 0 0 6 ; + So s r o : r . o o . l e o : N r t s o c 6 o N o o s o o o o N N d o o i o si N s 6 c o N o : i o o o o o o b o o : o N c 6 : o o o o o o o O o o o o o o o N
o o N o o o o o o o o o o o N 6 0 € o : o o o o o o o o o o o : o o o o o € o o o N6 t 6
o @ : a o o o o N N c @ i N o i j :o o r r € 6 o o : o € o N o o o o o € o c o o s o o o o o o $ o o N o r
o o o o o o i o o o o o o N o o N c 6 0 : d o @ 6 0 0 0 0 0 0 0 0 0 0 0 c o N o : r r o
o o @ o o o N o o o c o o : o o $ o N o i @ o r o c o o o o o o o o o : o o o o o € o o
O : : o O @ : ON € € @ O @ O O O 6 O r O O @ 6 O O O O O O ; O n - 6 O N O O No o N o N 6 o r s s o i r o 6 N 4 i o 6 o N o o : o o o o o o o o o + o N 6 6 o o
o 6 0 0 0 0 r o o o o o o : o : N o i @ o @ o : o o o o o o o o o o o i o o o o o e o o
@ 6 S r N O O 6 6 € O O r 6 : S O Oa o n c o r o o o 6 0 @ o 6 N o o o : o o o o o o 6 0 0 t s o 6 @ 1 6
N i O O O e O : 6 O i O O O O N d O O O O O O O O O O O C O t s O : O @ O
o $ 6 0 o o o o o o o o o : o o + o o : : o o ; o o o o o o o o o o o : o o o o o € o o o oo r o
N @ 6 O N O O N T ; N O h6 S O - O O N C N @ @ O O A O C O O N 6 € O O d C € : O O
c : i o - : o d s o o o 6 0 r : o o o o o c o o o o o o o € o :
o c o o c o o o o i o o o o N o o 6 0 i o o o o o o o o o o o i o o o o o € o o
o : 6 0 : 6 6 06 O O ; 6 o N @ O N r O : O N O 6 O O N O O O O 6 6 N O O € O O 6 i O
o c 6 i : i o < o s 6 @ 6 o € o o o o : o o o o o o i o o s o N 6 $ o
o € r o o o € o o o o o o : o o d o i @ o N o a o o o o o o o o o o o : o o o o o 6 0 0
9 6 : j O O 6 N € O 6 N Oo r : o o o $ o o o o : N { o o i o $o € 6 0 0 0 i o o o o o o 6 0 0 € o N
3 r z t 6 F = > o o 4 = r u F d z o E o E E
E
576
d
rY
Io
F

LUMPKIN ET AL.: MICROLITE FROM HARDING PEGMATITE 577
served consistent increases in Ca associated with primaryalteration. Samples thought to reflect secondary alterationshowed significant leaching of A-site cations such as Y,REE, U, and Th and increased HrO content. Van Wam-beke (1970) found similar results for a uranpyrochloreand a betafite from Madagascar.
Lumpkin and Ewing (1985) used a combination of scan-ning electron microscopy, electron-microprobe analysis,and TGA to characterize altered pyrochlores, betafites,and microlites. Four Harding pegmatite microlites wereincluded. In general, the results showed that primary al-teration produced minor increases in Fe and Mn, de-creases in Na, and variable to minor changes in Ca, F,HrO, and A-site vacancies. Secondary alteration resultedin leaching of Na, Ca, and F, with extensive hydration(up to l2 wto/o HrO). This process maximizes the numberofA and Y vacancies tolerated by the pyrochlore structureand leads to cation exchange for small amounts of largecations like K Sr, Ba, Pb, Bi, and Cs (Harris, 1965; VanWambeke, 1 978; Saffiannikoff and Van Wambeke, 19 6l;Von Knorring and Fadipe, 1981; Lumpkin and Ewing,l 985) .
Electron-microprobe analyses of altered and unalteredareas of Harding microlites are given in Table 3. Speci-mens showing primary alteration (153, 154, 260, 264,269,P07.1, Pl5. l, Pl7. l, P18.1) give consistent increasesin Mn, Ca, and O in the structural formula. Increasing Casupports the findings of Van Wambeke (1970) and Ewing(1975). The typical increases in these elements are 0.05-0.10 Mn, 0.20-0.40 Ca, and 0.10-0.40 O atoms per for-mula unit. The content of Fe increases in some of thesamples by as much as 0.03 atoms per formula unit. Sim-ilar increases in Ti and U compensated by decreasing Taand Nb were noted in a few cases, but could be the resultof alteration superimposed on original compositional het-erogeneity. The F content remains approximately con-stant. Considering analytical totals, the probe data indi-cate that total HrO also remains nearly constant, exceptin a few cases (Pl5.l, P07.1) where an increase of up to2 wto/o is inferred. This is equivalent to 0.7 OH anions or0.35 HrO molecules in the formula. The amount of Pb isconstant ifthe unusual Pb-rich grains (269) are considerednot to have resulted from alteration (see Fig. lf). Primaryalteration also leads to consistent decreases of0.l0-0.35Na, 0.1-0.4 trA, and 0.24.4 trY. As noted above, someof the analyses suggest that Mn might be located at the Bsite. If so, the inferred decreases in A and Y vacancieswould be diminished by 0.1-0.2.
Microprobe analyses of secondary alteration (weath-ering) adjacent to fractures were obtained in a few ofthesamples (153, 269, P02.2). Pronounced decreases of upto 0.7 Na, 0.6 O, 0.5 Ca, and 0.5 F atoms per formulaunit are observed. The amount of Pb decreases by as muchas 0.03 atoms per formula unit. These changes are ac-companied by increases in vacancies of up to 0.9 trA and0.7 trY. Minor increases in Mn and Fe occur, but signif-icant increases in Ba, Pb, Bi, and Cs were not observed.Low analytical totals ofthe probe results suggest total HrO
o o o
o oo
o o o
CLEAVELANDTTE UN|T I( tN BERYL ZONE)
" "
.
0 7 0 8 0 9
lo
Fig. 3. Major-element B-site chemistry by lithologic unit forthe Harding pegmatite microlites. Minor amounts of Sn and Ware excluded. The points labeled other include unzoned grainsand analytical points between the core and rim ofzoned grains.
contents of 8-13 wt0/0, consistent with TGA results onother pyrochlores, betafites and microlites (Lumpkin andEwing, 1985; Lumpkin, unpub. data). Assuming an HrOcontent of I 2 wt0/0, a tlpical formula is Dl, Ca o u Na., Uo' -(Ta, rNbo rrTio or)Or rFo rtrIo' 3.5HrO.
Intracrystalline zoning patterns
As expected from the occuffence of distinct color zon-ing, many of the Harding microlites show core-to-rimvariation in both major and minor elements. Three gen-eral types ofzoning patterns have been observed: (l) Crys-tals in which Nb, Na, and F decrease and Ta, Ca, IJ, Ti,and HrO increase from core to rim. Increasing HtO con-
Legend
o Coreo R i m. O l h e ra Allered
B.SITECATIONS
QUARTZ - LATHSPODUMENE ZONE
CLEAVELANDITEU N I T
MICROCLINE- SPODUMENE ZONE= "spottro nocx"
LEPIDOLITE - CLEAVELANDITESUBUNIT

578 LUMPKIN ET AL.: MICROLITE FROM HARDING PEGMATITE
o Core
L e g e n d
o R i m . O l h e r
o 6 o1 oa o 9
tent is inferred from lower analytical totals of rim com-positions. (2) Microlites with cores relatively rich in Nb,Ta, Na, and F and rims relatively rich in U, Ti, and HrO.Ca content remains fairly constant as does the Nb/Taratio. (3) Grains of microlite that have decreasing contentsof Ta, Na, and F coupled with increasing amounts of Nb,Ca, IJ, Ti, and HrO from core to rim.
In addition, the minor elements Mn, Fe, Sb, and Pbtend to be enriched in crystal rims. U-Ti and Na-F havea close positive correlation in all three types ofzoning. Inzoning patterns I and 3, Nb-Ta and Ca-Na show a neg-ative correlation. Note also that these two patterns differmainly in the reversed core-to-rim behavior of Nb andTa.7-oning types I and2 are characteristic of microlitesfrom the quartz-lath spodumene zone. Zoning pattern 3is typical of microlites from the cleavelandite unit, lepid-olite<leavelandite subunit and cleavelandite pseudo-morphs after spodumene.
Znning trends observed in this study reflect the generaltrends suggested by Von Knorring and Fadipe (1981).Except for Nb-Ta in zoning type I and Ca in types I and3, the core-to-rim variations contrast with those of mi-crolites from the pocket zone of the Himalaya (California)pegmatite system (Foord, I 976). In all cases, Foord ( I 9 76)found decreasing U, Ti, and possibly Sb and correspond-ing increases in Ta, Ca, Na, and F.
Substitution schemes
Correlations among the full set of chemical variableshave been examined. These are used below in conjunctionwith zoning patterns and alteration effects to constructend members for characterizing the chemical changes. Wedo not mean to imply that such end members actually
A - SITECATIONS
A A l f e r e d
Other
CLEAVELANOITEUNt I(IN BERYL ZONE)
t oCo
occur. In turn, end-member compositional variations al-low a determination of substitution mechanisms. Thesimplest case, Ta-Nb substitution, is obvious from intra-crystalline zoning and has a correlation coefficient (r) of-0.92. Other substitutions are more complex and requiredetailed evaluation in terms of end-member composi-tions.
A convenient starting point is the ideal microlite com-position NaCa(Ta,M)rOuF or Ar+A2+B5+X?-Y-. Thiscomponent accounts for 40-950/o of the composition ofthe samples and is supported by positive correlation ofNa-F shown in Figure 5 (r: 0.71). Much of the scatterin this plot results from primary alteration, in which Nadecreases as F remains nearly constant. Intracrystallinezoning patterns show a close positive correlation of Na-F. Variation of divalent cations Ca, Mn, and Pb can beaccounted for by the end members A3+Bt+O? andA2+85+06 (cf., Borodin and Nazarenko, 1957). Togetherthey account for l0-500/o of the compositional variation.The second end member is supported by formation ofminor amounts of CaTarO6 during TGA analysis and thepositive correlation of trA{Y shown in Figure 6 (r : 0.80).Some of the scatter above the l: I variation line may bedue to overestimation of U as U6*. Calculation of someof the U as IJa+ would increase EY at constant trA. TheA;+B|+O? component is strongly supported by elementalvariations resulting from primary alteration. The possi-bility of having Mn3+ at the B site raises the potential forend-member components l ike CarTaMnOu, CaLJa*-TaMnOr, or even U6*TaMnOr.
The scatter plot of A-site vacancies versus Y-site va-cancies (Fig. 6) is somewhat misleading in that no OHhas been allocated to the Y site (because H,O was not
ur/
o7
o 8 o.9 o 8 o 9 o8 o 9 o 8 o 9
Fig. 4. A-site chemistry by lithologic unit for the Harding pegmatite microlites. The ternary end-member o/fter includes Th,IJt*, Y, Ce, Sb, Bi, Mn, Fe2*, Ba, Pb, and Cs. The points labeled other include unzoned grains and analytical points between thecore and rim ofzoned grains.
QUARTZ- LATHSPODUMENE ZONE
A
4^A
3
. .qa^ a
,tr. F
A A
SPODUMENE ZONE,.=
,'SPOTTED ROCK.'
O o

^ ^ 4- - oo 02 0 .4 0 .6 o '8 ro
F ofoms / formulo uni t
Fig. 5. Na versus F in atoms per formula unit for the Hardingpegmatite microlites.
determined for these analyses). For the mean analyses forwhich HrO was determined (Table 2), there is enoughwater to completely fill the Y site with hydroxyl and inmany cases to have excess molecular HrO. Not deter-mining HrO/OH maximizes the Y-site vacancies, whereasallocating as much OH as possible to the Y site will min-imize the Y-site vacancies. Therefore, to establish a cor-relation between A-site and Y-site vacancies, as proposedby Pyatenko (1959) andAleshin and Roy (1962), hydroxyland molecular HrO must be determined, otherwise theconelation is dependent on assumptions in the calculationof the structural formula.
An inverse correlation between U and F was found (Fig.7). The wet chemical analyses of microlites by C. O. In-gamells reported in Jahns and Ewing (1976) indicate thatthe Harding microlites have high U6+ /U4+ ratios. In theabsence of wet chemical analyses for these samples, weassume that all the uranium is U6*. The correlation, be-tween (J6+ and F is noteworthy because it supports theproposition that U6+ at the cubic A site in the pyrochlorestructure is much like the uranyl group (UO]*) and itscharacteristic coordination polyhedron, which has beensuggested by Greegor et al. (1985b) based on extended X-ray absorption fine structure ofUl-edges in metamict andannealed pyrochlore. The uranyl group is a common struc-tural unit of many uranium compounds and is also stablein the aqueous environment. The uranyl ion is linear withU-O distances shorter than the sum of radii for 02- andIJ6+. Four, five, or six ligand atoms typically lie in theequatorial plane of the O-U-O group, with these U-Odistances longer than radii sums. In comparison, therhombohedrally distorted cubic A site of pyrochlore hasa similar structure, with two short bonds in a linear Y-A-Y arrangement and a puckered equatorial girdle of sixlong A-X bonds (Chakoumakos, 1984, Subramanian etal., 1983); see inset of Figure 7. With Y-A-Y as the uranylgroup, the amount of F at the Y site will be inverselycorrelated with U6+ (Fig. 7). The large amount of scatterin Figure 7 is expected because hydroxyls and vacanciesalso substitute for F at the Y site. The lines plotted inFigure 7 illustrate two theoretical relationships betweenIJ6+ and F at the Y site, assuming that each U5+ belongsto a uranyl group at the A site and the maximum F at the
579
oro- .'r"
oJo.on.l"1 , rorl,.,tu,o un,oto
Fig. 6. A-site vacancies versus maximum Y-site vacanciesper formula unit for the Harding pegmatite microlites.
Y site is 0.7 atoms (the difference being vacancies or hy-droxyl). The first line (shallower slope) is for two Y-siteoxygens for each go+, which would be expected for lowconcentrations of U (i.e., widely scattered UOr polyhedra).The second line (steeper slope) is one Y-site O for eachU6*, which would be the limit approached as the U con-tent increased and UOr polyhedra shared corners (Y-siteoxygens). Actually, an infinite number of lines can bedrawn parallel to those in Figure 7, each for a differentamount of vacancy plus OH substitution at the Y site.Note that the data roughly trend along the relationship ofU6* : 2(Y-site oxygens), as expected for low U content.The correlation should shift toward the relationship ofgo+ : (Y-site oxygens) as the U content increases, finally
F otoms / formulo unitFig. 7. U versus F in atoms per formula unit for the Harding
microlites. The two lines are theoretical relationships assumingall the U is hexavalent and requires oxygen in the Y site; see textfor discussion. The insert illustrates the A-site coordination rel-ative to a reference cube in the pyrochlore structure.
LUMPKIN ET AL.: MICROLITE FROM HARDING PEGMATITE
t
o 5
c
o
E
E
oz
of
Eo
o
o
o
o
o
o
cJ
ol
Eo
oEoo
+@
f
= ( y - s i r e O )
U6+= 2(Y-s i ie O)

580 LUMPKIN ET AL.: MICROLITE FROM HARDING PEGMATITE
U To 20,50 mo le\
No CoTo20.F8 0 7 0 6 0 +
Co2To207
Fig. 8. Intracrystalline chemical variations (zoning) plotted in terms of hypothetical end-member compositions. Mn and Pb areincluded with Ca, and Nb with Ta.
reaching the approximate limits of 0.4 and 0.6 atoms performula unit for a defect (AtrBrO?) and ideal (ArBrO?)microlite, respectively. Note that the U6+ values may beslightly overestimated in calculating all the U (4+ and6+) as hexavalent. With increased hexavalent U at the Asite, increased divalent anions are needed in the Y site topreserve electrostatic neutrality as well as possible; alter-natively, the stable uranyl group simply persists as a fun-damental unit in the crystal. An alternative diagram thatillustrates this same relationship is a plot of U6+ versusthe O content of the Y site (r: 0.93). However, the truevalues of the Y-site O are dependent on the water orhydroxyl content and the specific method of calculatingthe structural formula.
Other microlite end members involve the incorporationofU at the A site and Ti at the B site. A close positivecorrelation of U-Ti in zoning patterns can be used topostulate the components CaUTirOr, Ua+TaTiO.F, andIJ6+Ti2O? (or Ua+TirOu). The first two are excluded owingto a lack ofcorrelation observed for Ca-U and the negativecorrelation found for U-F (r : -0.79). The U-F data plot-ted in Figure 7 are consistent with the structure of the
uranyl group ifU is considered to have entered the struc-ture as U6+ al the A site. However, data for A and Yvacancies (Fig. 6) suggest that at least some of the U wasoriginally incorporated as IJa*. Furthermore, when weform the component U6*Ti2O, (or Uo*TirOu), there isusually excess U remaining that must be considered to beUa* in a compon€nt like Ua*TarO, (disregarding primaryalteration effects). Iacking more precise data on the initialoxidation state of U, we arbitrarily use the end membersIJ6*Ti2O7 and Ua*TarO, for purposes of plotting in Fig-ures 8 and 9. These account for up to 300/o ofthe observedchemical variation. Intracrystalline zoning patterns aredisplayed in Figure 8 based on the end members Na-CaTarOuF, CarTarO.,, CaTarOu, UTarOr, and UTirOr. Inall cases, Mn and Pb are included with Ca and Nb withTa. Core-to-rim trends indicate increases in the compo-nents CarTarOr, CaTarOu,UTarOr, and UTirO, relativeto NaCaTarOuF. The substitution schemes derived fromthese trends are listed in Table 4 in order of decreasingimportance. Alteration effects have been evaluated on thesame basis. Figure 9 shows that the end members UTarO,and CarTarO, increase in relation to NaCaTarOuF. In
zoe
NoCoTo2O5F
Fig. 9. Primary (hydrothermal) alteration effects plotted in terms of hypothetical end-member compositions. Mn and Pb areincluded with Ca, and Nb with Ta. Apparent increases in U end members are the result of major increases in the CarTarO,component.
CoTo. /\':
U
. coreso n m s
50 mole %
o o l te red
. uno l le red

LUMPKIN ET AL.: MICROLITE FROM HARDING PEGMATITE 581
"lib + -Ta
-Ta + "Nb
AcuYo - \.YrAgYg ' \.YrA..L.B-. Y^ A. A- B- Y.
u u r l r u + N a u a f a ? t
ffi;Yo . \.oc.""
AcrYo ' \.YrAcuYo . hY!i f Mn- :
\6* fu" * \_,4* rru
Table 4. Substitution schemes for microlites from theHarding pegmatite
zonlng Trends Pri f iary Alterat ion
like ACarBMn - oNaz"Ta or AU'6+BMn + AIJ4+BTa be-come plausible, the second scheme involving oxidationof u.
Cnnurcll, vARTATtoNS BETwEEN LrrHolocrc UNITS
The major-element chemistry, displayedin typical fash-ion on ternary diagrams for the A- and B-site cations (Figs.3 and 4), does not allow the clear chemical distinctionbetween microlites from different lithologic units. In orderto determine if the microlites from diferent lithologicunits are chemically distinct, the five groups of 217 mi'crolite analyses were subjected to discriminant analysison the basis of 20 variables consisting of the atomic com-positions for all the elements determined and the sum ofA-site cations. Discriminant analysis is a powerful toolfor multivariant analysis (Davis, 1973) and classificationimprovement of complex mineral groups (e.g. Ewing,I 976). The purpose here is simply to describe the chemicaldifferences among microlites from different lithologic unitswithin the pegmatite and to identify the chemical changesdue to primary hydrothermal alteration.
The discriminant analysis procedures used are those in theStatistical Analysis System software (SAS, 1982). One ofseveralassumptions concerning the variables employed in multivariantprocedures necessary to test the significance of diferences be-tween groups is that the variables have a multivariant normal
some cases, UTirO? increases relative to NaCaTarOuF,and CarTarO, increases with respect to CaTarO.. Becauseof the major substitution of Ca.rTarOr, increases in the Ucomponents are more apparent than real. Correspondingsubstitution schemes are ranked in Table 4 for comparisonto zoning trends. The major similarity seems to be thecoupled substitution ACaYO * rNaYF (type 5, Aleshinand Roy, 1962). Differences include schemes involvingvacancies; for example, AEY! - ANaYF is common inzoning patterns and ACaYO - AEYII occurs as a result ofalteration. These substitution schemes represent forma-tion of Schottky-type defects during crystal growth andtheir filling during hydrothermal alteration. Both schemesfall undertype 8 ofAleshin and Roy (1962). IfMn3* entersthe B site during alteration, then coupled substitutions
Table 5. Means and standard deviations of the most discriminating chemical variables by lithologic unit for the Harding
Pegmatite microlites
VariableQuartz-1ath
spodumene zoneCleavelandite
unlt
Microcl lne- Lepldol i te- c leavelandlte unlt
spodunene zone cleavelandlte aubunlt (1n beryl zone)
T 1
Na
N o . C a s e s
0 . 0 2! 0 . 0 1
0 . 0 0 1i0 .002
0 . 0 11 0 . 0 1
I . 0 9r 0 . 0 7
0 . 0 0 41 0 . 0 0 3
0 . 0 0 1r 0 . 0 0 2
0 . 7 01 0 . 0 9
0 ,008! 0 . 0 9
0 .005! 0 . 0 0 2
r . 7 7t 0 . 0 6
0 , 7 1! 0 . I 2
6 1
0 . 0 5! 0 . 0 5
0 . 0 1! 0 . 0 1
o . o 2! 0 . 02
L . O 2r0 .09
0 .005!0 .001
0 .009r 0 . 0 1
0 . 6 5r 0 . I 7
0 . 0 1r0 . 02
0 .00610 ,003
r . 7 4!0 . 07
0 . 7 1!0 . 16
5 1
0 . 1 4! 0 . 0 5
0 . 0 0 4! 0 . 0 0 7
0 . 0 4t 0 . 0 3
i . 0 91 0 . 1 5
0 .003! 0 . 0 0 3
0 . 0 IJ 0 . 0 2
0 . 4 3! 0 . 1 3
0 . 0 5i 0 . 0 4
0 . 0 0 5! 0 . 0 0 3
I . 6 5r 0 . 0 7
0 . 5 8! 0 , 1 2
)o
0 . 1 3!0 .03
0 . 0 3l o , 0 2
0 . 0410 . 03
I . 0 3r0 , 14
0 . 00s10 .00 I
0 . 005r0 , 001
0 . 5 r! 0 .06
0 . 0 2! 0 . 0 1
0. 006r0 .002
r . 63!0 .04
0 . 6 0! 0 . r 2
1 8
0 . 0 7r0 , 04
0 . 03r0 .02
0 . 09i0 .07
I . 0710 .05
0 .004!0 .003
0 . 0 r10 .009
0 . 5 7i 0 . 14
0 . 0 3lo .02
0 .008!0,004
1 . 6 3!0 . l 5
0 .50!0 . 10
30
Ta
Although the var lables B1, Ba and Th were signi f icant, they are excluded because their values are near the mlnlmun detect lon
l ioi t for the electron nicroDrobe,
582 LUMPKIN ET AL.: MICROLITE FROM HARDING PEGMATITE
Table 6. Classification summaries for the groupings oflithologic units and unaltered/altered, using the set of
most discriminating variables in each case
Number o f obee lva t lons
c l a s s i f i e d i n t o :
A. quarlz- lath spodumene zoDeB, Cleavelandite unitC. Microcl ine-spodumene zoneD. L€pldol i te-cleavelandlte subunitE. Cleavelendite unit ( in Beayl zone)
A . B . C . D . E .5 8 1 I 0 11 2 3 E 0 0 l
1 0 5 5 0 00 0 0 1 8 00 0 0 0 3 0
T o t a I s
) l
l 83 0
216
4
q)
-ooo
oocoCooNumber of observat ions
c l e s s i f l e d i n t o 'u n a l t e r e d a l t e r e d t o t a l s
u n a l t e r e d 1 6 1 I I 1 7 2a l t e r e d 4 4 0
216
oEo()q)
a - 2
distribution. For the microlite data this is only approximatelytrue, as many of the variables deviate from normality within$oups by positive skewness. Fortunately, for mild deviations ofthis kind, the test statistics remain robust (Tabachnick and Fidell,1983). We will not belabor the credibility of this and other as-sumptions (although they could be discussed at length), in thatour goal is description rather than inference or classification.
As rnultivariant procedures can be adversely affected by out-liers, the analyses were examined for outliers, and a single analysiswith an unreasonably low total was removed. For the remaining216 analyses, a stepwise discriminant procedure was applied tothe groupings of lithologic units to determine the most signifi-cantly discriminating variables. Of the 20 variables examined,I 4 were significant at the 290 level; they are (in order ofdecreasingF-value): U, Fe, Ti, Bi, Ca, Ce, Pb, F, Mn, Ba, Sb, Th, Ta, andNa (Table 5). However, the Bi, Ba, and Th values are near theminimum detection limit of the electron microprobe, so theseare not meaningful. The classification summary in Table 6 allowsthe evaluation of the success of the discriminant analysis. Ingeneral, all of the microlite analyses are grouped correcfly ac-cording to their a priori labels, except for those from the cleave-landite unit. A substantial number (230lo) of those microlite anal-yses were misclassified into the quartz-lath spodumene zone.This indicates that the cleavelandite unit has chemical charac-teristics that overlap with those of the quartz-lath spodumenezone, which is not surprising, as the cleavelandite unit is, in part,a replacement ofthe quartz-lath spodumene zone. Because theoverall groupings are correct, microlites from different lithologicunits can be easily distinguished on the basis oftheir chemistry.
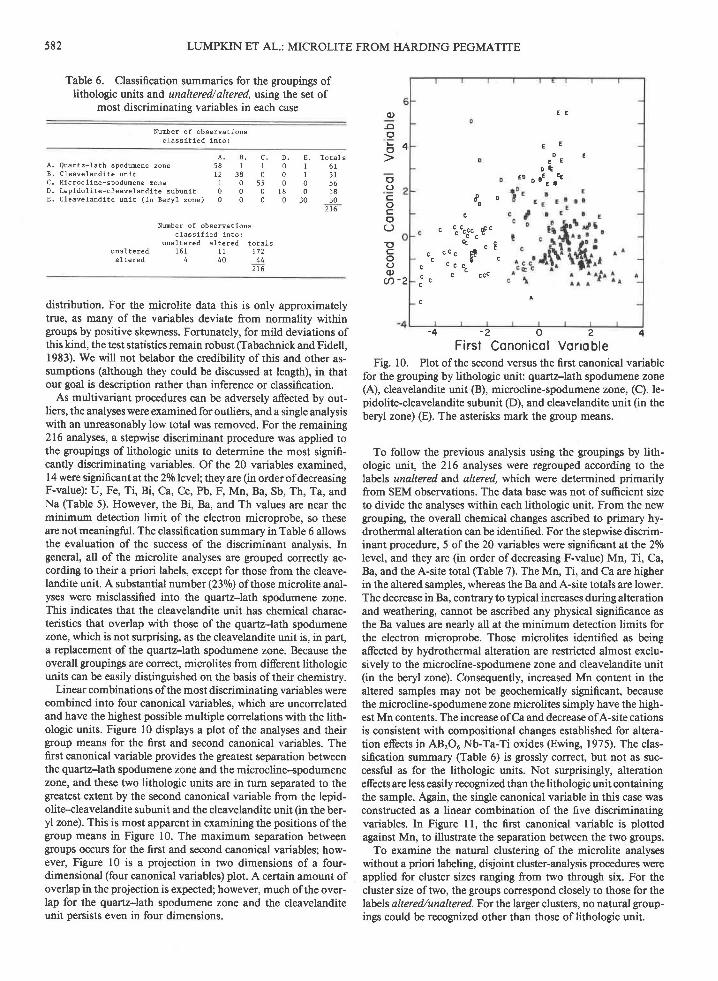
Linear combinations of the most discriminating variables werecombined into four canonical variables. which are uncorrelatedand have the highest possible multiple correlations with the lith-ologic units. Figure l0 displays a plot of the analyses and theirgroup means for the first and second canonical variables. Thefirst canonical variable provides the greatest separation betweenthe quartz-lath spodumene zone and the microcline-spodumenezone, and these two lithologic units are in turn separated to the$eatest extent by the second canonical variable from the lepid-olite-<leavelandite subunit and the cleavelandite unit (in the ber-yl zone). This is most apparent in examining the positions of thegroup means in Figure 10. The maximum separation betweengiroups occurs for the first and second canonical variables; how-ever, Figure 10 is a projection in two dimensions of a four-dimensional (four canonical variables) plot. A certain amount ofoverlap in the projection is expected; however, much ofthe over-lap for the quartz-lath spodumene zone and the cleavelanditeunit persists even in four dimensions.
- 4 - 2 0 2 4
First Cononicol VoriobleFig. I 0. Plot of the second versus the first canonical variable
for the grouping by lithologic unit: quartz-lath spodumene zone(A), cleavelandite unit (B), microcline-spodumene zone, (C), le-pidolite-cleavelandite subunit @), and cleavelandite unit (in theberyl zone) (E). The asterisks mark the gxoup means.
To follow the previous analysis using the groupings by lith-ologic unit, the 216 analyses were regrouped according to thelabels unaltered and. altered, which were determined primarilyfrom SEM observations. The data base was not of sufrcient sizeto divide the analyses within each lithologic unit. From the newgrouping, the overall chemical changes ascribed to primary hy-drothermal alteration can be identified. For the stepwise discrim-inant procedure, 5 of the 20 variables were significant at the 2o/olevel, and they are (in order of decreasing F-value) Mn, Ti, Ca,Ba, and the A-site total (Table 7). The Mn, Ti, and Ca are higherin the altered samples, whereas the Ba and A-site totals are lower.The decrease in Ba, contrary to typical increases during alterationand weathering, cannot be ascribed any physical significance asthe Ba values are nearly all at the minimum detection limits forthe electron microprobe. Those microlites identified as beingafected by hydrothermal alteration are restricted almost exclu-sively to t}te microcline-spodumene zone and cleavelandite unit(in the beryl zone). Consequently, increased Mn content in thealtered samples may not be geochemically significant, becausethe microcline-spodumene zone microlites simply have the high-est Mn contents. The increase of Ca and decrease ofA-site cationsis consistent with compositional changes established for altera-tion effects in AB'O. Nb-Ta-Ti oxides (Ewing, 1975). The ctas-sifrcation summary fiable 6) is grossly correct, but not as suc-cessfirl as for the lithologic units. Not surprisingly, alterationeffects are less easily recognized than the lithologic unit containingthe sample. Again, the single canonical variable in this case wasconstructed as a linear combination of the firre discriminatingvariables. In Figure 11, the first canonical variable is plottedagainst Mn, to illustrate the separation between the two groups.
To examine the natural clustering of the microlite analyseswithout a priori labeling, disjoint cluster-analysis procedures wereapplied for cluster sizes ranging from two through six. For thecluster size oftwo, the groups correspond closely to those for thelabels altered/unaltered. For the larger clusters, no natural group-ings could be recognized other than those of litholog;rc unit.
E €
E -
0 €E E
o EE o ̂ . E +
" - E a
f , oo
c c ^ c 6 c c F c
e " tc c e c t - '
b - cc
c
c
c

Table 7. Means and standard deviations of the mostdiscriminating chemical variables by the labels
unaltered/altered for the Harding pegmatitemicrolites
583
Fig. I l. Plot of the Mn content versus the canonical variablefor the groupingby unaltered (solid circles) and altered (opencircles). The asterisks mark the group means. For a single ca-nonical variable, the data need only be plotted as a histogram;we chose to plot Mn because it is the most significantly discrim'inating variable.
mg) and the total number of displacements per atom (dpa)
have been calculated. It is more common to calculate dosein units of alphas per cubic meter, but this requires ameasured value for the density ofeach sample (the densitydecreases with increasing dose). The dose was calculatedfollowing the method of Holland and Gottfried (1955)
based on the decay schemes for 238U and 235U'. Becausethe Th concentration in the microlites is low, no consid-eration was given to alpha events associated with the de-cay of 232Th. An age of 1300 m.y. B.P. was used (Brookins
et al., 1979). With each alpha-decay event, a recoil nucleus(0.07 MeD and an alpha particle (4 MeV) is produced.
The range of the alpha particle is up to approximatelyl0 000 nm, but its energy is dissipated mainly by elec-tronic excitation, ionization events, and at most severalhundred atomic displacements. The recoil nucleus has arange of l0 nm, but because of its greater mass, it pro-
duces up to several thousand atomic displacements de-pending on the material. The number of displacementsper atom is calculated assuming 1500 atomic displace-ments per alpha-decay event (Weber et al., 1982; Eyal andFleischer, 1985). One must caution that in the correlationof changes in structural or physical properties with eitherdose or dpa for natural samples, "anomalous" samplesmay result from thermal events that have caused an-nealing and/or recrystallization. Alternatively, the cal-culated dose and dpa may be in error due to alterationthat has removed or added U or Th to the sample. Thespecial value of this extensive set of microlite data is thatthere are enough data available to clearly identifu such"anomalous" samples.
The calculated doses for the Harding microlites range
LUMPKIN ET AL.: MICROLITE FROM HARDING PEGMATITE
varlable u n a l t e ! e d
T1
0 . 0 11 0 . 0 1
0 , 0 21 0 . 0 2
I . 0 4! 0 . 0 9
r . 8 3i0 . 08
1 7 2
0 . 0 71 0 . 0 3
0 . 0 8t 0 . 0 6
l . I 7r 0 . 0 9
1 . 9 3r 0 . 1 0
C a
A - t o t a I
N o . c a s e s
Although the var lable Ba uas slgnl f lcant ' i t waa excluded becausethe values are near the mlnlmum l ihl t for the electron mlcroprobe.
Chemical variations between lithologic units can besummarized as follows: (l) In primary units, the earliestmicrolites approach NaCaTa, ,Nbo.rO.F within the qvafiz-lath spodumene zone. (2) Subsequent crystallization ofthe microcline-spodumene core unit produced microliteswith 0.,H.7 Na, 0.14.2 U, 0.G4.1 Pb, 0.2-0.4 Nb, 0.0-0. I Ti, and 0.14.6 F atoms per formula unit. These arethe highest U and lowest Na and F contents observed.Primary alteration produced up to 1.3 Ca and 0.1 Mnatoms per formula unit in microlites from this unit. (3)Microlites from the cleavelandite core unit are similar incomposition to those of the quartz-lath spodumene zoneexcept for 0.0-0. I U and 0.4-0.8 F atoms per formulaunit. (4) Where the cleavelandite unit replaced the berylzone, microlites contain up to 0.03 Fe, 0.2 Ti, and 0.6Nb atoms per formula unit. These are the highest valuesof Fe, Ti, and Nb observed in this study.
RlorlrroN EFFEcrs (lrnrlrnrrcrrzlrroN)
Because ofthe wide variations in UO, content (less than0.1 wto/o to nearly l0 wto/o), the microlites of the Hardingpegmatite present a rare opportunity to study the effectsof alpha-recoil damage on the pyrochlore structure-typeas a function of increasing dose. These observations haveimportant practical applications, as the pyrochlore struc-ture-type is a common constituent of polyphase, crystal-line, nuclear waste forms that have been proposed for thelong-term isolation of actinides (Ringwood, 1982, 1985;Dosch et al., 1984; Morgan et al., I 984). Observations onthe transition from the fully crystalline to X-ray diffractionamorphous state for the natural microlites over long pe-riods of time (1300 m.y. B.P.) can be compared to syn-thetic pyrochlore structure-types that have been dopedwith '?4Cm or 23tPu and observed to levels of equal dose(fully X-ray and electron diffraction amorphous) over pe-riods of several years (Wald and Oflermann, 1982; Clinardet al., 1984a, 1984b; Weber et al., 1985). We present herepreliminary observations on the transition from the crys-talline to metamict state for the Harding pegmatite mi-crolites.
For each of the microlites analyzed, a total dose (alphas/
=E
oE
c
o l

584 LUMPKIN ET AL.: MICROLITE FROM HARDING PEGMATITE
il.",,.",tr,, l^, i l
[ , "" , . :
l i l , l,1 .,1
-|-1!9f r--.-[] f -i-*____Jt*.^*,_' z a a ( t 7 ) ^ a
- t 5 3 ( 4 9 )
5 232
2 e
Fig. 12. Powder X-ray-diftaction scans for Harding peg-matite microlites. Numbers in parentheses are calculated valuesof the displacement/atom. Data for these samples are listed inTable 8.
from < l0'a to 4.5 x 10¹⁷ alphas/mg with equivalent dpavalues of < 0. I to 6 I . The maximum doses are well beyondthe doses normally required to cause a material to becomeX-ray or electron diffraction amorphous and well beyonddoses commonly attained in doped materials. Experi-ments on doped, synthetic samples commonly reach dosesof 10'z5 alphas/m3, which is roughly equivalent to l0r5alphas/mg. It is interesting to consider the difference be-tween the dose rate for the natural and synthetic samples.As an example, zirconolite (a pyrochlore structure-typederivative) doped with 238Pu which has reached a dose of1025 alphas/m3 experiences a damage rate of l0-8 dpals(Clinard et al., 1984b). The microlites of the Hardingpegmatite which have reached doses of 4 x l0'? alphas/mg have experienced a damage rate of l0-15 dpals, a ratefully seven orders of magnitude slower than that of thesynthetic samples.
Selected X-ray powder diffractograms for unannealedmicrolites are illustrated in Figure 12, and the correspond-ing dose, displacement, and cell-parameter data for thesamples are summarized in Table 8. The microlites retaingood X-ray difraction crystallinity up to doses of l0raalphas/mg. In the range of 10'6 alphas/mg there is a markeddecrease in the intensity of the diffraction maxima, untilat a dose of l0I7 alphas,/mg, there are no diffraction max-ima. The decrease in X-ray intensity over a short rangeof the total dose is typical ofthe damage in-growth processand is seen in natural zircons (Holland and Gottfried.1955), zircons doped with 238Pu (Weber, pers. comm.),GdrTirO, doped with ,aaCm (Wald and Oflermann, 1982),and CaZrTirO, doped with 244Cm and 23sPu (Clinard etal., 1984a, 1984b). Although unit-cell refinements for themicrolites having various levels of damage have been made(Table 8), there is no systematic evidence for the expan-sion of the unit cell with increasing damage as describedfor the synthetic samples in other studies. The observeddecrease in a correlates with decreasing Na (ro : 0.118nm) and Ta (r" :0.064 nm) and increasing amounts oflJo* (rn : 0.100 nm), Uu* (ro : 0.086 nm), Ca (ro : 0.112nm), and Ti (r" :0.061 nm) in the five samples (Table8). The microlite samples can be annealed by heating at
Table 8. Summary of calculated doses (alphas/mg) anddisplacements per atom (dpa) for selected microlites
from the Harding pegmatite
S a n p l e N o . U 0 3 ( w t . Z ) alphas/ng
<1
3
9
1 7
E s t i n a t e d s E a n d a r d e r r o r s ( 1 n p a r e n t h e s e s ) r e f e r t o t h e l a s t d i g 1 t .
1000.C in air for l0 h. Although it is not possible tocorrelate the change in unit-cell volume directly with thedegree of damage (owing to compositional variations),there is a slight decrease in the unit-cell volume for theannealed samples. Based on differential scanning calorim-etry and differential thermal analysis, there is a dehydra-tion endotherm at low temperature (150 to 300'C) and arecrystallization exotherm in the range of 450 to 600"C(Chakoumakos, 1978; Clinard, pers. comm.).
Details of the transition can be followed by the use ofelectron microscopy (Figs. 13, l4). The electron micro-graphs and their accompanying diffraction patterns showthe atomic structure at doses of (a) l0'a, O) l0'u, and (c)10'7 alphas/mg. At the intermediate dose (Fig. 14b), thelattice fringe image (two-beam image using the I I I re-flection) shows that most of the microlite still retains itscrystallinity, but with distinct patches or aggregates ofaperiodic (no fringes) material. The electron-diffractionpattern is distinct, but with the added presence ofa faintbroad diffraction halo caused by the aperiodic areas. Atthe highest dose (Fig. l4c), there is no evidence for crys-tallinity, and we see only a multiple, broad-halo type dif-fraction pattern that is characteristic of an aperiodic struc-ture. The equivalent d-spacing for the innermost halo is0.298 nm. The interpretation of these electron-diffractionhalos is discussed by Ewing and Headley (1983). Thus,the progression of structural modifications for natural mi-crolites with increasing alpha dose is one ofisolated defectaggregates (i.e., individual alpha-recoil tracks) up throughdoses of l0'a alphas/mg with no detectable effect on thematerial's ability to diffract X-rays or electrons, continueddamage and overlap ofthese aggregates yielding coexistingregions of amorphous material and remaining crystallinedomains in the range of l0t5 to 1016 alphas/mg, with afinal saturation value reached at > 101? alphas/mg. A sim-ilar transition is observed over approximately the samerange ofdoses for natural zirconolites and synthetic zir-conolites that have been doped with 23EPu (Ewing andHeadley, 1983;Clinard et al., 1984a, 1984b). This suggeststhat there is no correlation between damage and dose rateeven when the dose rate varies by as much as seven ordersofmagnitude. For the Harding pegmatite microlites, thereis no evidence for significant annealing during the damageprocess.
The X-ray and electron-ditrraction data do not allowone to explicitly describe the atomic structure of the final,
141
r49
I 5 0
2 8 8
r 5 3
< 0 . 0 5 . r o l 4
0 . 8 3 x 1 0 1 6
I . 8 7 x 1 0 - -
3 , 2 t x t O 1 7
8 . 9 4 x I o l T
1 0 . 4 2 9 ( l )
1 0 . 4 2 8 ( l )
r 0 . 4 r 8 ( 2 )
r 0 . 3 8 9 ( 4 )

LUMPKIN ET AL.: MICROLITE FROM HARDING PEGMATITE 585
Fig. 13. Two-dimensional lattice image of crystalline microlite no. I 47 in the ( 1 I 0) plane. (a) Principal lattice dimensionsare given for the [001] (1.0 nm), U 101 (0.7 nm), and I t l] (0.6nm) directions. Arrows denote dislocations within the band oflower contrast. (b) Enlarged region shown in (a) is interpreted interms of the BrO. framework structure of microlite.
damage-saturated state. It is important to understand thestructure ofthis aperiodic state in order to evaluate wheth-er further structural modifications may be expected withincreasing dose. Structural information obtained from X-ray absorption spectroscopy for Ti and U (Greegor et al.,I 98 5a, I 98 5b) indicates the persistence of TiOu octahedraand, tentatively, uranyl groups in metamict pyrochloregroup minerals.
Suprlr,lnv AND coNcLUSroNS
Microlite, ranging from crystalline to metamict, is aprincipal accessory in several lithologic units of the Hard-ing pegmatite, Taos County, New Mexico. From the se-quence of lithologic units within the pegmatite, crystal-lization of microlite from the pegmatite magma is inferred
Fig. 14. Lattice-fringe images (two-beam image using the I 1lreflection) and electron-diffraction patterns for microlites illus-trating the effect ofincreasing alpha-event dose: (a) no. 147' (b)no. 150, and (c) no. 153. A summary of the data for each sampleis given in Table 8.
to have begun relatively late, after the formation of theberyl and quartz zones, and continued throughout theformation of the core zones and subsolidus replacementunits. Microlite is most abundant in the quartz-lath spod-umene and microcline-spodumene ("spotted rock") zones.In both zones the microlite occurs as small subhedral toeuhedral crystals commonly zoned from light cores todark rims and never more than 5 mm in size.
Over 200 chemical analyses of microlite determined byelectron microprobe are reported, and they are consistentwith the accepted structural formula, A2-.B2X6Yr-,O'pHrO, where principally A : Ca, Na, U, Mn; B : Ta, Nb,Ti; X: O; and Y: F, OH, O. Typical ranges (weightpercent) for major constituents are 60-78 TarOr, 2.5-12

586 LUMPKIN ET AL.: MICROLITE FROM HARDING PEGMATITE
Nb2O5, 0.0-3.2 TiOr, 0.0-l l UOr; 8.0-13 CaO, 2.0-5.5NarO, 1.5-3.5 F, and 0.1-4.0 HrO. Primary (hydrother-mal) alteration results in an increase (in atoms per formulaunit) in Mn of 0.05-0.10; Ca, 0.204.40; and O, 0.10-0.40. The HrO content remains essentially constant. Sec-ondary (weathering) alteration results in decreases (in at-oms per formula unit) in Na of up to 0.7; Ca,0.5; and F,0.5. Low analytical totals in the probe results for alteredareas suggest total HrO contents of 8-l 3 wt0/0. The zoningin the individual crystals corresponds to three generaltypes: (l) Nb, Na, and F decrease and Ta, Ca, U, Ti, andHrO increase from core to rim; (2) cores are rich in Nb,Ta, Na, and F and rims are relatively rich in U, Ti, andHrO; (3) Ta, Na, and F decrease and Nb, Ca,tJ, Ti, andHrO increase from core to rim. The compositional vari-ations between grains and the zoning relations are usedto identify the principal substitution schemes in the mi-crolite structure (Table 4). Major substitution schemesinclude (l) ACaYO - rNaYF and (2) AEYD + ANayF (zon-ing patterns) and (3) ACaYO - AlyD (primary alteration).One of the most interesting correlations is the inverserelationship between U and F. On the basis of the as-sumption that the U is hexavalent, the data suggest thatthe uranium is in the cubic A site in the pyrochlore struc-ture type with much the same coordination geometry asthat found in the uranyl group. This is an important ob-servation, as the uranyl group has been tentatively iden-tified as a molecular unit in fully metamict pyrochloregroup minerals (based on extended X-ray absorption fine-structure spectroscopy).
Multivariant analyses of the chemical variations in themicrolites grouped according to lithologic unit demon-strate that unique chemistries characterize each group. Of20 variables examined, I 4 were significant at th e 2o/olevel;they are (in order of decreasing F-value): U, Fe, Ti, Bi,Ca, Ce, Pb, F, Mn, Ba, Sb, Th, Ta, and Na. In the singlecase of substantial misclassifi cation (23o/o of the microlitesin the cleavelandite unit were misclassified into the quartz-lath spodumene zone), the similarity is expected, as thecleavelandite unit is, in part, a replacement of the quaftz-lath spodumene zone.
Radiation efects (metamictization) are clearly evidentin the microlites. Because of the wide variations in UO3content (less than 0. I wto/o to nearly l0 wt0/0), the mi-crolites exhibit the full range of structural periodicity fromcompletely crystalline (< I dpa), partially crystalline (upto 10-20 dpa), to completely X-ray and electron diffrac-tion amorphous (>20 dpa). Based on X-ray and electron-diffraction analysis, the progressive structural modifica-tion of natural microlite with increasing alpha dose is oneof isolated defect aggregates (i.e., individual alpha-recoiltracks) up through doses of l0ra alphas/mg with no effecton the material's ability to diffract X-rays or electrons,continued damage and overlap ofthese defect aggregatesyielding coexisting regions of amorphous and crystallinedomains at l0'5 to l0'6 alphas/mg, with a final saturationvalue received at doses greater than l0r7 alphas/mg. Theaccumulated radiation damage postdates hydrothermal
alteration and is contemporaneous and on-going with sec-ondary (weathering) alteration.
AcxNowlnocMENTS
Art Montgomery in donating the Harding pegmatite propertyto the University of New Mexico has preserved a unique outdoorgeologic laboratory for research and teaching. His generous giftand continued support has stimulated renewed interest in thisclassic locality. R. C. Ewing is grateful for the many discussionshe shared with Dick Jahns on the mineralogy and petrogenesisof the Harding pegmatite. Dick strongly supported the Universityof New Mexico's and Art Montgomery's efforts to preserve theHarding pegmatite as a classic locality for teaching and research.This paper only follows Dick's lead. We thank Eugene Foord,Lynn Boatner, Dick Jahns, and Paul Hlava for providing micro-probe standards, Ian Mackinnon for assistance with the rrv,Elaine Faust-Stevens for drafting the figures, and Paula Stout forassistance with data and word processing. The authors are gratefulfor the thorough reviews by G. J. McCarthy and E. R. Vance.
The electron-microprobe analyses, scanning electron micros-copy, and transmission electron microscopy were completed inthe Electron Microbeam Analysis Facilitv in the Department ofGeology and Institute of Meteoritics at the University of NewMexico supported in part by the Center for High TechnologyMaterials.
This work was supported by the U.S. Department of Energy,Office of Basic Energy Sciences under grant #DE-FG04-84ER45099.
RnrnnnNcnsAleshin, Eugene, and Roy, Rustum. (1962) Crystal chemistry of
pyrochlore. Arnerican Ceramic Society Journal, 4 5, | 8-25.Aldrich, L.T., Wetherill, G.W., Davis, G.L., and Tilton, G.R.
(1958) Radioactive ages of micas from granitic rocks by Rb-Sr and K-Ar methods. American Geophysical Union Trans-actions, 39, 1124-1134.
Bonshtedt-Kupletskaya, E.M. (1966) Systematization of the pyr-ochlore-microlite mineral group. Zapiski Vsesoinznoe Miner-alogicheskoe Obshechestvo, 95, 134-144 (In Russian).
Borodin, L.S., and Nazarenko, I.I. (1957) Chemical compositionof pyrochlore and diadochic substitution in the ArBrX, mol-ecule. Geokhimiya, 4, 386-400 (transl. Geochemistry Inter-national, 4, 33U349, 1957\.
Brookins, D.G., Chakoumakos, B.C., Cook, C.W., Ewing, R.C.,Landis, G.P., and Register, M.E. (1979) The Harding peg-matite: Summary of recent research. In R.V. Ingersoll and L.A.Woodward, Eds. New Mexico Geological Society Guidebook,
- 30th Field Conference, Santa Fe Country, 12'7-133.Cernf, Petr. (1982) Anatomy and classification ofgranitic peg-
matites. In P. Cernf, Ed. Granitic pegmatites in science andindustry, 1-40. Mineralogical Association of Canada ShortCourse Handbook 8.
C-ernf, Petr, and Burt, D.M. (1984) Paragenesis, crystallochem-ical characteristics, and geochemical evolution of micas ingranitic pegmatites. In S.W. Bailey, Ed. Micaq257-298. Min-eralogical Society of America Rewiews in Mineralogy, 13.
Chakoumakos, B.C. (1978) Microlite, the Harding pegmatite,Taos County, New Mexico. B.S. thesis, University of NewMexico, Albuquerque.
- (1984) Systematics ofthe pyrochlore structure type, idealA,B2X6Y. Journal of Solid State Chemistry,53, 12U129.
Chakoumakos, B.C., and Ewing, R.C. (1985) Crystal chemicalconstraints on the formation of actinide pyrochlores. In C.M.Jantzen, J.A. Stone, and R.C. Ewing, Eds. Scientific basis fornuclear waste management VIII, Materials Research SocietySymposia, Proceedings, 44, 641-646. Materials Research So-ciety, Pittsburgh.

LUMPKIN ET AL.: MICROLITE FROM HARDING PEGMATITE 587
Clinard, F.W., Jr., Rohr, D.L., and Roof, R.B. (1984a) Structuraldamage in a self-irradiated zirconolite-based ceramic. NuclearInstruments and Methods in Physics Research, B1, 581-586.
Clinard, F.W., Jr., Peterson, D.E., Rohr, D.L., Hobbs, L.W.( I 9 84b) Self-irradiation effects in 238Pu-substituted zirconoliteI. Temperature dependence of damage. Journal of Nuclear Ma-terials, 126,245-254.
Colby, J.W. (1968) v,rcrc IV-A computer program for quan-titative electron microprobe analysis. Advances in X-ray Anal-ys is , 11 ,287-305.
Davis, J.C. (1973) Statistics and data analysis in geology, chapter7. Wiley, New York.
Dosch, R.G., Headley, T.J., and Hlava, Paul. (1984) Crystallinetitanate ceramic nuclear waste forms: Processing and micro-structures. American Ceramic Society Journal, 67 , 354-361.
Ewing, R.C. (1975) Alteration of metamict, rare-earth, ABrO.-type M-Ta-Ti oxides. Geochimica et Cosmochimica Acta, 39,52 r-530.
- (1976) A numerical approach toward the classifrcation ofcomplex orthorhombic, rare-earth, ABrOu-type Nb-Ta-Ti ox-ides. Canadian Mineralogist, 14, 111-1 19.
Ewing, R.C., and Headley, T.J. (1983) Alpha-recoil damage innatural zirconolite (CaZrTirOr). Journal of Nuclear Materials,1 1 9 , 1 0 2 - 1 0 9 .
Eyal, Yehuda, and Fleischer, R.L. (1985) Preferential leachingand the age ofradiation damage from alpha decay in minerals.Geochimica et Cosmochimica Acta, 49, 1155-l 164.
Foord, E.E. (1976) Mineralogy and petrogenesis oflayered peg-matite-aplite dikes in the Mesa Grande District, San DiegoCounty, California. Ph.D. dissertation, Stanford University,Stanford, California.
- (1982) Minerals of tin, -titanium, niobium and tantalumin granitic pegmatites. In P. Cernf, Ed. Granitic pegrnatites inscience and industry, 187-238. Mineralogical Association ofCanada Short Course Handbook 8.
Greegor, R.B., Lytle, F.W., Chakoumakos, B.C., Lumpkin, G.R.,and Ewing, R.C. (1985a) An investigation of metamict andannealed natural pyrochlores by X-ray absorption spectros-copy. In C.M. Jantzen, J.A. Stone, and R.C. Ewing, Eds. Sci-entific basis for nuclear waste management VIII, MaterialsResearch Society Symposia Proceedings, 44, 65 5-662. Mate-rials Research Society, Pittsburgh.
- (1985b) An investigation ofuranium L-edges of metamictand annealed pyrochlore. In L. Werme, Ed. Scientific basisfor nuclear waste management IX, Materials Research Society,Pittsburgh, in press.
Harris, P.M. (1965) Pandaite from the Mrima Hill niobium de-posit (Kenya). Mineralogical Magazine, 3 5, 27 7 -290.
Heinrich, E.W., and kvinson, A.A. (1953) Studies in the mica$oup: Mineralogy of rose muscovites. American Mineralogist,38,25-49.
Hirschi, H. (1931) Mikrolith in Spodumenpegmatit bei Embudoin New Mexico. Schweizerische Mineralogische und Petro-graphische Mitteilungen, 253-255.
Hogarth, D.D. (1977) Classification and nomenclature of thepyrochlore g,roup. American Mineralogist, 62, 403-410.
Holcombe, R.J., and Callender, J.F. (1982) Structural analysisand stratigraphic problems of Precambrian rocks of the PicurisRange, New Mexico. Geological Society of America Bulletin,93. 138-149.
Holland, H.D., and Gottfried, David. (1955) The effect ofnuclearradiation on the structure of zircon. Acta Crystallo$aphica, 8,291-300.
Jahns, R.H., and Ewing, R.C. (1976) The Harding mine, TaosCounty, New Mexico. In R.C. Ewing and B.S. Kues, Eds. NewMexico Geological Society, 27th Field Conference, Guidebook,263-276.
- (1977\ The Harding mine, Taos County, New Mexico.Mineralogical Record, 8, I I 5-126.
Long, P.E. (l 974) Contrasting types of Precambrian granitic rocksin the Dixon-Peflasco area, northern New Mexico. In C.S.
Siemers, Ed. New Mexico Geological Society Guidebook, 25thField Conference. Ghost Ranch (Central Northern New Mex-ico), 101-108.
Lumpkin, G.R., and Ewing, R.C. (1985) Natural pyrochlores:Analogues for actinide host phases in radioactive waste forms'In C.M. Jantzen, J.A. Stone, and R.C. Ewing, Eds. Scientificbasis for nuclear waste management VI[, Materials ResearchSociety Symposia Proceedings, 44, 64'1-654. Materials Re-search Society, Pittsburgh.
Mih6lik, P.V.G. (1967) A chemical and mineralogical studv ofmicrolite from the Noumas pegnatite. M.S. thesis, Universityof the Witwatersrand.
Montgomery, Arthur. (1950) Geochemistry of tantalum in theHarding pegmatite, Taos County, New Mexico. AmericanMineralogist, 35, 853-866.
Morgan, P.E.D., Shaw, T.M., and Pugar, E.A. (1984) Ceramicsfor high waste loaded commercial radwaste disposal. In G.W.Wicks and W.A. Ross, Eds. Advances in ceramics, 8, 209-221. Ameican Ceramic Society, Columbus, Ohio.
Norton, J.J. (1983) Sequence of mineral assernblages in differ-entiated granitic pegmatites. Economic Geology, 7 8, 85 4-87 4.
Pyatenko, Yu.A. (1959) Some aspects of the chemical crystal-Iography of the pyrochlor-group minerals. Kristallografiya, 4'20 4JO8 (transl. Soviet Physics - Crystallography, 4, I 8 4- I 86'1960).
Ringwood, A.E. (1982) Immobilization of radioactive wastes insyNRoc. American Scientist, 70, 201-208.
- (1985) Disposal ofhigh-level nuclear wastes: A geologicalperspective. Mineralogical Magazine, 49, 159-17 6.
Safrannikoff, A., and Van Wambeke, L. (1961) Sur un termeplombifere du groupe pyrochlore-microlite. Bulletin de la So-ci6t6 Frangaise de Min6ralogie et de Cristallographte,S4'382-384.
SAS Institute, Inc. (1982) SAS user's guide: Statistics, 1982 edi-tion. A.A. Ray, Ed. Cary, North Carolina.
Shannon, R.D. (1976) Revised effective ionic radii and system-atic studies ofinteratomic distances in halides and chalcogen-ides. Acta Crystallographica, A32,751-76'l '
Sitnin, A.A., and Bykova, A.V. (1962) The first specimen ofmicrolite from granite. Doklady Akademii Nauk SSSR, 147'203-206 (transl. Doklady Akademia Nauk SSSR' 147 ' l4I-r43, 1962).
Subramanian, M.A., Aravamudan, G., and Subba Rao, G.V.(1983) Oxide pyrochlores-A review. Progtess in Solid StateChemistry, 15, 55-143.
Suchomel, T.J. (1976) Geology and mineralogy of the Hardingpegmatite, Taos County, New Mexico. M.S. thesis, Universityof Illinois, Urbana-ChamPaign.
Tabachnick. B.G., and Fidell, L.S' (1983) Using multivariatestatistics, chapter 9. Harper and Row, New York.
Van Wambeke, L. (1970) The alteration processes ofthe complextitano-niobo-tantalates and their consequences. Neues Jahr-buch liir Mineralogie, lI2, ll7-149.
- (1978) Kalipyrochlore, a new mineral ofthe pyrochloregroup. American Mineralogist, 63, 528-530.
Von Knorring, Oleg, and Condliffe, Eric' (198a) On the occur-rence of niobium-tantalum and other rare-element minerals inthe Meldon aplite, Devonshire. Mineralogical Magazine, 48'443-448.
Von Knorring, Oleg, and Fadipe, Akinola' (1981) On the min-eralogy and geochemistry of niobium and tantalum in somegraniie pegmatites and alkali granites of Africa. lulletin de laSociet€ Frinqaise de Mindralogie et Cristallographie' 104,496-507.
Wald, J.W., and Offermann, Peter. (1982) A study of radiationefects in curium-doped GdrTirO, (pyrochlore) and CaZrTitO,(zirconolite). In W. Lutze, Ed. Scientific bosis for nuclear wastemanagement V, Materials Research Society Symposia Pro-ceedings, l l, 369-37 8. North-Holland, New York
Weber, W.J., Turcotte, R.P., and Roberts, F.P. (1982) Radiation

LUMPKIN ET AL.: MICROLITE FROM HARDING PEGMATITE
damage from alpha decay in ceramic nuclear waste forms.Radioactive Waste Management, 2, 295-319.
Weber, W.J., Wald, J.W., and Matzke Hj. (1985) Self-radiationdamage in actinide host phases ofnuclear waste forms. In C.M.Jantzen, J.A. Stone, and R.C. Ewing, Eds. Scientific basis fornuclear wagte management VIII, Materials Research Society
Symposia Proceedings, 44, 679-685. Materials Research So-ciety, Pittsburgh.
M,c,NuscnrPT REcETvED Mny 2, 1985Mam;scnrrr AccEprED NovEvsen 4. 1985