mineralogy and pore water chemistry of a boiler ash … · mgkα, vanadinite for clkα, barytine...
TRANSCRIPT

To be published in Waste Management (2010) – Bodénan et al.
MINERALOGY AND PORE WATER CHEMISTRY OF A BOILER ASH
FROM A MSW FLUIDIZED-BED INCINERATOR
F. Bodénan*, D. Guyonnet, P. Piantone, P. Blanc
BRGM (French Geological Survey), Environment and Processes Division, BP 36009, 3 av. C.
Guillemin, 45060 Orléans Cedex
* corresponding author: Tel: (33) 2 38 64 34 41 – [email protected]
Abstract:
This paper presents an investigation of the mineralogy and pore water chemistry of a boiler
ash sampled from a municipal solid waste fluidized-bed incinerator, subject to 18 months of
dynamic leaching in a large percolation column experiment. A particular focus is on the redox
behaviour of Cr(VI) in relation to metal aluminium Al0, as chromium may represent an
environmental or health hazard. The leaching behaviour and interaction between Cr(VI) and
Al0 are interpreted on the basis of mineralogical evolutions observed over the 18-month
period and of saturation indices calculated with the geochemical code PhreeqC and reviewed
thermodynamic data. Results of mineralogical analyses show in particular the alteration of
mineral phases during leaching (e.g. quartz and metal aluminium grains), while geochemical
calculations suggest equilibria of percolating fluids with respect to specific mineral phases
(e.g. monohydrocalcite and aluminium hydroxide). The combination of leaching data on a
large scale and mineralogical analyses document the coupled leaching behaviour of
aluminium and chromium, with chromium appearing in the pore fluids in its hexavalent and
mobile state once metal aluminium is no longer available for chromium reduction.
Key words: MSW ash, fluidized-bed, leaching, Al metal, Cr(VI), PhreeqC.
1. Introduction
Fluidized-bed combustion (FBC) is a well established technology for burning coal (Valk,
1994), sometimes in combination with biomass (Gogebakan and Selçuk, 2009) or for burning
relatively homogeneous wastes such as sewage sludge (Van de Velden et al., 2008, Toledo et
al., 2005). In recent years, the technology has sometimes been applied to the thermal
1
To be published in Waste Management (2010) – Bodénan et al.
treatment of municipal solid waste (MSW; Rhyner et al., 1995), but such an application
remains an exception. In France for example, out of the 128 MSW thermal treatment units in
operation since 2005, only 4 were based on the FBC technology, while the remaining units
relied on the grate kiln (stationary or moving grate) technology.
The basic principle of FBC is the injection of air at the base of the combustion chamber
through a layer of inert material (typically sand) which generates a suspended mass of waste
and sand particles. This improves waste particle combustion due to the greater contact surface
between the waste and the sand, with the drawback however that the waste must be shredded
to a particle size of around 100 to 300 mm, following the type of technology used. This type
of thermal treatment generates four solid residues: on the one hand air pollution control
(APC) residues and bottom ash, typical of grate kiln incinerators, and on the other hand
hopper ash and cyclone ash. Note that the ash studied in this paper and referred to as “boiler
ash”, is analogous to what Abbas et al. (2003) refer to as “hopper ash” (see Fig. 1 of Abbas et
al., 2003). According to Abbas et al. (2003), among the advantages of the FBC technology are
the low NOx and SOx emissions, the efficiency of heat transfer from the sand bed to the heat
exchanger walls and the low amount of unburned matter in the ash residues.
As a result of the limited extent of FBC technology compared to grate kiln incinerators in
the thermal treatment of MSW, relatively few studies have addressed the chemical
composition and mineralogy of the residues. Abbas et al. (2003) examined the extraction,
using batch leaching tests, of salts from filter ash, cyclone ash, hopper ash and bottom ash
sampled from two FBC boilers in Sweden. Abbas et al. (2001) focused in particular on the
leaching behaviour of chromium in different types of FBC ash (bottom, hopper, cyclone and
filter ashes). These authors underline the influence of Al0 on chromium speciation and hence
mobility.
The leaching behaviour of chromium in ash from waste thermal treatment plants has also
been studied by Astrup et al. (2005; 2006). Astrup et al. (2005) provide a conceptual model
for the interaction between Cr, Al and oxygen that was applied by Guyonnet et al. (2008) to
reproduce the leaching behaviour observed during leaching experiments performed at several
scales on a boiler ash from a FBC plant in France. This paper provides additional data for this
same boiler ash with a special focus on the ash mineralogy and geochemical equilibria in pore
waters collected during the leaching experiment performed in a large column. The new data
provide additional insight into the composition and leaching behaviour of such residues.
2. Materials and Methods
2

To be published in Waste Management (2010) – Bodénan et al.
2.1. Material preparation
The thermal process residue studied herein is a boiler ash from a French rotary fluidized-bed
MSW incineration plant, which burns around 54,000 tons of waste annually. Eighteen tons of
boiler ash were recovered in big bags and dried in a depot from an initial water content of
around 10 weight percent to approximately 0.5%. Because preliminary studies of the ash’s
reactivity indicated a risk of setting during percolation experiments, it was mixed in equal
weight proportions with washed Loire sand (0.1–1 mm). A horizontal continuous feed
pugmill fed by two circuits; one for sand and one for ash, was used to guarantee homogeneous
mixing between the two materials. The flowrates of the two circuits were checked
approximately every 15 minutes. A flowsheet of the preparation of the ash-sand mixture can
be found in Guyonnet et al (2005).
Following mixing, twenty measurements of the ash-sand dry density yielded an average
value of 1.32 g/cm3 with a standard deviation of 0.035 g/cm3. However, during the filling up
of the column experiment described below, some consolidation occurred and overall dry
density increased slightly to 1.39 g/cm3. The grain size of the ash-sand mixture was below 2
mm, with a 10% fraction between 10 and 100µm. Chemical and mineralogical analyses were
performed on the raw ash and on the ash-sand mixture before and after 18 months of dynamic
leaching.
2.2. Global chemical analyses of the solids
Chemical analyses were performed by ICP-AES after alkaline fusion using Na2O2 at 450°C
and then digestion by HCl (method adapted from NF ISO 14869-2, 2002). Major elements
(Ca, Si, Al, Fe, K, Mg, Mn, Na, P, Si, Ti) in the fresh ash were also determined by X-ray
fluorescence (Philips PW2400, sequential) following sample preparation using the bead
technique (addition of a fluxing agent; lithium tetraborate). Chloride was determined by
potentiometric analysis. Total sulphur, total carbon and inorganic carbon were determined by
non-dispersive infrared analysis of the gases CO2 and SO2 released following specific
treatments: digestion by a 25% phosphoric acid solid for inorganic carbon, and oxidation
under O2 at 900°C for total carbon and total sulphur. The amount of organic carbon was
derived by subtracting inorganic carbon from total carbon (Corg = Ctot – Cinorg).
3

To be published in Waste Management (2010) – Bodénan et al.
Contents of Al0 and Cr(VI) in the solid were analyzed before and after leaching in the large
column. Hexavalent chromium in the solid was analyzed colorimetrically following a reaction
between Cr(VI) and 1,5-diphenylcarbohydrazide, under alkaline and warm conditions (EPA
3060A and 7196). Independent checks were performed by adding known amounts of K2CrO4
and Cr(III). Metal aluminium was measured by atomic adsorption spectroscopy following a
controlled attack in a methanol-brome medium (Young, 1974). Crystallisation water was
measured using the Penfield tube method (Sandell, 1951). Uncombined lime was determined
by the classical ethylene glycol method (MacPherson and Forbrich, 1937).
2.3. Mineralogical characterisation of the fresh and leached ash
Crushed powders washed sand and five boiler ash grain-size fractions (500µm – 2 mm; 250-
500 µm; 125-250 µm; 63-125 µm; < 63 µm) were analysed by X-Ray Diffraction before
leaching to identify major phases. The diffractometer with a Bragg Brentano geometry
(Siemens D5000) is equipped with a monochromator and with a cobalt Kα1 radiation (λ=
1.78897 Å). Acquisition time for the XRD patterns in the 4-84°2θ interval was set at one
second per 0.02°2θ step (=1 hour) for rotating samples. The phyllitic fraction of the sand
(clays) was determined according to standard methodology on oriented samples with and
without glycol during 12h and then heated at 490°C (4h). The crystalline phases were
identified using Diffrac-AT software, in conjunction with the JCPDS (Joint Committee on
Powder Diffraction Standards) database.
Micro-characterisation of the samples was performed in order to confirm XRD results with
respect to major crystalline phases, to identify minor and amorphous phases and to detect
trace elements in the phases by element mapping and quantitative analyses. Polished thin
sections of fresh ash and leached ash-sand, were examined under a scanning electron
microscope (SEM) with qualitative energy dispersive spectroscopy (EDS), and a Cameca SX
50 electronic microprobe (EMP) with quantitative wavelength dispersive spectroscopy
(EWS). Additional raw samples of fresh ash were observed by SEM-EDS. EMP conditions
for element mapping were an acceleration voltage of 15 kV and a reference current of 14 nA.
EMP spot analyses were performed with an acceleration voltage of 15 kV and a reference
current of 14 nA. Counting time was 6 seconds for the major elements and 20 seconds for the
trace elements. The used standards were: albite for NaKα and SiKα, orthose for KKα, Al2O3
for AlKα, MnTiO3 for TiKα and MnKα, andradite for CaKα, Fe2O3 for FeKα, forsterite for
4

To be published in Waste Management (2010) – Bodénan et al.
MgKα, vanadinite for ClKα, barytine for SLα, fluorapatite for PKα, Cr2O3 for CrKα, Cu
metal for CuKα, PbS for PbMα, ZnO for ZnKα. Matrix effect corrections were performed
with the “PAP” model (Pouchou and Pichoir, 1991).
2.4. Dynamic and static leaching tests –Water analyses
A downward-flow percolation experiment was performed in a large column described in
Guyonnet et al. (2008). In summary the column is 5 metres high, 1 metre in diameter and
equipped with an outlet at the bottom and 5 porous cups, noted PC1 through PC5, installed at
0.8, 1.82, 2.54, 3.55, and 4.36 m from the waste surface respectively. Data collected at
different depths within the column provide an opportunity to investigate scale effects for a
given infiltration rate. Infiltration of demineralised water was controlled automatically by
sprinklers at the top of the column which sprayed 10 litres every 8 hours (30 litres/day)
resulting, taking into account the column areas (one meter diameter), in an infiltration of
approximately 3.8 cm/day. Porewater and effluent concentrations were monitored during 18
months, providing samples at final liquid/solid (L/S) values ranging from 3 L/kg at the outlet
to 20 L/kg for the uppermost porous cup (PC1).
Prior to chemical analyses, all water samples were filtered at 0.45 µm and sub-samples
were acidified at pH 2 for cation analyses. Dissolved concentrations including total Cr were
determined using standard methods by ICP-AES with a sequential Jobin Yvon JY 38 device
(NF EN ISO 11885) and ionic chromatography (NF EN ISO 10304). Total inorganic carbon
was analysed by infra-red spectroscopy on samples placed on a sealed tube with a septum in
order to avoid carbonation. Cr(VI) was analysed by molecular absorption spectroscopy (NF T
90-043). Results showed that dissolved Cr was only present as Cr(VI) and therefore ICP-AES
results on Crtotal were taken as Cr(VI) concentrations because of the lower quantification limit
(5 µg/l for the ICP-AES as compared to 10 µg/l for the colorimetric method). Due to the
relative abundance of aluminium, which may form colloids in waters at neutral values of pH,
ultrafiltration at 4000 daltons was performed on several samples and analysed for Al, Ca,
SiO2 and SO4. Results showed no significant differences with data measured in water samples
filtered at 0.45 or 0.1 µm.
At the end of the 18-month leaching period, the large column was carefully dismantled and
samples were collected at different depths, along the central axis of the column, for analysis.
Samples were collected and homogenised from each 1-metre section and analysed; a
composite sample of the entire column was also created by quartering of these sub-samples.
5

To be published in Waste Management (2010) – Bodénan et al.
The batch leaching test for granular waste at a liquid/solid (L/S) ratio of 10 L/kg was
performed (CEN, 2002). During the dismantling procedure, it was observed that the material
was loose and didn’t show evidence of localized consolidation, concretions, colouring, etc.,
such as could be observed for example in bottom ash leaching experiments (Piantone et al.,
2004). It is therefore hypothesized that, due to the material’s homogeneity and grainsize, and
to even distribution of flow at the column head, preferential flow was probably not
significant.
3. Results and discussion
3.1. Global chemical composition before and after leaching
Table 1 completes data presented in Guyonnet et al. (2008) and provides a comparison with
data from Abbas et al. (2001). Major elements in the ash sand mixture are related to the
presence of Si-rich oxidized phases and to a lesser extent to the presence of Al, Ca, Fe and K.
Trace elements in the ash-sand mixture are, by order of decreasing importance, Zn, Cu, Ba,
Pb, Sn, Sr. Uncombined lime content (free and hydrated lime, respectively CaO and Ca(OH)2)
is low (< 0.5 mg/Kg). The proportion of zero-valent (metal) aluminium is 1.4-1.45 wt% (2
analyses), i.e., 23 wt% of the total aluminium. A similar characterisation of the waste after 18
months of leaching in the large column shows a decrease in the proportion of metal
aluminium to 0.54 wt % suggesting that on average, 60% of metal aluminium has been
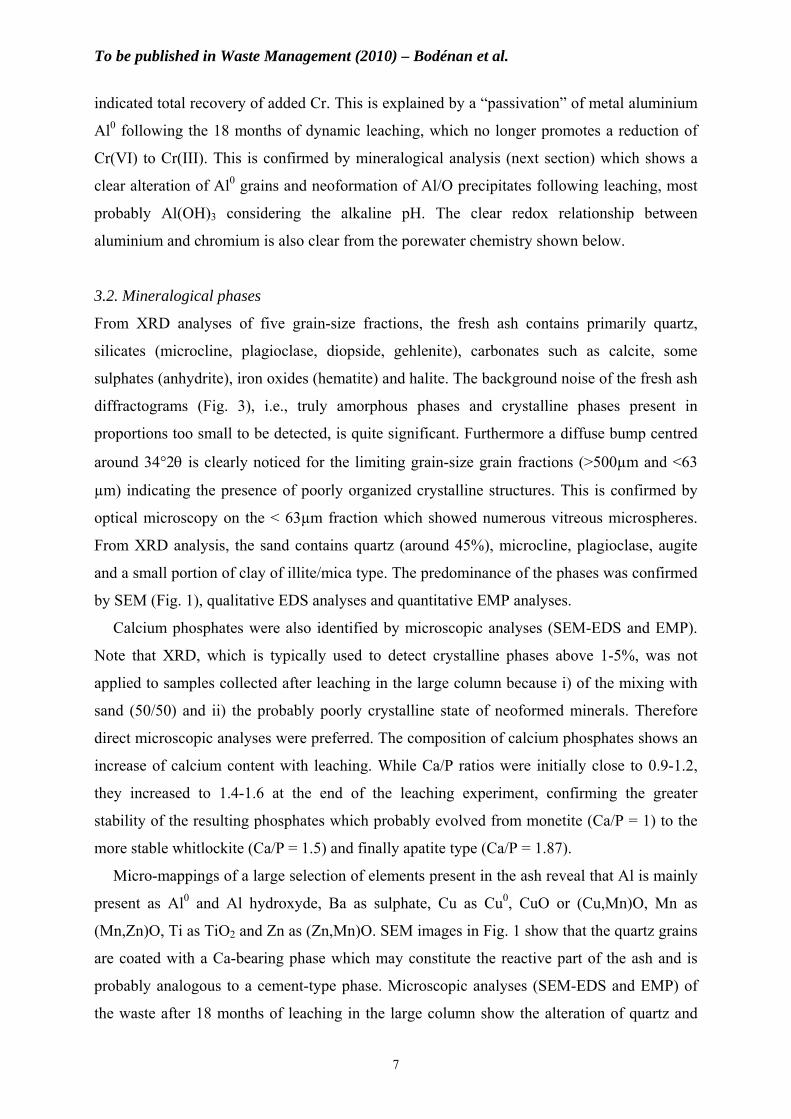
altered. The significant increase of crystallisation water (0.7 to 1.7 % after 18 months of
leaching) suggests the formation of hydrated minerals, probably of the ettringite type
Ca6Al2(SO4)3.26H2O as identified by SEM-EDS (Fig. 2b). As seen in Table 1, data from
Abbas et al. (2001) measured on a FBC hopper ash, show values very similar to those
measured in this study.
Analyses of Cr(VI) in the fresh ash (not included in Table 1) yielded values between 1.3
and 1.6 mg/Kg. But these values are most certainly underestimated since control tests with
K2CrO4 and PbCrO4 spikes showed that only 25% of the added Cr(VI) was recovered. Such
analytical difficulties are also reported by Abbas et al. (2001) and are related to an analytical
bias: the selective attack of the ash under alkaline and warm conditions, in presence of metal
aluminium which is oxidized, promotes the reduction of Cr(VI) to Cr(III). Similar analyses on
the ash-sand following 18 months of leaching yielded 3.5 mg/Kg Cr(VI). This result is
believed to be reliable because independent checks with spikes of K2CrO4 and PbCrO4
6
To be published in Waste Management (2010) – Bodénan et al.
indicated total recovery of added Cr. This is explained by a “passivation” of metal aluminium
Al0 following the 18 months of dynamic leaching, which no longer promotes a reduction of
Cr(VI) to Cr(III). This is confirmed by mineralogical analysis (next section) which shows a
clear alteration of Al0 grains and neoformation of Al/O precipitates following leaching, most
probably Al(OH)3 considering the alkaline pH. The clear redox relationship between
aluminium and chromium is also clear from the porewater chemistry shown below.
3.2. Mineralogical phases
From XRD analyses of five grain-size fractions, the fresh ash contains primarily quartz,
silicates (microcline, plagioclase, diopside, gehlenite), carbonates such as calcite, some
sulphates (anhydrite), iron oxides (hematite) and halite. The background noise of the fresh ash
diffractograms (Fig. 3), i.e., truly amorphous phases and crystalline phases present in
proportions too small to be detected, is quite significant. Furthermore a diffuse bump centred
around 34°2θ is clearly noticed for the limiting grain-size grain fractions (>500µm and <63
µm) indicating the presence of poorly organized crystalline structures. This is confirmed by
optical microscopy on the < 63µm fraction which showed numerous vitreous microspheres.
From XRD analysis, the sand contains quartz (around 45%), microcline, plagioclase, augite
and a small portion of clay of illite/mica type. The predominance of the phases was confirmed
by SEM (Fig. 1), qualitative EDS analyses and quantitative EMP analyses.
Calcium phosphates were also identified by microscopic analyses (SEM-EDS and EMP).
Note that XRD, which is typically used to detect crystalline phases above 1-5%, was not
applied to samples collected after leaching in the large column because i) of the mixing with
sand (50/50) and ii) the probably poorly crystalline state of neoformed minerals. Therefore
direct microscopic analyses were preferred. The composition of calcium phosphates shows an
increase of calcium content with leaching. While Ca/P ratios were initially close to 0.9-1.2,
they increased to 1.4-1.6 at the end of the leaching experiment, confirming the greater
stability of the resulting phosphates which probably evolved from monetite (Ca/P = 1) to the
more stable whitlockite (Ca/P = 1.5) and finally apatite type (Ca/P = 1.87).
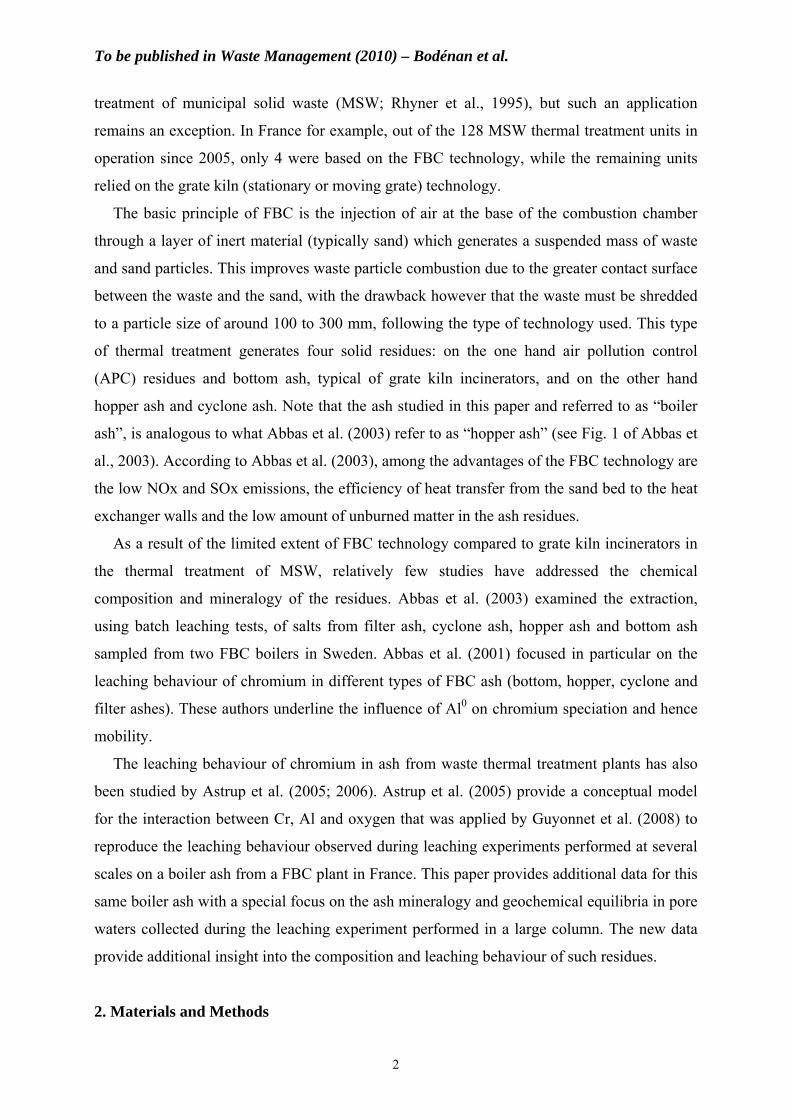
Micro-mappings of a large selection of elements present in the ash reveal that Al is mainly
present as Al0 and Al hydroxyde, Ba as sulphate, Cu as Cu0, CuO or (Cu,Mn)O, Mn as
(Mn,Zn)O, Ti as TiO2 and Zn as (Zn,Mn)O. SEM images in Fig. 1 show that the quartz grains
are coated with a Ca-bearing phase which may constitute the reactive part of the ash and is
probably analogous to a cement-type phase. Microscopic analyses (SEM-EDS and EMP) of
the waste after 18 months of leaching in the large column show the alteration of quartz and
7

To be published in Waste Management (2010) – Bodénan et al.
feldspar grains (development of micro-fissures) as well as the precipitation of aluminium
hydroxides and most probably of hydrated phases such as ettringite (Ca6Al2(SO4)3.26H2O)
(Fig. 2). The latter phase was largely suspected from SEM-EDS qualitative analyses (from Al,
Ca and S contents) and from quantitative microprobe analysis performed on small grains
which revealed a non-stoechiometric phase consistent with a mixture of phases such as
Al(OH)3, ettringite and calcium sulphates. Both ettringite and Al(OH)3 are known to generate
swelling in materials or roads during exothermic reactions. Although no significant swelling
related to such phases was detected in the large column, swelling may have occurred as
suggested by temperature variations measured in the large column during the first twenty days
of leaching. Significant swelling was observed in lysimeter cells described in Guyonnet et al.
(2008). Other cement-type phases, referred to below in the geochemical calculations, were not
clearly identified.
3.3. Results of leaching tests
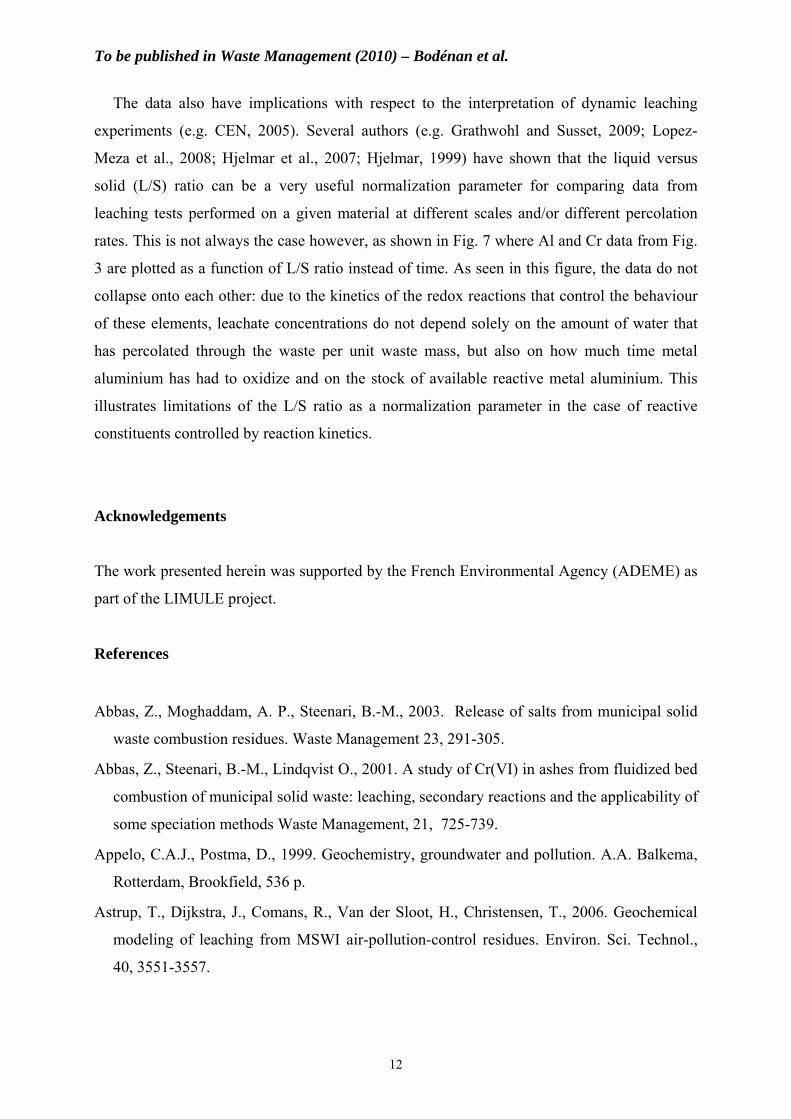
While data from the outlet of the large column were shown in Guyonnet et al. (2008), Fig. 3
shows the evolution over time of pH, Eh, Al and Cr(VI) measured in all the porous cups (PC)
of the column, as well as at the outlet. The pH (11.5-12) is typical of alkaline incineration
residues, while the redox potential (Eh) increased gradually from slightly reducing conditions
(approximately -100 to 0 mV from the outlet to the uppermost porous cup) to more oxidising
conditions at the end of the experiment (0 to 300 mV from the base to the top).
Figure 3 shows a remarkable inverse correlation between measured aluminium and
chromium concentrations: Cr(VI) starts to appear when Al decreases. This was interpreted by
Guyonnet et al. (2008), in agreement with Astrup et al. (2005), as a coupled effect between
the oxidation of Al0 on the one hand and the reduction of Cr(VI) to Cr(III) on the other hand.
It is only after approximately 130 days that Cr(VI) starts to appear in the uppermost porous
cup (PC1). Before that time, chromium is in its reduced and less mobile state Cr(III). Once the
metal aluminium has been “passivated” (Figs. 2c and 2d), aluminium concentrations decrease
and chromium is mobilized as Cr(VI).
The porewater data collected from the large column is plotted in Fig. 4 as a function of
depth at specific times. As seen in Fig. 4a, pH values remain high (> 11) throughout the
column, but there appears to be a pH gradient with a slightly upward trend as depth increases.
The redox potential measurements (Fig. 4b) suggests slightly more oxidizing conditions in the
upper portion of the column (with an outlier at PC5; 4.36 m), as a result of the inflow of
8

To be published in Waste Management (2010) – Bodénan et al.
oxygen-rich demineralised water fed at the top of the column. In Guyonnet et al. (2008) it was
shown that it was necessary to account for the transport of dissolved oxygen (see Astrup et al.,
2005) in order to reproduce the observed Al and Cr concentrations. The remarkable inverse
correlation between Al and Cr(VI) is again illustrated by Figs. 4c and 4d.
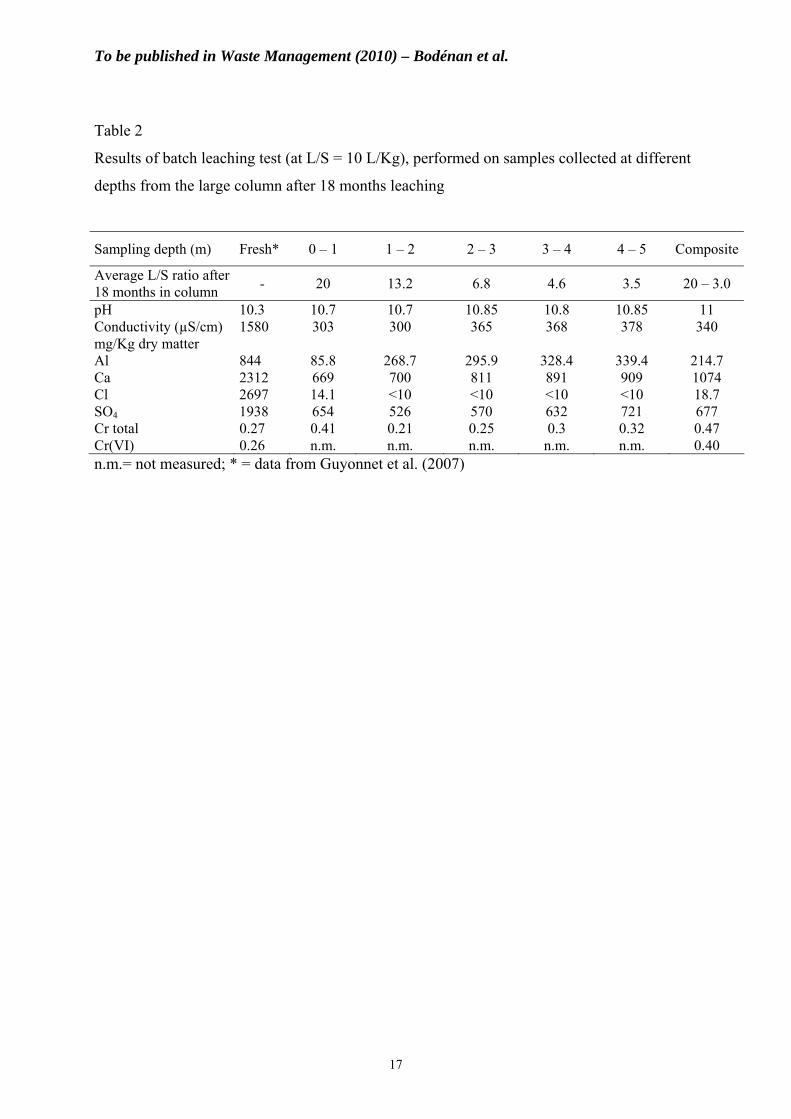
Batch leaching tests performed at L/S=10 (CEN, 2002) on samples collected at different
depths within the large column after 18 months leaching are shown in Table 2. The L/S values
shown are the average values reached by the sampled sections over the 18-month period.
Results obtained on the fresh ash-sand mixture are shown for comparison. Due to the liquid-
solid ratios achieved in the column at the end of testing (more than 20 L/Kg at the top; 3 L/Kg
at the bottom), the quantities leached from the fresh ash-sand mixture are generally much
higher than from the samples collected from the large column. This does not appear to be the
case however for Cr(VI), due on the one hand to the oxidation of Cr(III) to Cr(VI) during the
percolation experiment, in accordance with the observed trend towards more oxidizing
conditions (Fig. 3b), and on the other hand to an underestimation of the Cr(VI) concentration
in the fresh ash-sand due to the presence of Al0.
In Table 2, the pH value of 10.3 measured during batch leaching of the fresh ash-sand
mixture may seem low compared to the pH, around pH11, measured after leaching in the
large column. However, this is consistent with the trend observed at the beginning of leaching
in the large column (see Fig. 3a), where pH started quite low (around 8.7) and then increased
with time and L/S ratio. It is known that the release of sodium and potassium, present in other
minerals than salts, can occur with a delay in clinker/cement type materials (and depends
largely on grain size). For example Taylor (1990) shows that, in the case of fresh cement
pastes, this phenomenon gives higher pH values than in the case of equilibrium with
portlandite Ca(OH)2. Such a mechanism seems plausible for the high-temperature glass
matrix of the ash and can help explain higher pH values at the end of leaching than in the
fresh ash-sand mixture.
3.4. Geochemical equilibria
Thermodynamic calculations were performed in order to estimate saturation indices (SI) of
the waters with respect to selected minerals, using version 2.12 of the PHREEQC
geochemical code (Parkhurst and Appelo, 1999). Thermodynamic data are from the
associated database Llnl.dat, with additional references for cement-type phases (Table 3)
obtained from a review of thermodynamic data at different temperatures (Blanc et al., 2008).
9

To be published in Waste Management (2010) – Bodénan et al.
Speciation calculations were performed on solutions with a charge balance error lower than
5%. Ionic strengths of waters were calculated. Considering the 0.5 eq/L limit given by Appelo
et Postma (1999) for the Davies model activity used in PHREEQC outlet waters are to be
considered only above L/S 0.3. All porous cup waters were validated (<0.5 eq/L).
Results in Fig. 5, plotted versus liquid-to-solid ratio (L/S), suggest that water samples
collected at the outlet of the large column are in equilibrium with respect to
monohydrocalcite, barite, wollastonite and aluminium hydroxide; Al(OH)3 (Fig. 5a). Outlet
waters are under-saturated with respect to gypsum and, as expected at a pH around 11.5, to
portlandite. Saturation indices are also shown for some cement-type phases in Fig. 5b: values
show important fluctuations for monocarbo-aluminate, calcium-aluminates (straëtlingite,
hydrogarnet, C4AH13, Ca2Al2O5:8H2O) and ettringite, suggesting that these phases do not
reach equilibrium within the bulk of the column during the experiment. However,
precipitation of these phases could occur locally, considering heterogeneity in the large
column, as indicated by Fig. 2b where ettringite was identified by microscopy.
Calculations performed with the chemistries measured in the samples collected from the
porous cups (Fig. 6) suggest a trend towards equilibrium with respect to straëtlingite at high
values of L/S value (>15), while waters become undersaturated with respect to Micro-
crystalline Gibbsite, Al(OH)3 µC. In all cases, the samples appear to be in equilibrium with
respect to monohydrocalcite. Hyks et al. (2009a and 2009b) also observed a trend towards
equilibrium with respect to straëtlingite, in porewaters collected during column experiments
with MSWI bottom ash and MSWI fly ash/APC residues.
The data presented herein confirm the conceptual model proposed by Astrup et al. (2005).
Chromium appears at the outlet of the column once aluminium decreases in all the porous
cups of the large column, suggesting the simultaneous oxidation of metal aluminium (Al0) to
Al(III) with a reduction of Cr(VI) to Cr(III):
Al0 + CrO42- + 4 H2O Al(OH)4
- + Cr(OH)3(s) + OH- (1)
So long as there is Al0 to oxidize, chromium is in its non mobile trivalent form. However, as
shown also by Astrup et al. (2005), two competitive reactions are also involved:
Al0 + 0.75O2 + 1.5 H2O + OH- Al(OH)4- (2)
Al0 + OH- + 3 H2O Al(OH)4- + 1.5H2 (3)
10

To be published in Waste Management (2010) – Bodénan et al.
Note that Eq. (3) involves the production of hydrogen. Hydrogen gas production was
observed during batch ageing tests performed with the ash-sand mixture. Measured molar H2
gas fractions were around 10% on average. Equations (2) and (3) tend to deplete the reducing
capacity of Al0, leading to Cr mobility as Cr(VI). These mechanisms are consistent with
observations in the large column where redox conditions evolved gradually towards more
oxidizing conditions (Fig. 3b). As shown in Guyonnet et al. (2008), observed breakthroughs
of chromium and aluminium in the column can be reproduced with a coupled chemistry-
transport model (PHREEQC; Parkhurst and Appelo, 1999), taking into account Eqns. (1)
through (3) and reaction kinetics.
4. Conclusions
The data presented herein illustrate the importance of mineralogical characterisation for a
better understanding of the leaching behaviour of waste materials. Mineralogical and pore
fluid equilibria calculations provide information regarding mineral phases controlling the
solubilities of key elements such as Al and Cr, which can then be used for the quantitative
interpretation of observed leaching behaviours, with the help of coupled chemistry-transport
models (see Guyonnet et al., 2008). The mineralogical observations presented herein
document the ageing process undergone by the ash during the leaching experiment, with an
alteration of mineral phases such as metal aluminium or quartz and silicates. SEM images
document the precipitation of hydrated neo-formed mineral phases such as ettringite or
aluminium hydroxides, which can have negative implications for the reuse of the material
(e.g. in roadworks), due to swelling.
The detailed pore water chemistry monitored during 18 months of leaching clearly
illustrates the coupled behaviour of aluminium and chromium, with chromium appearing in
percolating fluids in its mobile (hexavalent) form, when metal aluminium is no longer
available for chromium reduction. Such breakthrough of chromium is an environmental and
health concern and a potential reason why this boiler ash might not be accepted by
environmental regulators as a candidate for utilisation (e.g. in roadworks). If it were not for
this element, this ash could comply with the inert waste acceptance criteria (OJC, 2003),
provided a “factor 3” is used for sulphate and chloride; OJC, 2003).
11
To be published in Waste Management (2010) – Bodénan et al.
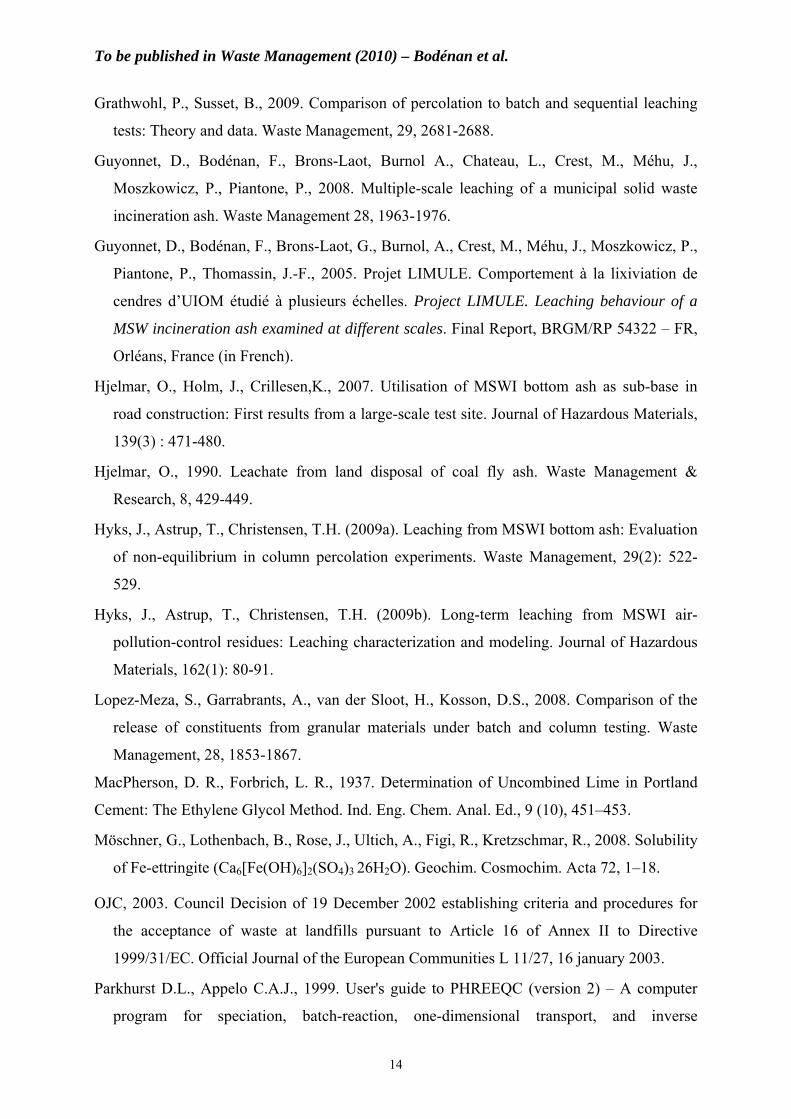
The data also have implications with respect to the interpretation of dynamic leaching
experiments (e.g. CEN, 2005). Several authors (e.g. Grathwohl and Susset, 2009; Lopez-
Meza et al., 2008; Hjelmar et al., 2007; Hjelmar, 1999) have shown that the liquid versus
solid (L/S) ratio can be a very useful normalization parameter for comparing data from
leaching tests performed on a given material at different scales and/or different percolation
rates. This is not always the case however, as shown in Fig. 7 where Al and Cr data from Fig.
3 are plotted as a function of L/S ratio instead of time. As seen in this figure, the data do not
collapse onto each other: due to the kinetics of the redox reactions that control the behaviour
of these elements, leachate concentrations do not depend solely on the amount of water that
has percolated through the waste per unit waste mass, but also on how much time metal
aluminium has had to oxidize and on the stock of available reactive metal aluminium. This
illustrates limitations of the L/S ratio as a normalization parameter in the case of reactive
constituents controlled by reaction kinetics.
Acknowledgements
The work presented herein was supported by the French Environmental Agency (ADEME) as
part of the LIMULE project.
References
Abbas, Z., Moghaddam, A. P., Steenari, B.-M., 2003. Release of salts from municipal solid
waste combustion residues. Waste Management 23, 291-305.
Abbas, Z., Steenari, B.-M., Lindqvist O., 2001. A study of Cr(VI) in ashes from fluidized bed
combustion of municipal solid waste: leaching, secondary reactions and the applicability of
some speciation methods Waste Management, 21, 725-739.
Appelo, C.A.J., Postma, D., 1999. Geochemistry, groundwater and pollution. A.A. Balkema,
Rotterdam, Brookfield, 536 p.
Astrup, T., Dijkstra, J., Comans, R., Van der Sloot, H., Christensen, T., 2006. Geochemical
modeling of leaching from MSWI air-pollution-control residues. Environ. Sci. Technol.,
40, 3551-3557.
12

To be published in Waste Management (2010) – Bodénan et al.
Astrup T., Rosenblad C., Trapp S., Christensen T.H., 2005). Chromium Release from Waste
Incineration Air-Pollution-Control Residues. Environ. Sci. Technol., 39(9), 3321 -3329.
Babushkin, V.I., Matveyev, G.M., Mchedlov-Petrossyan, O.P., 1985. Thermodynamics of
Silicates. Springer-Verlag New York, New York, 459 p.
Blanc, P., Lassin, A., Piantone, P., 2008. THERMODDEM: a thermo-geochemical database
for waste materials. In: Waste-Eng - 2nd international conference on engineering for waste
valorisation, 3-5 June 2008, Patras, Greece.
CEN (2005) - CEN/TS 14405. Characterisation of waste – Leaching behaviour tests – Up-
flow percolation test (under specified conditions). European Committee for
Standardisation. Brussels.
CEN (2002) – EN 12457-2. Characterisation of waste - Leaching - Compliance test for
leaching of granular waste materials and sludges - Part 2: One stage batch test at a liquid to
solid ratio of 10 l/kg for materials with particle size below 4 mm (without or with size
reduction). European Committee for Standardisation. Brussels.
Damidot, D., Glasser, F.P., 1995. Investigation of the CaO-Al2O3-SiO2-H2O system at 25°C
by thermodynamic calculations. Cem. Concr. Res. 25, 22-28.
Damidot, D. and Glasser, F.P., 1993. Thermodynamic investigation of the CaO-Al2O3 -
CaSO4 - H2O system at 25°C and the influence of Na2O, Cem. and Concr. Res. 23, 221-
238.
Damidot, D., Atkins, M., Kindness, A., Glasser, F.P., 1992. Sulphate attack on concrete:
limits of the AFt stability domain, Cem. Concr. Res. 22, 229-234.
Dijkstra, J., van der Sloot, H.A., Comans, R.N.J., 2006. The leaching of major and tracé
elements from MSWI bottom ash as a function of pH and time
Dijkstra, J., van der Sloot, H.A., Comans, R.N.J., 2002. Process identification and model
development of contaminant transport in MSWI bottom ash. Waste Management 22, 531-
541.
Eary, E.D., 1999. Geochemical and equilibrium trends in mine pit lakes. Applied
Geochemistry, 14, 963-987.
Gogebakan, Z., Selçuk, N., 2009. Trace elements partitioning during co-firing biomass with
lignite in a pilot-scale fluidized bed combustor. Journal of Hazardous Materials, 162, 1129-
1134.
13
To be published in Waste Management (2010) – Bodénan et al.
Grathwohl, P., Susset, B., 2009. Comparison of percolation to batch and sequential leaching
tests: Theory and data. Waste Management, 29, 2681-2688.
Guyonnet, D., Bodénan, F., Brons-Laot, Burnol A., Chateau, L., Crest, M., Méhu, J.,
Moszkowicz, P., Piantone, P., 2008. Multiple-scale leaching of a municipal solid waste
incineration ash. Waste Management 28, 1963-1976.
Guyonnet, D., Bodénan, F., Brons-Laot, G., Burnol, A., Crest, M., Méhu, J., Moszkowicz, P.,
Piantone, P., Thomassin, J.-F., 2005. Projet LIMULE. Comportement à la lixiviation de
cendres d’UIOM étudié à plusieurs échelles. Project LIMULE. Leaching behaviour of a
MSW incineration ash examined at different scales. Final Report, BRGM/RP 54322 – FR,
Orléans, France (in French).
Hjelmar, O., Holm, J., Crillesen,K., 2007. Utilisation of MSWI bottom ash as sub-base in
road construction: First results from a large-scale test site. Journal of Hazardous Materials,
139(3) : 471-480.
Hjelmar, O., 1990. Leachate from land disposal of coal fly ash. Waste Management &
Research, 8, 429-449.
Hyks, J., Astrup, T., Christensen, T.H. (2009a). Leaching from MSWI bottom ash: Evaluation
of non-equilibrium in column percolation experiments. Waste Management, 29(2): 522-
529.
Hyks, J., Astrup, T., Christensen, T.H. (2009b). Long-term leaching from MSWI air-
pollution-control residues: Leaching characterization and modeling. Journal of Hazardous
Materials, 162(1): 80-91.
Lopez-Meza, S., Garrabrants, A., van der Sloot, H., Kosson, D.S., 2008. Comparison of the
release of constituents from granular materials under batch and column testing. Waste
Management, 28, 1853-1867.
MacPherson, D. R., Forbrich, L. R., 1937. Determination of Uncombined Lime in Portland
Cement: The Ethylene Glycol Method. Ind. Eng. Chem. Anal. Ed., 9 (10), 451–453.
Möschner, G., Lothenbach, B., Rose, J., Ultich, A., Figi, R., Kretzschmar, R., 2008. Solubility
of Fe-ettringite (Ca6[Fe(OH)6]2(SO4)3 26H2O). Geochim. Cosmochim. Acta 72, 1–18.
OJC, 2003. Council Decision of 19 December 2002 establishing criteria and procedures for
the acceptance of waste at landfills pursuant to Article 16 of Annex II to Directive
1999/31/EC. Official Journal of the European Communities L 11/27, 16 january 2003.
Parkhurst D.L., Appelo C.A.J., 1999. User's guide to PHREEQC (version 2) – A computer
program for speciation, batch-reaction, one-dimensional transport, and inverse
14

To be published in Waste Management (2010) – Bodénan et al.
geochemical calculation. U.S. Geological Survey, Water-Resources Investigations. Report
99-4259, 312 pp.
Perkins R.B., Palmer, C.D., 1999. Solubility of ettringite (Ca6[Al(OH)6]2(SO4)3 26H2O) at 5–
75oC. Geochim. Cosmochim. Acta 63, 1969–1980.
Piantone, P., Bodénan, F., Chatelet-Snidaro, L., 2004. Mineralogical study of secondary
mineral phases from weathered MSWI bottom ash: implications for the modelling and
trapping of heavy metals. Applied Geochemistry, 19, 1891-1904.
Pouchou J.L., Pichoir F., 1991. Quantitative analysis of homogeneous or stratified
microvolumes applying the model “PAP”. In: Heinrich KFJ, Newbury DE (eds) Electron
probe quantitation. Plenum press, New York, 31-75.
Reardon, E.J., 1990. An Ion Interaction Model for the Determination of Chemical Equilibria
in Cement/Water Systems. Cem. Concr. Res., 20:2, 175–92.
Rhyner, C.R., Schwatz, L.J., Webger, R.B., Kohrell, M.G., 1995. Waste Management and
Resources Recovery. Lewis Publishers, New York.
Sandell, E.B., 1951. Micro Determination of Water by the Penfield Method. Microchimica
Acta, 38(4): 487-491.
Taylor, H. F. 1990. Cement Chemistry. Academic Press, London, U.K.
Toledo, J.M., Corella, J., Corella, L.M., 2005. The partitioning of heavy metals in
inceineration of sludges and waste in a bubbling fluidized bed. 2. Interpretation of results
with a conceptual model. Journal of Hazardous Materials B126, 158-168.
Valk, 1994. Atmospheric fluidized bed coal combustion: research development and
application. Coal Science & Technology, 22, Elsevier, 478 pp.
Van de Velden, M., Dewil, R., Baeyens, J., Josson, L., Lanssens, P., 2008. The distribution of
heavy metals during fluidized bed combustion of sludge (FBSC). Journal of Hazardous
Materials, 151, 96-102.
Young, R.S., 1974. Chemical Phase Analysis. Griffin, London.
15

To be published in Waste Management (2010) – Bodénan et al.
Table 1
Global chemical compositions
Wt% DM Fresh sand
Fresh ash-sand*
Fresh ash**
Leached ash-sand* Hopper ash***
Al2O3 total 9.2 11.5 13.8 10.8 13.25 CaO 0.9 7.6 14.3 8.7 7.68 Fe2O3 total 1.58 3.64 5.7 2.9 4.92 K2O 3.83 3.0 2.17 2.8 2.41 MgO 0.6 1.3 2 1.4 1.30 MnO 0.04 0.07 0.1 0.1 0.13 Na2O 1.7 1.7 1.7 nm 3.43 P2O5 0.1 1.25 2.4 1.1 1.07 SiO2 80.8 67.4 54 60.4 64.35 TiO2 0.32 0.69 1.06 0.6 0.93 Cl n.m. 0.43 - n.m. n.m. C total n.m. 0.2 - n.m. n.m. COT n.m. <0.05 - n.m. 0.08 S total n.m. 0.26 - n.m. 0.24 LOI 2.16 Al0 <0.1 1.4 2.8 0.6 n.m. H2O crystal. n.m. 0.67 - 1.7 n.m. mg/kg DM Ag < 0.2 4.3 8.6 4.3 0.8 As 24 46 68 28 29 Ba 680 955 1230 970 1300 Cd < 2 4 8 3 6.4 Co 7 61 115 59 19 Cr total 28 168 308 185 283 Cu 11 1021 2031 989 3150 Mo < 5 8 16 < 5 28 Ni 28 63 98 55 88 Pb 39 473 907 473 682 Sb <10 44 88 52 n.m. Sn <10 155 310 234 123 Sr 171 235 299 187 229 V 18 24 30 33 44 Zn 38 2053 4068 2268 2790 Zr 64 48 32 91 177
LOI = loss on ignition at 1000°C; DM = dry matter; n.m. = not measured; * = data from
Guyonnet et al. (2007); ** = calculated as difference between ash-sand and sand; *** = data
from Table 1 of Abbas et al. (2001)
16
To be published in Waste Management (2010) – Bodénan et al.
Table 2
Results of batch leaching test (at L/S = 10 L/Kg), performed on samples collected at different
depths from the large column after 18 months leaching
Sampling depth (m) Fresh* 0 – 1 1 – 2 2 – 3 3 – 4 4 – 5 Composite
Average L/S ratio after 18 months in column - 20 13.2 6.8 4.6 3.5 20 – 3.0
pH 10.3 10.7 10.7 10.85 10.8 10.85 11 Conductivity (µS/cm) 1580 303 300 365 368 378 340 mg/Kg dry matter Al 844 85.8 268.7 295.9 328.4 339.4 214.7 Ca 2312 669 700 811 891 909 1074 Cl 2697 14.1 <10 <10 <10 <10 18.7 SO4 1938 654 526 570 632 721 677 Cr total 0.27 0.41 0.21 0.25 0.3 0.32 0.47 Cr(VI) 0.26 n.m. n.m. n.m. n.m. n.m. 0.40 n.m.= not measured; * = data from Guyonnet et al. (2007)
17

To be published in Waste Management (2010) – Bodénan et al.
Table 3
Thermodynamic constants of the main mineral phases considered in the geochemical modelling
Phase General formula and cement nomenclature (in brackets)
log K Ref.*
Carbonates Aragonite CaCO3 1.99 1 Barytocalcite BaCa(CO3)2 2.74 1 Calcite CaCO3 [CC] 1.85 1 Strontianite SrCO3 -0.31 1 Monohydrocalcite CaCO3:H2O 2.68 1 Monocarbo-aluminate Ca4Al2CO9:10H2O [mCA] 80.42 2 Hemicarbo-aluminate Ca8Al4CO16:21H2O [hCA] 181.97 2 Hydrated cement phases (CSH, CAH, CASH) Straëtlengite Ca2Al2SiO7:8H2O [C2A2SH8] 49.71 3 Hydrogarnet (katoite) Ca3Al2H12O12 [C3AH6] 79.14 4 C4AH13 Ca4Al2O20H26 [C4AH13, AFm] 102.02 5 Ca2Al2O5:8H2O 59.57 1 Sulphates Anhydrite CaSO4 -4.30 1 Barite BaSO4 -9.97 1 Bassanite CaSO4:0.5H2O -3.66 1 Ettringite Ca6Al2(SO4)3(OH)12:26H2O [AFt] 57.08 6 Gypsum CaSO4:2H2O -4.48 1 Other phases Al(OH)3 µC Al(OH)3 9.35 7 Gibbsite Al(OH)3 [AH3] 7.76 1 Portlandite Ca(OH)2 [CH] 22.81 8 Quartz SiO2 -4.00 1 Tridymite SiO2 -3.83 1 Pseudowollastonite CaSiO3 [CS] 14.00 1 Wollastonite CaSiO3 [CS] 13.76 1 Larnite Ca2SiO4 [C2S] 38.47 1 Tenorite CuO 7.66 1 Zincite ZnO 11.21 1 Zn(OH)2-beta Zn(OH)2 11.93 1
Ref 1: Llnl.dat ; 2: Damidot et al. (1994); 3: Damidot and Glasser, (1993, 1995); 4: Damidot et al. (1992);
5: Babushkin et al. (1985); 6: Perkins and Palmer, (1999); Möschner et al. (2008); 7: Eary, (1999); 8: Reardon,
(1990)
18

To be published in Waste Management (2010) – Bodénan et al.
a b
c d
Fig.1. SEM images of fresh ash; (a) global ; (b) quartz with Ca-bearing coating ; (d) Feldspar ;
(d) Al0.
19

To be published in Waste Management (2010) – Bodénan et al.
a b
c d
Fig.2. SEM images of ash-sand mixture after 18 months of dynamic leaching; (a) quartz and
altered feldspar grains; (b) precipitation of Al(OH)3 and ettringite (c) residual Al0 grain and
(d) focus on precipitation of Al(OH)3.
20

To be published in Waste Management (2010) – Bodénan et al.
0 100 200 300 400 500 600Time (days)
8
9
10
11
12
13
pH
0 100 200 300 400 500 600Time (days)
0
50
100
150
200
Al (
mg/
l)
-200
-100
0
100
200
300
400
Eh (m
V)
0 100 200 300 400 500 600Time (days)
0 100 200 300 400 500 600Time (days)
0
50
100
150
Cr(
VI)
( g
/l)
a) c)
μb) d)
PC1PC2PC3PC4PC5outlet
Fig.3. Evolution of (a) pH, (b) Eh, (c) Al and (d) Cr(VI) in the porewater at different depths in
the column, as a function of time. PC1: 0.8 m; PC2: 1.82 m; PC3: 2.54 m; PC4: 3.55 m, PC5:
4.36 m; outlet: 5 m from column inlet.
21

To be published in Waste Management (2010) – Bodénan et al.
0 1 2 3 4 5 6Depth (m)
10.5
11.0
11.5
12.0pH
0 1 2 3 4 5 6Depth (m)
0
50
100
150
200
Al (
mg/
l)
-200
-100
0
100
200
300
400
Eh (m
V)
0 1 2 3 4 5 6Depth (m)
0 1 2 3 4 5 6Depth (m)
0
50
100
150
Cr(
VI)
( g
/l)
a) c)
μ
b) d)
91183257
384439
342516581
Days since start of test
Trend
Trend
Fig.4. Evolution of (a) pH, (b) Eh, (c) Al and (d) Cr(VI) in the porewater at different times as
a function of depth in the column.
22

To be published in Waste Management (2010) – Bodénan et al.
0 1 2 3L/S (L/Kg)
-3
-2
-1
0
1
2
3
Satu
ratio
n In
dex
0 1 2 3L/S (L/Kg)
-3
-2
-1
0
1
2
3
Satu
ratio
n In
dex
CalciteMonohydrocalciteBarite
WollastoniteGypsumPortlandite
a)
b)
StraetlingiteEttringiteMonocarbo-Al
HydrogarnetCa2Al205:8H2OC4AH13
Al(OH)3
Fig.5. Evolution of saturation indices of 6 mineral phases, as a function of L/S ratio,
calculated in samples at the outlet of the large column.
23

To be published in Waste Management (2010) – Bodénan et al.
0 1 10 100L/S (L/Kg)
-3
-2
-1
0
1
2
3Sa
tura
tion
Inde
x
0 1 10 100L/S (L/Kg)
-3
-2
-1
0
1
2
3
Satu
ratio
n In
dex
-3
-2
-1
0
1
2
3
Satu
ratio
n In
dex
0 1 10 100L/S (L/Kg)
Monohydrocalcite Al(OH)3 C
Straetlingite
PC1PC2PC3PC4PC5outlet
μa) b)
c)
Fig.6. Evolution of saturation indices for three mineral phases (see Table 3); (a)
Monohydrocalcite, (b) Micro-crystalline Gibbsite, (c) Straetlingite, as a function of L/S ratios,
calculated in samples from the porous cups (PC) and at the outlet of the large column
24

To be published in Waste Management (2010) – Bodénan et al.
0 5 10 15LS ratio (L/kg)
0
50
100
150
200A
l (m
g/l)
0 5 10LS ratio (L/kg)
15
0
50
100
150
Cr(
VI)
( g
/l)
a)
μ
b)PC1PC2PC3PC4PC5Outlet
Fig.7. Evolution of (a) Al and (b) Cr(VI) in the porewater at different depths in the column, as
a function of L/S ratio.
25