mineralogy and magnetic properties of basaltic …rvd/pub/sssaj_2008.pdf · tropical soils, pyrite,...
TRANSCRIPT
244 SSSAJ: Volume 72: Number 1 • January–February 2008
Soil Sci. Soc. Am. J. 72:244-257doi:10.2136/sssaj2006.0281Received 14 Aug. 2006. *Corresponding authhor ([email protected]).© Soil Science Society of America677 S. Segoe Rd. Madison WI 53711 USAAll rights reserved. No part of this periodical may be reproduced or transmitted in any form or by any means, electronic or mechanical, including photocopying, recording, or any information storage and retrieval system, without permission in writing from the publisher. Permission for printing and for reprinting the material contained herein has been obtained by the publisher.
Many techniques have been developed for processing electro-magnetic and magnetic data to discriminate unexploded
ordnance (UXO) from non-UXO, but their performance is nega-tively affected at sites with magnetic soils and rocks. In an envi-ronment with highly magnetic soil, magnetic and electromagnetic sensors often detect large anomalies that are of geologic, rather than metallic, origin (Butler, 2003). Therefore, it is crucial to understand the variability of the magnetic characteristics in a sur-vey area. Improved detection and discrimination performance will
only be realized when the interactions of magnetic soil material with geophysical sensors are understood and effi cient data reduc-tion techniques have been developed.
The magnetic properties of soils result from the presence of Fe oxides in different forms and quantities (Mullins, 1977). Paramagnetic and antiferromagnetic Fe oxides such as goethite and hematite are the most abundant Fe oxide minerals in soils but play a minor role in determining the magnetic character of a soil. Ferrimagnetic minerals such as magnetite, maghemite, and pyrrothite are the most magnetic of the Fe oxides, and are of primary importance in their effects on geophysical sensors. Iron oxide minerals can be both pedogenic (i.e., a product of soil formation) and lithogenic (i.e., unweathered minerals from the parent material) in origin. Two types of magnetic behavior asso-ciated with magnetic soil minerals can have a signifi cant impact on the magnetic and electromagnetic characteristics of the sub-surface. Both magnetic susceptibility and viscous remanent mag-netization (VRM) can have a negative effect on the performance of geophysical sensors (Billings et al., 2003).
Currently, the knowledge of the spatial distribution and temporal evolution of soil magnetic properties in tropical and
Remke L. Van Dam*Dep. of Geological SciencesMichigan State Univ.206 Natural ScienceEast Lansing, MI 48824
J. Bruce J. HarrisonDep. of Earth and Environmental ScienceNew Mexico Tech801 Leroy PlaceSocorro, NM 87801
Deidre A. HirschfeldDep. of Materials EngineeringNew Mexico Tech801 Leroy PlaceSocorro, NM 87801
Todd M. MeglichYaoguo LiDep. of GeophysicsColorado School of Mines1500 Illinois St.Golden, CO 80401
Ryan E. NorthU.S. Army Corps of EngineersEngineer Research and Development Center3909 Halls Ferry Rd.Vicksburg, MS 39180
Abbreviations: DTA, differential thermal analysis; Fed, dithionite-extractable Fe; Feo, oxalate-extractable Fe; TEM, time-domain electromagnetic; TGA, thermogravimetric analysis; UXO, unexploded ordnance; VRM, viscous remanent magnetization; XRD, x-ray diffraction spectroscopy; XRF, x-ray fl uorescence spectroscopy; , volume-specifi c magnetic susceptibility; , mass-specifi c magnetic susceptibility; fd%,frequency-dependent magnetic susceptibility; lf, low-frequency mass-specifi c magnetic susceptibility;
T, temperature-dependent magnetic susceptibility.
Magnetic behavior of soils can seriously hamper the performance of geophysical sensors. Currently, we have little understanding of the types of minerals responsible for the magnetic behavior, as well as their distribution in space and evolution through time. This study inves-tigated the magnetic characteristics and mineralogy of Fe-rich soils developed on basaltic substrate in Hawaii. We measured the spatial distribution of magnetic susceptibility ( lf )and frequency dependence ( fd%) across three test areas in a well-developed eroded soil on Kaho’olawe and in two young soils on the Big Island of Hawaii. X-ray diffraction spectros-copy, x-ray fl uorescence spectroscopy (XRF), chemical dissolution, thermal analysis, and temperature-dependent magnetic studies were used to characterize soil development and mineralogy for samples from soil pits on Kaho’olawe, surface samples from all three test areas, and unweathered basalt from the Big Island of Hawaii. The measurements show a general increase in magnetic properties with increasing soil development. The XRF Fe data ranged from 13% for fresh basalt and young soils on the Big Island to 58% for material from the B horizon of Kaho’olawe soils. Dithionite-extractable and oxalate-extractable Fe percentages increase with soil development and correlate with lf and fd%, respectively. Results from the temperature-dependent susceptibility measurements show that the high soil magnetic prop-erties observed in geophysical surveys in Kaho’olawe are entirely due to neoformed minerals. The results of our studies have implications for the existing soil survey of Kaho’olawe and help identify methods to characterize magnetic minerals in tropical soils.
Mineralogy and Magnetic Properties of Basaltic Substrate Soils: Kaho’olawe and Big Island, Hawaii
SOIL
MIN
ERA
LOG
Y
SSSAJ: Volume 72: Number 1 • January–February 2008 245
other soils is limited (Das et al., 2002; Van Dam et al., 2005b). In Hawaii, soils are commonly highly magnetic, the cause of which is Fe-bearing minerals in the parent material. In Hawaii, the basaltic rocks contain signifi cant amounts of magnetite and other Fe-containing minerals (Wright and Clague, 1989). In soils developed on the relatively uniform parent material of Hawaii, it has been shown, however, that the magnetic suscep-tibility varies signifi cantly across relatively short distances and depends strongly on the degree of soil development (Van Dam et al., 2004). We conducted a fi eld and laboratory investigation for soils on Kaho’olawe and the Big Island of Hawaii. The objec-tive of the study was to understand the magnetic mineralogy of soils by characterizing the origin, frequency dependence, and variability of the magnetic signature.
SOIL MAGNETICSThe presence of Fe oxides in different forms and quantities is the
predominant cause of the magnetic properties of soils. Iron oxide miner-als can be both pedogenic (i.e., a product of soil formation) and lithogenic (i.e., unweathered minerals from the parent material) in origin. Although pure Fe can occur naturally in rocks and soil, it is very rare. Specifi c types of Fe oxides, Fe–Ti oxides, and Fe sulfi des are the predominant causes of magnetic soil characteristics. Iron is the fourth most common element in the crust of the earth. Iron-containing minerals can be found in igneous rock such as basalt, gabbro, and granite, but also in metamorphic and sedimentary rocks. The concentration of (magnetic) Fe oxides in soils is affected by the parent material, soil age, soil-forming processes, biologi-cal activity, and soil temperature (Singer et al., 1996; Fabris et al., 1998). Magnetite and ilmenite are among the most stable lithogenic Fe oxides. Overall, the Fe oxide content in tropical soils may be as high as several hundred grams per kilogram (Goulart et al., 1998).
Many books and review papers have addressed the physical back-ground of magnetic minerals in general (Lindsley, 1991; Thompson and Oldfi eld, 1986) and the magnetic mineralogy of soils in particular (Cornell and Schwertmann, 2003; Mullins, 1977; Stucki et al., 1988). Three types of magnetization are commonly used to describe the mag-netic behavior of a material:
1. Remanent magnetization occurs within ferromagnetic and ferri-magnetic minerals and exists in the absence of an applied fi eld.
2. Magnetic susceptibility—when a low-intensity magnetic fi eld is applied to a material, the net magnetic moment (mag-netization, M) is proportional to the applied fi eld strength (H). Therefore, the low-fi eld magnetic susceptibility, which is defi ned as M/H and expressed per unit volume ( ) or per unit mass ( ), is a material-specifi c property. The magnetic susceptibility affects the performance of both electromag-netic and magnetic sensors (Billings et al., 2003).
3. Viscous remanent magnetization refers to the delay of the sec-ondary magnetic fi eld relative to the primary magnetic fi eld and has been linked to the presence of superparamagnetic (SP) grains (Dearing, 1994). It causes frequency depen-dence in magnetic susceptibility, which has important implications for time- and frequency-domain electromag-netic sensors (Billings et al., 2003).
The formation of SP grains is generally considered to be associated with processes occurring under normal pedogenic oxidation–reduction cycles (Mullins, 1977; Thompson and Oldfi eld, 1986), but the exact processes leading to recrystallization of these SP grains are poorly understood.
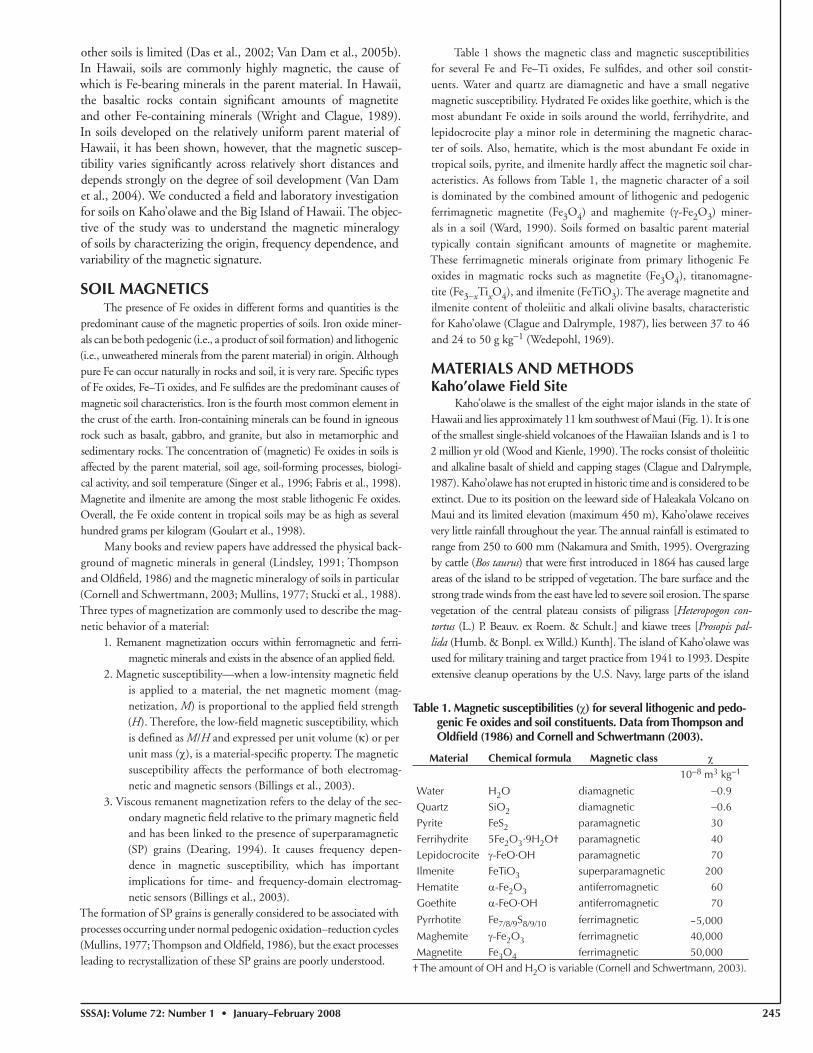
Table 1 shows the magnetic class and magnetic susceptibilities for several Fe and Fe–Ti oxides, Fe sulfi des, and other soil constit-uents. Water and quartz are diamagnetic and have a small negative magnetic susceptibility. Hydrated Fe oxides like goethite, which is the most abundant Fe oxide in soils around the world, ferrihydrite, and lepidocrocite play a minor role in determining the magnetic charac-ter of soils. Also, hematite, which is the most abundant Fe oxide in tropical soils, pyrite, and ilmenite hardly affect the magnetic soil char-acteristics. As follows from Table 1, the magnetic character of a soil is dominated by the combined amount of lithogenic and pedogenic ferrimagnetic magnetite (Fe3O4) and maghemite ( -Fe2O3) miner-als in a soil (Ward, 1990). Soils formed on basaltic parent material typically contain signifi cant amounts of magnetite or maghemite. These ferrimagnetic minerals originate from primary lithogenic Fe oxides in magmatic rocks such as magnetite (Fe3O4), titanomagne-tite (Fe3 xTixO4), and ilmenite (FeTiO3). The average magnetite and ilmenite content of tholeiitic and alkali olivine basalts, characteristic for Kaho’olawe (Clague and Dalrymple, 1987), lies between 37 to 46 and 24 to 50 g kg 1 (Wedepohl, 1969).
MATERIALS AND METHODSKaho’olawe Field Site
Kaho’olawe is the smallest of the eight major islands in the state of Hawaii and lies approximately 11 km southwest of Maui (Fig. 1). It is one of the smallest single-shield volcanoes of the Hawaiian Islands and is 1 to 2 million yr old (Wood and Kienle, 1990). The rocks consist of tholeiitic and alkaline basalt of shield and capping stages (Clague and Dalrymple, 1987). Kaho’olawe has not erupted in historic time and is considered to be extinct. Due to its position on the leeward side of Haleakala Volcano on Maui and its limited elevation (maximum 450 m), Kaho’olawe receives very little rainfall throughout the year. The annual rainfall is estimated to range from 250 to 600 mm (Nakamura and Smith, 1995). Overgrazing by cattle (Bos taurus) that were fi rst introduced in 1864 has caused large areas of the island to be stripped of vegetation. The bare surface and the strong trade winds from the east have led to severe soil erosion. The sparse vegetation of the central plateau consists of piligrass [Heteropogon con-tortus (L.) P. Beauv. ex Roem. & Schult.] and kiawe trees [Prosopis pal-lida (Humb. & Bonpl. ex Willd.) Kunth]. The island of Kaho’olawe was used for military training and target practice from 1941 to 1993. Despite extensive cleanup operations by the U.S. Navy, large parts of the island
Table 1. Magnetic susceptibilities ( ) for several lithogenic and pedo-genic Fe oxides and soil constituents. Data from Thompson and Oldfi eld (1986) and Cornell and Schwertmann (2003).
Material Chemical formula Magnetic class
10 8 m3 kg 1
Water H2O diamagnetic 0.9
Quartz SiO2 diamagnetic 0.6
Pyrite FeS2 paramagnetic 30
Ferrihydrite 5Fe2O3·9H2O† paramagnetic 40
Lepidocrocite -FeO·OH paramagnetic 70
Ilmenite FeTiO3 superparamagnetic 200
Hematite -Fe2O3 antiferromagnetic 60
Goethite -FeO·OH antiferromagnetic 70
Pyrrhotite Fe7/8/9S8/9/10 ferrimagnetic ~5,000Maghemite -Fe2O3 ferrimagnetic 40,000
Magnetite Fe3O4 ferrimagnetic 50,000
† The amount of OH and H2O is variable (Cornell and Schwertmann, 2003).

246 SSSAJ: Volume 72: Number 1 • January–February 2008
are still not cleared. The magnetic properties of the Kaho’olawe geology and soils have been responsible for a large number of false positives in previous UXO detection surveys.
The Navy QA Grid that was selected for the geophysical measure-ments lies in the Kunaka/Na’alapa province and is dominated by soils of the Kaneloa and Puu Moiwi series (Nakamura and Smith, 1995). The parent material of these soils is strongly weathered volcanic ash over strongly weathered basic igneous rock. The Kaneloa soils reach saprolite (weathered bedrock) within 40 to 75 cm from the surface, while the Puu Moiwi soils have a deeper soil cover. The soil colors range from reddish brown to brown for the Puu Moiwi soils and from brown to yel-lowish brown for the Kaneloa soils. For both soils the texture is mostly silty clay loam and both contain detectable amounts of hematite and magnetite at all depths (Nakamura and Smith, 1995).
Big Island Field SitesHawaii is the youngest and largest of the islands in the Hawaiian
archipelago and consists of fi ve subaerial and one submerged volca-noes. The ages of the volcanoes range from 0.43 million yr for Kohala Volcano in the north to active in the south. Potassium–argon dates of shield-stage tholeiitic basalts indicate an age of 0.375 million yr for Mauna Kea (Clague and Dalrymple, 1989). This age should be treated with caution, as the individual lava fl ows at the surface show a wide range of ages (Wolfe and Morris, 1996).
Both the Waimea Geophysical Prove-out near the town of Waimea and the Geophysical Prove-out at Waikoloa Village are part of the former
Waikoloa Maneuver Area and lie on the northwestern fl anks of Mauna Kea Volcano in lava fl ows of the Hamakua Volcanics (Fig. 1a). Lava fl ows originated from vents widely distributed across the fl anks of Mauna Kea and have both alkaline and tholeiitic characteristics (Wolfe and Morris, 1996). The rocks contain variable amounts of olivine, plagioclase, and clinopyroxene phenocrysts. Rocks of the Hamakua Volcanics have been K–Ar dated between 250,000 and 65,000 yr (Pleistocene).
The parent material of the soils at both sites is young (relatively unweathered) basalt, covered by local tephra falls and windblown material of variable thickness. Mean annual rainfall ranges from to 150 to 500 mm near Waikoloa Village to 1500 mm near Waimea. As a result, the soils at the Waimea Geophysical Prove-out are better developed than those at the Geophysical Prove-out at Waikoloa Village, where soils are mostly stony and are characterized by surface rock outcropping. The Waimea soils are characterized by a shallow, organic-rich soil over shallow bedrock. Rocks are common at the surface.
Field Sampling and MeasurementsFour soil pits located in areas that represent the variation in mag-
netic properties of the site were excavated in and around Test Grid 2E on Kaho’olawe (Fig. 1b). The locations were selected based on previously collected time-domain electromagnetic (TEM) data, TEM data collected in this fi eld campaign (Walker et al., 2005), and geomorphological char-acteristics of the terrain. Soil Pit KH-A was located in the area with the lowest magnetic background, just outside Grid 2E, while Soil Pits KH-B and KH-C were dug in areas with intermediate to high magnetic back-
Fig. 1. Location and setting of the fi eld areas: (a) the eight main Hawaiian islands and detailed satellite images (Landsat) of Kaho’olawe and the northern part of the Big Island of Hawaii with the approximate locations of the fi eld sites given by the circles; (b) outline of the Navy QA Grid on Kaho’olawe and locations of the four soil pits (the gray squares in the inset show the locations of the fi ve surface samples studied in detail); and (c) aerial photograph of the fi eld site with the locations of Test Grid 2E and the soil pits.
SSSAJ: Volume 72: Number 1 • January–February 2008 247
ground readings. Soil Pit KH-D was dug at a distance of approximately 75 m south of Grid 2E in a topographic low. All soil profi les were described using standard methods and samples were collected for laboratory analyses of soil texture, mineralogy, and frequency-dependent magnetic properties. A total number of 50 soil and two saprolite samples were collected from the soil pits. The magnetic susceptibility was measured at vertical increments of 5 cm using both Bartington MS2D (0.958 kHz) and MS2F (0.580 kHz) sensors (Bartington Instruments, Witney, UK).
The 30- by 30-m Grid 2E that is located within the Navy QA area was subdivided into regular 5- by 5-m cells. A random number genera-tor was used to select one sampling location in each cell. This stratifi ed random sampling strategy ensured a good coverage of the entire plot (Webster and Oliver, 1990). At each of the 36 locations, the surface magnetic susceptibility was measured using a Bartington system with an MS2D sensor at a frequency of 0.958 kHz. Also, a frequency-domain Geonics EM-38 system (Geonics Ltd., Mississauga, ON, Canada) was used to calculate the magnetic susceptibility of the soil from the in-phase component of a 14.6-kHz signal measured at 1.5 m above the ground and at the ground surface. Finally, at each of the 36 locations, surface samples were collected for laboratory analysis of soil mineralogy and frequency-dependent magnetic properties. We will focus on fi ve surface samples, indicated by the gray polygons in Fig. 1b.
The former Waikoloa Maneuver Area fi eld sites are designed as geo-physical test locations. Both sites consisted of three 30- by 30-m grids. Due to security restrictions, our samples were collected from unseeded grids. We had no permission to dig soil pits and were restricted to surface sampling of both the Waikoloa and Waimea sites. The format of the sur-face soil sampling was similar to that on Kaho’olawe. At both sites, a 5- by 5-m grid was laid out inside the unseeded grid. From each 5- by 5-m grid, one random sample was taken. Thirty-six samples were collected from both sites. In addition, two samples of unweathered basalt were collected from a road cut from Kohala Volcano on the Big Island of Hawaii.
Laboratory MeasurementsTo understand the origin and mineralogy of the soils, and to char-
acterize the frequency- and temperature-dependent magnetic prop-erties, a range of laboratory measurements was performed. Samples were dried for a minimum of 48 h at a low temperature (<50°C) so as not to cause any chemical reactions. The soil and rock material was crushed (manually) to silt- and sand-size grain sizes where necessary.
Magnetic SusceptibilityTo measure magnetic susceptibility, 10-cm3 pots were fi lled for
measurement of the magnetic susceptibilities and their weight was measured on an A&D GR-120 balance with 0.1-mg accuracy. Next, the volume-specifi c magnetic susceptibility ( ) was measured at two frequencies (0.46 and 4.6 kHz) using a Bartington MS2B dual-fre-quency sensor. All measurements were conducted at the 1.0 sensitivity setting. Each sample was measured three times, with an air reading before and after each series for correction of drift. The mass-specifi c susceptibility ( ) was calculated from the volume-specifi c susceptibil-ity using = 10 /m, where m is the sample mass in grams (Dearing, 1994). The (percentage) difference between readings at the two fre-quencies can be used to estimate the VRM of the samples. The fre-quency-dependent susceptibility was calculated using fd% = [( lf
hf)/ lf ]100, where lf is the mass-specifi c susceptibility measured at a frequency of 0.46 kHz and hf is the mass-specifi c susceptibility measured at 4.6 kHz (Dearing, 1994).
Chemical Dissolution TechniquesThe content and composition of pedogenic Fe oxides was deter-
mined by selective chemical dissolution techniques. The total amount of secondary Fe oxyhydroxides (dithionite extractable, Fed) was deter-mined using the concentrated citrate–dithionite method (Holmgren, 1967). Poorly crystalline and amorphous Fe oxyhydroxides (oxalate extractable, Feo) such as ferrihydrite were extracted using the hydrox-ylamine procedure (Chao and Zhou, 1983). The Fe content was mea-sured using an Instrumentation Laboratory (Wilmington, MA) video 12 fl ame atomic absorption spectrometer. An increase in Fed and Feo are both indicative of weathering of mafi c minerals from ferrous (Fe2+) to ferric (Fe3+). Amorphous Fe oxides (Feo) are considered unstable under most conditions and are expected to be present only during initial soil formation, or when the presence of silicate and organics impede forma-tion of crystalline Fe oxides (Cornell and Schwertmann, 2003).
X-Ray TechniquesX-ray techniques were used to perform chemical, mineralogical,
and crystallographic analyses of fi ne-powdered soil material. X-ray dif-fraction specroscopy (XRD) allows the identifi cation of polymorphic Fe oxides (for example -Fe2O3, hematite, and -Fe2O3, maghemite). Because of overlapping peaks in the resulting spectrum, however, it is very diffi cult to make the distinction between lithogenic magnetite (Fe3O4) and pedogenic maghemite. Also, XRD cannot be used to iden-tify poorly crystalline minerals such as ferrihydrite (Fe5HO8·4H2O). We used a Rigaku D/MAX II x-ray diffractometer (Rigaku Americas, The Woodlands, TX) with a Cu anode to scan across a 2 range of 2 to 70° with a step width of 0.03° and a count time of 0.5 s per step. The Cu K 2 peak was removed using JADE software before peak search with the International Center for Diffraction Data (ICDD, Newtown Square, PA) database and its minerals subset.
X-ray fl uorescence spectroscopy (XRF) was used to quantitatively analyze the chemical composition of selected samples. To ensure homo-geneity, mixtures of 1 g of fi nely ground soil material, 9 g of lithium tet-raborate (fl ux), and 0.25 g of NH4NO3 (oxidizer), were fused at 1000°C in a Pt crucible in an oxidizing fl ame for at least 30 min, and then poured into Pt molds to produce glass disks. These disks were used for all analy-ses using a Bruker AXS (Madison, WI) S-4 Pioneer, a 4-kW, wavelength dispersive instrument. The XRF element analyses were determined by reducing the x-ray intensities using SPECTRAplus software (from Bruker AXS), which uses alpha factors to determine the fundamental parameters. Twelve well-known standards were used for calibration. Accuracy was checked by analyzing two known standards.
Thermal AnalysisThermal analysis refers to the study of the behavior of materials as
a function of temperature change and gives information on sample com-position, thermal characteristics of the sample, and the products formed during heating (Speyer, 1994). While thermogravimetric analysis (TGA) shows the change in weight with time or temperature, differential thermal analysis (DTA) shows whether specifi c events are endothermic or exother-mic. Several factors such as the heating rate, amount of sample, and par-ticle size play a role in the shape of the curves and the magnitude of events (Speyer, 1994). We used a Linseis Thermal Balance L81/1550 (Linseis Inc., Princeton Junction, NJ), which is sensitive to the nearest microgram, for approximately 250-mg starting weights. The instrument has a temperature range of 20 to 1550°C and a variable heating rate of 0.01 to 50°C min 1.
Changes in magnetic susceptibility as a result of chemical trans-formations that occur due to temperature variations can be measured
248 SSSAJ: Volume 72: Number 1 • January–February 2008
with a furnace and susceptibility meter combination. The effect of temperature on magnetic susceptibility ( T) was measured with a CS-2 furnace and a Kappabridge KLY-2 AC susceptibility bridge (Advanced Geoscience Instruments Co., Brno, Czech Republic) using a 300 A m 1 induced magnetic fi eld at a single frequency of 920 Hz in an Ar (reducing) atmosphere. A small glass test tube is used to hold approximately 0.5 cm3 of sample material during the sus-ceptibility measurements. The mass is measured to normalize the recorded susceptibility values to the sample density. The test tube is then placed into a water-cooled jacket integrated in the Kappabridge.
A thermocouple device attached to the furnace rests directly on the sample. Susceptibility measurements began at room temperature and were taken approximately every 18 s while the temperature increased at about 10 C min 1. Volume-specifi c instrument readings were nor-malized to mass-specifi c susceptibility.
RESULTSSoil Descriptions
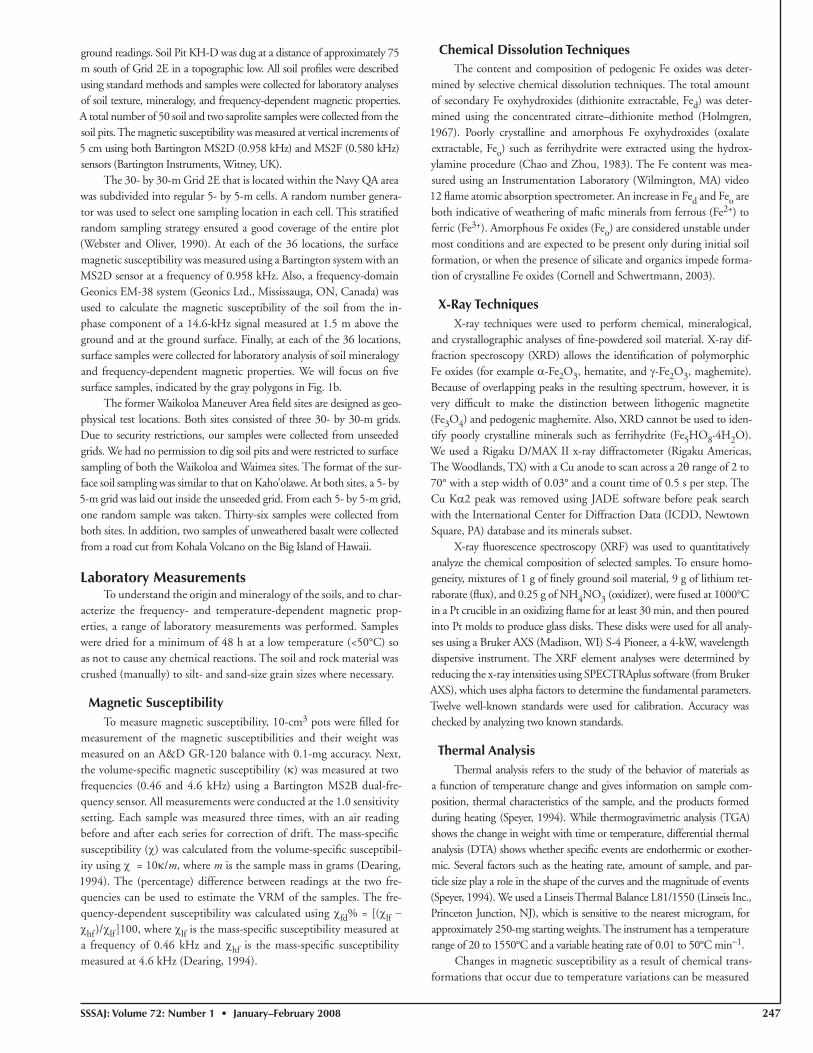
Soil Pit A (KH-A) is located in an area of low magnetic back-ground (Walker et al., 2005) and magnetic susceptibility readings.
Fig. 2. Pictures and description of (a) Soil KH-A and (b) Soil KH-B on Kaho’olawe, Hawaii; see Fig. 1 for location.
SSSAJ: Volume 72: Number 1 • January–February 2008 249
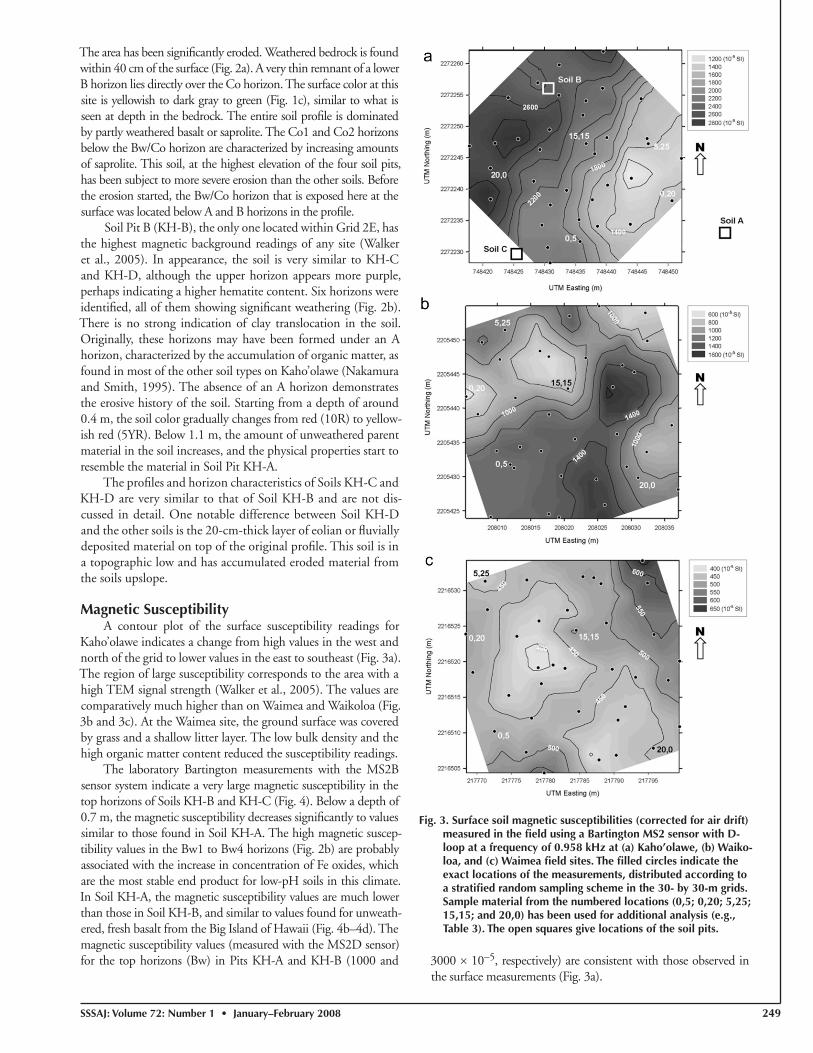
The area has been signifi cantly eroded. Weathered bedrock is found within 40 cm of the surface (Fig. 2a). A very thin remnant of a lower B horizon lies directly over the Co horizon. The surface color at this site is yellowish to dark gray to green (Fig. 1c), similar to what is seen at depth in the bedrock. The entire soil profi le is dominated by partly weathered basalt or saprolite. The Co1 and Co2 horizons below the Bw/Co horizon are characterized by increasing amounts of saprolite. This soil, at the highest elevation of the four soil pits, has been subject to more severe erosion than the other soils. Before the erosion started, the Bw/Co horizon that is exposed here at the surface was located below A and B horizons in the profi le.
Soil Pit B (KH-B), the only one located within Grid 2E, has the highest magnetic background readings of any site (Walker et al., 2005). In appearance, the soil is very similar to KH-C and KH-D, although the upper horizon appears more purple, perhaps indicating a higher hematite content. Six horizons were identifi ed, all of them showing signifi cant weathering (Fig. 2b). There is no strong indication of clay translocation in the soil. Originally, these horizons may have been formed under an A horizon, characterized by the accumulation of organic matter, as found in most of the other soil types on Kaho’olawe (Nakamura and Smith, 1995). The absence of an A horizon demonstrates the erosive history of the soil. Starting from a depth of around 0.4 m, the soil color gradually changes from red (10R) to yellow-ish red (5YR). Below 1.1 m, the amount of unweathered parent material in the soil increases, and the physical properties start to resemble the material in Soil Pit KH-A.
The profi les and horizon characteristics of Soils KH-C and KH-D are very similar to that of Soil KH-B and are not dis-cussed in detail. One notable difference between Soil KH-D and the other soils is the 20-cm-thick layer of eolian or fl uvially deposited material on top of the original profi le. This soil is in a topographic low and has accumulated eroded material from the soils upslope.
Magnetic SusceptibilityA contour plot of the surface susceptibility readings for
Kaho’olawe indicates a change from high values in the west and north of the grid to lower values in the east to southeast (Fig. 3a). The region of large susceptibility corresponds to the area with a high TEM signal strength (Walker et al., 2005). The values are comparatively much higher than on Waimea and Waikoloa (Fig. 3b and 3c). At the Waimea site, the ground surface was covered by grass and a shallow litter layer. The low bulk density and the high organic matter content reduced the susceptibility readings.
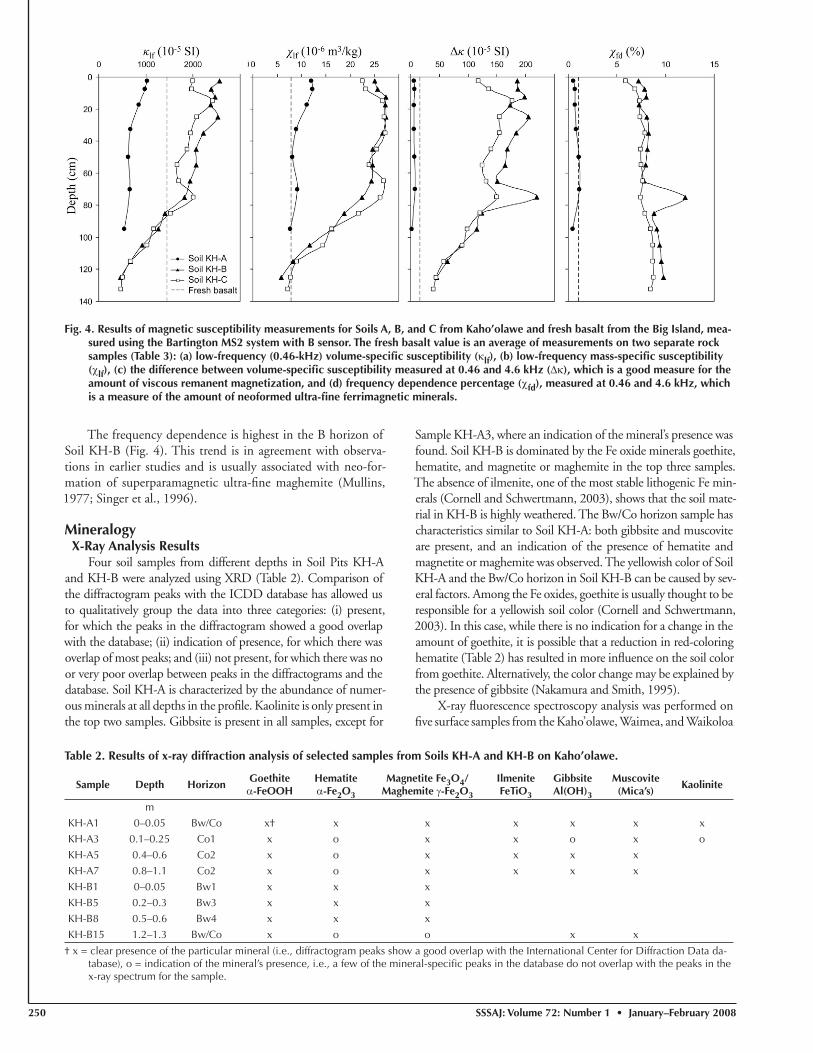
The laboratory Bartington measurements with the MS2B sensor system indicate a very large magnetic susceptibility in the top horizons of Soils KH-B and KH-C (Fig. 4). Below a depth of 0.7 m, the magnetic susceptibility decreases signifi cantly to values similar to those found in Soil KH-A. The high magnetic suscep-tibility values in the Bw1 to Bw4 horizons (Fig. 2b) are probably associated with the increase in concentration of Fe oxides, which are the most stable end product for low-pH soils in this climate. In Soil KH-A, the magnetic susceptibility values are much lower than those in Soil KH-B, and similar to values found for unweath-ered, fresh basalt from the Big Island of Hawaii (Fig. 4b–4d). The magnetic susceptibility values (measured with the MS2D sensor) for the top horizons (Bw) in Pits KH-A and KH-B (1000 and 3000 10 5, respectively) are consistent with those observed in
the surface measurements (Fig. 3a).
Fig. 3. Surface soil magnetic susceptibilities (corrected for air drift) measured in the fi eld using a Bartington MS2 sensor with D-loop at a frequency of 0.958 kHz at (a) Kaho’olawe, (b) Waiko-loa, and (c) Waimea fi eld sites. The fi lled circles indicate the exact locations of the measurements, distributed according to a stratifi ed random sampling scheme in the 30- by 30-m grids. Sample material from the numbered locations (0,5; 0,20; 5,25; 15,15; and 20,0) has been used for additional analysis (e.g., Table 3). The open squares give locations of the soil pits.
250 SSSAJ: Volume 72: Number 1 • January–February 2008
The frequency dependence is highest in the B horizon of Soil KH-B (Fig. 4). This trend is in agreement with observa-tions in earlier studies and is usually associated with neo-for-mation of superparamagnetic ultra-fi ne maghemite (Mullins, 1977; Singer et al., 1996).
MineralogyX-Ray Analysis Results
Four soil samples from different depths in Soil Pits KH-A and KH-B were analyzed using XRD (Table 2). Comparison of the diffractogram peaks with the ICDD database has allowed us to qualitatively group the data into three categories: (i) present, for which the peaks in the diffractogram showed a good overlap with the database; (ii) indication of presence, for which there was overlap of most peaks; and (iii) not present, for which there was no or very poor overlap between peaks in the diffractograms and the database. Soil KH-A is characterized by the abundance of numer-ous minerals at all depths in the profi le. Kaolinite is only present in the top two samples. Gibbsite is present in all samples, except for
Sample KH-A3, where an indication of the mineral’s presence was found. Soil KH-B is dominated by the Fe oxide minerals goethite, hematite, and magnetite or maghemite in the top three samples. The absence of ilmenite, one of the most stable lithogenic Fe min-erals (Cornell and Schwertmann, 2003), shows that the soil mate-rial in KH-B is highly weathered. The Bw/Co horizon sample has characteristics similar to Soil KH-A: both gibbsite and muscovite are present, and an indication of the presence of hematite and magnetite or maghemite was observed. The yellowish color of Soil KH-A and the Bw/Co horizon in Soil KH-B can be caused by sev-eral factors. Among the Fe oxides, goethite is usually thought to be responsible for a yellowish soil color (Cornell and Schwertmann, 2003). In this case, while there is no indication for a change in the amount of goethite, it is possible that a reduction in red-coloring hematite (Table 2) has resulted in more infl uence on the soil color from goethite. Alternatively, the color change may be explained by the presence of gibbsite (Nakamura and Smith, 1995).
X-ray fl uorescence spectroscopy analysis was performed on fi ve surface samples from the Kaho’olawe, Waimea, and Waikoloa
Fig. 4. Results of magnetic susceptibility measurements for Soils A, B, and C from Kaho’olawe and fresh basalt from the Big Island, mea-sured using the Bartington MS2 system with B sensor. The fresh basalt value is an average of measurements on two separate rock samples (Table 3): (a) low-frequency (0.46-kHz) volume-specifi c susceptibility ( lf), (b) low-frequency mass-specifi c susceptibility ( lf), (c) the difference between volume-specifi c susceptibility measured at 0.46 and 4.6 kHz ( ), which is a good measure for the amount of viscous remanent magnetization, and (d) frequency dependence percentage ( fd), measured at 0.46 and 4.6 kHz, which is a measure of the amount of neoformed ultra-fi ne ferrimagnetic minerals.
Table 2. Results of x-ray diffraction analysis of selected samples from Soils KH-A and KH-B on Kaho’olawe.
Sample Depth HorizonGoethite-FeOOH
Hematite-Fe2O3
Magnetite Fe3O4/Maghemite -Fe2O3
IlmeniteFeTiO3
GibbsiteAl(OH)3
Muscovite (Mica’s)
Kaolinite
m
KH-A1 0–0.05 Bw/Co x† x x x x x x
KH-A3 0.1–0.25 Co1 x o x x o x o
KH-A5 0.4–0.6 Co2 x o x x x x
KH-A7 0.8–1.1 Co2 x o x x x x
KH-B1 0–0.05 Bw1 x x x
KH-B5 0.2–0.3 Bw3 x x x
KH-B8 0.5–0.6 Bw4 x x x
KH-B15 1.2–1.3 Bw/Co x o o x x
† x = clear presence of the particular mineral (i.e., diffractogram peaks show a good overlap with the International Center for Diffraction Data da-tabase), o = indication of the mineral’s presence, i.e., a few of the mineral-specifi c peaks in the database do not overlap with the peaks in the x-ray spectrum for the sample.

SSSAJ: Volume 72: Number 1 • January–February 2008 251
fi eld sites, as well as two samples of unweathered basalt from Kohala Volcano on the Big Island of Hawaii (Table 3). The samples can be grouped according to weather-ing stage. High Ca and silica contents show that the Big Island basalt samples are the least weathered (Fig. 5a and 5b), followed by the material from Waikoloa and Waimea. The Kaho’olawe soil samples are the most intensely weathered, but the surface samples show that the mineralogy varies widely, depending on the location in the grid. The degree of weathering increases from the saprolite in Soil KH-A (A9 in Fig. 5b), through the lower weathered horizons (Bw/Co horizon in Soil KH-B; B15 in Fig. 5d), to the material in the B horizon of Soil KH-B (B5 in Fig. 5c).
Analysis of the XRF results indicates that initial weathering of the basaltic rocks caused Ca to disappear (Fig. 5a) and silica contents to decrease (Fig. 5b), lead-ing to a relative enrichment of Al and Fe. Continued weathering leached out Al and increased the Fe con-tent (Fig. 5c). The Fe content is linearly correlated (R2 = 0.97) to Ti (Fig. 5d), which is considered to be very stable and least subject to transformations and phase changes. The Ti/Fe ratio agrees well with val-ues reported in the literature for basic extrusive rocks (Piper, 1987).
Thermal Analysis
Table 3. Results of x-ray fl uorescence measurements for soil pit and surface samples from Kaho’olawe (Kaho) and surface sam-ples from the Waikoloa and Waimea sites on the Big Island of Hawaii. Fresh basalt samples (BI-S3) were collected on Ko-hala Volcano on the Big Island of Hawaii (Soil 3 in Van Dam et al., 2005a). All data have been corrected for loss on ignition.
Location Sample name SiO2 TiO2 Al2O3 Fe2O3 MnO MgO CaO Na2O K2O P2O5 Rb Sr Zr
—————————————— % (w/w) ——————————————— —— mg kg 1 ——Waikoloa, surface WKL-20–00 42.1 3.9 26.0 17.9 0.3 3.1 4.0 0.9 1.0 0.8 22 407 506
Waikoloa, surface WKL-15–15 44.2 3.6 23.9 16.7 0.3 3.4 4.0 1.8 1.5 0.6 25 434 449
Waikoloa, surface WKL-05–25 49.8 2.9 19.7 11.9 0.2 3.2 6.6 3.0 1.7 0.9 38 1031 499
Waikoloa, surface WKL-00–20 48.7 3.1 20.7 12.9 0.3 2.9 6.2 2.7 1.5 0.9 38 901 539
Waikoloa, surface WKL-00–05 42.0 4.2 26.1 19.3 0.4 2.7 3.2 0.4 0.7 0.9 14 235 289
Waimea, surface WM-20–00 46.9 3.5 23.5 16.9 0.6 1.7 2.8 1.0 1.5 1.6 54 319 291
Waimea, surface WM-15–15 47.7 3.6 23.5 17.0 0.5 1.4 2.8 1.0 1.5 1.1 52 320 266
Waimea, surface WM-05–25 47.5 3.6 23.7 17.2 0.5 1.4 2.8 0.6 1.5 1.3 52 299 246
Waimea, surface WM-00–20 46.3 3.7 24.3 18.1 0.4 1.3 2.7 0.5 1.4 1.4 39 218 197
Waimea, surface WM-00–05 46.3 3.7 24.0 18.2 0.5 1.4 2.5 0.6 1.3 1.4 36 236 240
Kaho, surface KH2E-20–00 20.4 10.3 19.0 48.6 0.3 0.4 0.1 0.0 0.5 0.4 31 46 546
Kaho, surface KH2E-15–15 19.4 10.2 20.8 48.1 0.1 0.4 0.1 0.0 0.5 0.4 28 54 564
Kaho, surface KH2E-05–25 27.4 6.7 32.0 32.9 0.1 0.2 0.1 0.0 0.3 0.3 17 43 408
Kaho, surface KH2E-00–20 29.5 6.5 34.4 28.7 0.1 0.3 0.0 0.0 0.2 0.2 10 39 435
Kaho, surface KH2E-00–05 22.6 8.5 26.6 41.0 0.1 0.3 0.1 0.0 0.4 0.4 24 42 543
Kaho, Pit B KH-B1 19.3 10.6 17.9 50.3 0.1 0.5 0.3 0.0 0.6 0.4 32 87 610
Kaho, Pit B KH-B5 16.6 12.0 11.9 57.0 0.1 0.9 0.5 0.0 0.5 0.4 31 141 681
Kaho, Pit B KH-B8 16.8 11.9 12.2 55.8 0.3 1.1 1.0 0.0 0.5 0.5 25 136 628
Kaho, Pit B KH-B15 29.1 6.3 29.6 32.0 0.0 0.9 1.5 0.0 0.3 0.2 8 98 380
Kaho, Pit A KH-A1 32.9 6.7 32.4 27.1 0.1 0.3 0.0 0.0 0.2 0.3 5 52 494
Kaho, Pit A KH-A3 33.2 7.0 31.5 27.5 0.1 0.2 0.1 0.0 0.2 0.3 4 36 506
Kaho, Pit A KH-A5 30.8 7.5 32.8 28.1 0.1 0.2 0.1 0.0 0.1 0.3 0 35 499
Kaho, Pit A KH-A7 29.9 7.3 30.1 31.2 0.1 0.6 0.2 0.0 0.2 0.4 0 32 524
Kaho, Pit A KH-A9-saprolite 39.5 5.4 31.6 22.3 0.1 0.4 0.2 0.1 0.2 0.3 5 40 431
Big Island BI-S3-basalt1 46.4 2.8 13.6 14.2 0.2 10.8 9.3 1.8 0.6 0.3 14 398 196Big Island BI-S3-basalt2 46.5 2.9 13.6 14.1 0.2 10.9 9.2 1.7 0.6 0.3 13 401 197
Fig. 5. Results of x-ray fl uorescence spectroscopy measurements for different data sets from Kaho’olawe and the Big Island of Hawaii (see also Table 3). All val-ues have been adjusted for loss on ignition. Samples A9, B5, and B15, which are discussed in the text, are identifi ed for clarity.
252 SSSAJ: Volume 72: Number 1 • January–February 2008
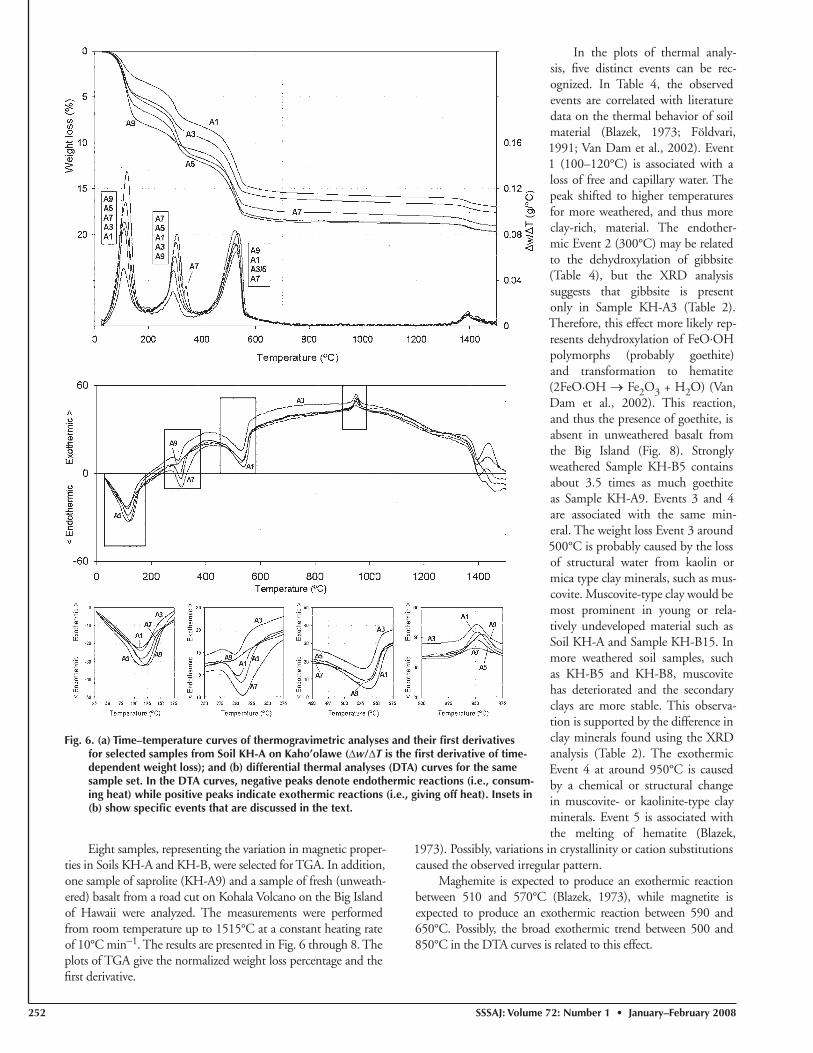
Eight samples, representing the variation in magnetic proper-ties in Soils KH-A and KH-B, were selected for TGA. In addition, one sample of saprolite (KH-A9) and a sample of fresh (unweath-ered) basalt from a road cut on Kohala Volcano on the Big Island of Hawaii were analyzed. The measurements were performed from room temperature up to 1515°C at a constant heating rate of 10°C min 1. The results are presented in Fig. 6 through 8. The plots of TGA give the normalized weight loss percentage and the fi rst derivative.
In the plots of thermal analy-sis, fi ve distinct events can be rec-ognized. In Table 4, the observed events are correlated with literature data on the thermal behavior of soil material (Blazek, 1973; Földvari, 1991; Van Dam et al., 2002). Event 1 (100–120°C) is associated with a loss of free and capillary water. The peak shifted to higher temperatures for more weathered, and thus more clay-rich, material. The endother-mic Event 2 (300°C) may be related to the dehydroxylation of gibbsite (Table 4), but the XRD analysis suggests that gibbsite is present only in Sample KH-A3 (Table 2). Therefore, this effect more likely rep-resents dehydroxylation of FeO OH polymorphs (probably goethite) and transformation to hematite (2FeO·OH Fe2O3 + H2O) (Van Dam et al., 2002). This reaction, and thus the presence of goethite, is absent in unweathered basalt from the Big Island (Fig. 8). Strongly weathered Sample KH-B5 contains about 3.5 times as much goethite as Sample KH-A9. Events 3 and 4 are associated with the same min-eral. The weight loss Event 3 around 500°C is probably caused by the loss of structural water from kaolin or mica type clay minerals, such as mus-covite. Muscovite-type clay would be most prominent in young or rela-tively undeveloped material such as Soil KH-A and Sample KH-B15. In more weathered soil samples, such as KH-B5 and KH-B8, muscovite has deteriorated and the secondary clays are more stable. This observa-tion is supported by the difference in clay minerals found using the XRD analysis (Table 2). The exothermic Event 4 at around 950°C is caused by a chemical or structural change in muscovite- or kaolinite-type clay minerals. Event 5 is associated with the melting of hematite (Blazek,
1973). Possibly, variations in crystallinity or cation substitutions caused the observed irregular pattern.
Maghemite is expected to produce an exothermic reaction between 510 and 570°C (Blazek, 1973), while magnetite is expected to produce an exothermic reaction between 590 and 650°C. Possibly, the broad exothermic trend between 500 and 850°C in the DTA curves is related to this effect.
Fig. 6. (a) Time–temperature curves of thermogravimetric analyses and their fi rst derivatives for selected samples from Soil KH-A on Kaho’olawe ( w/ T is the fi rst derivative of time-dependent weight loss); and (b) differential thermal analyses (DTA) curves for the same sample set. In the DTA curves, negative peaks denote endothermic reactions (i.e., consum-ing heat) while positive peaks indicate exothermic reactions (i.e., giving off heat). Insets in (b) show specifi c events that are discussed in the text.
SSSAJ: Volume 72: Number 1 • January–February 2008 253
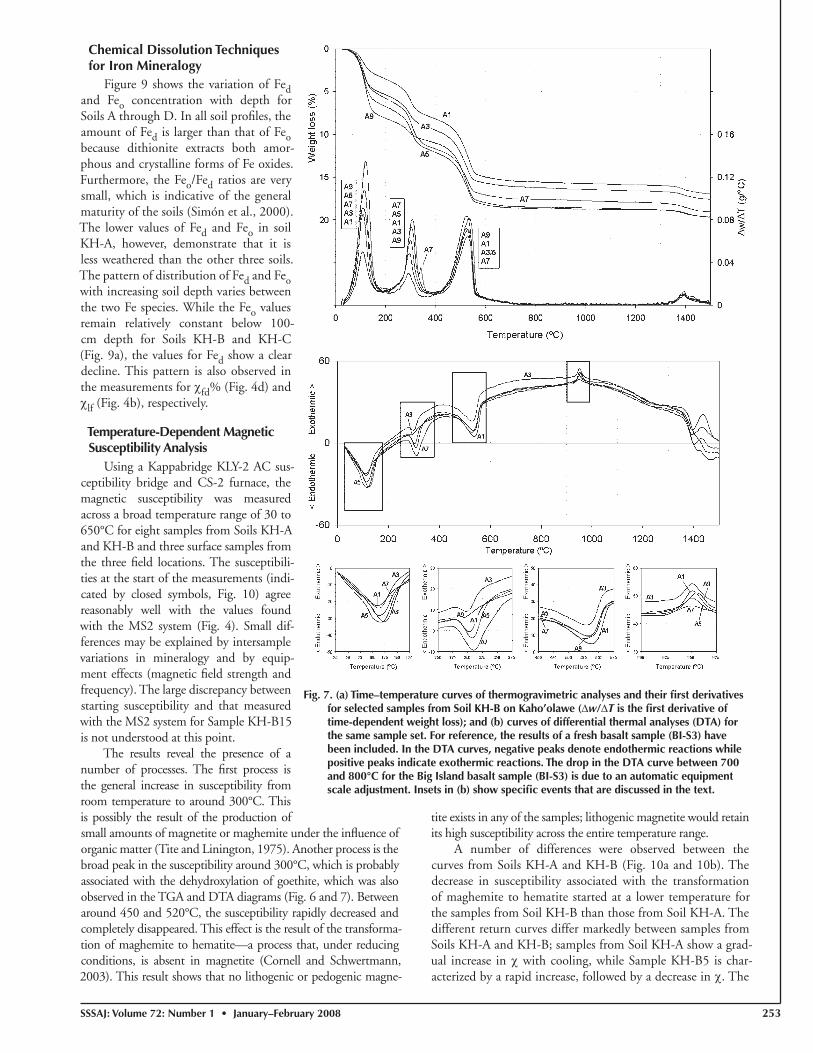
Chemical Dissolution Techniques for Iron Mineralogy
Figure 9 shows the variation of Fedand Feo concentration with depth for Soils A through D. In all soil profi les, the amount of Fed is larger than that of Feobecause dithionite extracts both amor-phous and crystalline forms of Fe oxides. Furthermore, the Feo/Fed ratios are very small, which is indicative of the general maturity of the soils (Simón et al., 2000). The lower values of Fed and Feo in soil KH-A, however, demonstrate that it is less weathered than the other three soils. The pattern of distribution of Fed and Feowith increasing soil depth varies between the two Fe species. While the Feo values remain relatively constant below 100-cm depth for Soils KH-B and KH-C (Fig. 9a), the values for Fed show a clear decline. This pattern is also observed in the measurements for fd% (Fig. 4d) and
lf (Fig. 4b), respectively.
Temperature-Dependent Magnetic Susceptibility Analysis
Using a Kappabridge KLY-2 AC sus-ceptibility bridge and CS-2 furnace, the magnetic susceptibility was measured across a broad temperature range of 30 to 650°C for eight samples from Soils KH-A and KH-B and three surface samples from the three fi eld locations. The susceptibili-ties at the start of the measurements (indi-cated by closed symbols, Fig. 10) agree reasonably well with the values found with the MS2 system (Fig. 4). Small dif-ferences may be explained by intersample variations in mineralogy and by equip-ment effects (magnetic fi eld strength and frequency). The large discrepancy between starting susceptibility and that measured with the MS2 system for Sample KH-B15 is not understood at this point.
The results reveal the presence of a number of processes. The fi rst process is the general increase in susceptibility from room temperature to around 300°C. This is possibly the result of the production of small amounts of magnetite or maghemite under the infl uence of organic matter (Tite and Linington, 1975). Another process is the broad peak in the susceptibility around 300°C, which is probably associated with the dehydroxylation of goethite, which was also observed in the TGA and DTA diagrams (Fig. 6 and 7). Between around 450 and 520°C, the susceptibility rapidly decreased and completely disappeared. This effect is the result of the transforma-tion of maghemite to hematite—a process that, under reducing conditions, is absent in magnetite (Cornell and Schwertmann, 2003). This result shows that no lithogenic or pedogenic magne-
tite exists in any of the samples; lithogenic magnetite would retain its high susceptibility across the entire temperature range.
A number of differences were observed between the curves from Soils KH-A and KH-B (Fig. 10a and 10b). The decrease in susceptibility associated with the transformation of maghemite to hematite started at a lower temperature for the samples from Soil KH-B than those from Soil KH-A. The different return curves differ markedly between samples from Soils KH-A and KH-B; samples from Soil KH-A show a grad-ual increase in with cooling, while Sample KH-B5 is char-acterized by a rapid increase, followed by a decrease in . The
Fig. 7. (a) Time–temperature curves of thermogravimetric analyses and their fi rst derivatives for selected samples from Soil KH-B on Kaho’olawe ( w/ T is the fi rst derivative of time-dependent weight loss); and (b) curves of differential thermal analyses (DTA) for the same sample set. For reference, the results of a fresh basalt sample (BI-S3) have been included. In the DTA curves, negative peaks denote endothermic reactions while positive peaks indicate exothermic reactions. The drop in the DTA curve between 700 and 800°C for the Big Island basalt sample (BI-S3) is due to an automatic equipment scale adjustment. Insets in (b) show specifi c events that are discussed in the text.

254 SSSAJ: Volume 72: Number 1 • January–February 2008
observed differences in T curves between samples from Soils KH-A and KH-B may be used as an estimate for the amount of hyperfi ne maghemite present, which would be an important new way to characterize the presence of superparamagnetic minerals. Because the processes and rates of thermal intercon-versions between maghemite and hematite are dependent on crystal size (Cornell and Schwertmann, 2003), however, more research is required to make quantitative estimates of the pro-posed relationship between T and hyperfi ne maghemite.
DISCUSSION AND CONCLUSIONSIn Fig. 11 to 13, the different measures of mineralogy and
magnetic properties are compared for selected samples. Not all analyses have been performed for all samples so that, in this dis-cussion, there is a focus on the samples from Kaho’olawe and the fresh basalt from the Big Island of Hawaii. The XRF analysis of a large range of soils on Kaho’olawe and the Big Island showed that
an increase in the degree of soil development is accompanied by a gradual increase in the Fe content of the soils (Table 3, Fig. 5). For
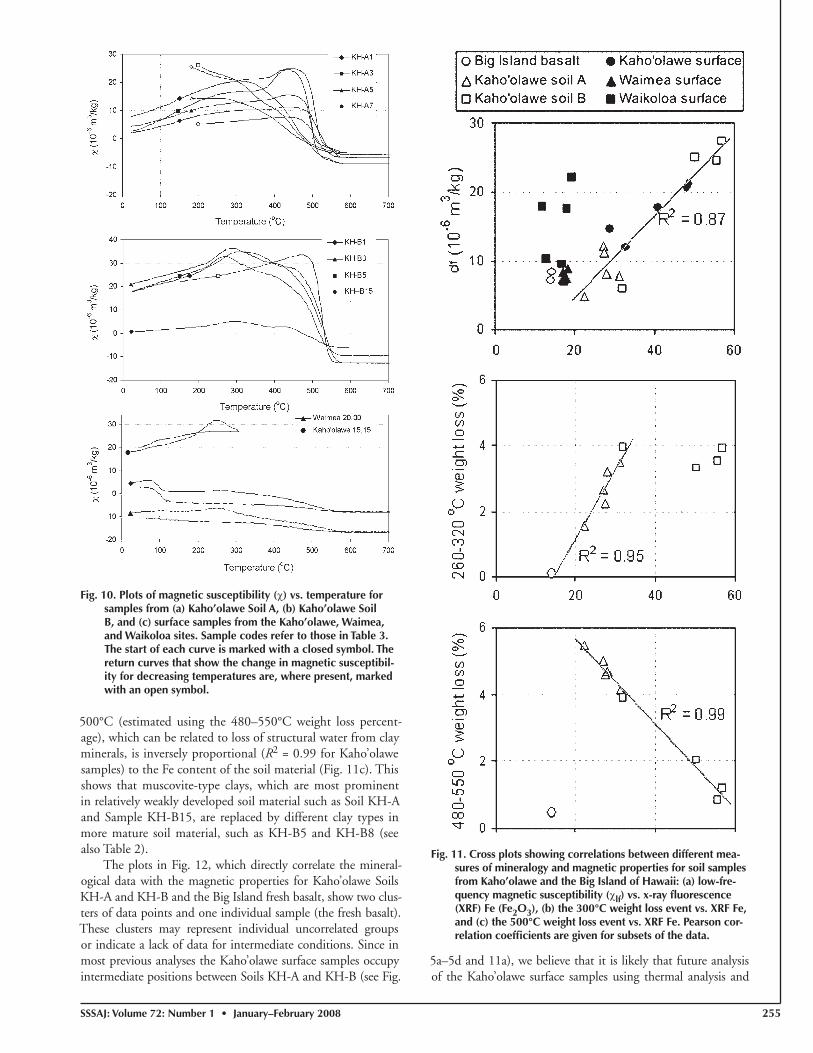
the samples from Kaho’olawe, this increase in Fe content, in turn, is positively corre-lated (R2 = 0.87) with the lf (Fig. 11a). The fresh basalt samples and soil material from Waimea, on the Big Island of Hawaii, seem to fi t with this general trend. The samples from Waikoloa, however, exhibit anoma-lously high magnetic susceptibility values (Fig. 11a), which are as of yet unexplained.
The positive correlation between Fe content and the 300°C weight loss event (estimated using the 260–320°C weight loss percentage in Fig. 11b [R2 = 0.95]) indicates an increase in goethite content during initial soil development. For the most strongly developed soil material in Soil KH-B (thus excluding Sample KH-B15), however, the 300°C weight loss (~goethite content) stabilized at around 3.5 to 4%. The weight loss event at around
Fig. 8. Thermogravimetric analysis curves and fi rst derivatives for a sample of unweathered basalt (BI-S3-basalt2) from Kohala Volcano on the Big Island of Hawaii, a saprolite sample from Kaho’olawe Soil KH-A (KH-A9, see Table 3), and a strongly weathered sample (KH-B5) from Soil KH-B on Kaho’olawe ( w/ T is the fi rst derivative of time-depen-dent weight loss).
Table 4. Comparison of thermogravimetric and differential thermal analyses (DTA) with events described in the literature.
DTA peak temperature
Reactiontype
Probable effect Temperature
°C °C
110 endothermicloss of free watertransformation of ferrihydrite to hematite
~100
280 endothermicdehydration of gibbsite and formation of böhmite†dehydroxilation of gibbsite‡dehydroxilation of goethite§
250–330270–380
280
470 endothermicdecomposition of böhmite ( -AlO·OH)†loss of structural water from kaolin or micas†
510 endothermicdecomposition of böhmite ( -AlO·OH)†loss of structural water from kaolin or micas†
900 exothermicchemical or structural change in kaolinite or mica (muscovite)†
~1380 endothermic hematite melting† 1360–1440
† From Blazek (1973).
‡ From Földvari (1991).
§ From Van Dam et al. (2002).
Fig. 9. Results of selective chemical dissolution of pedogenic Fe oxides using a fl ame atomic absorption spectrometer for Soils A, B, C, and D: (a) total amount of secondary Fe oxy-hydroxides (Fed); and (b) poorly crystalline and amorphous Fe oxyhydroxides (Feo).
SSSAJ: Volume 72: Number 1 • January–February 2008 255
500°C (estimated using the 480–550°C weight loss percent-age), which can be related to loss of structural water from clay minerals, is inversely proportional (R2 = 0.99 for Kaho’olawe samples) to the Fe content of the soil material (Fig. 11c). This shows that muscovite-type clays, which are most prominent in relatively weakly developed soil material such as Soil KH-A and Sample KH-B15, are replaced by different clay types in more mature soil material, such as KH-B5 and KH-B8 (see also Table 2).
The plots in Fig. 12, which directly correlate the mineral-ogical data with the magnetic properties for Kaho’olawe Soils KH-A and KH-B and the Big Island fresh basalt, show two clus-ters of data points and one individual sample (the fresh basalt). These clusters may represent individual uncorrelated groups or indicate a lack of data for intermediate conditions. Since in most previous analyses the Kaho’olawe surface samples occupy intermediate positions between Soils KH-A and KH-B (see Fig.
5a–5d and 11a), we believe that it is likely that future analysis of the Kaho’olawe surface samples using thermal analysis and
Fig. 11. Cross plots showing correlations between different mea-sures of mineralogy and magnetic properties for soil samples from Kaho’olawe and the Big Island of Hawaii: (a) low-fre-quency magnetic susceptibility ( lf) vs. x-ray fl uorescence (XRF) Fe (Fe2O3), (b) the 300°C weight loss event vs. XRF Fe, and (c) the 500°C weight loss event vs. XRF Fe. Pearson cor-relation coeffi cients are given for subsets of the data.
Fig. 10. Plots of magnetic susceptibility ( ) vs. temperature for samples from (a) Kaho’olawe Soil A, (b) Kaho’olawe Soil B, and (c) surface samples from the Kaho’olawe, Waimea, and Waikoloa sites. Sample codes refer to those in Table 3. The start of each curve is marked with a closed symbol. The return curves that show the change in magnetic susceptibil-ity for decreasing temperatures are, where present, marked with an open symbol.
256 SSSAJ: Volume 72: Number 1 • January–February 2008
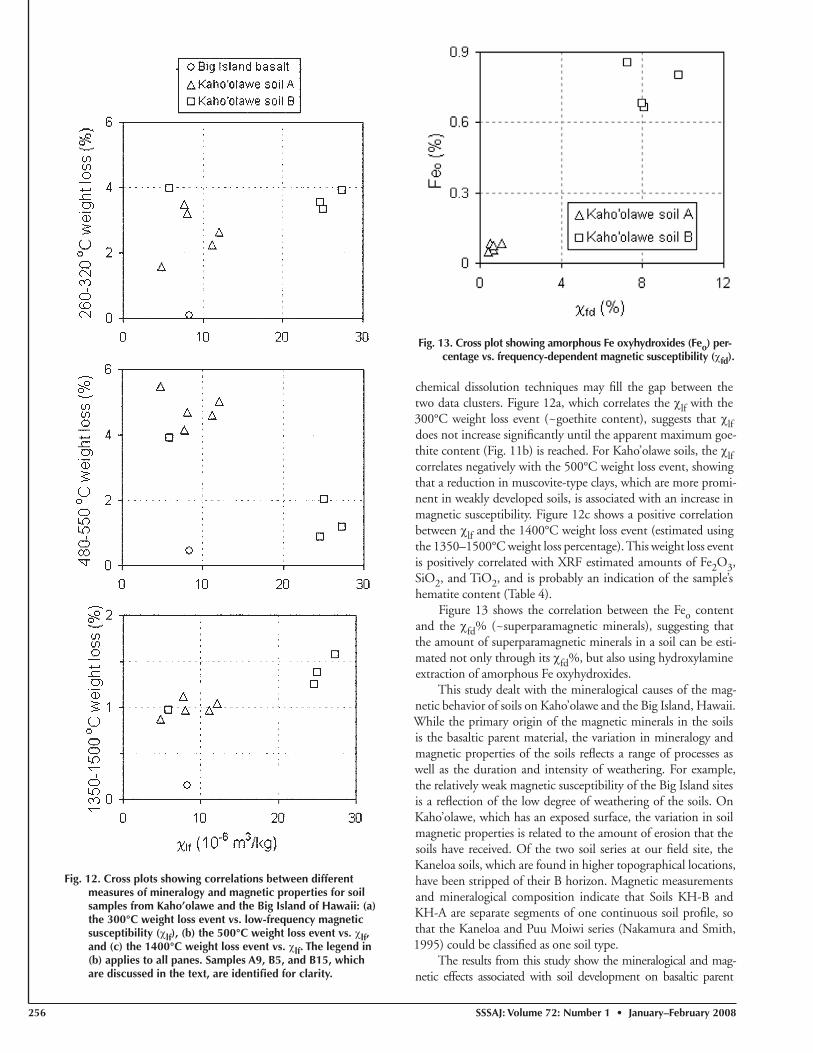
chemical dissolution techniques may fi ll the gap between the two data clusters. Figure 12a, which correlates the lf with the 300°C weight loss event (~goethite content), suggests that lfdoes not increase signifi cantly until the apparent maximum goe-thite content (Fig. 11b) is reached. For Kaho’olawe soils, the lfcorrelates negatively with the 500°C weight loss event, showing that a reduction in muscovite-type clays, which are more promi-nent in weakly developed soils, is associated with an increase in magnetic susceptibility. Figure 12c shows a positive correlation between lf and the 1400°C weight loss event (estimated using the 1350–1500°C weight loss percentage). This weight loss event is positively correlated with XRF estimated amounts of Fe2O3,SiO2, and TiO2, and is probably an indication of the sample’s hematite content (Table 4).
Figure 13 shows the correlation between the Feo content and the fd% (~superparamagnetic minerals), suggesting that the amount of superparamagnetic minerals in a soil can be esti-mated not only through its fd%, but also using hydroxylamine extraction of amorphous Fe oxyhydroxides.
This study dealt with the mineralogical causes of the mag-netic behavior of soils on Kaho’olawe and the Big Island, Hawaii. While the primary origin of the magnetic minerals in the soils is the basaltic parent material, the variation in mineralogy and magnetic properties of the soils refl ects a range of processes as well as the duration and intensity of weathering. For example, the relatively weak magnetic susceptibility of the Big Island sites is a refl ection of the low degree of weathering of the soils. On Kaho’olawe, which has an exposed surface, the variation in soil magnetic properties is related to the amount of erosion that the soils have received. Of the two soil series at our fi eld site, the Kaneloa soils, which are found in higher topographical locations, have been stripped of their B horizon. Magnetic measurements and mineralogical composition indicate that Soils KH-B and KH-A are separate segments of one continuous soil profi le, so that the Kaneloa and Puu Moiwi series (Nakamura and Smith, 1995) could be classifi ed as one soil type.
The results from this study show the mineralogical and mag-netic effects associated with soil development on basaltic parent
Fig. 12. Cross plots showing correlations between different measures of mineralogy and magnetic properties for soil samples from Kaho’olawe and the Big Island of Hawaii: (a) the 300°C weight loss event vs. low-frequency magnetic susceptibility ( lf), (b) the 500°C weight loss event vs. lf,and (c) the 1400°C weight loss event vs. lf. The legend in (b) applies to all panes. Samples A9, B5, and B15, which are discussed in the text, are identifi ed for clarity.
Fig. 13. Cross plot showing amorphous Fe oxyhydroxides (Feo) per-centage vs. frequency-dependent magnetic susceptibility ( fd).
SSSAJ: Volume 72: Number 1 • January–February 2008 257
material. The XRD analyses show that some primary-rock minerals still persist in young soils (e.g., ilmenite in Soil KH-A), while newly formed Fe oxides are present in large amounts in the B horizon of Soil KH-B. The XRF analysis shows that initial soil development led to rapid leaching of Ca and a gradual decrease in silica, which resulted in a relative enrichment of Al and Fe. On Kaho’olawe, with a surface age of at least 1 million yr, the conditions have been favor-able for leaching of Al and a further development toward an Oxisol with large amounts of Fe. Thermal analysis allowed estimation of the relative amounts of goethite and muscovite, both of which vary systematically with position in the soil profi le and correlate with the observed variations in magnetic properties. The results from the Tanalysis shows that the high magnetic susceptibility and the large VRM observed in geophysical surveys in Kaho’olawe are completely due to secondary, or neoformed, minerals.
ACKNOWLEDGMENTSWe thank the Kaho’olawe Island Reserve Commission (KIRC) for permission to collect data on Kaho’olawe. We thank KIRC staff for logistical support, Len Pasion and Sean Walker for organization of the fi eld campaign, Chris McKee (New Mexico Bureau of Geology and Mineral Resources’ XRD Lab), Scott Morton, and Shinku Sky for fi eld and lab assistance, and Mark Dekkers, José Fabris, Russell Harmon, Jan Hendrickx, Michael Velbel, and Tom Vogel for discussions. The research was funded by grants from the U.S. Army Research Offi ce (STIR W911NF-04-1-0433 to RvD) and SERDP (UX-1414 to R. Van Dam, J.B.J. Harrison, and Y. Li, and UX-1355 to Y. Li). R.E. North was funded by the U.S. Army ERDC Basic Research Program and granted permission to publish by the director of the Geotechnical & Structures Lab.
REFERENCESBillings, S.D., L.R. Pasion, D.W. Oldenburg, and J. Foley. 2003. The infl uence
of magnetic viscosity on electromagnetic sensors. p. 123–130. In EUDEM-SCOT2, Int. Conf. on Requirements and Technologies for the Detection, Removal and Neutralization of Landmines and UXO, Brussels. 15–18 Sept. 2003. Vrije Universiteit Brussels, Brussels, Belgium.
Blazek, A. 1973. Thermal analysis. Van Nostrand Reinhold Co., London.Butler, D.K. 2003. Implications of magnetic backgrounds for unexploded
ordnance detection. J. Appl. Geophys. 54:111–125.Chao, T.T., and L. Zhou. 1983. Extraction techniques for selective dissolution
of amorphous iron oxides from soils and sediments. Soil Sci. Soc. Am. J. 47:225–232.
Clague, D.A., and G.B. Dalrymple. 1987. The Hawaiian-Emperor volcanic chain. Part II. p. 5–54. In R.W. Decker et al. (ed.) Volcanism in Hawaii. Vol. 1. U.S. Dep. of the Interior, Washington, DC.
Clague, D.A., and G.B. Dalrymple. 1989. Tectonics, geochronology, and origin of the Hawaiian-Emperor Chain. p. 188–217. In E.L. Winterer et al. (ed.) The Eastern Pacifi c Ocean and Hawaii: The geology of North America. Geol. Soc. Am., Boulder, CO.
Cornell, R.M., and U. Schwertmann. 2003. The iron oxides: Structure, properties, reactions, occurrences and uses. Wiley-VCH, Weinheim, Germany.
Das, Y., J.E. McFee, and G. Cross. 2002. Soil properties database for humanitarian demining: A proposed initiative. In Proc. World Congr. of Soil Sci., 17th, Bangkok [CD-ROM].14–21 Aug. 2002. Soil and Fertilizer Soc. of Thailand, Bangkok.
Dearing, J.A. 1994. Environmental magnetic susceptibility: Using the Bartington MS2 system. Chi Publ., Fairfi eld, CT.
Fabris, D., J.M.D. Coey, and W.D.N. Mussel. 1998. Magnetic soils from mafi c lithodomains in Brazil. Hyperfi ne Interact. 113:249–258.
Földvari, M. 1991. Measurement of different water species in minerals by means of thermal derivatography. p. 84–101. In W. Smykatz-Kloss and S.S.J. Warne (ed.) Thermal analysis in geosciences. Springer-Verlag, Berlin.
Goulart, A.T., J.D. Fabris, M.F. de Jesus Filho, J.M.D. Coey, G.M. da Costa, and E. De Grave. 1998. Iron oxides in a soil developed from basalt. Clays Clay Miner. 46:369–378.
Holmgren, G.G.S. 1967. A rapid citrate–dithionite extractable iron procedure. Soil Sci. Soc. Am. Proc. 31:210–211.
Lindsley, D.H. (ed.). 1991. Oxide minerals: Petrologic and magnetic signifi cance. Rev. Mineral. Ser. 25. Mineral. Soc. Am., Chantilly, VA.
Mullins, C.E. 1977. Magnetic susceptibility of the soil and its signifi cance in soil science—A review. J. Soil Sci. 28:223–246.
Nakamura, S., and C.W. Smith. 1995. Soil survey of the Island of Kahoolawe, Hawaii. U.S. Dep. of the Interior, Washington, DC.
Piper, J.D.A. 1987. Paleomagnetism and the continental crust. John Wiley & Sons, New York.
Simón, M., S. Sánchez, and I. García. 2000. Soil landscape evolution on a Mediterranean high mountain. Catena 39:211–231.
Singer, M.J., K.L. Verosub, P. Fine, and J. TenPas. 1996. A conceptual model for the enhancement of magnetic susceptibility in soils. Quat. Int. 34–36:243–248.
Speyer, R.F. 1994. Thermal analysis of materials. Marcel Dekker, New York.Stucki, J.W., B.A. Goodman, and U. Schwertmann (ed.). 1988. Iron in soils
and clay minerals. D. Reidel Publ. Co., Dordrecht, the Netherlands.Tite, M.S., and R.E. Linington. 1975. Effect of climate on the magnetic
susceptibility of soils. Nature 256:565–566.Thompson, R., and F. Oldfi eld. 1986. Environmental magnetism. Allen &
Unwin, London.Van Dam, R.L., J.B.J. Harrison, J.M.H. Hendrickx, B. Borchers, R.E. North, J.E.
Simms, C. Jasper, C.W. Smith, and Y. Li. 2005a. Variability of magnetic soil properties in Hawaii. p. 157–164. In R.S. Harmon et al. (ed.) Proc. Detection and Remediation Technologies for Mines and Minelike Targets, 10th, Orlando. 28 Mar.–1 Apr. 2005. Soc. for Optical Eng., Bellingham, WA.
Van Dam, R.L., J.M.H. Hendrickx, J.B.J. Harrison, and B. Borchers. 2005b. Conceptual model for prediction of magnetic properties in tropical soils. p. 177–187. In R.S. Harmon et al. (ed.) Proc. Detection and Remediation Technologies for Mines and Minelike Targets, 10th, Orlando. 28 Mar.–1 Apr. 2005. Soc. for Optical Eng., Bellingham, WA.
Van Dam, R.L., J.M.H. Hendrickx, B. Harrison, B. Borchers, D.I. Norman, S.A. Ndur, C. Jasper, P. Niemeyer, R. Nartey, D. Vega, L. Calvo, and J.E. Simms. 2004. Spatial variability of magnetic soil properties. p. 665–676. In R.S. Harmon et al. (ed.) Proc. Detection and Remediation Technologies for Mines and Minelike Targets, 9th, Orlando. 12–16 Apr. 2004. Soc. for Optical Eng., Bellingham, WA.
Van Dam, R.L., W. Schlager, M.J. Dekkers, and J.A. Huisman. 2002. Iron oxides as a cause of GPR refl ections. Geophysics 67:536–545.
Walker, S.E., L.R. Pasion, S.D. Billings, Y. Li, and D.W. Oldenburg. 2005. Examples of the effect of magnetic soil environments on time domain electromagnetic data. In Proc. Symp. Application of Geophysics to Eng. and Environ. Problems, Atlanta. 3–7 Apr. 2005. Environ. Eng. Geophys. Soc., Denver.
Ward, S.H. (ed.). 1990. Geotechnical and environmental geophysics. Soc. Explor. Geophys., Tulsa, OK.
Webster, R., and M.A. Oliver. 1990. Statistical methods in soil and land resource survey. Oxford Univ. Press, Oxford, UK.
Wedepohl, K.H. 1969. Composition and abundance of common igneous rocks. p. 227–249. In K.H. Wedepohl (ed.) Handbook of geochemistry. Springer-Verlag, Berlin.
Wolfe, E.W., and J. Morris. 1996. Geologic map of the island of Hawaii (1:100,000). U.S. Dep. of the Interior, Washington, DC.
Wood, C.A., and J. Kienle (ed.). 1990. Volcanoes of North America: United States and Canada. Cambridge Univ. Press, New York.
Wright, T.L., and D.A. Clague. 1989. Petrology of Hawaiian lava. p. 218–237. In E.L. Winterer et al. (ed.) The Eastern Pacifi c Ocean and Hawaii: The geology of North America. Geol. Soc. Am., Boulder, CO.