mineral resource estimate for the mandiana … · mineral resource estimate for the mandiana gold...
TRANSCRIPT

changed the report name to work with the local application script 03.06.13
Report Prepared by
SRK Consulting (UK) Limited
UK5500
MINERAL RESOURCE ESTIMATE FOR THE MANDIANA GOLD PROJECT,
GUINEA
Prepared For
Sovereign Mines of Guinea

SRK Consulting U5500 Mandiana MRE Nov 2013 – Details
U5500_Mandian_MRE_JORC_final.docx January 2014
SRK Legal Entity: SRK Consulting (UK) Limited
SRK Address: 5th Floor Churchill House 17 Churchill Way
City and County of Cardiff, CF10 2HH Wales, United Kingdom.
Date: January 2014
Project Number: UK5500
SRK Project Director: Mike Armitage Corporate Consultant (Resource Geology)]
SRK Project Manager: Martin Pittuck Corporate Consultant (Resouce Geology)
Client Legal Entity: Sovereign Mines of Africa Plc
Client Address: SOVEREIGN MINES OF GUINEA GUIORD-GUISOB
Cité Chemin de Fer, 3 ème étage Immeuble Mamou,
B.P. 4252 Conakry – Republique de Guinée
VERSION 060313
COPYRIGHT AND DISCLAIMER
Copyright (and any other applicable intellectual property rights) in this document and any accompanying data or models which are created by SRK Consulting (UK) Limited ("SRK") is reserved by SRK and is protected by international copyright and other laws. Copyright in any component parts of this document such as images is owned and reserved by the copyright owner so noted within the document.
This document may not be utilised or relied upon for any purpose other than that for which it is stated within and SRK shall not be liable for any loss or damage caused by such use or reliance. In the event that the recipient of this document wishes to use the content of this document in support of any purpose beyond or outside that which it is expressly stated or for the raising of any finance from a third party where the document is not being utilised in its full form for this purpose, the recipient shall, prior to such use, present a draft of any report or document produced by it that may incorporate any of the content of this document to SRK for review so that SRK may ensure that this is presented in a manner which accurately and reasonably reflects any results or conclusions produced by SRK.
The use of this document is strictly subject to terms licensed by SRK to its Client as the recipient of this document and unless otherwise agreed by SRK, this does not grant rights to any third party. This document shall only be distributed to any third party in full as provided by SRK and may not be reproduced or circulated in the public domain (in whole or in part) or in any edited, abridged or otherwise amended form unless expressly agreed in writing by SRK. Any other copyright owner’s work may not be separated from this document, used or reproduced for any other purpose other than with the document in full as licensed by SRK. In the event that this document is disclosed or distributed to any third party, no such third party shall be entitled to place reliance upon any information, warranties or representations which may be contained within this document and the recipient of this document shall indemnify SRK against all and any claims, losses and costs which may be incurred by SRK relating to such third parties.
© SRK Consulting (UK) Limited 2013
SRK Consulting U5500 Mandiana MRE Nov 2013 – Table of Contents Main Report
U5500_Mandian_MRE_JORC_final.docx January 2014 Page i of iii
Table of Contents 1 INTRODUCTION...................................................................................................1
1.1 Background............................................................................................................................. 1
1.2 Qualifications of Consultants .................................................................................................. 1
2 RELIANCE ............................................................................................................2 3 PROPERTY DESCRIPTION AND LOCATION ....................................................2
3.1 Introduction ............................................................................................................................. 2
3.2 Mandiana Project Licence ...................................................................................................... 4
4 GEOLOGICAL SETTING......................................................................................6 4.1 Regional Geology ................................................................................................................... 6
4.1.1 Archaean gneissic rocks with supracrustal intercalations ............................................ 7
4.1.2 Paleoproterozoic greenstones and metasediments ..................................................... 7
4.1.3 Paleoproterozoic granite terrains.................................................................................. 7
4.2 Structural Geology .................................................................................................................. 8
4.3 Local Geology......................................................................................................................... 8
5 EXPLORATION RESULTS...................................................................................9 5.1 Structural Interpretation and Pit Mapping ............................................................................... 9
5.2 Soil Sampling........................................................................................................................ 10
5.3 Pit sampling .......................................................................................................................... 10
5.4 Exploration Drilling Programme (Phase 1 to 3) .................................................................... 11
6 QUALITY ASSURANCE/QUALITY CONTROL .................................................13 6.1 Introduction ........................................................................................................................... 13
6.2 Quality Assurance/Quality Control........................................................................................ 13
6.2.1 Certified Reference Materials (Standards) ................................................................. 14
6.2.2 Blanks......................................................................................................................... 15
6.2.3 Duplicates................................................................................................................... 15
6.2.4 Umpire Laboratory/3rd Party Check Assays ............................................................... 18
6.3 QAQC Recommendations .................................................................................................... 18
7 MINERAL RESOURCE ESTIMATION ...............................................................19 7.1 Database Integrity................................................................................................................. 19
7.2 Site Visits .............................................................................................................................. 19
7.3 Geological Interpretation....................................................................................................... 19
7.4 Estimation and Modelling...................................................................................................... 21
7.4.1 Data Validation ........................................................................................................... 21
7.4.2 Statistics ..................................................................................................................... 22
7.4.3 Variogram modelling................................................................................................... 24
7.4.4 Grade Block Modelling ............................................................................................... 29
7.4.5 Grade Tonnage Curves .............................................................................................. 30
SRK Consulting U5500 Mandiana MRE Nov 2013 – Table of Contents Main Report
U5500_Mandian_MRE_JORC_final.docx January 2014 Page ii of iii
7.4.6 Mining, metallurgical, environmental Factors and Assumptions ................................ 33
7.4.7 Bulk Density................................................................................................................ 34
7.5 Classification......................................................................................................................... 35
8 MINERAL RESOURCE STATEMENT................................................................36 9 CONCLUSIONS AND RECOMMENDATIONS ..................................................38
List of Tables Table 3-1: SMA’s Exploration Permit holdings .............................................................................. 5 Table 5-1: Summary of drilling carried out at Mandiana over the three phases of exploration
drilling. ........................................................................................................................ 12 Table 6-1: QA/QC Submission Summary .................................................................................... 14 Table 6-2: Certified Reference Material for Phase1, 2 and 3 ...................................................... 14 Table 7-1: Basic 1m composite statistics for the domains at Mandiana ...................................... 22 Table 7-2: Yagbelen semi-variogram parameters after back transformation from Pairwise
Relative model............................................................................................................ 25 Table 7-3: Foulouni semi-variogram parameters after back transformation from Pairwise Relative
model.......................................................................................................................... 26 Table 7-4: Woyondjan semi-variogram parameters after back transformation from Pairwise
Relative model............................................................................................................ 27 Table 7-5: Damantere semi-variogram parameters after back transformation from Pairwise
Relative model............................................................................................................ 28 Table 7-6: Yagbelen Ordinary Kriging search parameters .......................................................... 29 Table 7-7: Foulouni Ordinary Kriging search parameters............................................................ 29 Table 7-8: Woyondjan Ordinary Kriging search parameters ....................................................... 29 Table 7-9: Damantere Ordinary Kriging search parameters........................................................ 30 Table 7-10: Grade Tonnage table for the combined Mandiana deposits highlighting the potential
for high grade resource to be delineated.................................................................... 32 Table 8-1: SRK Mineral Resource Statement, as at 1 November 2013 ...................................... 36 Table 8-2: Breakdown by deposit of the high grade (>1g/t) component of the Mineral Resource
.................................................................................................................................... 36
List of Figures Figure 3-1: Location map and general underlying geology showing location of Mandiana in
relation to other major West African Mining projects and operations ........................... 3 Figure 3-2: Location map showing Mandiana in relation to nearby licences and operations (inset
shows the other SMA licences in Guinea).................................................................... 4 Figure 3-3: Image showing the outline of the Mandiana licences including the new Southern
Extension...................................................................................................................... 5 Figure 4-1: Geological map of eastern Guinea showing the locations of SMA’s EPs. ................... 6 Figure 5-1: Initial Interpretation of structures from satellite imagery in the Yegbelen and
Woyondjan zones of the Mandiana-Magana EP. ....................................................... 11 Figure 5-2: Vertical Longitudinal Projection through Yagbelen looking from South-west towards
north-east showing the potential for delineation of plunging zones of mineralisation and depth extensions ................................................................................................. 13
Figure 6-1: Sample Collection....................................................................................................... 16 Figure 6-2: Duplicate vs. Original Au Assay (Phase 1, 2, and 3).................................................. 17 Figure 6-3: Lab Duplicate Mean Absolute Difference (%) (Phase 1 and 2 Only) ......................... 17 Figure 6-4: Lab Duplicate Mean Absolute Difference - (Phase 1 and 2 Only) .............................. 18 Figure 7-1: Relative location of the four modelled domains constituting the 2013 Mineral
Resource estimate at Mandiana (XY coordinate spacing =100m). ............................ 20 Figure 7-2: Plan and example cross section at Yagbelen showing mineralised domains and drill
hole layout. ................................................................................................................. 21 Figure 7-3: Log histograms and QQ (quantile) plots for the four domains at Mandiana............... 23 Figure 7-4: Yagbelen directional semi-variograms (Pairwise Relative transformation)) ............... 25 Figure 7-5: Foulouni directional semi-variograms (Pairwise Relative transformation)) ................ 26 Figure 7-6: Woyondjan directional semi-variograms (Pairwise Relative transformation)) ............ 27

SRK Consulting U5500 Mandiana MRE Nov 2013 – Table of Contents Main Report
U5500_Mandian_MRE_JORC_final.docx January 2014 Page iii of iii
Figure 7-7: Damantere directional semi-variograms (Pairwise Relative transformation)) ............ 28 Figure 7-8: Yagbelen Grade Tonnage curve unclassified and reported within Mineral Resource pit
shell ............................................................................................................................ 30 Figure 7-9: Foulouni Grade Tonnage curve unclassified and reported within Mineral Resource pit
shell ............................................................................................................................ 31 Figure 7-10: Woyondjan Grade Tonnage curve unclassified and reported within Mineral Resource
pit shell ....................................................................................................................... 31 Figure 7-11: Damantere Grade Tonnage curve unclassified and reported within Mineral Resource
pit shell ....................................................................................................................... 32 Figure 7-12: Combined Grade Tonnage curve unclassified and reported within Mineral Resource
pit shell ....................................................................................................................... 33 Figure 7-13: Mineral Resource pit shells (using elevated CMF gold price of $1,550/oz) for
Yagbelen/Foulouni and Woyondjan showing the blocks included and excluded from the final Mineral Resource statement ......................................................................... 34
Figure 7-14: Density vs Alteration Correlation ................................................................................ 35 Figure 8-1: 3D isometric view of the combined Foulouni and Yagbelen deposits showing the block
grade distribution at >0.3g/t (upper) and >1.0g/t (lower) showing the relatively good continuity of the higher grade zones. ......................................................................... 37

SRK Consulting (UK) Limited 5th Floor Churchill House 17 Churchill Way City and County of Cardiff CF10 2HH, Wales United Kingdom E-mail: [email protected] URL: www.srk.co.uk Tel: + 44 (0) 2920 348 150 Fax: + 44 (0) 2920 348 199
Registered Address: 21 Gold Tops, City and County of Newport, NP20 4PG, Wales, United Kingdom.
SRK Consulting (UK) Limited Reg No 01575403 (England and Wales)
Group Offices: Africa Asia
Australia Europe
North America South America
MINERAL RESOURCE ESTIMATE FOR THE MANDIANA GOLD PROJECT, GUINEA
1 INTRODUCTION
1.1 Background
SRK Consulting (UK) Limited (“SRK”) is an associate company of the international group holding company, SRK Consulting (Global) Limited (the “SRK Group”). SRK has been requested by Sovereign Mines of Guinea (“SMG”, hereinafter also referred to as the “Company” or the “Client”) to undertake a Mineral Resource Estimate on the Mineral Assets of the Company comprising the Mandiana-Magana Project (“Mandiana”) located in Guinea.
The client holds a 100% interest in the exploration permit which constitutes the Mandiana-Magana project. The asset is located in Birimian rocks of the Siguiri Basin in northeastern Guinea within the vicinity of several recent discoveries including Avocet’s Tri-K development gold project and Gold Field’s Yanfolila gold property. Initial drill-testing of the Mandiana-Magana property commenced in early June 2011.
1.2 Qualifications of Consultants
SRK is an associate company of the international group holding company SRK Consulting (Global) Limited. The SRK Group comprises over 1,600 staff, offering expertise in a wide range of resource engineering disciplines with 50 offices located on six continents. The SRK Group’s independence is ensured by the fact that it holds no equity in any project. This permits the SRK Group to provide its clients with conflict-free and objective recommendations on crucial judgement issues. The SRK Group has a demonstrated track record in undertaking independent assessments of resources and reserves, project evaluations and audits, Mineral Experts’ Reports, Competent Persons’ Reports, Mineral Resource and Ore Reserve Compliance Audits, Independent Valuation Reports and independent feasibility evaluations to bankable standards on behalf of exploration and mining companies and financial institutions worldwide. The SRK Group has also worked with a large number of major international mining companies and their projects, providing mining industry consultancy service inputs. SRK also has specific experience in commissions of this nature.
The Competent Person (“CP”) responsible for the MRE is Dr John Arthur, Principal Consultant (Resource Geology). Dr Arthur has over nineteen years of experience and is a full time employee of SRK with sufficient experience, relevant to the style of mineralisation and type of deposit under consideration and to the activity which he is undertaking to qualify as a Competent Person, as defined by the JORC Code. Dr Arthur is a Chartered Geologist and Fellow of the Geological Society of London, which is a ‘Recognised Overseas Professional Organisation’ (“ROPO”).

SRK Consulting U5500 Mandiana MRE Nov 2013 – Main Report
U5500_Mandian_MRE_JORC_final.docx January 2014 Page 2 of 39
2 RELIANCE SRK’s opinion, effective as of 1 November 2013, is based on information provided to SRK by the Company throughout the course of SRK’s investigations as described below.
This report includes technical information, which requires subsequent calculations to derive sub-totals, totals and weighted averages. Such calculations inherently involve a degree of rounding and consequently introduce a margin of error. Where these occur, SRK does not consider them to be material.
SRK is not an insider, associate or affiliate of The Company, and neither SRK nor any affiliate has acted as advisor to the Company or its affiliates in connection with the Mandiana project. The results of the technical work completed by SRK is not dependent on any prior agreements concerning the conclusions to be reached, nor are there any undisclosed understandings concerning any future business dealings.
Mr Martin Pittuck, a full time employee of SRK with the position of Principal Resource Geologist, carried out a site inspection during April/May 2013. During this visit considerable time was spent at the Mandiana exploration camp with SMA’s geological team and advisors including Directors John Barry and John Prochnau, reviewing geological interpretations on cross section to support wire-framing. The exploration operations were visited and numerous representative areas of the deposit were investigated. In addition, Mr Pittuck visited the sample storage and preparation facilities and observed a number of representative core sections in the core storage facility.
SRK is confident that the underlying data supporting the stated Mineral Resource has been thoroughly validated.
3 PROPERTY DESCRIPTION AND LOCATION
3.1 Introduction
Guinea covers a land area of 245,857 km2 and is bordered by Guinea-Bissau and Senegal to the north, Mali and Cote d’Ivoire to the east, and Liberia and Sierra Leone to the southwest. Its capital city is Conakry, located on the Atlantic coast and home to around fifteen percent of Guinea’s ten million inhabitants. Guinea’s international airport, known as Gbessia International Airport, is located in Conakry and serves destinations that include most West African capital cities, as well as the European cities of Brussels and Paris. The currency of Guinea is the Guinean Franc.
The producing gold mines in Guinea are: Lefa Mine, Siguiri Mine and Kiniero Mine (currently classified as an asset held for sale and production has been discontinued). All three are open-pit operations located in northeastern Guinea. Gold at these operations is produced predominantly from oxides using carbon-in-leach or carbon-in-pulp processes.

SRK Consulting U5500 Mandiana MRE Nov 2013 – Main Report
U5500_Mandian_MRE_JORC_final.docx January 2014 Page 3 of 39
Figure 3-1: Location map and general underlying geology showing location of
Mandiana in relation to other major West African Mining projects and operations
The Mandiana property is currently SMA’s most advanced prospect and is regarded as the main material asset of the Company. The property is located in northeast Guinea, approximately 100km northeast of the city of Kankan, and 60km southeast of AngloGold Ashanti’s Siguiri Gold Mine (Figure 3-2). The eastern most boundary of the licence runs along the border with Mali.

SRK Consulting U5500 Mandiana MRE Nov 2013 – Main Report
U5500_Mandian_MRE_JORC_final.docx January 2014 Page 4 of 39
Figure 3-2: Location map showing Mandiana in relation to nearby licences and
operations (inset shows the other SMA licences in Guinea)
3.2 Mandiana Project Licence
The permit covers a broadly north-south trending belt of gold occurrences shown on a published 1:1,000,000 map of gold deposits (BRGM, 1999), and lies within the area of the Buré Gold Field, which was reported to be one of the main sources of gold for the rulers of the ancient Kingdom of Mali. There is, however, no information available to SMA on any previous mineral exploration work carried out specifically on the Mandiana-Magana permit area. Intense artisanal gold mining activity by orpailleurs supports the economy of the local communities, indicating the presence of gold.
The Exploration Permit which comprises the Mandiana-Magana permitted area (Arrêté 2010/570), now referred to as the Northern concession (see Figure 3-3) was issued to Guiord SA a wholly-owned subsidiary of Sovereign Mines of Guinea Ltd (SMG) on 3rd February 2010 for a period of 3 years (Table 3-1).
SMG is a Guinea-registered subsidiary of SMA. The permit was re-issued in April 2013 for an additional period of two years and covers an area of 127.32 km2. In November 2013, Guiord was granted a contiguous exploration concession to the south now referred to as the Southern concession, effectively doubling the potential strike extension of the Mandiana gold mineralising system (Figure 3-3). SMG has not commenced any work on this new concession.

SRK Consulting U5500 Mandiana MRE Nov 2013 – Main Report
U5500_Mandian_MRE_JORC_final.docx January 2014 Page 5 of 39
Figure 3-3: Image showing the outline of the Mandiana licences including the new
Southern Extension
Table 3-1: SMA’s Exploration Permit holdings
Project Permit Name Permit No. Permit
Owner Region (and Prefecture)
Issue Date Expiry Date Area (km2)
Mandiana-Magana
Mandiana (North)
2013/789 Guiord SA Kankan (Mandiana)
09/04/2013
09/04/2015 127.32
Mandiana-Magana
Mandiana (South)
2013/130 Guiord SA Kankan (Mandiana)
10/10/2013
10/10/2016 181
Marela Marela 2013/790 Guiord SA Mamou
(Faranah) 09/04/20
13 09/04/201
5 736
Dalaghna Dalaghna 2013/791 Guiord SA Kankan (Mandiana)
09/04/2013
09/04/2015 500
An Exploration Permit (EP) grants the exclusive right to explore for all of the substances specified in the permit for an initial period of three years. EP’s are not subject to minimum expenditure requirements, but must comply with submitted and approved exploration programmes. The permits can be renewed twice, each time for a period of two years. Fifty percent of the EP area should be relinquished on initial renewal.

SRK Consulting U5500 Mandiana MRE Nov 2013 – Main Report
U5500_Mandian_MRE_JORC_final.docx January 2014 Page 6 of 39
4 GEOLOGICAL SETTING
4.1 Regional Geology
Figure 4-1: Geological map of eastern Guinea showing the locations of SMA’s EPs.

SRK Consulting U5500 Mandiana MRE Nov 2013 – Main Report
U5500_Mandian_MRE_JORC_final.docx January 2014 Page 7 of 39
The geology of Guinea is predominantly made up of Precambrian rocks which have been strongly deformed by a series of orogenic events that affected the wider region of West Africa (Figure 4-1). The two principal events are the Liberian Orogeny and the Eburnean Orogeny (Birimian sequences). In Guinea, the geology can be classified into three main subdivisions.
4.1.1 Archaean gneissic rocks with supracrustal intercalations
The Archaean rocks comprise granites, gneisses and migmatites intercalated with high grade schistose metasediments. These are remnants of the West African Craton, ancient shield rocks which formed circa 2.6 to 2.9 Ga. Recent mapping of these rocks has enabled subdivisions to be distinguished on the basis of age and lithology. The oldest of these subdivisions are high-grade metamorphic rocks (amphibolites to granulite facies) which pre-date the Liberian Orogeny, dated between 2.8 and 3.05 Ga. The second of these subdivisions comprises granitic batholiths of Liberian age (circa 2.6 to 2.8 Ga). The final subdivision comprises two banded iron formation (BIF) ranges at Simandou and Nimba.
4.1.2 Paleoproterozoic greenstones and metasediments
The northeast of Guinea is dominated by a vast area of Paleoproterozoic metasedimentary and metavolcanic rocks referred to as the Siguiri Basin and which forms the host stratigraphy for the Mandiana deposit. The basin is bounded to the south by Paleoproterozoic plutonic rocks and to the north is buried by overlying Late Paleoproterozoic and Mesozoic sediments. Marine detrital sedimentary rocks (silts and fine sandstones) comprise the dominant lithologies within the basinal succession, but are intercalated with minor lavas, pyroclastic rocks and are intruded by subvolcanic dykes and sills. All of the rocks are generally weakly metamorphosed, and the development of sericite as a secondary mineral is pervasive. Deformation within the basinal succession is heterogeneous with most of the metasediments and metavolcanics possessing an irregular foliation with localised development of a stronger schistosity in shear zones and in the vicinity of plutonic contacts.
Volcanics within the basin have been dated at circa 2.1 Ga, leading to the interpretation that the Siguiri Basin succession is the same age as volcanic rocks in other Birimian greenstone belts elsewhere in the wider West African region. The volcanic components within the Basin share the same geochemical characteristics as modern-day subduction zones, suggesting that the Basin originally had a convergent margin setting.
Birimian greenstones host world class accumulations of gold in West Africa. In Guinea, the Siguiri Basin hosts the Siguiri, Lefa and Kiniero mines, the principal gold producers of the country. Numerous other gold prospects occur throughout the basin, which extends east across the Malian frontier.
4.1.3 Paleoproterozoic granite terrains
A large belt of granitic composition plutonic rocks comprise a batholith. This belt separates the Archaean cratonic rocks to the south from the Siguiri Basin metasediments to the north. The belt has an average width of 50–100 km and outcrops in an arc, with a general WNW-ESE strike. Several isolated plutons of Paleoproterozoic age fall outside of this arc, within the Siguiri Basin and the Archaean domain.

SRK Consulting U5500 Mandiana MRE Nov 2013 – Main Report
U5500_Mandian_MRE_JORC_final.docx January 2014 Page 8 of 39
Lithologically the granite terrain is dominated by a vast granodioritic batholith that is intruded by smaller granitic bodies such as monzogranites, biotite granites and two-mica granites. The granite batholith is dated at circa 2.08 Ga, indicating that it was emplaced late in the Eburnean Orogeny. Its emplacement during this orogeny is thought to coincide with the development of large-scale sinistral shear zones along the southern margin of the plutonic belt where it borders the Archaean domain.
4.2 Structural Geology
Two main fracture and fault zones have played an important role in the tectonic development of Guinea and on the control of hydrothermal gold mineralisation found throughout the Birimian. Probably the most important are NNE-SSW and N-S trending structures associated with intense ductile deformation, normally with a significant sinistral transcurrent component. These structures are commonly host zones of intense quartz, carbonate and kaolinitic hydrothermal alteration associated with gold mineralisation. Within the northeast of Guinea, prominent east-northeast lineaments cross the entire Siguiri Basin. Some of these structures are known to be fault zones associated with intense mylonitic deformation and are the locus of granodiorite lenses injected into these structures.
Geophysical maps of Guinea indicate the presence of many mafic to ultramafic dykes and sills which intruded the Archaean and Proterozoic rocks during the Mesozoic. The intrusions generally strike in an E-W orientation.
4.3 Local Geology
The underlying geology of the entire Mandiana-Magana project is mapped as Birimian rocks of the Siguiri Basin succession (BRGM). Waste samples from (artisanal mine workings (orpaillages)) in the area indicate the rocks consist of weakly metamorphosed argillites, silts and fine sandstones. These metasediments are folded and contain a weak to moderately developed slatey cleavage which dips sub vertically and trends N-S to NNE-SSW. The presence of fine mineral stretching lineation has been noted. Cutting the metasediments are E-W trending basic dykes of probable Mesozoic age, interpreted from aeromagnetic data and the presence of dolerite fragments at surface.
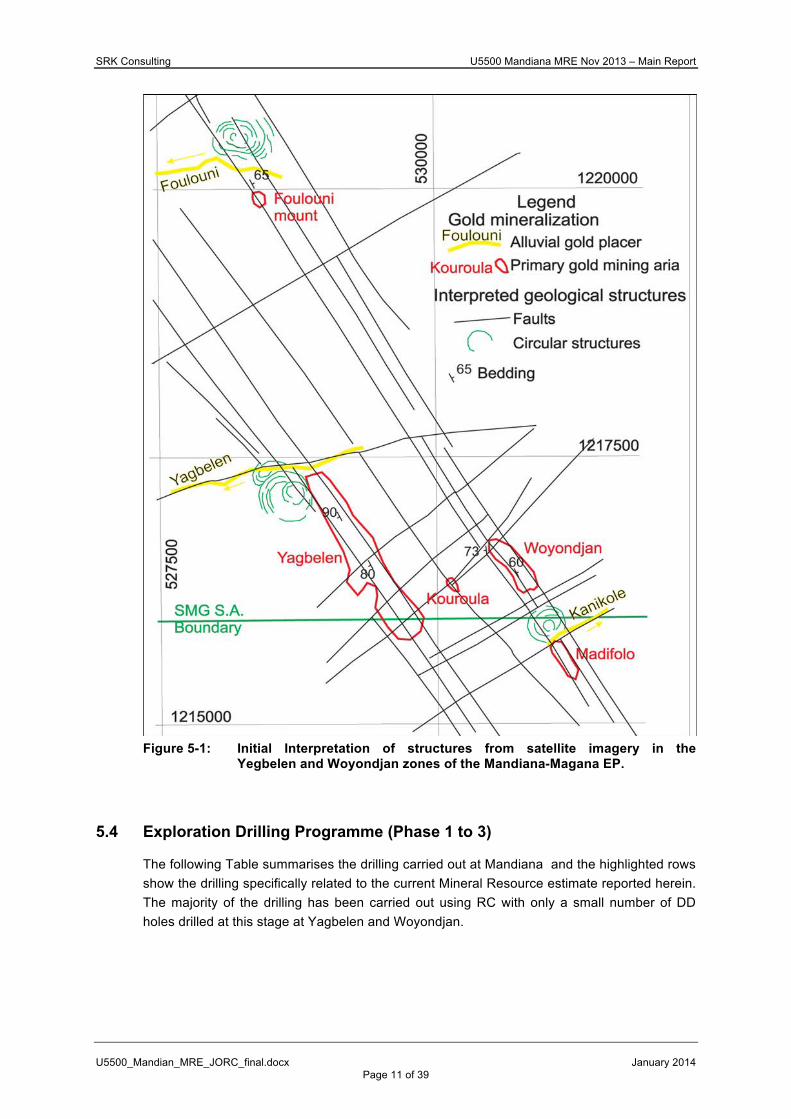
Geological interpretation of satellite imagery of the Mandiana-Magana asset together with mapping of the pits and scarce outcrops, indicates that several systems of structures are present (Figure 5-1), although the precise nature and role in mineralisation are as yet unclear.
Within the area of the main orpaillage workings, the metasediments are pervasively altered by kaolinite and cut by quartz veins and breccias which contain red-brown oxides, interpreted to be the weathering product of sulphides. Orpailleurs extract gold from both quartz vein material and altered host rocks.
Weathering across the licences area is very deep with up to 200m of oxide capping the deposit in places. Weathering tends to be deepest over the main gold bearing zones and is likely a function of the enhanced permability along the mineralisation controlling structures.

SRK Consulting U5500 Mandiana MRE Nov 2013 – Main Report
U5500_Mandian_MRE_JORC_final.docx January 2014 Page 9 of 39
5 EXPLORATION RESULTS
5.1 Structural Interpretation and Pit Mapping
GeoEye satellite imagery was acquired by SMA in July 2010 and used for delineating major geological structures on the basis of their geomorphic expression (Figure 5-1). Concession-scale structures were interpreted from 1:25,000 scale imagery, while structures within the vicinity of the orpaillages were mapped at 1:5,000 scale. Additionally, where exposures permitted, basic structural measurements were recorded.
Interpretation of the satellite imagery by SMA has revealed four main sets of photolineaments on the basis of their orientation, which may represent geological features (Figure 6-1). These sets are oriented as follows: NW-SE, N-S, NE-SW and E-W. Orpaillage workings are generally co-linear with NW-SE and N-S oriented photolineaments, therefore SMA currently believe that these structures exert the principal structural control on the mineralisation and extend into the new southern concession. In several of the pits the foliation of the metasediments had an N-S or NNW-SSE strike and dip sub vertically towards the west. E-W and NE-SW oriented structures are tentatively interpreted as post-mineralisation, with some hosting Mesozoic dolerite dykes. Several enigmatic structures comprised of concentric circular lineaments have also been interpreted from the satellite imagery. SMA proposes these may relate to the positions of granitic or porphyry intrusives.
Pit mapping by SMA has recorded the locations of 7,876 individual pits along what appear to be two parallel structures comprising a mineralised corridor in Mandiana-Magana licence area (Error! Reference source not found.). Different groups of orpaillages were distinguished by the type of material they exploit, with three distinctions made: those that extract highly weathered in-situ saprolitic material; those that exploit colluvial material; and, others which mine alluvial placers. SMA has also distinguished relatively new areas of workings from established workings, and those which are said to pre-date French colonialisation. The known orpaillage sectors broadly define two linear NW-trending belts, which are referred to as the Yegbelen and Woyondjan gold fields. The belts are approximately 1,000 m and 600 m in length, respectively, and range up to 200 m in width.
The orpaillage sectors typically comprise clusters of closely spaced vertical pits often only 5 to 10 metres apart at surface and sometimes interconnected at depth where mineralised rock is encountered. The shafts generally target the soft, easily mineable saprolite horizon with depths from a few metres, up to 30 metres in exceptional cases. Individual orpaillage sectors are most frequently oriented along NW-SE to N-S trends and extend for lengths of several hundred metres. Based upon geological observation and pit sample results, SMA interprets there to be a reasonable continuity of gold mineralisation within structures following these trends.

SRK Consulting U5500 Mandiana MRE Nov 2013 – Main Report
U5500_Mandian_MRE_JORC_final.docx January 2014 Page 10 of 39
5.2 Soil Sampling
A soil sampling programme was undertaken by SMA’s geologists to delineate anomalous gold values in southern part of the property, outside of the areas of orpaillage workings. The sampling took place in January 2011 by two groups supervised by SMA’s geological staff. Sampling was conducted on an irregular grid consisting of 21 lines spaced 200-600m apart, with samples collected every 50m. Samples were taken from a minimum depth of 40cm below the base of the organic horizon or the surface and no samples were taken from areas of recent orpaillage workings. In total, 1,510 soil samples were sent to the ALS Chemex laboratory, Bamako in February 2011.
Soil samples from the Mandiana-Magana permit area range in grade from below detection to 5,000 ppb Au. The median analysis is 3 ppb and the mean is 19 ppb. Gold values of 8-40 ppb generally define relatively continuous zones which trend NW-SE and are co-linear with the main Yegbelen and Woyondjan gold fields, as defined by the pit mapping and sampling (Error! Reference source not found.). Higher soil values tend to be relatively spotty in distribution. Sample lines to the north of Yegbelen suggest that the gold mineralisation may extend up to 1.5 km north of the current limit of artisanal mining. However, due to the relatively wide line spacing, and the presence of more than one group of anomalous values, the correlation of the main zone between a few of the lines is not entirely straightforward. In SRK’s opinion, some infill soil sample lines are warranted prior to drill targeting areas between widely spaced (i.e. 500 m) sample lines north of Yegbelen. The area directly to the north of Woyondjan has not been sampled within a kilometre of the orpaillages, therefore this zone has the potential to be extended significantly in this direction.
5.3 Pit sampling
During November and December 2010, SMA carried out a program of pit sampling within recent orpaillages throughout the Mandiana-Magana permit area. In total, 582 samples of altered or mineralised rock considered representative of material mined by the orpailleurs, and mine spoil, from 291 pits were sampled by a team which included SMA geologists, field technicians and former orpailleurs. All orpaillage camps were visited. The intention of this sampling programme was to establish a qualitative indication of the configuration, distribution and extent of the gold mineralisation.
SRK Consulting U5500 Mandiana MRE Nov 2013 – Main Report
U5500_Mandian_MRE_JORC_final.docx January 2014 Page 11 of 39
Figure 5-1: Initial Interpretation of structures from satellite imagery in the
Yegbelen and Woyondjan zones of the Mandiana-Magana EP.
5.4 Exploration Drilling Programme (Phase 1 to 3)
The following Table summarises the drilling carried out at Mandiana and the highlighted rows show the drilling specifically related to the current Mineral Resource estimate reported herein. The majority of the drilling has been carried out using RC with only a small number of DD holes drilled at this stage at Yagbelen and Woyondjan.

SRK Consulting U5500 Mandiana MRE Nov 2013 – Main Report
U5500_Mandian_MRE_JORC_final.docx January 2014 Page 12 of 39
Table 5-1: Summary of drilling carried out at Mandiana over the three phases of exploration drilling.
Drill holes cut high-grade lodes generally less than three metres in width within much broader lower-grade intervals (cut-off of 0.25 g/t gold). Bonanza grade quartz veins were intercepted at Yagbelen in drill-holes RCY-117 which cut one metre of 149 g/t gold from eight metres, RCY 114 which cut one metre of 97.4 g/t gold from 184 metres and RCY-94 which cut one metre of 68.8 g/t gold from 168 metres and probably explain the intensity of artisanal activity in the areas. Of much greater significance for potential commercial bulk mining of these gold deposits is the presence of continuous broader zones of lower-grade gold mineralization which form a halo to the higher-grade vein system and may reflect mobilization within the exceptionally deep weathering profile (200 metres at Yagbelen). This broader lower-grade gold mineralization is characterized by hydrothermal alteration including sulphidation and quartz veining within the intensely weathered profile.
Figure 5-2 shows the results from a preliminary vertical projection of the grades at Yagbelen and emphasises the potential for identifying and delineating zones of moderate to steeply plunging mineralisation. This image does not include the bonanza grade intersection mentioned above which occurs to the north and may be representative of a second high grade shoot. The implication is that deeper targeted drilling could increase the resource potential at Yagbelen.

SRK Consulting U5500 Mandiana MRE Nov 2013 – Main Report
U5500_Mandian_MRE_JORC_final.docx January 2014 Page 13 of 39
Figure 5-2: Vertical Longitudinal Projection through Yagbelen looking from South-
west towards north-east showing the potential for delineation of plunging zones of mineralisation and depth extensions
6 QUALITY ASSURANCE/QUALITY CONTROL
6.1 Introduction
SRK has conducted an analysis of the Company’s database that was compiled on completion of Phase 3 drill program. The following section makes comment on the data quality and the controls that have been applied for Phase 1- 3 of the Mandiana Project.
6.2 Quality Assurance/Quality Control
SMG dispatched approximately 17,000 samples in total to the ALS laboratory in Bamako, Mali and of these 3,829 Blank, Standard and Duplicate samples were included. SRK is advised that the Bamako Lab is not an accredited analytical laboratory. Notwithstanding, SMG reports that samples are prepared and assayed by standard Au gold method at the ALS operated laboratory, as follows;
• weighing (WEI-21), • sample logging (LOG 22), • crushing (CRU-21), - >70% -6 mm, • pulverizing (PUL-21) - >85% -75 microns, • fire assay with atomic absorption finish for gold (Au-AA26) 50 g with low detection level
0.01 g/t. • crushing quality control (CRUE-QC) and pulverizing quality control (PUL-QC) tests.
Results of assays were e-mailed to SMG S.A.: 1)

SRK Consulting U5500 Mandiana MRE Nov 2013 – Main Report
U5500_Mandian_MRE_JORC_final.docx January 2014 Page 14 of 39
Table 6-1: QA/QC Submission Summary
SUMMARY COUNT %
Total Samples 17702 100.0%
Standard 1214 6.9%
Blank 1146 6.5%
Duplicate 1469 8.3%
6.2.1 Certified Reference Materials (Standards)
Throughout the program, SMG submitted Certified Reference Material (“Standard” or “CRM”) samples in an effort to monitor the accuracy of the assaying process and results. For the Phase 1, Phase 2 and Phase 3 programs, 20 CRMs have been included in the sampling programs. The specifications of these are summarised in Table 6-2 below.
Table 6-2: Certified Reference Material for Phase1, 2 and 3 CRM Lower Limit Upper Limit
G999-4 Lower 2.83 ppm Upper 3.21 ppm OxI96 Lower 1.68 ppm Upper 1.92 ppm OxL51 Lower 5.49 ppm Upper 6.21 ppm SG56 Lower 0.96 ppm Upper 1.1 ppm OxK94 Lower 3.34 ppm Upper 3.79 ppm G997-3 Lower 1.32 ppm Upper 1.5 ppm MG-12 Lower 0.82 ppm Upper 0.95 ppm OxJ95 Lower 2.19 ppm Upper 2.49 ppm OxP50 Lower 13.95 ppm Upper 15.85 ppm G310-8 Lower 7.48 ppm Upper 8.46 ppm SH55 Lower 1.28 ppm Upper 1.47 ppm
OxP50 Lower 13.95 ppm Upper 15.85 ppm SK52 Lower 3.85 ppm Upper 4.36 ppm
OxF100 Lower 0.75 ppm Upper 0.86 ppm OxF85 Lower 0.75 ppm Upper 0.86 ppm OxG84 Lower 0.86 ppm Upper 0.99 ppm OxI81 Lower 1.69 ppm Upper 1.93 ppm OxK79 Lower 3.31 ppm Upper 3.75 ppm OxK94 Lower 3.34 ppm Upper 3.79 ppm OxK95 Lower 3.31 ppm Upper 3.76 ppm
The Company reports that Standards were inserted after each 23 original samples of the 17,702 samples that were processed, 1,214 standard samples were assayed which represented (6.9%) of all samples submitted.
SRK is satisfied the standards chosen are of sufficient range in grade, source (mineralogy and style) and colour to reflect the potential grades and styles of mineralization encountered on the Project. The submitted CRM’s are hidden in the sample numbering scheme and the results can therefore be assessed independently to test the laboratory performance. SRK
SRK Consulting U5500 Mandiana MRE Nov 2013 – Main Report
U5500_Mandian_MRE_JORC_final.docx January 2014 Page 15 of 39
assumes, but has not verified, that the CRM weights are the same as the pulp sample weights; therefore ensuring they remain blind as required.
6.2.2 Blanks
Blank samples of Ordovician quartz sandstone were used for monitoring of contamination in sampling and assaying. In total 1,146 (6.5%) blank samples were assayed for monitoring of assaying. Blank samples were inserted after each 35 ordinary samples.
The blank Au grade ranges from below detection limit to from 0.01 to 0.2 Au ppm. SRK would recommend the addition of a coarse blank to provide more meaningful results on contamination at the sample preparation facility, in addition to or inclusion of actual resultant grade (absolute grade) instead time difference data. It would typically be expected that there is more variation than what is displayed below.
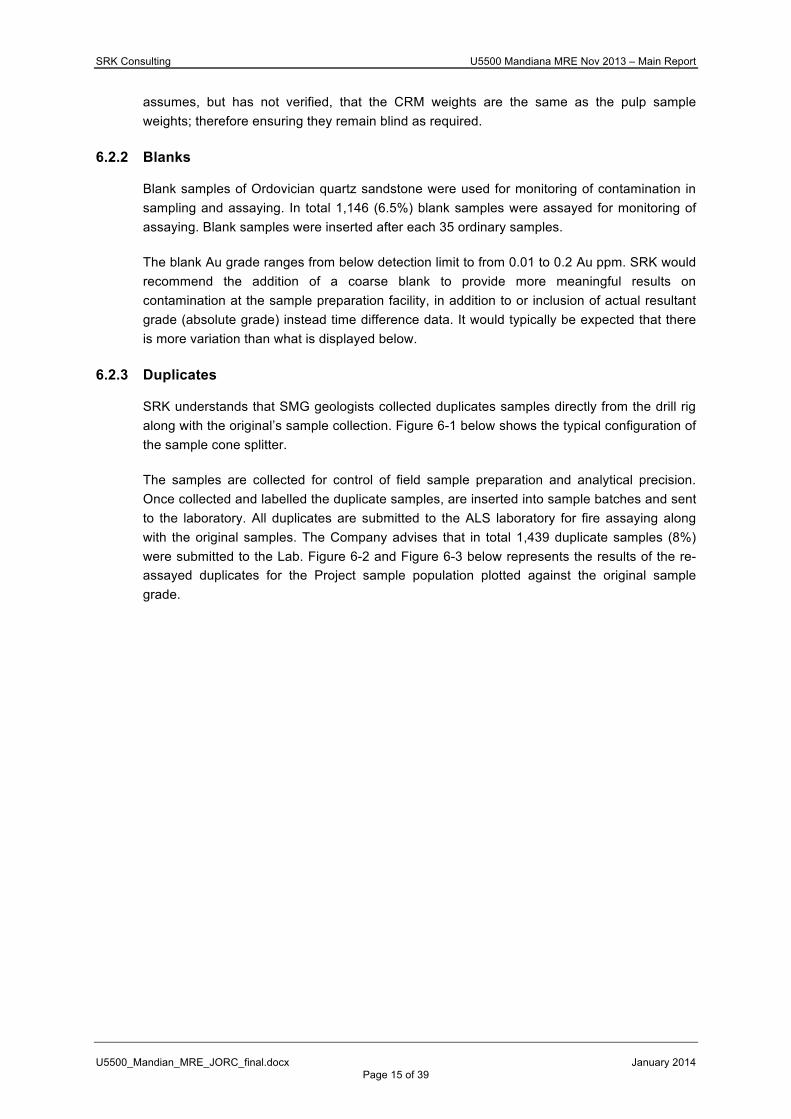
6.2.3 Duplicates
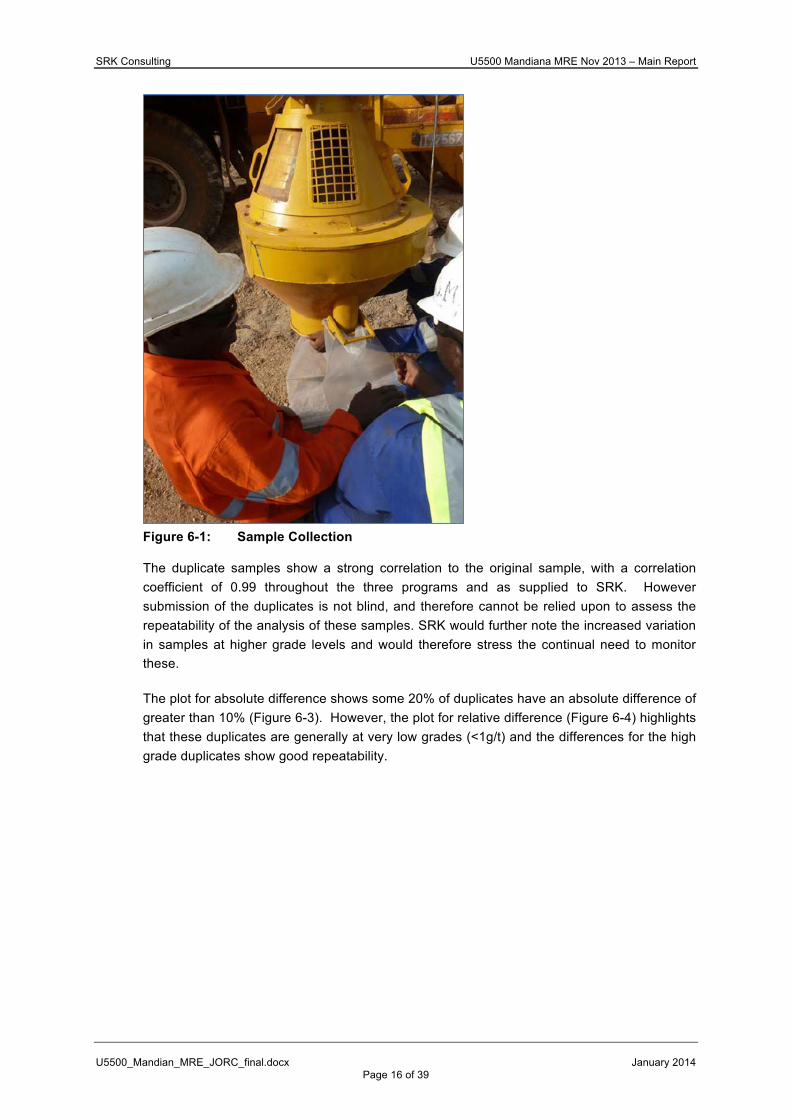
SRK understands that SMG geologists collected duplicates samples directly from the drill rig along with the original’s sample collection. Figure 6-1 below shows the typical configuration of the sample cone splitter.
The samples are collected for control of field sample preparation and analytical precision. Once collected and labelled the duplicate samples, are inserted into sample batches and sent to the laboratory. All duplicates are submitted to the ALS laboratory for fire assaying along with the original samples. The Company advises that in total 1,439 duplicate samples (8%) were submitted to the Lab. Figure 6-2 and Figure 6-3 below represents the results of the re-assayed duplicates for the Project sample population plotted against the original sample grade.
SRK Consulting U5500 Mandiana MRE Nov 2013 – Main Report
U5500_Mandian_MRE_JORC_final.docx January 2014 Page 16 of 39
Figure 6-1: Sample Collection
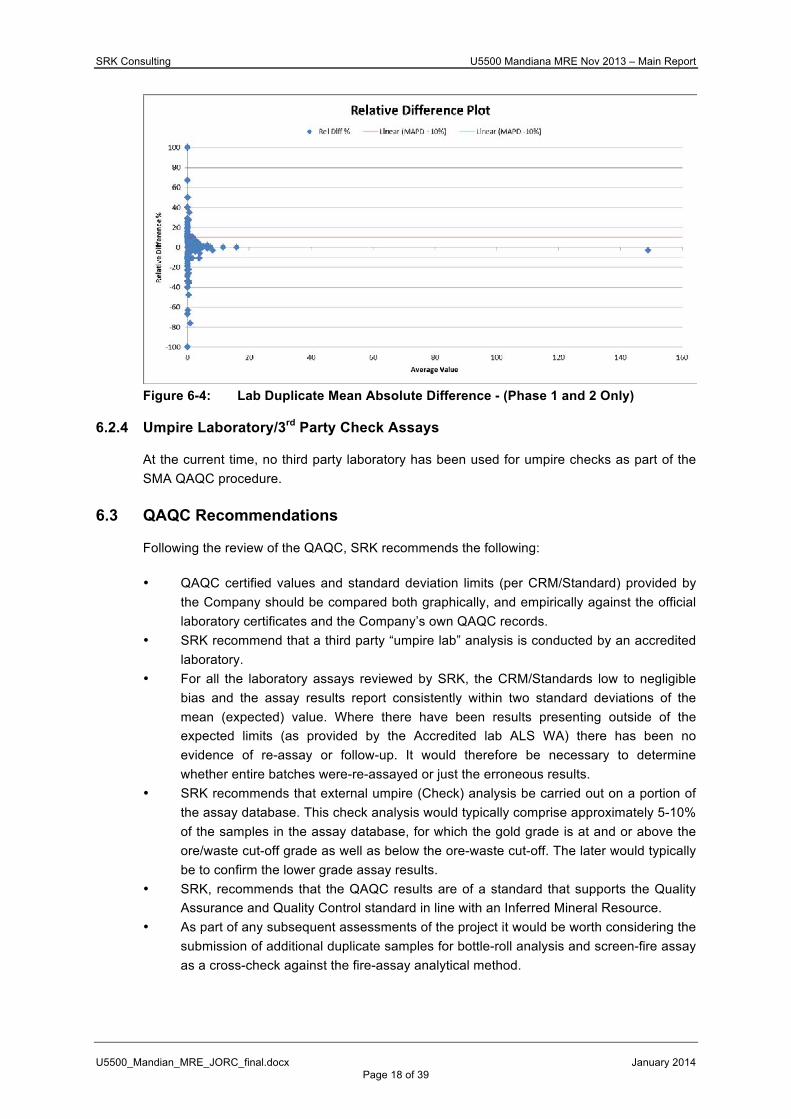
The duplicate samples show a strong correlation to the original sample, with a correlation coefficient of 0.99 throughout the three programs and as supplied to SRK. However submission of the duplicates is not blind, and therefore cannot be relied upon to assess the repeatability of the analysis of these samples. SRK would further note the increased variation in samples at higher grade levels and would therefore stress the continual need to monitor these.
The plot for absolute difference shows some 20% of duplicates have an absolute difference of greater than 10% (Figure 6-3). However, the plot for relative difference (Figure 6-4) highlights that these duplicates are generally at very low grades (<1g/t) and the differences for the high grade duplicates show good repeatability.

SRK Consulting U5500 Mandiana MRE Nov 2013 – Main Report
U5500_Mandian_MRE_JORC_final.docx January 2014 Page 17 of 39
Figure 6-2: Duplicate vs. Original Au Assay (Phase 1, 2, and 3)
Figure 6-3: Lab Duplicate Mean Absolute Difference (%) (Phase 1 and 2 Only)
SRK Consulting U5500 Mandiana MRE Nov 2013 – Main Report
U5500_Mandian_MRE_JORC_final.docx January 2014 Page 18 of 39
Figure 6-4: Lab Duplicate Mean Absolute Difference - (Phase 1 and 2 Only)
6.2.4 Umpire Laboratory/3rd Party Check Assays
At the current time, no third party laboratory has been used for umpire checks as part of the SMA QAQC procedure.
6.3 QAQC Recommendations
Following the review of the QAQC, SRK recommends the following:
• QAQC certified values and standard deviation limits (per CRM/Standard) provided by the Company should be compared both graphically, and empirically against the official laboratory certificates and the Company’s own QAQC records.
• SRK recommend that a third party “umpire lab” analysis is conducted by an accredited laboratory.
• For all the laboratory assays reviewed by SRK, the CRM/Standards low to negligible bias and the assay results report consistently within two standard deviations of the mean (expected) value. Where there have been results presenting outside of the expected limits (as provided by the Accredited lab ALS WA) there has been no evidence of re-assay or follow-up. It would therefore be necessary to determine whether entire batches were-re-assayed or just the erroneous results.
• SRK recommends that external umpire (Check) analysis be carried out on a portion of the assay database. This check analysis would typically comprise approximately 5-10% of the samples in the assay database, for which the gold grade is at and or above the ore/waste cut-off grade as well as below the ore-waste cut-off. The later would typically be to confirm the lower grade assay results.
• SRK, recommends that the QAQC results are of a standard that supports the Quality Assurance and Quality Control standard in line with an Inferred Mineral Resource.
• As part of any subsequent assessments of the project it would be worth considering the submission of additional duplicate samples for bottle-roll analysis and screen-fire assay as a cross-check against the fire-assay analytical method.

SRK Consulting U5500 Mandiana MRE Nov 2013 – Main Report
U5500_Mandian_MRE_JORC_final.docx January 2014 Page 19 of 39
7 MINERAL RESOURCE ESTIMATION
7.1 Database Integrity
All data collected through the SMG logging and sampling process is though paper copy and later transcribed into an excel spread sheets. The Company advise that this dataset is visually interrogated and validated on site both the geologist responsible for collecting the relevant data and also by the supervising geologist before being sent off site for full validation and incorporation into the master data sheet (again in excel).
SRK has undertaken a brief random cross-check of the electronic data against the original assay laboratory certificates and found no material discrepancies. However, it is recommended that the database is compiled in completeness so that all Phases (Phase 1, 2 3 and any on-going programs) are all represented in a “Master Database”. SRK notes, that excel is not considered a database.
7.2 Site Visits
Mr Martin Pittuck and Mr Oliver Jones of SRK (UK) visited the project site between 29 April and 3 May, 2013. This provided an opportunity to observe the Phase 3 drilling in progress and to review the geological logging and interpretation and also to audit and verify the sample collection and preparation protocols. During the site visits the modelling of the deposit was discussed with the on-site geological staff allowing a degree of feedback to the process.
7.3 Geological Interpretation
The geological modelling is based on the site based geological and structural modelling produced by the SMA geological team. Interpretation is based on level plans and cross sections produced manually along drill lines with subsequent digitising of major structures and deposit boundaries and contacts. The digitised sections were then imported, in conjunction with the available grade assay data, to the Leapfrog™ software package which is a tool for 3D modelling and rendering of all available data to produce a series of wireframe domains which are appropriately informed by the available data and can subsequently be used to form the basis for the Mineral Resource estimate. Figure 7-1 is a 3D representation of the four separate mineralised domains, modelled by SRK, and within which the Mineral Resource Estimate is defined.
The Damantere deposit is currently sparsely drilled and the resulting structure is relatively simple with only a single domain modelled striking north (440m strike length) and dipping to the east at 35°. Woyondjan, while also relatively sparsely drilled is modelled with a number of separate structures based on an updated sectional interpretation provided by SMA in October 2013. The general trend is along a strike of 310° (740m strike length) with a dip to the north-east of between 65-85°.

SRK Consulting U5500 Mandiana MRE Nov 2013 – Main Report
U5500_Mandian_MRE_JORC_final.docx January 2014 Page 20 of 39
The Yagbelen and Foulouni deposits are interpreted to coalesce at the northern end of the current models. The Foulouni deposit is considered to be occupying a major structure with the Yagbelen deposit forming a splay in the hangingwall of this structure. Foulouni strikes towards 350° (1,050m strike length) and dips steeply to the east at 80°. Yagbelen is modelled as a series of sub-parallel and anastomosing strucutures which pinch and swell both along strike and in dip with a general strike to the north-west at 310-320° (strike length of approximately 1,300m) and a dip of approximately 65° east.
Damantere is modelled to a maximum vertical depth of 110m. Foulouni and Yagbelen are the most extensively drilled and have been modelled to a vertical depth of 260m. Woyondjan has been modelled with a varying depth of the individual units of between 120-230m vertically. The extensive weathering at all these domains is particularly emphasised in these wide, multi-unit zones of mineralisation with traces of oxidation visible in material from up to 200m depth. The logged lithological dexcriptions show a change from saprolite to saprock occurring at depths of between 150-200m in many of the domains and a commensurate increase in density from around 1.8 to approximately 2.2t/m3.
Figure 7-1: Relative location of the four modelled domains constituting the 2013
Mineral Resource estimate at Mandiana (XY coordinate spacing =100m).
SRK Consulting U5500 Mandiana MRE Nov 2013 – Main Report
U5500_Mandian_MRE_JORC_final.docx January 2014 Page 21 of 39
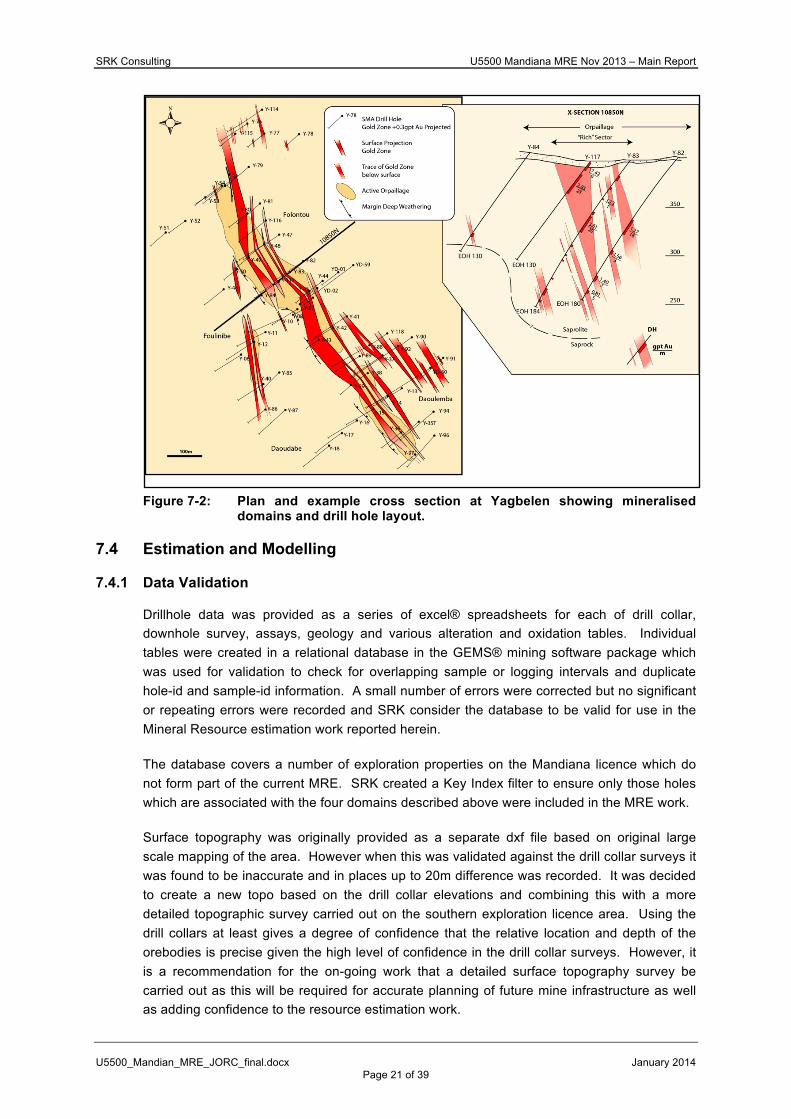
Figure 7-2: Plan and example cross section at Yagbelen showing mineralised
domains and drill hole layout.
7.4 Estimation and Modelling
7.4.1 Data Validation
Drillhole data was provided as a series of excel® spreadsheets for each of drill collar, downhole survey, assays, geology and various alteration and oxidation tables. Individual tables were created in a relational database in the GEMS® mining software package which was used for validation to check for overlapping sample or logging intervals and duplicate hole-id and sample-id information. A small number of errors were corrected but no significant or repeating errors were recorded and SRK consider the database to be valid for use in the Mineral Resource estimation work reported herein.
The database covers a number of exploration properties on the Mandiana licence which do not form part of the current MRE. SRK created a Key Index filter to ensure only those holes which are associated with the four domains described above were included in the MRE work.
Surface topography was originally provided as a separate dxf file based on original large scale mapping of the area. However when this was validated against the drill collar surveys it was found to be inaccurate and in places up to 20m difference was recorded. It was decided to create a new topo based on the drill collar elevations and combining this with a more detailed topographic survey carried out on the southern exploration licence area. Using the drill collars at least gives a degree of confidence that the relative location and depth of the orebodies is precise given the high level of confidence in the drill collar surveys. However, it is a recommendation for the on-going work that a detailed surface topography survey be carried out as this will be required for accurate planning of future mine infrastructure as well as adding confidence to the resource estimation work.

SRK Consulting U5500 Mandiana MRE Nov 2013 – Main Report
U5500_Mandian_MRE_JORC_final.docx January 2014 Page 22 of 39
7.4.2 Statistics
The average sample length is close to 1m and a 1m composite length was chosen. The statistics for the individual domains are summarised in the following table and figures. Declustering of the data for Damantere and Foulouni was inconclusive given the relatively sparse data in these domains. At Yagbelen and Woyondjan the declustering indicated a small drop in grade and variance but was not considered material and it was decided to use the unweighted data for semi-variogram analysis.
Table 7-1: Basic 1m composite statistics for the domains at Mandiana Domain Count Maximum Mean Variance
Damantere 138 38.97 0.83 15.7 Foulouni 216 25.24 0.75 5.6 Yagbelen 1846 147.0 1.15 36.1
Woyondjan 735 48.92 0.77 7.4 total 2935 147.0 1.01 25.7
Figure 7-3 shows the histograms obtained for each of the four domains after compositing to 1m. the histograms are presented on a log scale in order to better show the overlal shape of the distribution. While not a true log normal distribution it is clear that the wireframe models are encapsulating appropriate data distributions for the style of mineralisation seen at Mandiana.
There is some evidence in the histograms for the presence of grade sub-populations at both he low grade and high grade extremes. However, the number of composites within these is low and it is not considered feasible to try and model these as separate domains.
Overall the grade distribution between the four deposits is similar. The higher average grade in the Yagbelen deposit is due to a small number of very high grade composites occurring at the north end of this deposit which is helping to elevate the average grade. There is evidence for a plunging trend of higher grade material in this area and further drilling is required to confirm the continuity of this zone.

SRK Consulting U5500 Mandiana MRE Nov 2013 – Main Report
U5500_Mandian_MRE_JORC_final.docx January 2014 Page 23 of 39
Domain Log histogram Log QQ plot
Damantere
Foulouni
Yagbelen
Woyondjan
Figure 7-3: Log histograms and QQ (quantile) plots for the four domains at Mandiana

SRK Consulting U5500 Mandiana MRE Nov 2013 – Main Report
U5500_Mandian_MRE_JORC_final.docx January 2014 Page 24 of 39
7.4.3 Variogram modelling
The following tables and graphics summarise the results of the variography analysis for each of the four principle domains at Mandiana.
The semi-variograms are modelled initially using a Pairwise Relative transformation. This provides a normal score transform to force the data to fit to a normal distribution and thus provide a more robust basis for the variogram shape to aid modelling. Following completion of the analysis the resulting model is then back transformed to the original data distribution for kriging.
Prior to construction of the experimental variograms the “plane” of the individual deposits was calculated from the composites and wireframes and directional variograms were constructed on this plane in an attempt to establish the presence of any directional anisotropy within the individual deposits. A key feature of many shear zone hosted deposits is the presence of narrow, plunging ore shoots which are not always apparent from initial near surface sampling and mapping. However, the relatively widely spaced drilling on these deposits largely precludes the construction of reliable variograms in any directions other than the principle along strike and down dip directions.
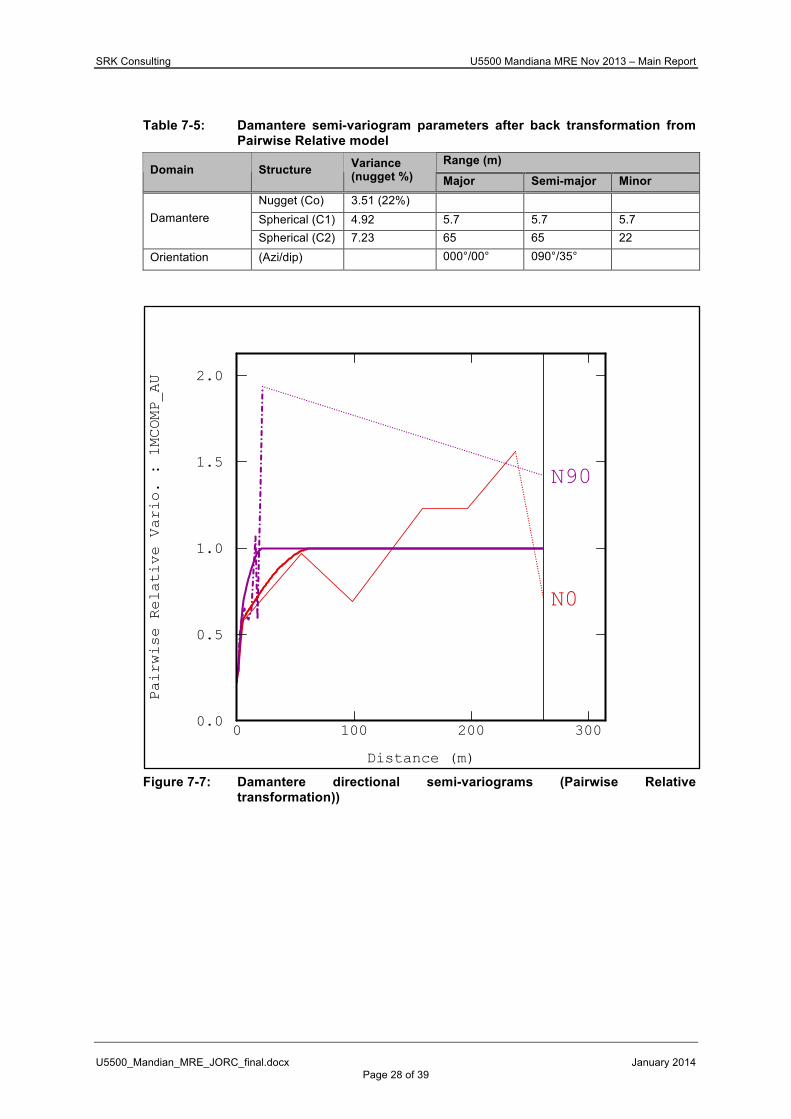
As a first step the downhole variogram (minor orientation) was modelled in order to obtain a reliable nugget variance which could then be applied to the directional variograms. The nugget variance varies from 22 to 40% of the total variance of the variograms which is considered fair for deposits of this type at this level of drilling. For the directional variograms a lag distance of 50m was chosen which closely corresponds to the drill spacing on the majority of the site. However as a result the quality of the variograms is poor with noisy or pure nugget effect observed at low lags. Woyondjan and Damantere, in particular, have poorly defined variograms.
The results for Yagbelen and Foulouni, however, are encouraging, with ranges of between 70-120m recorded and clear indications of directional anisotropy and plunging zones of greater continuity. It is envisaged that with closer spaced infill drilling the quality of the variography for these deposits could be significantly improved.
SRK Consulting U5500 Mandiana MRE Nov 2013 – Main Report
U5500_Mandian_MRE_JORC_final.docx January 2014 Page 25 of 39
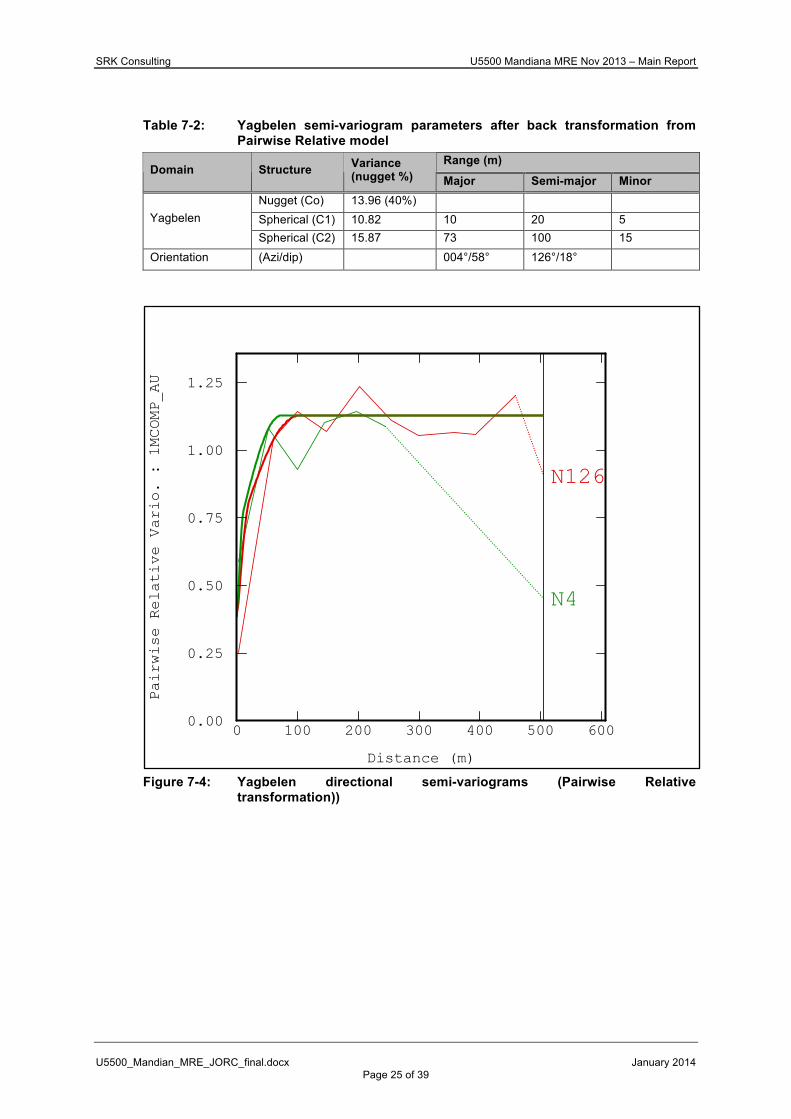
Table 7-2: Yagbelen semi-variogram parameters after back transformation from Pairwise Relative model
Range (m) Domain Structure Variance
(nugget %) Major Semi-major Minor Nugget (Co) 13.96 (40%) Spherical (C1) 10.82 10 20 5 Yagbelen
Spherical (C2) 15.87 73 100 15 Orientation (Azi/dip) 004°/58° 126°/18°
Figure 7-4: Yagbelen directional semi-variograms (Pairwise Relative
transformation))

SRK Consulting U5500 Mandiana MRE Nov 2013 – Main Report
U5500_Mandian_MRE_JORC_final.docx January 2014 Page 26 of 39
Table 7-3: Foulouni semi-variogram parameters after back transformation from Pairwise Relative model
Range (m) Domain Structure Variance
(nugget %) Major Semi-major Minor Nugget (Co) 1.79 (32%) Spherical (C1) 1.34 16 16 2 Foulouni
Spherical (C2) 2.23 85 120 6 Orientation (Azi/dip) 163°/36° 003°/53°
Figure 7-5: Foulouni directional semi-variograms (Pairwise Relative
transformation))

SRK Consulting U5500 Mandiana MRE Nov 2013 – Main Report
U5500_Mandian_MRE_JORC_final.docx January 2014 Page 27 of 39
Table 7-4: Woyondjan semi-variogram parameters after back transformation from Pairwise Relative model
Range (m) Domain Structure Variance
(nugget %) Major Semi-major Minor Nugget (Co) 2.13 (30%) Spherical (C1) 2.35 10 16 7 Woyondjan
Spherical (C2) 4.57 161 81 14 Orientation (Azi/dip) 354°/53° 153°/35°
Figure 7-6: Woyondjan directional semi-variograms (Pairwise Relative
transformation))
SRK Consulting U5500 Mandiana MRE Nov 2013 – Main Report
U5500_Mandian_MRE_JORC_final.docx January 2014 Page 28 of 39
Table 7-5: Damantere semi-variogram parameters after back transformation from Pairwise Relative model
Range (m) Domain Structure Variance
(nugget %) Major Semi-major Minor Nugget (Co) 3.51 (22%) Spherical (C1) 4.92 5.7 5.7 5.7 Damantere
Spherical (C2) 7.23 65 65 22 Orientation (Azi/dip) 000°/00° 090°/35°
Figure 7-7: Damantere directional semi-variograms (Pairwise Relative
transformation))

SRK Consulting U5500 Mandiana MRE Nov 2013 – Main Report
U5500_Mandian_MRE_JORC_final.docx January 2014 Page 29 of 39
7.4.4 Grade Block Modelling
Grade was estimated into a series of large blocks (panels) using Ordinary Kriging (OK). The panel size is 25 m x 25 m x 25 m (XYZ). High grades were not capped in the database, however a 30g/t cap was used to restrict the influence of any values of greater than 30g/t to a 20 m search radius during the kriging process.
The following tables summarise the search parameters used for the interpolation of the four domains. The principle search was based on roughly the modelled semi-variogram ranges in each of the three principle directions with orientations based on the direction of maximum reliability on the plane of the mineralisation.
Table 7-6: Yagbelen Ordinary Kriging search parameters
Direction Initial Search (m)
Infill Search (m) Azimuth Dip
Major 100 1000 126° 18° Semi-Major 80 1000 004° 58°
Minor 10 40 194° 32° Min comps 8 2 Max comps 24 24
Descritization 5x5x5 5x5x5 Octants 1 1
Grade Capping 30g/t@20m 30g/t@20m
Table 7-7: Foulouni Ordinary Kriging search parameters
Table 7-8: Woyondjan Ordinary Kriging search parameters
Direction Initial Search (m)
Infill Search (m) Azimuth Dip
Major 80 1000 340° 00° Semi-Major 80 1000 070° 80°
Minor 10 40 250° 10° Min comps 8 2 Max comps 24 24
Descritization 5x5x5 5x5x5 Octants 1 1
Grade Capping 30g/t@20m 30g/t@20m
Direction Initial Search (m)
Infill Search (m) Azimuth Dip
Major 100 1000 003° 53° Semi-Major 80 1000 163° 36°
Minor 10 50 343° 54° Min comps 8 2 Max comps 24 24
Descritization 5x5x5 5x5x5 Octants 1 1 Grade Capping 30g/t@20m 30g/t@20m

SRK Consulting U5500 Mandiana MRE Nov 2013 – Main Report
U5500_Mandian_MRE_JORC_final.docx January 2014 Page 30 of 39
Table 7-9: Damantere Ordinary Kriging search parameters
Direction Initial Search (m)
Infill Search (m) Azimuth Dip
Major 500 000° 00° Semi-Major 500 090° 35°
Minor 50 270° 55° Min comps 2 Max comps 24
Descritization 5x5x5 Octants 1
Grade Capping 30g/t@20m
7.4.5 Grade Tonnage Curves
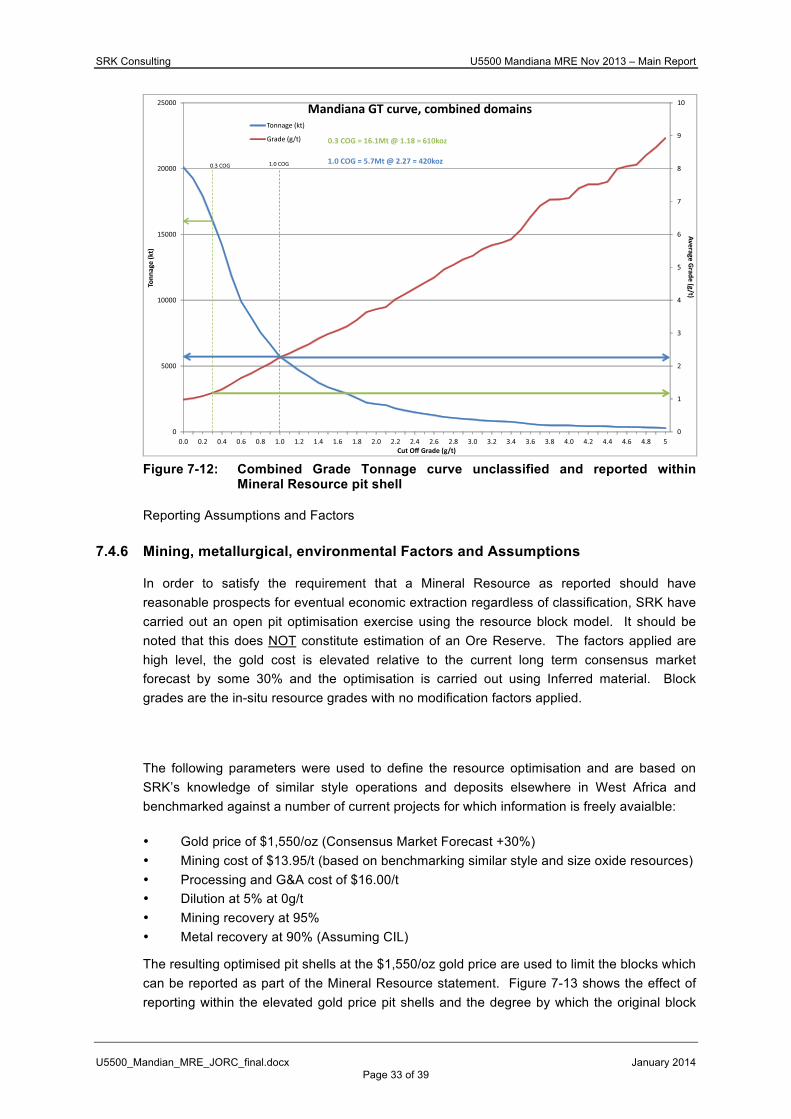
The following figures show the grade tonnage curves derived from the Mineral Resource block model and reported for the individual domains (Figure 7-11 to Figure 7-10) and for the total Mineral Resource (Figure 7-12).
The Yagbelen, Foulouni and Woyondjan deposits exhibit a fairly steep tonnage and grade curve over the range of low to high cut offs currently being looked at by the company (0.3-1.0g/t) indicating a degree of sensitivity to the final cut off applied to the model. The Damantere deposit has a relatively flat GT profile and is not considered sensitive although at this stage this deposit accounts for only a small percentage of the total gold (<3%).
Figure 7-8: Yagbelen Grade Tonnage curve unclassified and reported within Mineral
Resource pit shell

SRK Consulting U5500 Mandiana MRE Nov 2013 – Main Report
U5500_Mandian_MRE_JORC_final.docx January 2014 Page 31 of 39
Figure 7-9: Foulouni Grade Tonnage curve unclassified and reported within Mineral
Resource pit shell
Figure 7-10: Woyondjan Grade Tonnage curve unclassified and reported within
Mineral Resource pit shell

SRK Consulting U5500 Mandiana MRE Nov 2013 – Main Report
U5500_Mandian_MRE_JORC_final.docx January 2014 Page 32 of 39
Figure 7-11: Damantere Grade Tonnage curve unclassified and reported within
Mineral Resource pit shell
Table 7-10 shows the detailed breakdown for the combined deposits at various cut off grades which is reflected in Figure 7-12
Table 7-10: Grade Tonnage table for the combined Mandiana deposits highlighting the potential for high grade resource to be delineated.
COG Density Tonnage Grade Gold (g/t) (T/m3) (Kt) (g/t) (K.Oz) 4.0 2.18 497 7.10 113 3.5 2.18 687 6.14 136 3.0 2.16 945 5.35 163 2.5 2.15 1,371 4.53 200 2.0 2.16 2,108 3.73 253 1.5 2.18 3,394 2.97 324 1.0 2.20 5,718 2.27 417 0.3 2.17 16,096 1.18 612 0.0 2.16 20,096 0.98 635
SRK Consulting U5500 Mandiana MRE Nov 2013 – Main Report
U5500_Mandian_MRE_JORC_final.docx January 2014 Page 33 of 39
Figure 7-12: Combined Grade Tonnage curve unclassified and reported within
Mineral Resource pit shell
Reporting Assumptions and Factors
7.4.6 Mining, metallurgical, environmental Factors and Assumptions
In order to satisfy the requirement that a Mineral Resource as reported should have reasonable prospects for eventual economic extraction regardless of classification, SRK have carried out an open pit optimisation exercise using the resource block model. It should be noted that this does NOT constitute estimation of an Ore Reserve. The factors applied are high level, the gold cost is elevated relative to the current long term consensus market forecast by some 30% and the optimisation is carried out using Inferred material. Block grades are the in-situ resource grades with no modification factors applied.
The following parameters were used to define the resource optimisation and are based on SRK’s knowledge of similar style operations and deposits elsewhere in West Africa and benchmarked against a number of current projects for which information is freely avaialble:
• Gold price of $1,550/oz (Consensus Market Forecast +30%) • Mining cost of $13.95/t (based on benchmarking similar style and size oxide resources) • Processing and G&A cost of $16.00/t • Dilution at 5% at 0g/t • Mining recovery at 95% • Metal recovery at 90% (Assuming CIL)
The resulting optimised pit shells at the $1,550/oz gold price are used to limit the blocks which can be reported as part of the Mineral Resource statement. Figure 7-13 shows the effect of reporting within the elevated gold price pit shells and the degree by which the original block
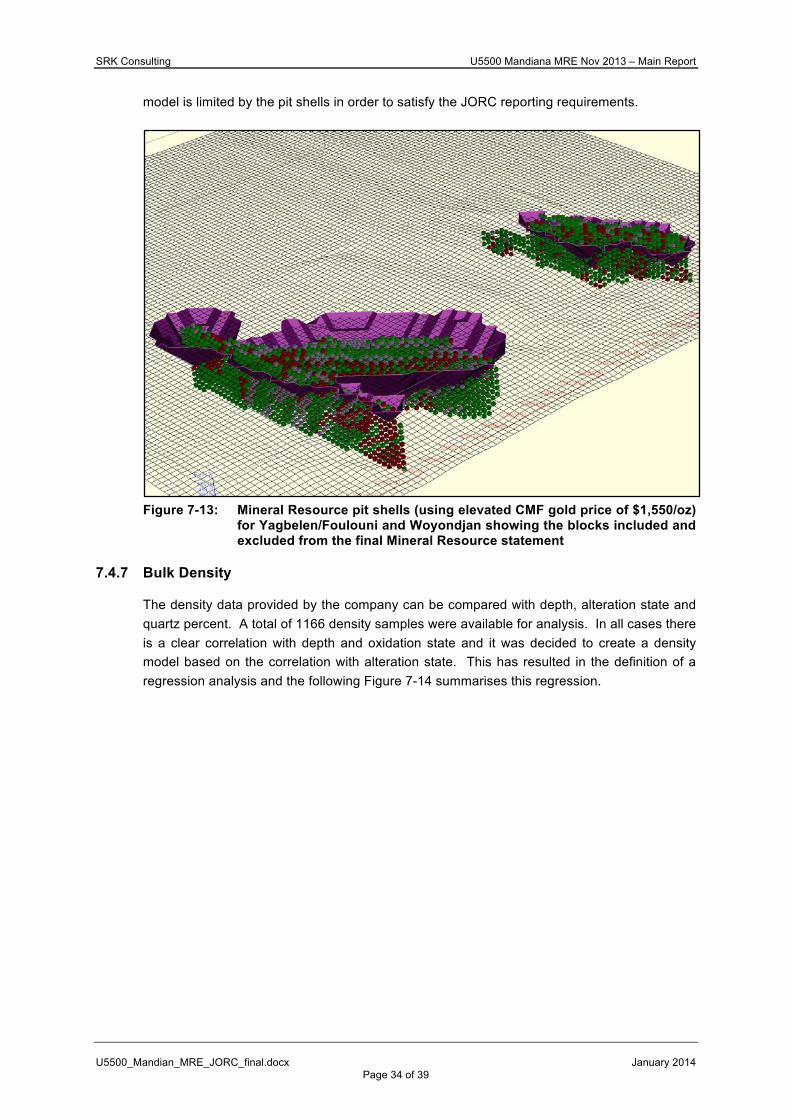
SRK Consulting U5500 Mandiana MRE Nov 2013 – Main Report
U5500_Mandian_MRE_JORC_final.docx January 2014 Page 34 of 39
model is limited by the pit shells in order to satisfy the JORC reporting requirements.
Figure 7-13: Mineral Resource pit shells (using elevated CMF gold price of $1,550/oz)
for Yagbelen/Foulouni and Woyondjan showing the blocks included and excluded from the final Mineral Resource statement
7.4.7 Bulk Density
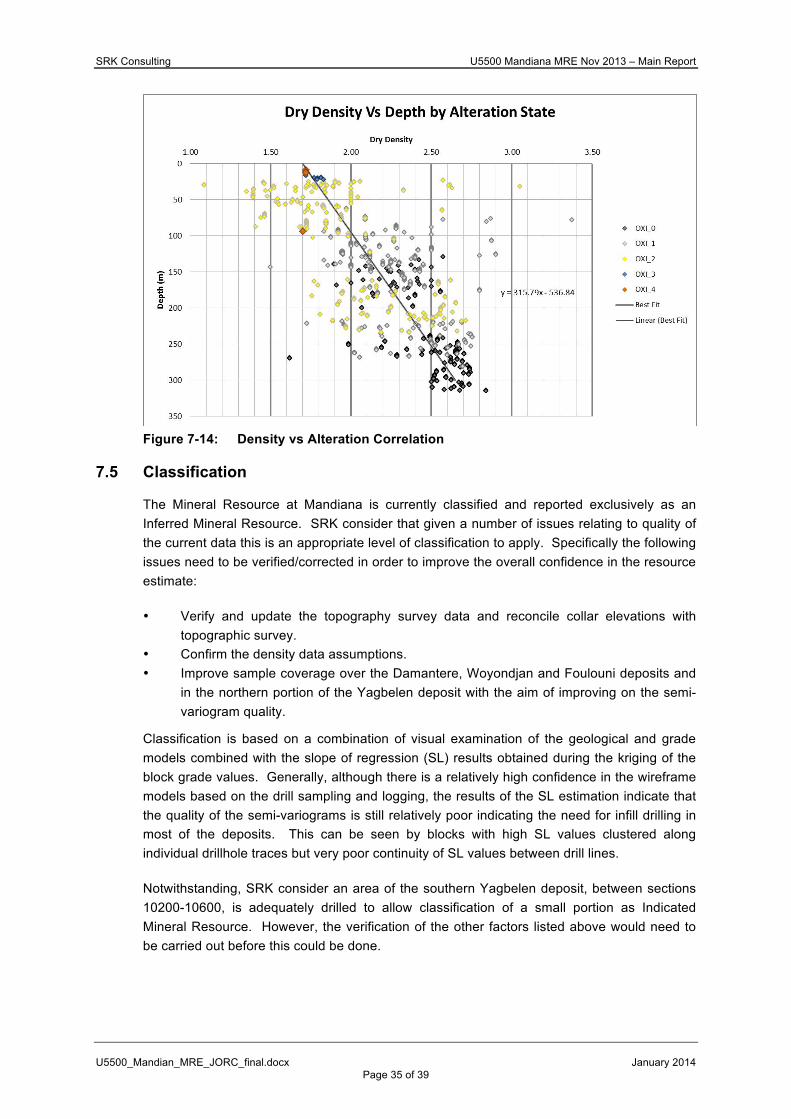
The density data provided by the company can be compared with depth, alteration state and quartz percent. A total of 1166 density samples were available for analysis. In all cases there is a clear correlation with depth and oxidation state and it was decided to create a density model based on the correlation with alteration state. This has resulted in the definition of a regression analysis and the following Figure 7-14 summarises this regression.
SRK Consulting U5500 Mandiana MRE Nov 2013 – Main Report
U5500_Mandian_MRE_JORC_final.docx January 2014 Page 35 of 39
Figure 7-14: Density vs Alteration Correlation
7.5 Classification
The Mineral Resource at Mandiana is currently classified and reported exclusively as an Inferred Mineral Resource. SRK consider that given a number of issues relating to quality of the current data this is an appropriate level of classification to apply. Specifically the following issues need to be verified/corrected in order to improve the overall confidence in the resource estimate:
• Verify and update the topography survey data and reconcile collar elevations with topographic survey.
• Confirm the density data assumptions. • Improve sample coverage over the Damantere, Woyondjan and Foulouni deposits and
in the northern portion of the Yagbelen deposit with the aim of improving on the semi-variogram quality.
Classification is based on a combination of visual examination of the geological and grade models combined with the slope of regression (SL) results obtained during the kriging of the block grade values. Generally, although there is a relatively high confidence in the wireframe models based on the drill sampling and logging, the results of the SL estimation indicate that the quality of the semi-variograms is still relatively poor indicating the need for infill drilling in most of the deposits. This can be seen by blocks with high SL values clustered along individual drillhole traces but very poor continuity of SL values between drill lines.
Notwithstanding, SRK consider an area of the southern Yagbelen deposit, between sections 10200-10600, is adequately drilled to allow classification of a small portion as Indicated Mineral Resource. However, the verification of the other factors listed above would need to be carried out before this could be done.
SRK Consulting U5500 Mandiana MRE Nov 2013 – Main Report
U5500_Mandian_MRE_JORC_final.docx January 2014 Page 36 of 39
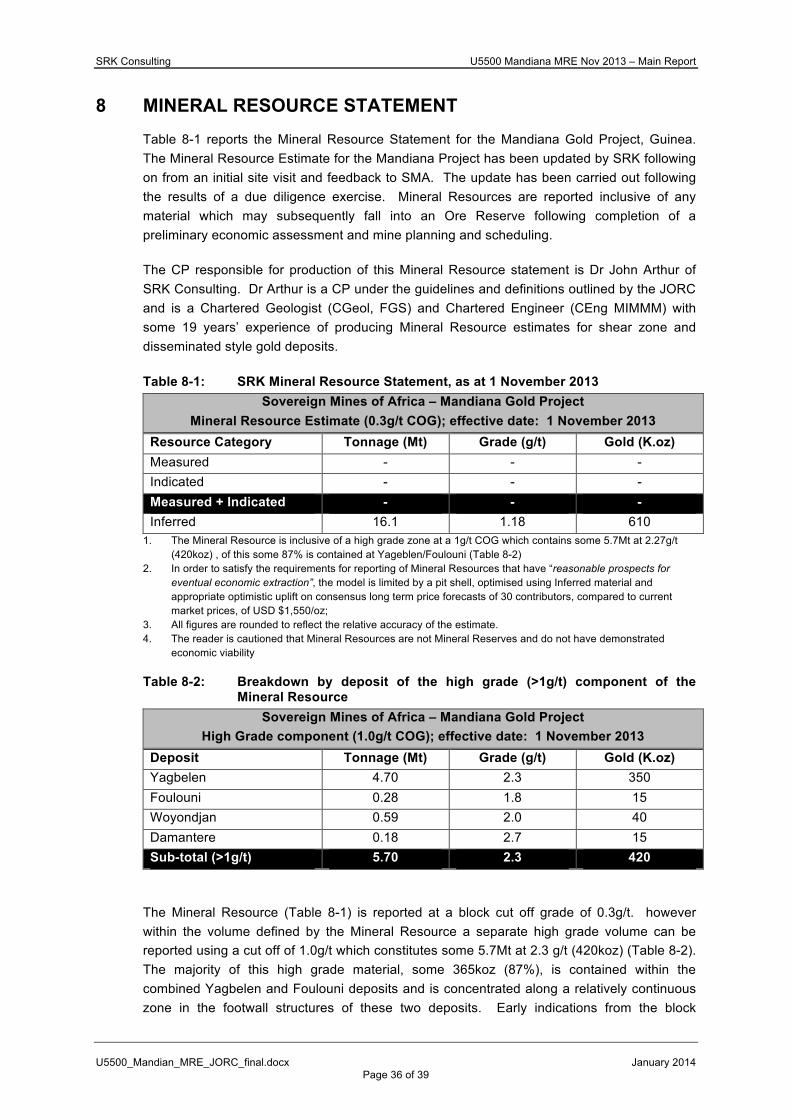
8 MINERAL RESOURCE STATEMENT Table 8-1 reports the Mineral Resource Statement for the Mandiana Gold Project, Guinea. The Mineral Resource Estimate for the Mandiana Project has been updated by SRK following on from an initial site visit and feedback to SMA. The update has been carried out following the results of a due diligence exercise. Mineral Resources are reported inclusive of any material which may subsequently fall into an Ore Reserve following completion of a preliminary economic assessment and mine planning and scheduling.
The CP responsible for production of this Mineral Resource statement is Dr John Arthur of SRK Consulting. Dr Arthur is a CP under the guidelines and definitions outlined by the JORC and is a Chartered Geologist (CGeol, FGS) and Chartered Engineer (CEng MIMMM) with some 19 years’ experience of producing Mineral Resource estimates for shear zone and disseminated style gold deposits.
Table 8-1: SRK Mineral Resource Statement, as at 1 November 2013 Sovereign Mines of Africa – Mandiana Gold Project
Mineral Resource Estimate (0.3g/t COG); effective date: 1 November 2013 Resource Category Tonnage (Mt) Grade (g/t) Gold (K.oz) Measured - - - Indicated - - - Measured + Indicated - - - Inferred 16.1 1.18 610
1. The Mineral Resource is inclusive of a high grade zone at a 1g/t COG which contains some 5.7Mt at 2.27g/t (420koz) , of this some 87% is contained at Yageblen/Foulouni (Table 8-2)
2. In order to satisfy the requirements for reporting of Mineral Resources that have “reasonable prospects for eventual economic extraction”, the model is limited by a pit shell, optimised using Inferred material and appropriate optimistic uplift on consensus long term price forecasts of 30 contributors, compared to current market prices, of USD $1,550/oz;
3. All figures are rounded to reflect the relative accuracy of the estimate. 4. The reader is cautioned that Mineral Resources are not Mineral Reserves and do not have demonstrated
economic viability
Table 8-2: Breakdown by deposit of the high grade (>1g/t) component of the Mineral Resource
Sovereign Mines of Africa – Mandiana Gold Project High Grade component (1.0g/t COG); effective date: 1 November 2013
Deposit Tonnage (Mt) Grade (g/t) Gold (K.oz) Yagbelen 4.70 2.3 350 Foulouni 0.28 1.8 15 Woyondjan 0.59 2.0 40 Damantere 0.18 2.7 15 Sub-total (>1g/t) 5.70 2.3 420
The Mineral Resource (Table 8-1) is reported at a block cut off grade of 0.3g/t. however within the volume defined by the Mineral Resource a separate high grade volume can be reported using a cut off of 1.0g/t which constitutes some 5.7Mt at 2.3 g/t (420koz) (Table 8-2). The majority of this high grade material, some 365koz (87%), is contained within the combined Yagbelen and Foulouni deposits and is concentrated along a relatively continuous zone in the footwall structures of these two deposits. Early indications from the block

SRK Consulting U5500 Mandiana MRE Nov 2013 – Main Report
U5500_Mandian_MRE_JORC_final.docx January 2014 Page 37 of 39
modelling indicate there is a degree of continuity for these high grade hosting structures at Yagbelen/Foulouni which has potential for establishing small scale high grade production scenarios from this material. This is shown graphically for Foulouni and Yagbelen in Figure 8-1.
Figure 8-1: 3D isometric view of the combined Foulouni and Yagbelen deposits
showing the block grade distribution at >0.3g/t (upper) and >1.0g/t (lower) showing the relatively good continuity of the higher grade zones.

SRK Consulting U5500 Mandiana MRE Nov 2013 – Main Report
U5500_Mandian_MRE_JORC_final.docx January 2014 Page 38 of 39
9 CONCLUSIONS AND RECOMMENDATIONS The Mandiana project is at an early stage however a significant amount of detailed work has led to the identification and delineation of at least four deposits with potential for future economic extraction of gold by open pit mining methods. Of the four, the combined Yagbelen and Foulouni deposits, where drilling was focussed for the most part, currently show the best prospects for production at current mining and revenue assumptions. However the current density of drilling and level of study is such that the Mineral resources can only be classified as inferred under international reporting guidelines.
SRK consider the approach taken by SMG to concentrate on these four deposits at this early stage is appropriate and recommends that, in order to bring the project up to a higher level of understanding and confidence such that a preliminary economic assessment or scoping study, leading to an eventual pre-feasibility study could be produced, a number of recommendations are listed here:
1. Improve quality and coverage of the topographic survey data to bring it in line with the detailed survey of the drill collars;
2. Carry out additional quality assurance-quality control (QAQC) checks, specifically use of an umpire laboratory as a check against the current laboratory results;
3. Confirm current CRM’s are representative of the average grade and style of mineralisation encountered at Mandiana;
4. Carry out initial low key metallurgical testwork by identifying approximately 30 samples covering a range of grades representative of the grade and weathering profile at Mandiana. At this stage the samples should probably be sourced from the Yagbelen deposit from 9 holes covering three drill sections (3 samples per hole). Testwork can be carried out by standard BLEG analysis on a 24 hour cycle using standard tests from the local certified laboratory. Results from this work can then go forward to assist in designing a more detailed and specific metallurgical testwork sampling campaign.
5. Consider infill drilling, initially at Yagbelen and Foulouni and then moving out to cover Woyondjan and Damantere. Ideally a coverage of 50x50m along strike and down dip with infill to 25x25m in selected areas where potential plunging ore-shoots are identified. There is some evidence for the presence of such shoots at Yagbelen and the Phase 3 drilliing carried out in early 2013 identified the presence of a possible extension to the north which should be followed up.
6. Indications are that there is a high grade component which forms a relatively narrow but continuous domain in the footwall at Yagbelen which has the potential to support small scale exploitation. This should be targeted by any infill drilling and structural studies carried out to determine its continuity and general trend. The location in the footwall should be investigated at the other deposits to ascertain whether such a feature exists in all the deposits.
7. complete an optimised conceptual mine evaluation to confirm there is merit to conducting the more detailed technical and environmental studies required for a PEA or scoping study.
8. Plan and implement a program of rapid soil geochemical sampling on the Mandiana South licence (recently acquired). This could be backed up by limited RAB drilling

SRK Consulting U5500 Mandiana MRE Nov 2013 – Main Report
U5500_Mandian_MRE_JORC_final.docx January 2014 Page 39 of 39
along the southern extension of the Yagbelen deposit to assess potential extension of this deposit.
Early indications are that there is potential for identifying and classifying a portion of the current Mineral Resource at Yagbelen as Indicated with very little additional work required. This provides a degree of confidence that additional areas at Yagbelen and at the other deposits could similarly be upgraded with relatively little additional work.
For and on behalf of SRK Consulting (UK) Limited
John Arthur Principal Consultant (Resource Geology) SRK Consulting (UK) Limited