mineral export and economic growth in india: evidence from var model analysis
TRANSCRIPT

ORIGINAL PAPER
Mineral export and economic growth in India: evidencefrom VAR model analysis
Auro Kumar Sahoo & Naresh Chandra Sahu &
Dukhabandhu Sahoo & Bibhuti Bhusan Pradhan
Received: 8 October 2013 /Accepted: 25 April 2014# Springer-Verlag Berlin Heidelberg 2014
Abstract Mineral resource is one of the important naturalresources of India which contributes to the national incomethrough mineral export earnings and acts as an important inputfor the industrial sector of domestic economy. In this paper, anattempt has been made to explore the dynamic relationshipamongmineral export, economic growth and industrial produc-tion in India over the period from 1981 to 2010. The presentstudy is based on secondary data which is extracted from theReserve Bank of India database on Indian economy. We haveadopted a vector auto regression (VAR) model analysis basedupon impulse response function (IRF) and variance decompo-sition (VD) to find out the relationship among variables. Theresult of IRF suggests that economic growth responses posi-tively to a shock in mining export, whereas industrial produc-tion responses in a negative way. It has been found that miningexport is not contributing at large towards industrial productionof India in the short run, but in the long run, a significant shareof industrial production is caused by mining export. It is alsofound that both industrial production and economic growthexplain for variation in mineral export in India in the long run.
Keywords Mining export . Net national product . VARmodel . Impulse response function . India
JEL classification Q32
Introduction
The long-run dynamics of the relationship between export andeconomic growth has received a considerable attention fromresearchers both in developed and developing countries of theworld. Numbers of studies have focused on finding the causalrelationship between export and economic growth in the con-text of developing countries. Most of the developing countriesof the world are primary sector dependent where a large shareof their export comes from a primary sector which comprisesagriculture, forestry, fishing and mining. India is one of thedeveloping countries of the world which is enriched with hugenatural resource, among which mining resource holds an im-portant position. Indian mineral industry plays a vital role notonly in the domestic economy but also in worldmineral market.
India has experienced a noticeable growth in the mineralproduction both in terms of quantity and value. The Indianmineral sector comprising 87minerals, which includes 4 fuels,10 metallic, 47 non-metallic, 3 atomic and 23 minor minerals.Fuel minerals account for 68 % of total value of mineralproduction which is highest among all types of mineralsproduced in India. In the group of minerals, metallic, minorand non-metallic minerals account for 19, 11 and 2 % of totalvalue of mineral production in India. The details on mineralproduction and mineral export are depicted in Fig. 1 as givenbelow. In the year 2010–11, the index of mineral production(base 1993–94=100) for all minerals (excluding atomic) hasstood at 204.95 points which was 175.96 and 193.36 for theyears 2008–09 and 2009–10, respectively. The total value ofmineral production (including minor minerals but excludingatomic minerals) has showed an increase in about 17 % in theyear 2010–11 as compared to the figure of previous year. In2010–11, the contribution of mining and quarrying sector is2.67 % of the total gross domestic product (GDP) of India(IMY 2011). Similarly, the production of minerals in terms ofvalue is Rs. 2, 32,021 crore (IMY 2011) which shows an
A. K. Sahoo (*) :N. C. Sahu :D. Sahoo :B. B. PradhanSchool of HSS&M, Indian Institute of Technology, Toshali Bhawan,Satya Nagar, Bhubaneswar, Odisha 751007, Indiae-mail: [email protected]
N. C. Sahue-mail: [email protected]
D. Sahooe-mail: [email protected]
B. B. Pradhane-mail: [email protected]
Miner EconDOI 10.1007/s13563-014-0047-7

increase of 17 % as compared to the previous year. The Indianmineral sector is producing various types of minerals whichare not only consumed by the domestic economy but alsoexported to the rest of the world.
India is a leading exporter of mineral and ores to 188countries of the world in the year 2010–11. The total valueof mineral export of India was Rs. 1,740 crore in 1990–91(RBI 2010–11) which rose up to Rs. 1, 65,080 crore in 2010–11 (IMY 2011). Minerals and ores hold a significant place inthe export basket of India. In the year 2010–11, the total valueof export of mineral and ores accounted for 14.45 % of totalvalue of merchandise export of India. In the world mineralproduction, India has a significant position with respect tosome minerals. It holds second position with a contribution of19.1 and 14.3 % of world production of baryte and chromite,respectively. Similarly, Indian mineral sector is holding thirdposition in production of coal and lignite, fourth position inproduction of steel and iron ore and sixth position in theproduction of bauxite and manganese ore in the world.However, export of diamond holds the top position in termsof value generation followed by iron ore, granite and alumina.
Over the years, empirical studies have been made in Indiato find out the relationship between export and economicgrowth. However, no empirical study has been carried out toexplore the relationship between mineral export and economicgrowth in India. The present study empirically tries to find outthe relationship among mineral export, economic growth andindustrial production from 1981 to 2010. The vector autoregression (VAR) technique has been adopted to find out therelationship among variables. The rest of the paper isorganised as follows: ‘Literature review’ briefly explains thereview of existing literature on export-led growth hypothesisand contribution of mining sector towards development,‘Methodology and model specification’ discusses the meth-odology and econometric models adopted for the presentstudy, ‘Results and discussion’ analyses the empirical resultsand ‘Conclusion and policy implication’ concludes the studywith some policy implications.
Literature review
Mining resource and its development dimension is studied bymany researchers, but the study specific to the relationshipbetweenmining export and economic growth is limited.Manystudies have focused on the social and economic impact ofmineral sector. The allocation of resources from manufactur-ing sector to primary sectors during the boom period hasresulted in huge export of primary products. It has led to theappreciation of domestic currency, and as a result of which,both the domestic economy and external sector are disturbed(Williams, 2011). Besides this, the inefficiency in manage-ment and utilisation of resource revenue has hindered the
economic growth process of a resource-abundant country.Gelb (1988) argues that large mineral endowment is a curserather than a blessing for a country which lowers the economicgrowth. The possible reasons for lower economic growth areeconomic and political factors (Gelb 1988; Auty 1993). It isalso found that in the case of mineral-rich countries, economicgrowth can also be slowed down due to trade policy, invest-ment rates, terms of trade volatility, income inequality andbureaucratic inefficiency (Sachs and Warner 1995).
However, many researchers have focused on the impact ofmining on different sections of society. The mining dependenceand its impact towards development have been studied both incase of developed and developing countries. In a study,Papyrakis and Gerlagh (2007) found a negative relation be-tween mining activity and socio economic development in theUSA. On the contrary, studies on Spain and Australia havesupported for improvement in quality of life and socioeconomicdevelopment in the region as a result of large mining activities(Domenech 2008; Hajkowicz et al. 2011). In context of India,Mishra (2009) has found a positive impact of mining towardsfinancial capital and social connection. In addition, they foundthat mining has numerous health hazards and adversely affectsthe natural capital of the study area. Similarly, mining proximityhas been found to improve local employment at the cost ofreduced forest quality and forest benefits and associated withhuman illness (Pattanayak et al. 2010).
Mining is not only associated with local and industrialdevelopment but the mineral export also contributes to nation-al income. The relationship between export and economicgrowth is still an unsolved puzzle. Although many studieshave been undertaken to unravel the phenomenon in general,no specific study has been found focusing on the relationshipbetween mineral export and economic growth. However, theliterature is enriched with studies on export-led growth. Therelationship between export and economic growth is investi-gated by many researchers in context to both developing anddeveloped countries. In the existing literature, direction ofcausation is examined, and the results are found to be mixedin nature. Some of the research supported for the existence ofunidirectional causality from export to growth, popularlyknown as export-led growth. The export-led growth hypoth-esis suggests for the expansion of export and competitivenesswith the foreign countries, improves the allocation of re-sources, technological progress and economies of scale whichcreates a positive environment for different sectors throughspecialised input (Balassa 1978; Krueger 1980; Edwards1998; Ben-David and Loewy 1998).
The relationship among real export, real import and eco-nomic growth is found to have a long-run equilibrium forPakistan, and the multivariate Granger causality suggests fora unidirectional causality from export to output (Shirazi andManap 2005). Similarly, the empirical investigation supportsthe existence of export-led growth based on the result of
A. K. Sahoo et al.

unidirectional causality from export to economic growth(Jordaan and Eita 2007; Ullah et al. 2009). The manufacturingand primary export for Chile is found to affect economicgrowth through increased productivity (Siliverstovs andHerzer 2006). However, some studies disapprove the export-led growth hypothesis which include Jung and Marshall(1985), Ahmad and Kawn (1991) and Sharma andPanagiotidis (2004). The causal link between real export andeconomic growth based on VAR approach is found to have abidirectional causality (Awokuse 2005, 2006). However,Huang and Wang (2007) have found the existence of anexport-led growth for two newly industrialised countriessuch as Korea and Taiwan. Lim et al. (2010) have examinedthe long-run equilibrium relationship between GDP growthand export based on both linear and non-linear cointegrationanalysis. The study has found the existence of a non-linearcointegration in favour of Singapore whereas both linear andnon-linear cointegration for South Korea.
In Indian context, a couple of studies have been undertakenon export-led growth hypothesis. Jung and Marshall (1985)found no causal relationship between real export growth andreal income growth in the case of India. Similarly, the inves-tigation made by Asafu-Adjaye and Chakraborty (1999) andAnwer and Sampath (2001) found no evidence of the exis-tence of export-led growth and no causal relationship betweenexports, real output and import in India. On the contrary,Dhawan and Biswal (1999) investigated the export-led growthhypothesis using a vector auto regression (VAR) model andfound the existence of a long-run equilibrium relationshipamong real GDP, real export and terms of trade. Moreover,the study found a unidirectional causal relationship from GDPand terms of trade to export. In some of the recent studies,unidirectional causality has been found from export to eco-nomic growth which holds the existence of export-led growthin India (Dawson 2005; Singh and Konya 2006; Dash 2009).The empirical study made by Nidugala (2001) supports theexistence of export-led growth in India and found that thegrowth of manufactured export has a significant effect onGDP growth. However, some of the studies found the
existence of bidirectional causality between export and eco-nomic growth (Chandra 2003; M-ud 2004). Mallick (1996),using the time series data for the period of 1950–92 andemploying Engle-Granger cointegration and error correctionmechanism, found a long-run equilibrium relationship be-tween income and export. In addition to this, the study revealsthe presence of growth-led exports in India. Paul Biru andAnupam (2012) have found the presence of export-led growthin India for the liberalisation period whereas no impact ofexport growth on the output growth for the period 1960–2009.After going through the related literature, we are trying toexplore the relationship among Indian mining export, eco-nomic growth and industrial production, based upon the fol-lowing methodology.
Methodology and model specification
The annual time series data on net national product (NNP),mineral export (MINX) and industrial production index (IIP)have been used for the present study. The data are extractedfrom the database on Indian economy, Reserve Bank of India(RBI). The sample period ranges from 1981 to 2010. Allvariables except mineral export value are at a constant 2004base price. Since data on mineral export value is not availableat constant prices, it is deflated by the wholesale price index(WPI) of 2004. All data are converted into the natural loga-rithms for the present analysis. The variable description andtheir specifications for empirical analysis are as follows:
& NNP: net national product at factor cost.& MINX: total value of mineral export from India.& IIP: index of industrial production.
Test of stationarity
Before going for any empirical analysis in time series data, it isa precondition to check the properties of data. The stationarity
Fig. 1 Composition of mineralproduction and export
Mineral export and economic growth in India
properties of data has been checked using Augmented Dickeyand Fuller (1981) procedure which corrects for higher orderserial correlation by using the lagged differenced term as anexplanatory variable.
In addition to the Augmented Dickey Fuller (ADF)test, Perron and Perron (1988) unit root test is used forconfirmation of the stationarity of the variables. ThePhillips and Perron procedure of testing unit root is analternative to the ADF procedure. This procedure is neu-tral on selecting lag length in the ADF procedure, as wellas it controls the problem of heteroscedasticity and serialcorrelation of the error term. Moreover, the Kwiatkowski-Phillips-Schmidt-Shin (KPSS) unit root test as given byKwiatkowski et al. (1992) is used for the conformity ofstationarity of the data.
VAR model specification
VAR model is widely used to examine the dynamicrelationship among variables. The advantage of adoptionof a VAR procedure is that when among the variables,the exact relationship is unknown, and variables aresupposed to be simultaneously determined and consid-ered as endogenous in the system. In accordance to theexisting literature pertaining to export and economicgrowth, the relationship is not unique and found to beversatile. In a system of ‘n’ variables VAR model, eachvariable is explained by both the lagged value of ownand lagged value of other n−1 variables. The VARmodel of our present study could be expressed in amatrix form as given below.
xtytzt
24
35 ¼
β10
β20
β30
24
35þ
a11 ⋯ a1n⋮ ⋱ ⋮a31 ⋯ a3n
24
35
xt−1⋮xt−n
24
35þ
δ11 ⋯ δ1n⋮ ⋱ ⋮δ31 ⋯ δ3n
24
35
yt−1⋮yt−n
24
35þ
ρ11 ⋯ ρ1n⋮ ⋱ ⋮ρ31 ⋯ ρ3n
24
35
zt−1⋮zt−n
24
35þ
ε1tε2tε3t
24
35 ð1Þ
where, xt, yt and zt are endogenous variables that are NNP,MINX and IIP, respectively. The endogenous variables areassumed to be stationary in nature. To explain the aboveequation, it can be written in a simple form.X t ¼ β þ axþ δyþ ρzþ ε: ð2Þ
In the Eq. (2) we have captured the lagged value of NNP,MINX and IIP in the vectors x, y and z, respectively, which canbe written as follows:
x ¼xt−1⋮xt−n
24
35; y ¼
yt−1⋮yt−n
24
35; and z ¼
zt−1⋮zt−n
24
35
Similarly, we have represented α, δ and ρ as three matrix ofcoefficient for the lagged endogenous variable which can bewritten as follows:
a ¼a11 ⋯ a1n⋮ ⋱ ⋮a31 ⋯ a3n
24
35; δ ¼
δ11 ⋯ δ1n⋮ ⋱ ⋮δ31 ⋯ δ3n
24
35; and ρ ¼
ρ11 ⋯ ρ1n⋮ ⋱ ⋮ρ31 ⋯ ρ3n
24
35:
The disturbance term ε1t, ε2t and ε3t are white noise. In thisstudy, we have estimated the relationship between nationalincome of India, value of mineral export and industrial pro-duction based upon the above procedure, and the results areanalysed in the following section.
Impulse response function (IRF) and variance decomposition(VD)
In a VAR model, the coefficient cannot be interpreteddirectly. Therefore, we have adopted the innovation-accounting techniques which consist of variance decom-position (VD) and impulse response function (IRF). TheVD and IRF examine the relative impact of each vari-able on other variables. The IRF shows the response of
each concerned variables in the linear system to a shockfrom system variables, and the VDs show the portion ofthe variance in the forecast error for each variable dueto innovations to all variables in the system (Enders1995). In the following section, the results of unit roottest and VAR estimation are analysed. In addition tothis, the relative influence of variables is discussed indetails based on the results of IRFs and VDs.
Results and discussion
The results of the stationarity test using AugmentedDicky Fuller (ADF), Phil l ips Perron (PP) andKwiatkowski-Phil l ips-Schmidt-Shin (KPSS) are
A. K. Sahoo et al.

presented in Table 1. In the ADF and PP tests, the nullhypothesis is non-stationary of a variable against thealternative hypothesis stationary of a variable.However, the ADF and PP test results have beencriticised when the stationary result is obtained nearthe non-stationary boundary. The KPSS test will tacklethis problem by testing the hypothesis in a reverse way.In the KPSS test, the null hypothesis is stationary of avariable against the alternative hypothesis non-stationaryof a variable. The result of ADF test, PP test and KPSStest reveals that all variables are stationary at their firstdifference. Hence, it is concluded that all variables are inte-grated of order 1, technically known as I (1) process.
The next step after confirmation of order of integration is toestimate the appropriate VAR model. The variables duringestimation of VAR model are employed on their stationarylevel. An important aspect of specification of VAR model islag-length selection. The lag-length selection in the presentVAR estimation has been based upon the Akaike informationcriterion (AIC), Schwarz information criterion (SIC) andHannan-Quinn information criterion (HQC). The details onlag selection have been provided in Table 2.
Perusal of the above table reveals that AIC, SIC and HQCsuggest for lag 6, whereas only LR suggests for lag 5. Basedon the above results, we have selected lag 6 for our analysis.
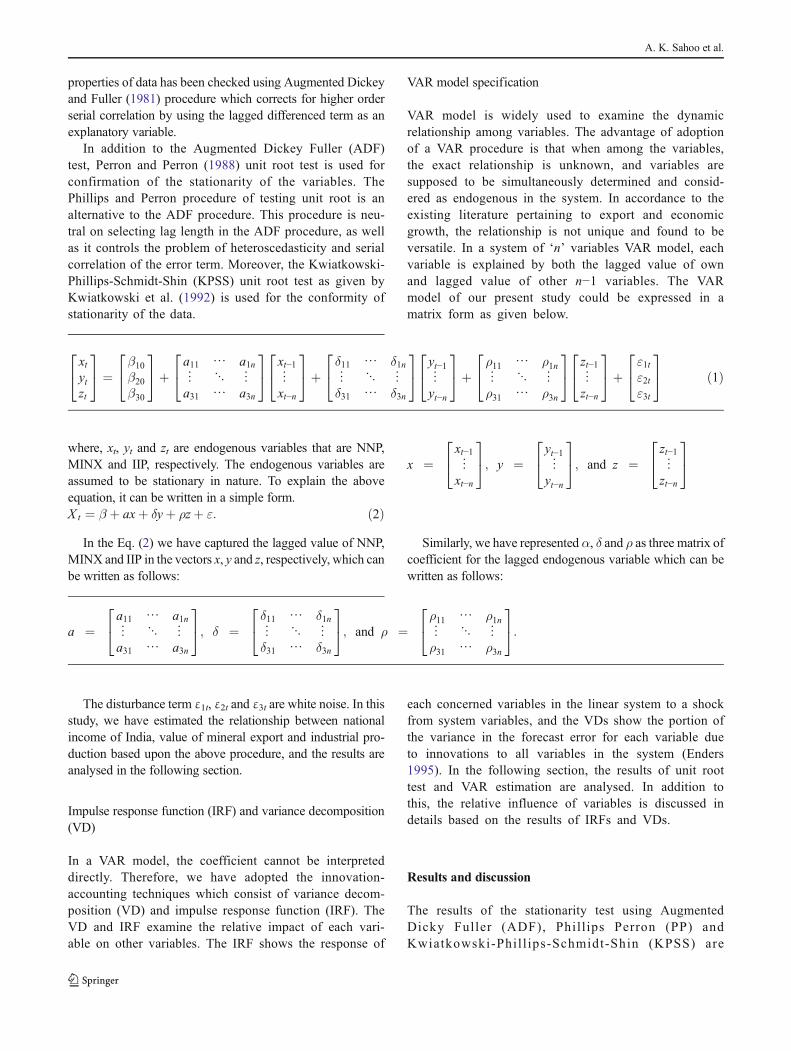
Impulse response function result
The result of impulse response function is presented in Fig. 2.The first row of the figure shows the responses of NNP to ashock in MINX and IIP. The NNP is found to respond posi-tively to a shock in MINX from the first year to third year.However, the NNP does not influence a shock in IIP for thesame period.
In Fig. 2, the second row shows the responses of MINX toshock in NNP and IIP. As a result of a shock in NNP, MINXresponds negatively up to 3 years. But after that, it againbecomes positive. Similarly, MINX responds positively to ashock in IIP. The impulse response function suggests that ashock to NNP leads to a decrease in mineral export up to thethird year. Moreover, it is found that a shock to either MINXor IIP will have an impact up to 10 years after which itdisappears. The third row in the same figure shows the re-sponses of industrial production to a shock in mineral exportand NNP. Industrial production is found to respond negativelyto a shock in either mineral export or NNP.
Variance decomposition
The result of variance decomposition is presented in Table 3.The variance decomposition of NNP shows that NNP islargely explained by its own shock followed by IIP and thenvery less by MINX. Although in the initial period it is largelyexplained by itself, the explanatory power goes on declining
Table 1 Stationarity test result
Variable Type Level First difference
Test statistic Test critical at 1 % Test statistic Test critical at 1 %
Log(NNP) ADF 14.58 −2.64 −4.60a −3.68PP 14.58 −2.64 −4.61a −3.68KPSS 0.17 0.21 0.33a 0.21
Log(MINX) ADF 1.30 −2.64 −3.00a −2.65PP 1.41 −2.64 −5.28a −2.65KPSS 0.15 0.21 0.29a 0.21
Log(IIP) ADF 11.57 −2.64 −3.86a −3.68PP 10.04 −2.64 −3.76a −3.68KPSS 0.19 0.21 0.26a 0.21
a Significant at 1 % level
Table 2 Lag selection criterion
Lag LR AIC SIC HQC
0 – −9.64 −9.49 −9.601 8.07 −9.28 −8.69 −9.132 10.85 −9.18 −8.14 −8.923 7.48 −8.97 −7.49 −8.604 7.98 −8.98 −7.06 −8.505 21.55a −11.28 −8.91 −10.686 13.99 −14.00a −11.18a −13.29a
LR sequential-modified LR test statistica Indicates lag order selected by the criterion
Mineral export and economic growth in India
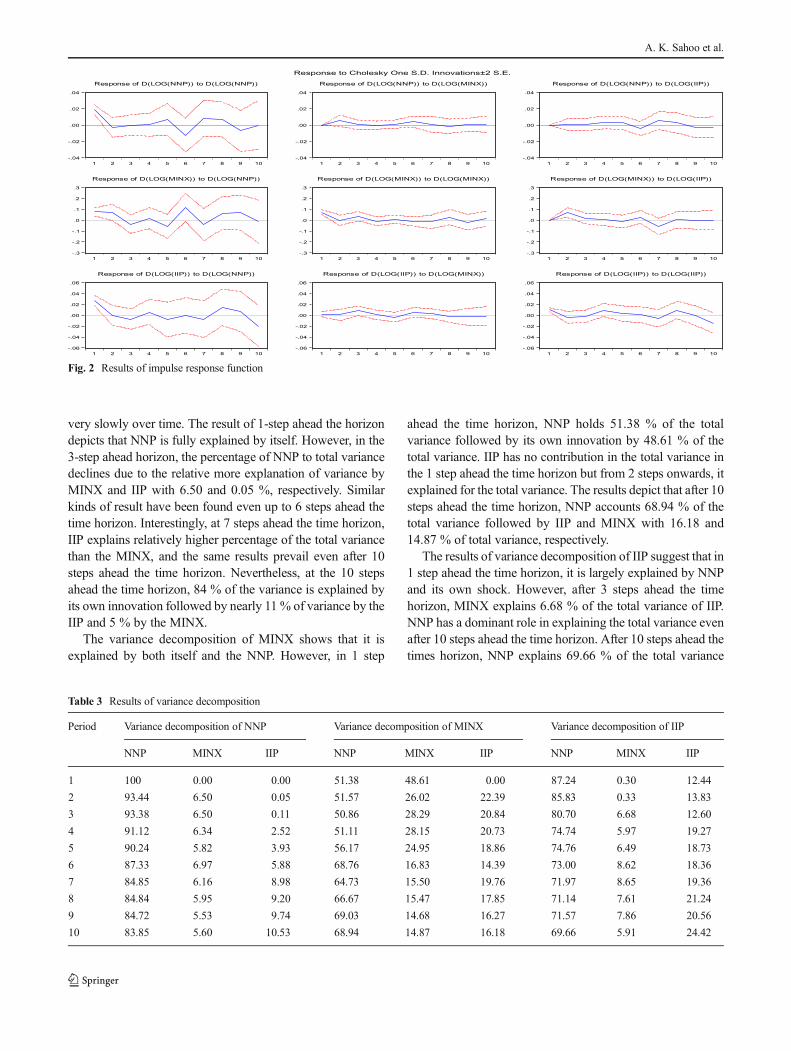
very slowly over time. The result of 1-step ahead the horizondepicts that NNP is fully explained by itself. However, in the3-step ahead horizon, the percentage of NNP to total variancedeclines due to the relative more explanation of variance byMINX and IIP with 6.50 and 0.05 %, respectively. Similarkinds of result have been found even up to 6 steps ahead thetime horizon. Interestingly, at 7 steps ahead the time horizon,IIP explains relatively higher percentage of the total variancethan the MINX, and the same results prevail even after 10steps ahead the time horizon. Nevertheless, at the 10 stepsahead the time horizon, 84 % of the variance is explained byits own innovation followed by nearly 11 % of variance by theIIP and 5 % by the MINX.
The variance decomposition of MINX shows that it isexplained by both itself and the NNP. However, in 1 step
ahead the time horizon, NNP holds 51.38 % of the totalvariance followed by its own innovation by 48.61 % of thetotal variance. IIP has no contribution in the total variance inthe 1 step ahead the time horizon but from 2 steps onwards, itexplained for the total variance. The results depict that after 10steps ahead the time horizon, NNP accounts 68.94 % of thetotal variance followed by IIP and MINX with 16.18 and14.87 % of total variance, respectively.
The results of variance decomposition of IIP suggest that in1 step ahead the time horizon, it is largely explained by NNPand its own shock. However, after 3 steps ahead the timehorizon, MINX explains 6.68 % of the total variance of IIP.NNP has a dominant role in explaining the total variance evenafter 10 steps ahead the time horizon. After 10 steps ahead thetimes horizon, NNP explains 69.66 % of the total variance
-.04
-.02
.00
.02
.04
1 2 3 4 5 6 7 8 9 10
Response of D(LOG(NNP)) to D(LOG(NNP))
-.04
-.02
.00
.02
.04
1 2 3 4 5 6 7 8 9 10
Response of D(LOG(NNP)) to D(LOG(MINX))
-.04
-.02
.00
.02
.04
1 2 3 4 5 6 7 8 9 10
Response of D(LOG(NNP)) to D(LOG(IIP))
-.3
-.2
-.1
.0
.1
.2
.3
1 2 3 4 5 6 7 8 9 10
Response of D(LOG(MINX)) to D(LOG(NNP))
-.3
-.2
-.1
.0
.1
.2
.3
1 2 3 4 5 6 7 8 9 10
Response of D(LOG(MINX)) to D(LOG(MINX))
-.3
-.2
-.1
.0
.1
.2
.3
1 2 3 4 5 6 7 8 9 10
Response of D(LOG(MINX)) to D(LOG(IIP))
-.06
-.04
-.02
.00
.02
.04
.06
1 2 3 4 5 6 7 8 9 10
Response of D(LOG(IIP)) to D(LOG(NNP))
-.06
-.04
-.02
.00
.02
.04
.06
1 2 3 4 5 6 7 8 9 10
Response of D(LOG(IIP)) to D(LOG(MINX))
-.06
-.04
-.02
.00
.02
.04
.06
1 2 3 4 5 6 7 8 9 10
Response of D(LOG(IIP)) to D(LOG(IIP))
Response to Cholesky One S.D. Innovations±2 S.E.
Fig. 2 Results of impulse response function
Table 3 Results of variance decomposition
Period Variance decomposition of NNP Variance decomposition of MINX Variance decomposition of IIP
NNP MINX IIP NNP MINX IIP NNP MINX IIP
1 100 0.00 0.00 51.38 48.61 0.00 87.24 0.30 12.44
2 93.44 6.50 0.05 51.57 26.02 22.39 85.83 0.33 13.83
3 93.38 6.50 0.11 50.86 28.29 20.84 80.70 6.68 12.60
4 91.12 6.34 2.52 51.11 28.15 20.73 74.74 5.97 19.27
5 90.24 5.82 3.93 56.17 24.95 18.86 74.76 6.49 18.73
6 87.33 6.97 5.88 68.76 16.83 14.39 73.00 8.62 18.36
7 84.85 6.16 8.98 64.73 15.50 19.76 71.97 8.65 19.36
8 84.84 5.95 9.20 66.67 15.47 17.85 71.14 7.61 21.24
9 84.72 5.53 9.74 69.03 14.68 16.27 71.57 7.86 20.56
10 83.85 5.60 10.53 68.94 14.87 16.18 69.66 5.91 24.42
A. K. Sahoo et al.
followed by IIP itself with 24.42 % andMINXwith 5.91 % ofthe total variance. This suggests that mining export is contrib-uting largely to the industrial production in the long run ascompared to the short run.
Conclusion and policy implication
The results of the study based upon modern econometric toolssuch as impulse response function and variance decomposi-tion reveal that in the short run, mining export is largelyexplained by both its own innovation and economic growth.However, the industrial production has relatively less impacton mining export in the short run as compared to the long run.It is found that economic growth responds positively to ashock in mining export whereas negatively to the industrialproduction. Similarly, economic growth is largely explainedby its own innovation in the short run, whereas in the long-run, industrial production and mining export explain the eco-nomic growth. The results reveal that industrial productionresponds negatively to a shock in either mining export oreconomic growth. The industrial production is largely ex-plained by the economic growth. However, in the long-run,mining export has a contribution to the industrial production.
In the present paper, we found that mineral export has long-term impact on both the economic growth and industrialproduction of India. Based on the results, the policy implica-tions of the study suggest that the Government of India shouldemphasise on the proper mineral extraction and export whichwill enhance economic growth. In addition, it should formu-late sustainable policies and programmes related to mineralexport and its proper utilisation to augment the national wel-fare of India. Moreover, export promotion measures should beundertaken for higher mineral exports of India. At the sametime, local area development plan and infrastructure develop-ment should be carried out to generate plethora of employ-ment opportunities and to increase social welfare in the min-ing area.
Acknowledgments We would like to thank Magnus Ericsson, PatrikSöderholm, Linda Wårell and anonymous reviewers of this journal fortheir constructive comments and valuable suggestions. Moreover, we arehighly thankful to University Grants Commissions, India for their finan-cial support.
References
Ahmad J, Kawn ACC (1991) Causality between exports and economicgrowth: empirical evidence from Africa. Econ Lett 37:243–248
Anwer MS, Sampath RK (2001) Exports and economic growth. IndianEcon J 47:79–88
Asafu-Adjaye J, Chakraborty D (1999) Export-led growth and importcompression: further time series evidence from LDCs. Aust EconPap 38:164–175
Auty R (1993) Sustaining development in mineral economies: the re-source curse thesis. Routledge, London
Awokuse TO (2005) Exports, economic growth and causality in Korea.Appl Econ Lett 12:693–696
Awokuse TO (2006) Export-led growth and the Japanese economy:evidence from VAR and directed acyclic graphs. Appl Econ Lett12:849–858
Balassa B (1978) Exports and economic growth: further evidence. J DevEcon 5:181–189
Ben-David D, Loewy MB (1998) Free trade growth and convergence. JEcon Growth 3:143–170
Chandra R (2003) Reinvestigating export-led growth in India using amultivariate cointegration framework. J Developing Areas 37:73–86
Dash RK (2009) Revisited export-led growth hypothesis: an empiricalstudy on India. South Asia Econ J 10:306–324
Dawson PJ (2005) The export-income relationship: the case of India.Prog Dev Stud 5:16–29
Dhawan U, Biswal B (1999) Re-examining export led growth hypothesis:a multivariate cointegration analysis for India. Appl Econ 31:525–530
Dickey DA, Fuller WA (1981) Distribution of the estimators forautoregressive time series with a unit root. Econometrica 49:1057–1072
Domenech J (2008) Mineral resource abundance and regional growth inSpain, 1860–2000. J Int Dev 20:1122–1135
Edwards S (1998) Openness, productivity and growth, what do we reallyknow? Econ J 108:383–398
Enders Walter (1995) Applied econometric time series. John Wiley &sons, New York
Gelb A (1988) Windfall gains: blessing or curse? Oxford UniversityPress, New York
Hajkowicz SA, Heyenga S, Moffat K (2011) The relationship betweenmining and socio-economicwellbeing inAustralia’s regions. ResourPolicy 36:30–38
Huang Tai-Hsin, Wang Mei-Hui (2007) A test for the export-led growthhypothesis in possibly integrated vector autoregressions. Appl EconLett 14:999–1003
Indian Minerals Yearbook (IMY) 2011. Indian Bureau of mines. IndiaJordaan AC, Eita JH (2007) Export and economic growth in Namibia: a
Granger causality analysis. S Afr J Econ 75:540–547Jung WS, Marshall PJ (1985) Exports, growth and causality in develop-
ing countries. J Dev Econ 18:1–12Krueger AO (1980) Trade policy as an input to development. Am Econ
Rev 70:282–287Kwiatkowski D, Phillips PC, Schmidt P, Shin Y (1992) Testing the null
hypothesis of stationarity against the alternative of a unit root. JEcon 54:159–178
Lim SY, Chia RCJ, Chong MH (2010) Long-run validity of export-ledgrowth: an empirical reinvestigation from linear and non-linearcointegration test. Econ Bull 30:1182–1190
Mallick SK (1996) Causality between exports and economic growth inIndia: evidence from cointegration based error-correction model.Indian Econ J 76:307–320
Mishra PP (2009) Coal mining and rural livelihoods: case of the Ib Valleycoalfield, Orissa. Econ Pol Wkly 44:117–123
M-ud D (2004) Exports, imports, and economic growth in South Asia:evidence using a multivariate time-series framework. Pak Dev Rev43:105–124
Nidugala GK (2001) Exports and economic growth in India: an empiricalinvestigation. Indian Econ J 47:67–78
Papyrakis E, Gerlagh R (2007) Resource abundance and economicgrowth in the United States. Eur Econ Rev 51:1011–1039
Mineral export and economic growth in India

Pattanayak P, Saha S, Sahu P, Sills E, Singha A, Yang J (2010) Mine overmatter? Health, wealth and forests in a mining area of Orissa. IndianGrowth Dev Rev 3:166–185
Paul Biru P, Anupam D (2012) Export-led growth in India and the role ofliberalisation. J Appl Econ 6:1–26
Perron PCB, Perron P (1988) Testing for a unit root in time seriesregression. Biometrika 75:335–346
Reserve Bank of India (RBI) 2010–11. Handbook of statistics on theIndian economy. India
Sachs JD, Warner AM (1995) Natural resource abundance andeconomic growth. Discussion paper, Harvard Institute forInternational Development, Massachusetts
Sharma A, Panagiotidis T (2004) An analysis of exports andgrowth in India: cointegration and causality evidence (1971–
2001). Working Paper, Department of Economics, Universityof Sheffield, England
Shirazi NS, Manap TAA (2005) Export-led growth hypothesis: furthereconometric evidence from Pakistan. Dev Econ 43:472–488
Siliverstovs B, Herzer D (2006) Export-led growth hypothesis: evidencefor Chile. Appl Econ Lett 13:319–324
Singh JP, Konya L (2006) Cointegration and causality between Indianexports, imports and GDP. Asia Pac J Econ Bus 10:20–35
Ullah S, Bedi-uz Z, Farooq M, Javed A (2009) Cointegration and cau-sality between exports and economic growth in Pakistan. Eur J SocSci 10:264–272
Williams A (2011) Shining a light on the resource curse: An empiricalanalysis of the relationship between natural resources, transparency,and economic growth. World Dev 39:490–505
A. K. Sahoo et al.