milliman ul/iul survey results - association of insurance ... · milliman ul/iul survey results...
TRANSCRIPT

Milliman UL/IUL Survey Results
AICP New England Chapter
Sue Saip, FSA, MAAAMay 12, 2017
AICP New England Chapter
21st Annual Education Day
Session 4
Milliman UL/IUL Issues Survey
� Comprehensive survey covering:� ULSG, Cash Accumulation UL (AccumUL), Current Assumption UL (CAUL)
� IULSG, Cash Accumulation IUL (AccumIUL), Current Assumption IUL (CAIUL)
� Sales by UL/IUL Product Type � Profit Measures
• By Distribution Channel � Target Surplus
• By Issue Age Group � Reserves
2
• By Premium Type � Risk Management
• By Gender � Underwriting
• By Underwriting Class � Product Design
• By Death Benefit Option � Compensation
• By 7702 Option (CVAT/GPT) � Pricing
• With Chronic Illness Riders � Administration
• With LTC Riders � Illustrations

Milliman UL/IUL Issues Survey
� 32 Participants in the 2016/2017 survey
• Allianz • Global Atlantic • Principal
• American Family • John Hancock • Protective Life
• Americo • Kansas City Life • Sammons Financial Group
• Ameriprise • Lincoln Financial • Securian
• AXA • Modern Woodmen of America • State Farm
3
• Bankers Life • Mutual of Omaha • Symetra
• Cincinnati Life • Nationwide • Thrivent Financial
• Columbus Life • New York Life • TIAA-CREF
• Equitrust • Ohio National • Voya Financial
• Fidelity & Guaranty Life • Pan American • Washington National
• Foresters • Penn Mutual

UL/IUL Sales SummarySales Mix by Year
30%
40%
50%
60%
70%
66% 68%
62%64%
Per
cent
of T
otal
Indi
vidu
al U
L S
ales
Universal Life Sales Mix
30%40%50%60%70%80%90%
80%86% 86% 87%
Per
cent
of T
otal
Indi
vidu
al IU
L S
ales
Indexed UL Sales Mix
4
0%
10%
20%
2013 2014 2015 YTD 9/30/16
17% 18% 16% 15%17%
15%
22% 21%
Per
cent
of T
otal
Indi
vidu
al U
L S
ales
ULSG Cash Accumulation UL Current Assumption UL
0%10%20%30%
2013 2014 2015 YTD 9/30/166%
5% 5% 5%
14%8% 8% 8%
Per
cent
of T
otal
Indi
vidu
al IU
L S
ales
IULSG Cash Accumulation IUL Current Assumption IUL
ULSG dominates Cash Accumulation IUL dominates

UL/IUL Sales SummaryUL Average Amounts Per Policy
UL Weighted Average Premiums Per Policy UL Weighted Average Face Amount Per Policy
2
3
4
5
6
3.5 3.6 3.7 3.4
5.0 5.3
4.9
4.4 4.4 4.3
5.0 4.9
Ave
rage
Pre
miu
m P
er P
olic
y (1
000s
)
200
300
400
500
260 264 295 295
411 431
452 439
287 245
330
310
Ave
rage
Fac
e A
mou
nt P
er P
olic
y (1
000s
)
5
0
1
2
2013 2014 2015 YTD 9/30/16
1.4 1.5 1.6 1.5
Ave
rage
Pre
miu
m P
er P
olic
y (1
000s
)
Total Individual UL ULSG
Cash Accumulation UL Current Assumption UL
0
100
200
2013 2014 2015 YTD 9/30/16
78 85 90 90
Ave
rage
Fac
e A
mou
nt P
er P
olic
y (1
000s
)
Total Individual UL ULSG
Cash Accumulation UL Current Assumption UL
Highest average => ULSG in 2013 & 2014 and Current Assumption UL in 2015 &
YTD 9/30/16
Highest average => ULSG in all periods
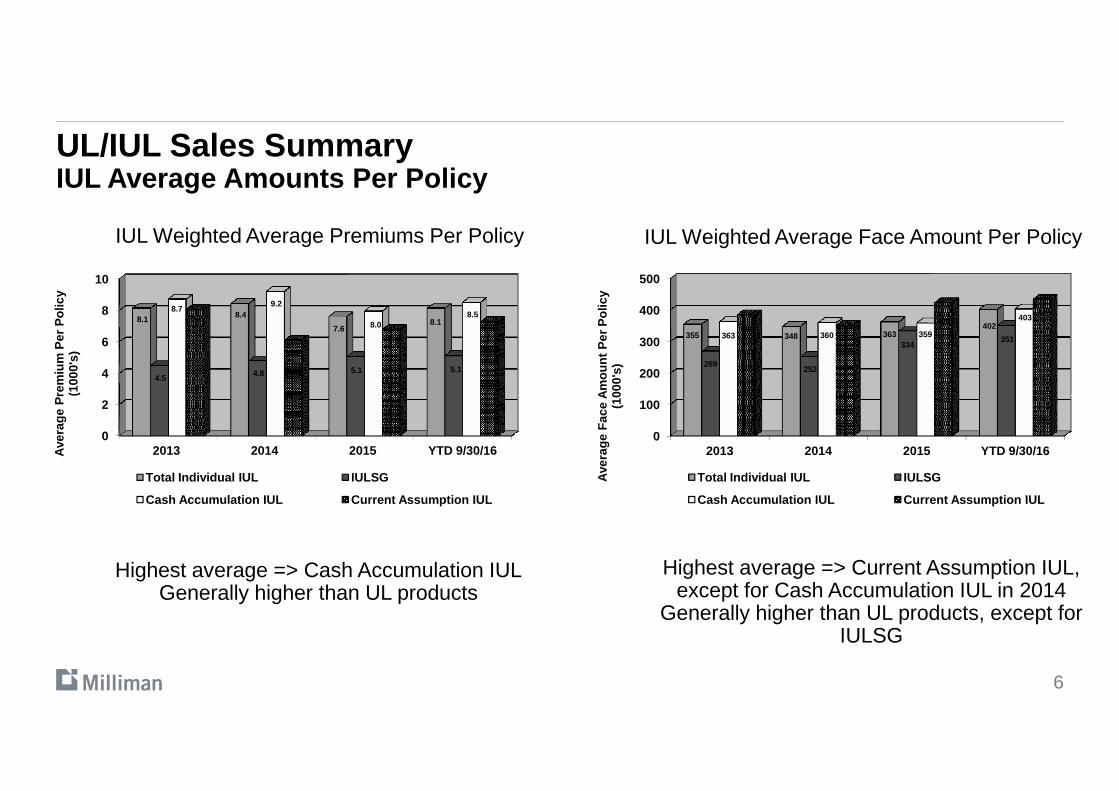
UL/IUL Sales SummaryIUL Average Amounts Per Policy
IUL Weighted Average Premiums Per Policy IUL Weighted Average Face Amount Per Policy
4
6
8
10
8.1 8.4
7.6 8.1
4.5 4.8 5.1 5.1
8.7 9.2
8.0 8.5 8.1
6.1 6.8
7.3
Ave
rage
Pre
miu
m P
er P
olic
y (1
000'
s)
200
300
400
500
355 348 363 402
269 252
334 351 363 360 359
403 385
352
423 434
Ave
rage
Fac
e A
mou
nt P
er P
olic
y (1
000'
s)
6
Highest average => Cash Accumulation IULGenerally higher than UL products
Highest average => Current Assumption IUL, except for Cash Accumulation IUL in 2014
Generally higher than UL products, except for IULSG
0
2
2013 2014 2015 YTD 9/30/16Ave
rage
Pre
miu
m P
er P
olic
y (1
000'
s)
Total Individual IUL IULSG
Cash Accumulation IUL Current Assumption IUL
0
100
2013 2014 2015 YTD 9/30/16
Ave
rage
Fac
e A
mou
nt P
er P
olic
y (1
000'
s)
Total Individual IUL IULSG
Cash Accumulation IUL Current Assumption IUL
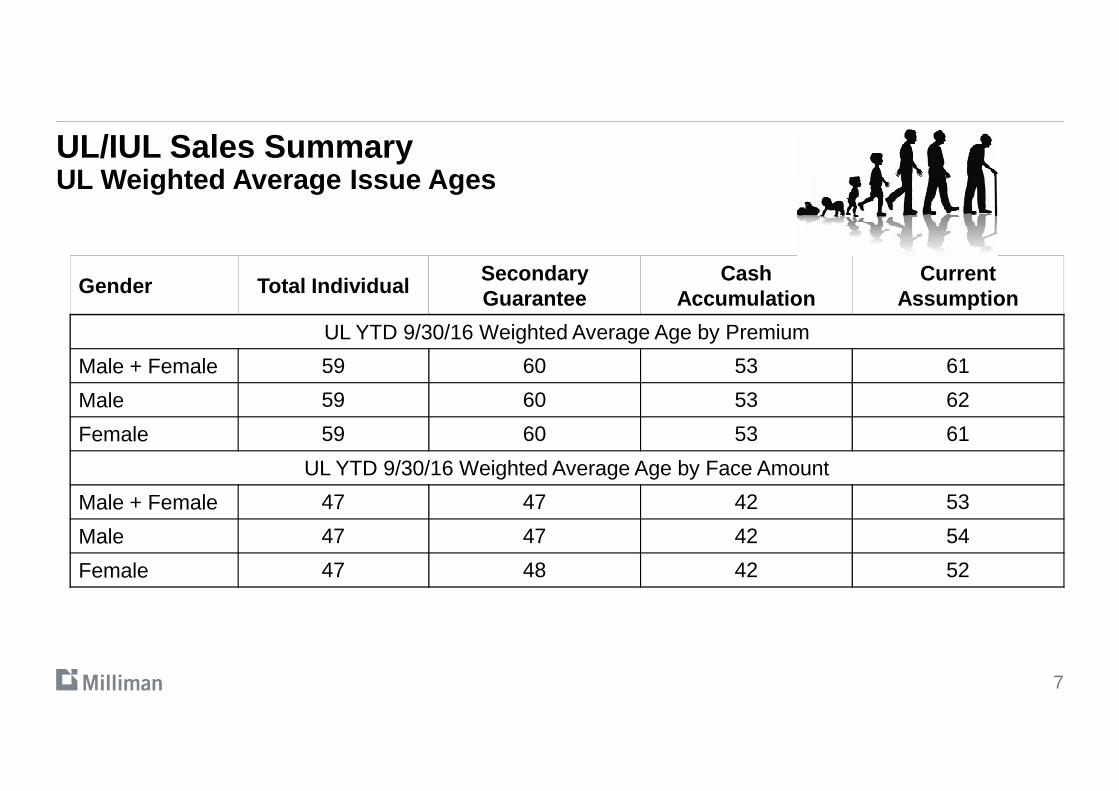
UL/IUL Sales SummaryUL Weighted Average Issue Ages
Gender Total IndividualSecondaryGuarantee
Cash Accumulation
CurrentAssumption
UL YTD 9/30/16 Weighted Average Age by Premium
Male + Female 59 60 53 61
Male 59 60 53 62
7
Male 59 60 53 62
Female 59 60 53 61
UL YTD 9/30/16 Weighted Average Age by Face Amount
Male + Female 47 47 42 53
Male 47 47 42 54
Female 47 48 42 52

UL/IUL Sales SummaryIUL Weighted Average Issue Ages
Gender Total IndividualSecondaryGuarantee
Cash Accumulation
CurrentAssumption
IUL YTD 9/30/16 Weighted Average Age by Premium
Male + Female 53 56 52 59
Male 53 57 53 59
8
Male 53 57 53 59
Female 53 55 52 59
IUL YTD 9/30/16 Weighted Average Age by Face Amount
Male + Female 46 50 45 53
Male 47 51 45 53
Female 45 49 44 52

UL/IUL Sales SummaryExpectations Regarding Future Mix of Business
Item ULSGCash
AccumulationCurrent
AssumptionIULSG
Cash Accumulation
IUL
Current Assumption
IUL
Mix of Business –Averages
Current (31) 28% 12% 9% 3% 42% 4%
9
Current (31) 28% 12% 9% 3% 42% 4%
Current (24) 17% 12% 2% 3% 61% 4%
2 Years (24) 11% 13% 3% 6% 62% 6%
5 Years (24) 9% 14% 3% 6% 62% 6%

UL/IUL Sales Summary YTD 9/30/16 Distribution by Death Benefit Option
5.8%0.4% 0.9%
14.9%0.2%
UL by Face Amount
0.4%
IUL By Premium IUL by Face Amount UL by Premium
10
94.1%
61.0%
38.0%
84.7%
Option A/Option 1 Option B/Option 2 Option C/Option 3
60.8%
38.7%
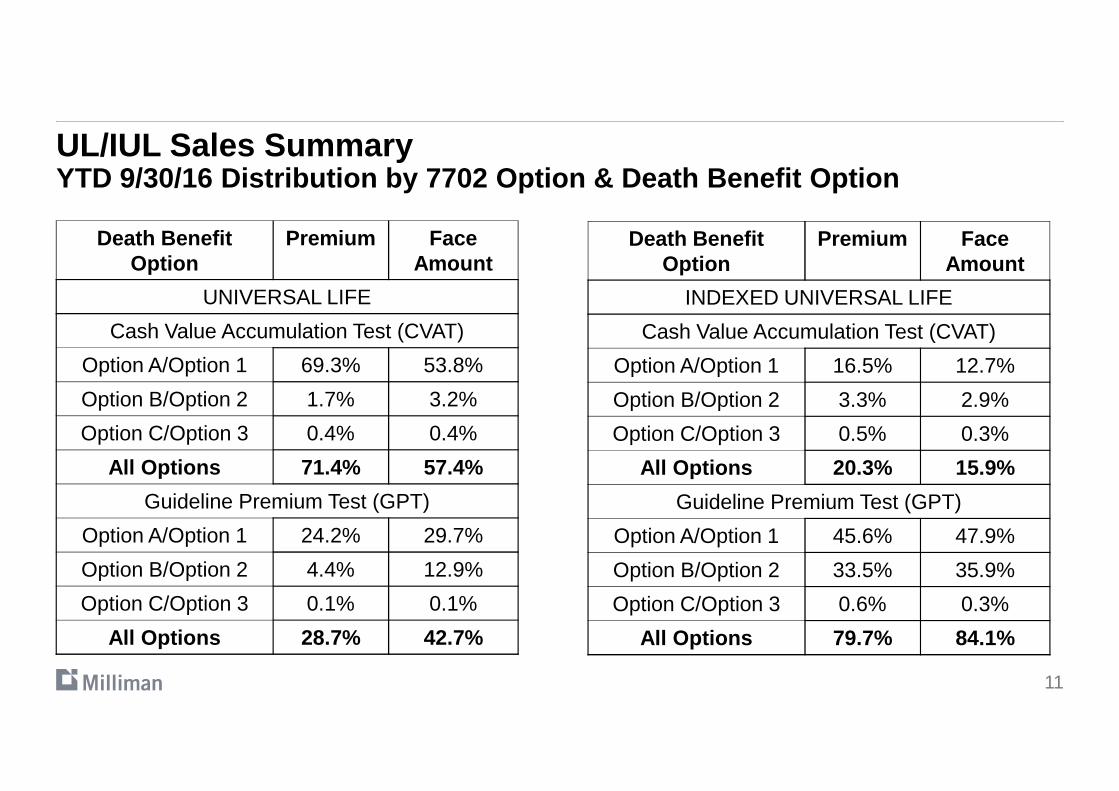
UL/IUL Sales Summary YTD 9/30/16 Distribution by 7702 Option & Death Ben efit Option
Death Benefit Option
Premium Face Amount
UNIVERSAL LIFE
Cash Value Accumulation Test (CVAT)
Option A/Option 1 69.3% 53.8%
Option B/Option 2 1.7% 3.2%
Death Benefit Option
Premium Face Amount
INDEXED UNIVERSAL LIFE
Cash Value Accumulation Test (CVAT)
Option A/Option 1 16.5% 12.7%
Option B/Option 2 3.3% 2.9%
11
Option B/Option 2 1.7% 3.2%
Option C/Option 3 0.4% 0.4%
All Options 71.4% 57.4%
Guideline Premium Test (GPT)
Option A/Option 1 24.2% 29.7%
Option B/Option 2 4.4% 12.9%
Option C/Option 3 0.1% 0.1%
All Options 28.7% 42.7%
Option B/Option 2 3.3% 2.9%
Option C/Option 3 0.5% 0.3%
All Options 20.3% 15.9%
Guideline Premium Test (GPT)
Option A/Option 1 45.6% 47.9%
Option B/Option 2 33.5% 35.9%
Option C/Option 3 0.6% 0.3%
All Options 79.7% 84.1%

UL/IUL Sales SummaryChronic Illness Rider Sales
�Chronic Illness Rider Approaches
�Discounted death benefit approach (7 participants)
� Lien approach (5 participants)
�Dollar-for-dollar approach (5 participants)�Dollar-for-dollar approach (5 participants)
12
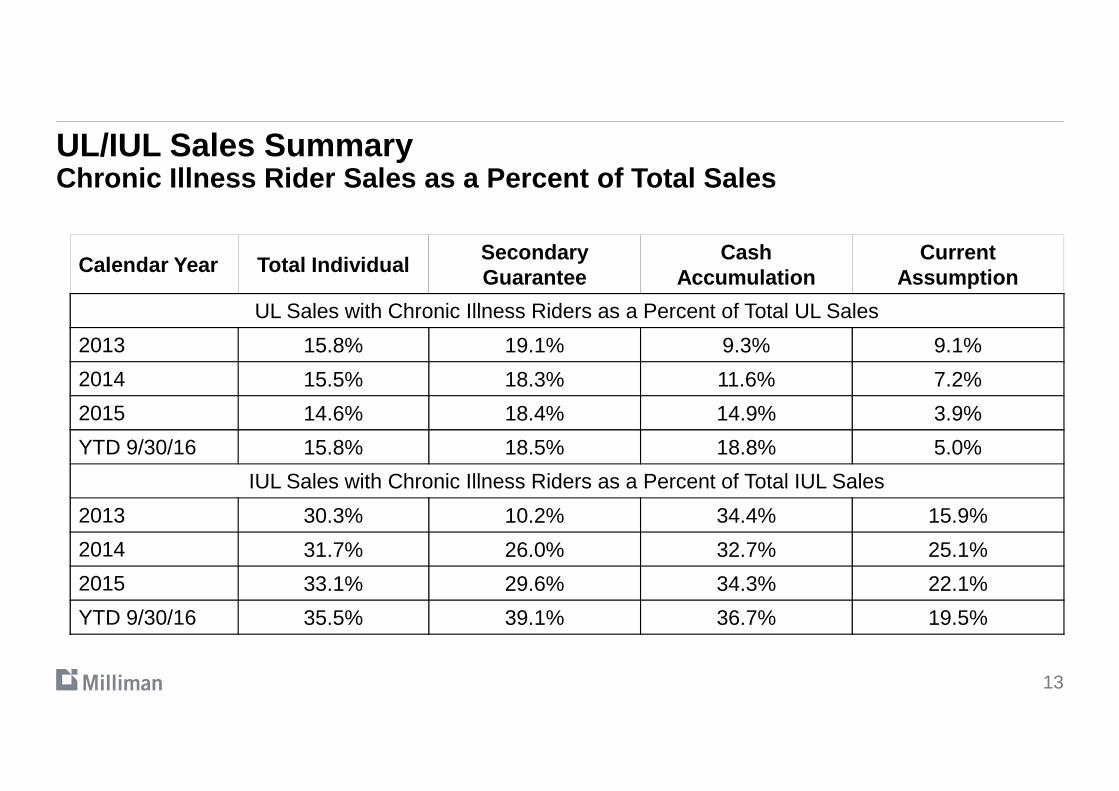
UL/IUL Sales SummaryChronic Illness Rider Sales as a Percent of Total S ales
Calendar Year Total IndividualSecondaryGuarantee
Cash Accumulation
CurrentAssumption
UL Sales with Chronic Illness Riders as a Percent of Total UL Sales
2013 15.8% 19.1% 9.3% 9.1%
2014 15.5% 18.3% 11.6% 7.2%
13
2015 14.6% 18.4% 14.9% 3.9%
YTD 9/30/16 15.8% 18.5% 18.8% 5.0%
IUL Sales with Chronic Illness Riders as a Percent of Total IUL Sales
2013 30.3% 10.2% 34.4% 15.9%
2014 31.7% 26.0% 32.7% 25.1%
2015 33.1% 29.6% 34.3% 22.1%
YTD 9/30/16 35.5% 39.1% 36.7% 19.5%
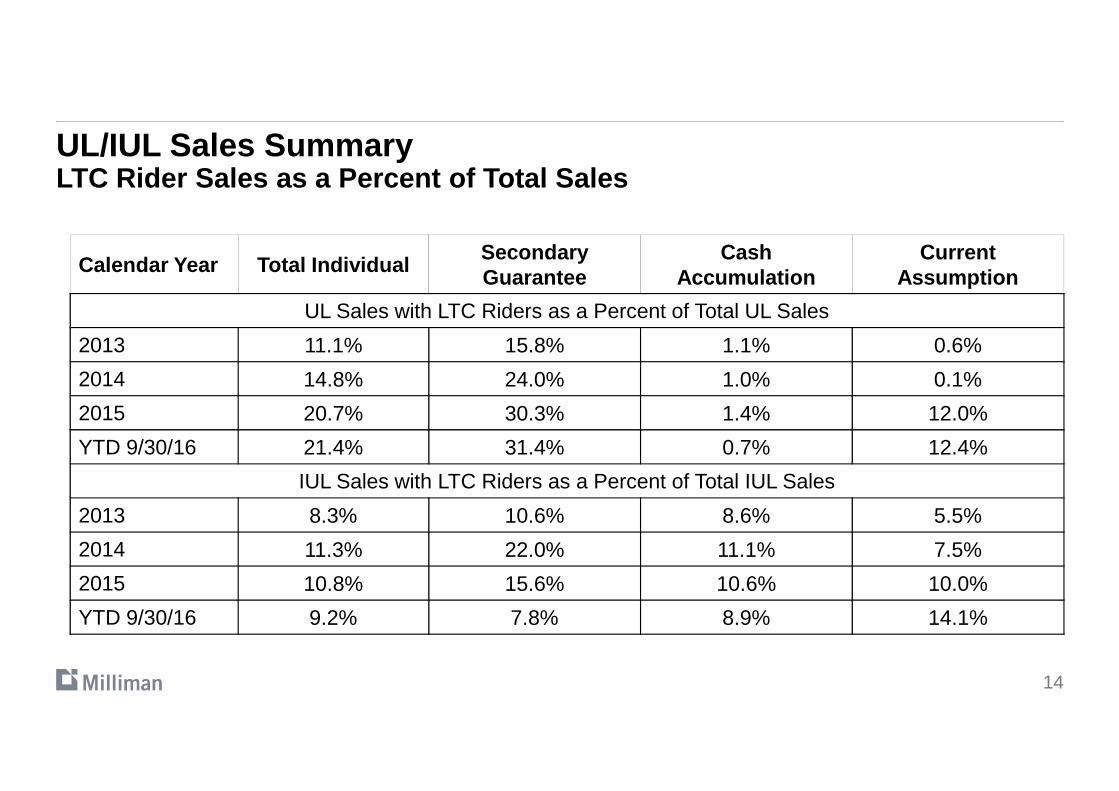
UL/IUL Sales SummaryLTC Rider Sales as a Percent of Total Sales
Calendar Year Total IndividualSecondaryGuarantee
Cash Accumulation
CurrentAssumption
UL Sales with LTC Riders as a Percent of Total UL Sales
2013 11.1% 15.8% 1.1% 0.6%
2014 14.8% 24.0% 1.0% 0.1%
14
2015 20.7% 30.3% 1.4% 12.0%
YTD 9/30/16 21.4% 31.4% 0.7% 12.4%
IUL Sales with LTC Riders as a Percent of Total IUL Sales
2013 8.3% 10.6% 8.6% 5.5%
2014 11.3% 22.0% 11.1% 7.5%
2015 10.8% 15.6% 10.6% 10.0%
YTD 9/30/16 9.2% 7.8% 8.9% 14.1%

Milliman UL/IUL Issues Survey
�Profit Measures
�Predominant measure is after-tax, after-capital statutory ROI/IRR
�Median ROI/IRR is 10% for all UL products, 9.8% for IULSG, 12.3% for AccumIUL, and 12.8% for CAIUL
�During YTD 9/30/16, 63% of participants were short of their profit goals for ULSG, and 78% of participants were at least meeting their profit goals for all other UL/IUL and 78% of participants were at least meeting their profit goals for all other UL/IUL products combined
�Primary reasons for not meeting goals were low interest earnings and expenses
�Target Surplus
�Majority set pricing assumptions as a percent of the NAIC company action level
�Ranged from 250% to 425%, with a median of 350% for most UL/IUL products, except 338% for AccumUL, and 388% for CAIUL
15

Milliman UL/IUL Issues Survey
�Reserves
�Principle-based reserves (PBR) implementation
�Timing
�94% over the 3-year phase-in period
�Rationale for timing – primarily based on resources issues, financial impact/cost/benefits, �Rationale for timing – primarily based on resources issues, financial impact/cost/benefits, impact on reserves and capital, the need for preparation and research, and competitive reasons
16
Milliman UL/IUL Issues Survey
�Reserves
�Pricing new UL products in a PBR environment
�8 of 29 participants did not know how they will reflect reserves in pricing in a PBR environment
�Remaining participants reported they will not change current approach, will reflect VM-20 reserves in pricing, will use a reduced subset of stochastic scenarios, and will use reserves in pricing, will use a reduced subset of stochastic scenarios, and will use approaches that estimate additional reserves
17
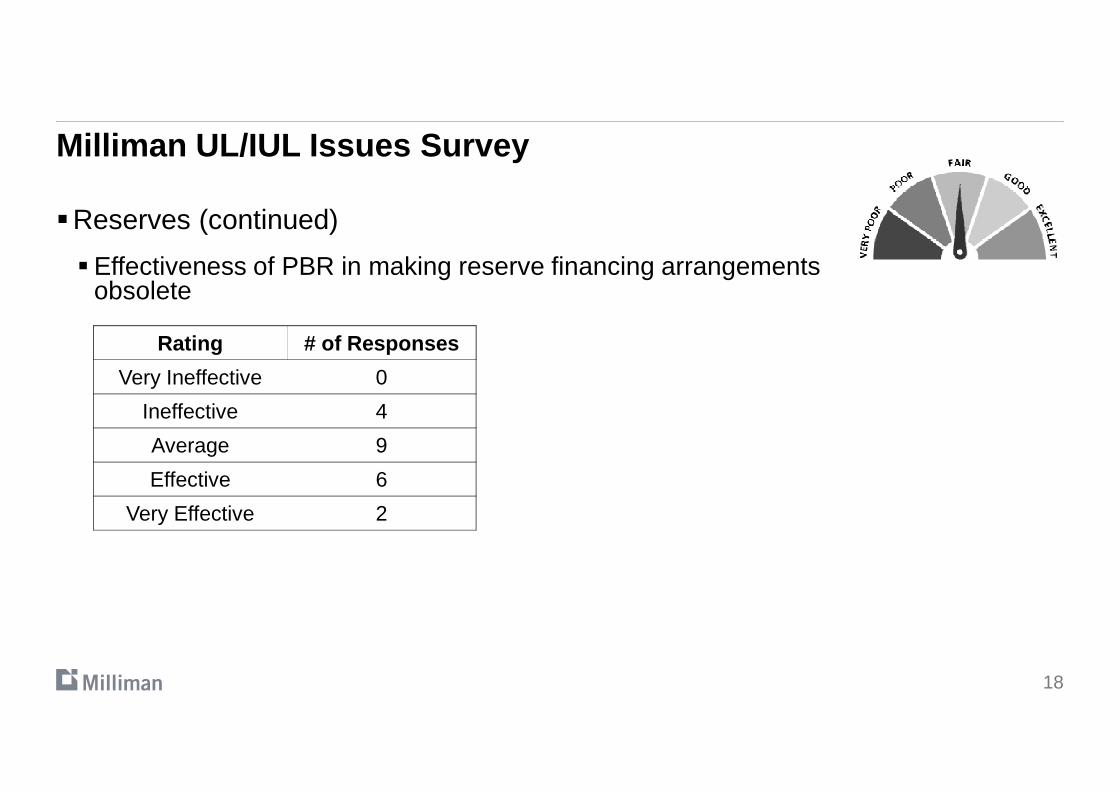
Milliman UL/IUL Issues Survey
�Reserves (continued)
�Effectiveness of PBR in making reserve financing arrangements obsolete
Rating # of Responses
Very Ineffective 0
18
Ineffective 4
Average 9
Effective 6
Very Effective 2

Milliman UL/IUL Issues Survey
�Reserves (continued)
� 2017 CSO Mortality Table (new valuation mortality table)
�No participants anticipated implementing immediately
�69% anticipate implementing over the 3-year phase-in period
�31% implementation is product dependent�31% implementation is product dependent
� 2017 CSO and PBR
�Implementation at the same time 28%
�Implement 2017 CSO, then PBR at a later date 16%
�Implementation is product dependent 47%
�Other (PBR, then 2017 CSO, 2017 CSO only, TBD) 9%
19

Milliman UL/IUL Issues Survey
�Underwriting
� Table-shaving programs are used by 7 of the 32 participants
� 13 of the participants use a credit program or other type of program that improves ratings for favorable risk factors
�Use of scoring models relative to life underwriting�Use of scoring models relative to life underwriting
�11 participants use; 8 use for fullly underwritten UL/IUL business; 1 uses for simplified issue business; 2 use for both fully underwritten and simplified issue business
�8 of the 11 use scoring models with automated rules
�Scoring models used include lab scoring models, credit scoring models, scoring models relative to motor vehicle records
� Ten participants reported utilizing fluid-less underwriting programs
20
Milliman UL/IUL Issues Survey
�Underwriting
�Use of supplemental underwriting tools on fully underwritten business:
�Prescription drug database searches (30)
�Tele-underwriting/telephonic screening (21)
�Cognitive impairment testing (20)�Cognitive impairment testing (20)
�Activities of Daily Living (ADL) measures (15)
�Additional questions on applications (10)
21

Milliman UL/IUL Issues Survey
�Underwriting
�Simplified issue underwritten UL/IUL
�17 of the 32 participants offer
�Top markets where offered => individual middle/upper income market and low/middle income marketincome market
�Most popular channel where offered => brokerage channel with 14 of the 17 offering products here
�Most common underwriting tools used are: a) Medical Information Bureau (MIB) Group reports (15), b) Prescription drug database searches (15), and c) Motor vehicle reports (13)
�Knock-out underwriting is used by 22 of 31 responding participants for preferred UL/IUL products
�Debit/credit underwriting by 6; and a combination of knock-out & debit/credit by 3
22
Milliman UL/IUL Issues Survey�Product Design
� LTC rider
�8 participants offer a LTC ABR on either a UL or IUL chassis (5 offer it on both)
� 3 of the 8 expected to develop an enhanced version of the LTC combo product in the next 24 months, with 2 additional participants expected to enter the market, and 1 other is considering the possibility
�Chronic illness rider
�16 participants offer a chronic illness ABR on either a UL or IUL chassis
�4 of the 16 expected to develop an enhanced version of the chronic illness product in the next 24 months, with 4 additional participants expected to enter the market, and 2 others were considering the possibility
�Nearly 78% of survey respondents may market either an LTC or chronic illness rider within 24 months
23
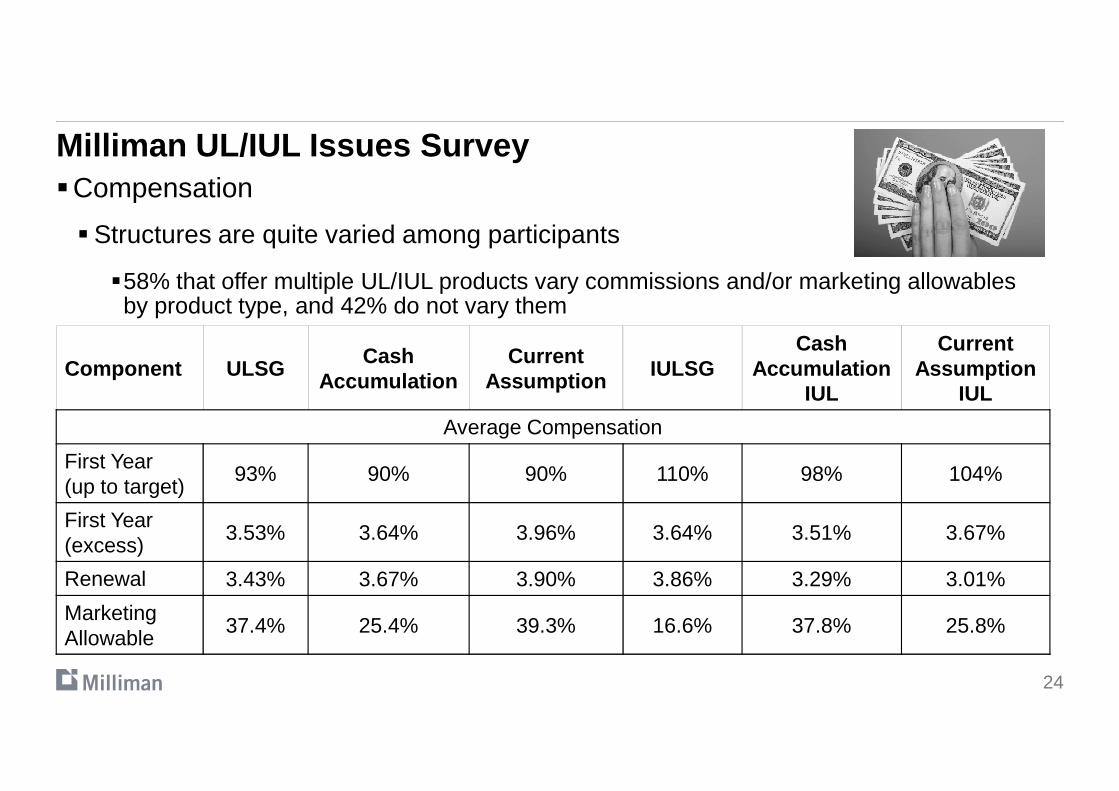
Milliman UL/IUL Issues Survey�Compensation
�Structures are quite varied among participants
�58% that offer multiple UL/IUL products vary commissions and/or marketing allowablesby product type, and 42% do not vary them
Component ULSGCash
AccumulationCurrent
AssumptionIULSG
Cash Accumulation
IUL
Current Assumption
IUL
24
IUL IUL
Average Compensation
First Year(up to target)
93% 90% 90% 110% 98% 104%
First Year (excess)
3.53% 3.64% 3.96% 3.64% 3.51% 3.67%
Renewal 3.43% 3.67% 3.90% 3.86% 3.29% 3.01%
Marketing Allowable
37.4% 25.4% 39.3% 16.6% 37.8% 25.8%
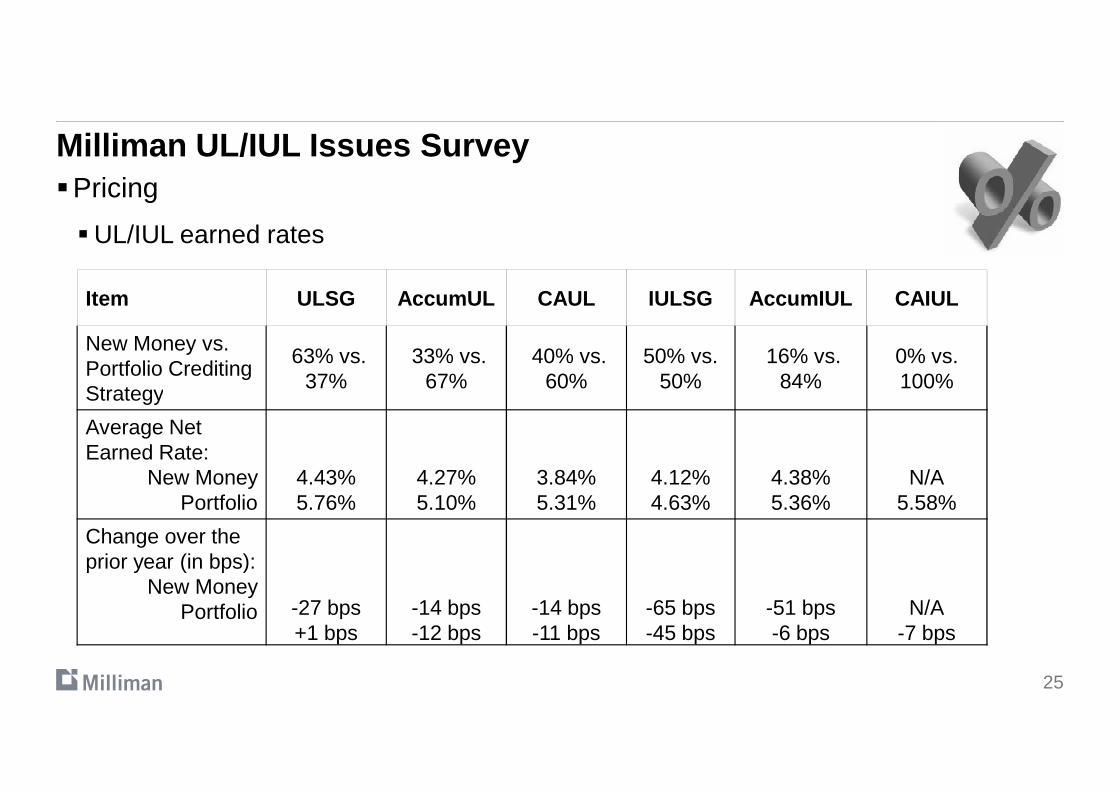
Milliman UL/IUL Issues Survey�Pricing
�UL/IUL earned rates
Item ULSG AccumUL CAUL IULSG AccumIUL CAIUL
New Money vs.Portfolio Crediting Strategy
63% vs. 37%
33% vs. 67%
40% vs. 60%
50% vs. 50%
16% vs. 84%
0% vs. 100%
25
Strategy
Average Net Earned Rate:
New MoneyPortfolio
4.43%5.76%
4.27%5.10%
3.84%5.31%
4.12%4.63%
4.38%5.36%
N/A5.58%
Change over the prior year (in bps):
New MoneyPortfolio -27 bps
+1 bps-14 bps-12 bps
-14 bps-11 bps
-65 bps-45 bps
-51 bps-6 bps
N/A-7 bps

Milliman UL/IUL Issues Survey
�Pricing (continued)
� 2017 CSO Mortality Table impact on pricing
�None have repriced/redesigned UL/IUL products under this table
�Impact on UL/IUL product development relative to guideline premium policies to be sold
�Development of more CVAT products?�Development of more CVAT products?
26

Milliman UL/IUL Issues Survey
� Illustrations
�Actuarial Guideline 49
�Benchmark Index Account rate
�Rates range from 5.29% to 7.92%, with an average of 6.79%
�The average maximum illustrated rates pre-AG 49 ranged from 5.60% to 8.50%, with an �The average maximum illustrated rates pre-AG 49 ranged from 5.60% to 8.50%, with an average of 7.38%
�The average maximum illustrated rate post-AG 49 ranged from 5.02% to 7.75%, with an average of 6.69%
27
Milliman UL/IUL Issues Survey
�Available reports
� If your company name was listed as a participant, you can receive the full report (including individual company responses on an anonymous basis)
�Alternatively, go to http://www.milliman.com and search “Universal Life”, and select the 2016 surveythe 2016 survey
�Download the complimentary Executive Summary; or
�Download the order form for the Detailed Report (similar to the full report, but without the individual company responses) – available on a subscription basis
�Contact me if you have any questions at [email protected]
28