milliman client report april to december 2021- proposed ... 20... · actuarial soundness and rate...
TRANSCRIPT

MILLIMAN CLIENT REPORT
April to December 2021- Proposed Rate Methodology Hoosier Care Connect
State of Indiana
Family and Social Services Administration October 25, 2019 Brad Armstrong, FSA, MAAA Andrew Dilworth, FSA, MAAA Christine Mytelka, FSA, MAAA Rob Damler, FSA, MAAA


Table of Contents BACKGROUND ............................................................................................................................................................. 1
FISCAL IMPACT ESTIMATE .......................................................................................................................... 1
SECTION I. MEDICAID MANAGED CARE RATES ...................................................................................................... 2
1. GENERAL INFORMATION ............................................................................................................................. 2
i. Rate development .................................................................................................................................... 2
ii. Generally accepted actuarial practices and principles .............................................................................. 4
2. DATA ............................................................................................................................................................... 5
i. Requested data ........................................................................................................................................ 5
ii. Data used to develop the capitation rates ................................................................................................ 5
iii. Data adjustments ..................................................................................................................................... 7
3. PROJECTED BENEFIT COST AND TRENDS ............................................................................................. 11
i. Development of Projected Benefit Costs ................................................................................................ 11
ii. Projected Benefit Cost Trends ............................................................................................................... 12
iii. Retrospective Eligibility Periods ............................................................................................................. 16
4. SPECIAL CONTRACT PROVISIONS RELATED TO PAYMENT ................................................................. 16
i. Incentive arrangements .......................................................................................................................... 16
ii. Withhold arrangements .......................................................................................................................... 16
iii. Risk sharing mechanisms ...................................................................................................................... 17
iv. Delivery system and provider payment initiatives ................................................................................... 18
v. Pass-through payments ......................................................................................................................... 18
5. PROJECTED NON-BENEFIT COSTS .......................................................................................................... 19
i. Overview ................................................................................................................................................ 19
ii. PMPM versus percentage ...................................................................................................................... 19
iii. Development of non-benefit costs .......................................................................................................... 19
iv. Non-benefit costs, by cost category ....................................................................................................... 20
v. Health insurance providers fee ............................................................................................................... 20
6. RISK ADJUSTMENT AND ACUITY ADJUSTMENTS .................................................................................. 22
i. Overview ................................................................................................................................................ 22
ii. Cost neutral risk adjustment ................................................................................................................... 22
APPENDIX 1: PRELIMINARY APRIL 2021 THROUGH DECEMBER 2021 RATES .................................................. 25
APPENDIX 2: COVERED SERVICES ......................................................................................................................... 26
APPENDIX 3: HCC BASE DATA SUMMARIES ......................................................................................................... 27
APPENDIX 4: HCC ACTUARIAL COST MODELS ..................................................................................................... 28
APPENDIX 5: HCC CAPITATION RATE SUMMARY ................................................................................................. 29

MILLIMAN CLIENT REPORT
HCC re-procurement 1 October 25, 2019 3.741 IMP47-03
Background Milliman has been retained by the State of Indiana, Family and Social Services Administration (FSSA) to develop April 2021 through December 2021 risk-based managed care capitation rates for the Hoosier Care Connect (HCC) program.
This letter provides documentation for the methodology that will be used to develop actuarially sound capitation rates. Although preliminary capitation rates are presented in this report, it is anticipated that these rates may be updated in late calendar year (CY) 2020 with more recent information. As a result, this report is intended to outline the methodology that will be used in the capitation rate development and to present preliminary data, rather than present the final capitation rates that will be paid for April 2021 through December 2021. It is anticipated that these capitation rates may be adjusted prior to 2021 for the following (not a comprehensive list):
Refresh the base data used in the rate development with a more recent time period of HCC program experience
Adjust the trend assumptions to reflect more recent emerging experience
Implement any material program or policy changes related to covered benefits or state-directed payments
Other methodology changes that the state and the certifying actuary deem appropriate in order to develop actuarially sound capitation rates
FISCAL IMPACT ESTIMATE
The preliminary capitation rates for the HCC program are illustrated in Appendix 1. These rates are effective from April 1, 2021 through December 31, 2021 (nine months).
Figure 1 summarizes the estimated state and federal expenditures under the preliminary April 2021through December 2021 capitation rates based on projected enrollment for the rate period April 1, 2021 through December 31, 2021.
FIGURE 1: ESTIMATED FISCAL IMPACT OF PRELIMINARY APRIL 2021 THROUGH DECEMBER 2021 CAPITATION RATES (DOLLARS IN MILLIONS)
April to December 2021
Rate CategoryProjected Enrollment
Projected Expenditures
D1 HCC - Adults 59,532 $813.4D2 HCC - Children 21,611 148.0D4 HCC - Fosters 11,500 33.9D3 HCC - Duals 460 2.9
HCC Composite 93,103 $998.1Total Federal Only $657.1Total State Only $341.0

MILLIMAN CLIENT REPORT
HCC re-procurement October 25, 2019 3.741 IMP47-03 2
Section I. Medicaid managed care rates
1. General information The preliminary capitation rates provided in this report are “actuarially sound” for purposes of 42 CFR 438.4(a), according to the following criteria:
The capitation rates provide for all reasonable, appropriate, and attainable costs that are required under terms of the contract and for the operation of the managed care plan for the time period and population covered under the terms of the contract, and such capitation rates were developed in accordance with the requirements under 42 CFR 438.4(b).
To ensure compliance with generally accepted actuarial practices and regulatory requirements, we referred to published guidance from the American Academy of Actuaries (AAA), the Actuarial Standards Board (ASB), the Centers for Medicare and Medicaid Services (CMS), and federal regulations. Specifically, the following were referenced during the rate development:
Actuarial standards of practice applicable to Medicaid managed care rate setting which have been enacted as of the capitation rate certification date, including: ASOP 1 (Introductory Actuarial Standard of Practice); ASOP 5 (Incurred Health and Disability Claims); ASOP 12 (Risk Classification for All Practice Areas); ASOP 23 (Data Quality); ASOP 25 (Credibility Procedures); ASOP 41 (Actuarial Communications); ASOP 45 (The Use of Health Status Based Risk Adjustment Methodologies); and ASOP 49 (Medicaid Managed Care Capitation Rate Development and Certification).
Actuarial soundness and rate development requirements in the Medicaid and CHIP Managed Care Final Rule (CMS 2390-F) for the provisions effective for the CY 2021 managed care program rating period.
The CMS guide, released March 2019, for rating periods starting between July 1, 2019 and June 30, 2020.
Throughout this document and consistent with the requirements under 42 CFR 438.4(a), the term “actuarially sound” will be defined as in ASOP 49:
“Medicaid capitation rates are “actuarially sound” if, for business for which the certification is being prepared and for the period covered by the certification, projected capitation rates and other revenue sources provide for all reasonable, appropriate, and attainable costs. For purposes of this definition, other revenue sources include, but are not limited to, expected reinsurance and governmental stop-loss cash flows, governmental risk-adjustment cash flows, and investment income. For purposes of this definition, costs include, but are not limited to, expected health benefits; health benefit settlement expenses; administrative expenses; the cost of capital, and government-mandated assessments, fees, and taxes.”1
i. Rate development
(a) Program information
(i) Managed care program
A. General information
Under the HCC program, comprehensive services are provided through managed care organizations on a statewide basis. HCC became effective April 1, 2015.
B. Covered benefits
Benefits covered under HCC are comprehensive. However, certain services covered on Indiana’s state plan have been carved out of the HCC managed care contracts, and are provided to eligible enrollees on a fee-for-service basis. These include:
Certain high cost, low utilization drugs, such as hepatitis C and hemophilia drugs
Diabetes supplies – test strips and meters
1 http://www.actuarialstandardsboard.org/asops/medicaid-managed-care-capitation-rate-development-and-certification/

MILLIMAN CLIENT REPORT
HCC re-procurement October 25, 2019 3.741 IMP47-03 3
Medicaid Rehabilitation Option services
First Steps services
School corporation services
The health plans cover short term rehabilitative institutional care, but members who have been approved for long term services and supports, whether in an institution or in the community, are dis-enrolled from managed care. One exception is for hospice services: Effective January 1, 2019, HCC allows for full hospice coverage, either in a facility or non-facility setting, with no limitation on the number of days. Previously, in-home hospice coverage had been fully covered, but inpatient hospice services were limited to five days. Other facility-based hospice, such as in a nursing home, was not covered prior to January 1, 2019, and members who require such care had previously been dis-enrolled from HCC and enrolled in the traditional fee-for-service Medicaid program.
Aside from the exceptions described above, the HCC benefit package covers the full array of state plan services. Please see Appendix 2 for a list of services covered under the HCC program.
C. Geographical coverage
All managed care entities will operate throughout the entire state.
(ii) Rating period
These preliminary capitation rates are effective for the 9-month rating period April 1, 2021 through December 31, 2021. Rates for subsequent years will be developed on a calendar year basis that are effective for a 12-month rating period.
(iii) Covered populations
Hoosier Care Connect (HCC) covers Indiana’s non-dual eligible aged and disabled (ABD) population, excluding those needing long term care services, either in a community or an institutional setting. It also covers foster children.
The following rate four groups have been established for HCC:
HCC Adults (age 21 and older and not HCC Foster)
HCC Children (under age 21 and not HCC Foster)
HCC Fosters (foster child, ward, or adoption assistance)
HCC Duals (to provide reduced payment when enrollees become retroactively eligible for Medicare)
(iv) Eligibility criteria
Enrollment in HCC is mandatory for eligible HCC Adult and HCC Child members. The program is voluntary for those eligible for the HCC Foster rate group. For children enrolled through the adoption assistance program, the decision on whether to be enrolled in HCC is made by the adoptive parents. For other foster children, the state has decided to enroll those who would most benefit from care coordination, based on medical criteria.
Dual eligible Medicaid enrollees are not eligible for the HCC program, and HCC members who become eligible for Medicare are dis-enrolled, to be served on a fee-for-service basis. In cases where an HCC member becomes eligible for Medicare on a retroactive basis, the managed care organization is responsible to re-adjudicate the claims with Medicare primary. Capitation payments for the “retroactive Medicare period” will be reduced to the dual eligible capitation rate.
Members who have been approved for long term institutional care or waiver services will be dis-enrolled from the HCC program and served on a fee-for-service basis. Short term nursing home stays of up to 30 days may be covered under the HCC program.
(v) Special contract provisions
This rate methodology report contains documentation of the following special contract provisions related to payment included within rate development.

MILLIMAN CLIENT REPORT
HCC re-procurement October 25, 2019 3.741 IMP47-03 4
Withhold arrangements
Mandated minimum fee schedule for hospitals
Minimum medical loss ratio requirement
Mandated minimum fee schedule for faculty physicians (PFAC program) Please see Section I, item 4 for additional detail and documentation on special contract provisions.
ii. Generally accepted actuarial practices and principles
(a) Reasonable, appropriate, and attainable
In our judgment, all adjustments to the capitation rates, or to any portion of the capitation rates, reflect reasonable, appropriate, and attainable costs. To our knowledge, there are no reasonable, appropriate, and attainable costs that have not been included in the rate development.
(b) Outside the rate setting process
There are no adjustments to the rates performed outside the rate setting process described in this report.

MILLIMAN CLIENT REPORT
HCC re-procurement October 25, 2019 3.741 IMP47-03 5
2. Data This section provides information on the CY 2018 base data used to develop the capitation rates. The base experience data described in this section is illustrated in Appendix 3, with adjustments for incomplete data and current program reimbursement.
i. Requested data
As the actuary contracted by FSSA to provide consulting services and associated financial analyses for many aspects of the Indiana Medicaid program (in addition to capitation rate development), Milliman regularly reviews and summarizes eligibility and expenditure data from Optum, FSSA’s enterprise data warehouse (EDW) administrator. The EDW contains over ten years of eligibility and claims data, from both managed care and fee-for-service programs.
The CY 2018 base data experience was reconciled against financial reports and more detailed supplemental financial reporting provided by the MCEs. Audited financial reports specific to the HCC program were not available to the actuary for this rate setting, but the state is working with the MCEs to obtain this information, as required under 42 CFR 438.3(m).
The remainder of this section details the base data and validation processes utilized in the April 2021 through December 2021 capitation rate development. Appendix 3 summarizes the unadjusted base data.
ii. Data used to develop the capitation rates
(a) Description of the data
(i) Types of data
The primary data source used in the development of the April 2021 through December 2021 rates is historical encounter data from the health plans. This data is from the current HCC program, as submitted by the health plans on an ongoing basis. The health plans submit all encounter data to the state, including data for sub-capitated services.
Eligibility data was used to determine the number of members in each rate group during each month of the base data period. Milliman linked eligible members to claims, in order to ensure we only included services provided to covered members. Services were reviewed to ensure only covered services were included in the base data.
Plan financial data was used to check for reasonableness, and to test the adequacy of the reimbursement assumed in rate development, but not as a primary data source.
All claims, encounter, and eligibility data used for this report are stored in the Indiana Medicaid program’s Enterprise Data Warehouse (EDW). An adjustment of approximately $368,000 was made to reflect a commitment to readjudicate a number of specific claims from the base period. These claims were identified by the providers, and the affected health plans have agreed to payment, but the claims have not yet been submitted to the EDW.
(ii) Age of the data
The base period used for April 2021 through December 2021 rate development is January 1, 2018 through December 31, 2018. Milliman included data from this period as reported through June 30, 2019, or with six months run-out of encounter submission beyond the end of the base data period.
(iii) Data sources
The historical encounter data experience used as a primary data source for this report is submitted by the health plans on an ongoing basis. This data is stored in the EDW.
Medicaid enrollment data was submitted by the fiscal agent, DXC, as extracted from the Indiana Client Eligibility System (ICES).
(iv) Sub-contracting

MILLIMAN CLIENT REPORT
HCC re-procurement October 25, 2019 3.741 IMP47-03 6
The health plans who contracted with the state during the base period submit all encounter data to the state, including data for services provided by sub-contractors, including those who are paid using sub-capitation or another risk-sharing arrangement. Sub-contracted services may include pharmacy, vision, dental, imaging, and transportation services for one or more health plans.
Pharmacy encounters submitted to the state for CY 2018 incorporated a paid amount that represented the amount paid to the sub-contractor, in this case a pharmacy benefit manager (PBM), rather than the amount paid to the pharmacy provider. We requested and received information on the aggregate difference between amounts paid to the PBM and amounts paid to the pharmacy provider. The difference, known as spread, represents amounts retained by the PBM as payment for administrative functions such as claims payment and prior authorization approvals. We have used information received on the value of the spread to adjust the base experience to reflect amounts actually paid to the pharmacy provider. The adjustment was provided for the program in aggregate and applied as a flat per script adjustment amount. Due to incomplete information to use for allocation, the adjustment may have inadvertently shifted costs between sub-categories of service (e.g., between generic and brand) or rate groups; however, the total base data adjustment to pharmacy benefit expenditures represents removal of the total spread reported to us by the health plans.
We monitor the encounter data received in order to ensure that data submitted by each health plan, for each service, is consistent with data submitted by other health plans and with the historical experience.
(b) Availability and quality of the data
(i) Steps taken to validate the data
Completeness - process
The actuary, the health plans, the state’s fiscal agent, and the state Medicaid agency all play a role in validating the data for completeness.
The health plans play the initial role, collecting and summarizing data sent to the state. Summaries are reconciled to plan financial records on an ongoing basis.
As encounter data is submitted, the state’s fiscal agent tracks the number of daily claims submitted by each health plan, by program, population, and category of service. The fiscal agent ensures the claims volume is consistent, and alerts other parties if there appears to be a break in submissions.
The state actuary summarizes encounter data quarterly during an encounter data reconciliation process. Summaries by rate group are prepared for each health plan. Each summary illustrates utilization, cost per service, and per member per month cost for the population, stratified by category of service. The format of each quarterly exhibit is very similar to the base data exhibits that are provided as part of this certification (Appendix 3), allowing most data issues to be discovered before the annual capitation rate development process.
The quarterly encounter data reconciliation process involves two years of data, with three months of run-out from the end of the two-year period. For example, a recent report included the following claims:
Services incurred April 1, 2017 through March 31, 2019
Paid on or before June 30, 2019
Submitted on or before July 31, 2019
The actuary compares the encounter reconciliation summaries to summary totals submitted by the health plans. The contract stipulates that plans must reconcile aggregate encounters to within 2.0% or be assessed liquidated damages. This check is performed to make sure there is no break in the data submission chain, that all claims the health plans believe they have submitted are provided to the actuary. The actuary also provides all the individual encounter claims back to the health plans for analysis. This allows them to identify any claims that need to be resubmitted.
Finally, the state provides final review and approval of the reconciliation, both on a quarterly and annual basis.
Accuracy - process

MILLIMAN CLIENT REPORT
HCC re-procurement October 25, 2019 3.741 IMP47-03 7
Checks for accuracy of the data begin with the health plans’ internal auditing and review processes.
When the data is submitted to the fiscal agent, it is subjected to most of the same validation checks that the fiscal agent applies to fee-for-service claims. For example, it must contain a valid Medicaid recipient ID for an individual who was enrolled at the time the service was provided, and assigned to the health plan. It is also checked to ensure it is a covered service under the state plan, and contains a valid provider ID and other codes necessary to provide payment.
The state actuary also reviews the encounter data to ensure each claim is related to a covered individual and a covered service. The actuary reviews the quarterly encounter data reconciliation summaries and the annual base period data summaries to ensure that reported experience for each service is consistent across the health plans and with prior historical periods. Stratification by rate group facilitates this review, as it minimizes the impact of changes in population mix.
Consistency - process
The actuary also compares the encounter data with various types of financial information submitted by each plan. The primary sources are summarized financial submissions, medical loss ratio submissions, and statutory filings.
Finally, the state provides final review and approval of the reconciliation, both on a quarterly and annual basis. On a retrospective basis, the state periodically conducts audits as part of its program integrity review processes.
(ii) Actuary’s assessment
As required by Actuarial Standard of Practice No. 23, Data Quality, we disclose that Milliman has relied upon certain data and information provided by the State of Indiana, Family and Social Services Administration and their vendors, primarily the health plans and the fiscal agent. The values presented in this letter are dependent upon this reliance.
The two health plans contracted during the base data period to provide services to the HCC program have been providing managed care services in Indiana for many years under the HHW and HIP programs. During this time, the plans have generally provided data of an appropriate quality and completeness.
We find the encounter data used to develop the April 2021 through December 2021 capitation rates to be suitable for the purpose of developing actuarially sound rates, Stratified by rate group and category of service, the utilization and unit costs are reasonable and consistent with historical experience.
(iii) Data concerns
We have not identified any concerns with the quality or availability of the data that would prevent us from developing April 2021 through December 2021 capitation rates for the HCC program. We will work with the MCEs to transition paid and allowed amounts reported on pharmacy encounters, moving from amounts paid to the PBM to amounts paid to pharmacy providers, as required under 42 CFR 438.818 for contract periods beginning on or after July 1, 2018.
iii. Data adjustments
Capitation rates were developed from services provided during the base period: January 1, 2018 through December 31, 2018. We performed completion adjustments, reimbursement adjustments, and other program adjustments.
(a) Credibility adjustment
All of the rate group populations, as represented in the base experience, were fully credible.
(b) Completion adjustment
The base period used for April 2021 through December 2021 rate development is the 2018 contract period extending from January 1, 2018 through December 31, 2018, as reported through June 30, 2019.
Milliman developed completion factors based on historical payment patterns observed from three and a half years of historical HCC encounter data experience.

MILLIMAN CLIENT REPORT
HCC re-procurement October 25, 2019 3.741 IMP47-03 8
Methodology
First, the data was stratified by major category of service as listed below. In analyzing the historical HCC claim payment patterns over the last few years, we have not observed material differences in payment patterns between rate cells.
Major category of service
Inpatient hospital non-maternity
Outpatient hospital
Pharmacy
Ancillary o Emergency transportation/NEMT o DME o Dental o Other ancillary
Physician
Inpatient maternity
Physician maternity Claims for each service category stratification were analyzed and formed into lag triangles by paid and incurred month. Claim completion factors were developed for each month of the base experience period, based on historical completion patterns. The monthly completion factors were composited and applied to base period data to estimate the remaining claims liability.
Completion adjustments are illustrated below.
FIGURE 2: CLAIM COMPLETION FACTORS APPLIED TO BASE PERIOD UTILIZATION
Category of Service HCC - Composite
Inpatient hospital non-maternity 1.0000
Outpatient hospital 1.0111
Pharmacy 1.0000
Emergency transportation/NEMT 1.0050
DME 1.0215
Dental 1.0010
Other ancillary 1.0823
Physician 1.0152
Inpatient maternity 1.0050
Physician maternity 1.0384
(c) Errors found in the data
No material errors were found in the data.
(d) Program change adjustments
Reimbursement adjustments
The following reimbursement adjustments were applied to the claims and encounter data.
Hospital services
The HCC health plans are contractually required to reimburse hospital providers at no less than the Medicaid fee-for-service fee schedule. The Medicaid fee schedule for hospitals is set using an upper payment limit methodology. This requirement was effective January 1, 2017 for HCC. Since the minimum required

MILLIMAN CLIENT REPORT
HCC re-procurement October 25, 2019 3.741 IMP47-03 9
reimbursement has changed from what was required during the base period, we have repriced all inpatient and outpatient hospital experience to the current Medicaid fee schedule. The initial gross repriced amount was reduced in order to take into account amounts in the TPL or copay fields of the original claim.
Emergency Room Services
As outlined above, HCC outpatient hospital claims were repriced to the current Medicaid fee schedule. For this repricing, all emergency room claims were priced as though these claims were true emergencies. In practice, we have observed that the MCEs identify and pay a portion of emergency room claims as non-emergency usage. According to the state fee schedule anticipated to be effective for April 2021 through December 2021, for non-emergency usage of the ER, a flat fee of $72.50 should be paid and all other services associated with the claim should be denied. We analyzed plan paid amounts to quantify the portion of base experience claims that were paid at a non-emergency rate. Additional repricing was performed to adjust reimbursement for these claims to the non-emergency rate.
Prescription drugs
Experience for retail prescription drugs reflect aggregate levels paid to pharmacies by the contracted health plans and their PBMs. Pharmacy encounters submitted to the state for CY 2018 reported a paid amount that represented the amount paid to the PBM sub-contractor, rather than the amount paid to the pharmacy provider. We requested and received information on the aggregate difference between amounts paid to the PBM and amounts paid to the pharmacy provider. We have used this information to adjust the base experience to reflect amounts actually paid to the pharmacy provider. The adjustment was provided by each health plan for their HCC program in aggregate and applied as a flat per script adjustment amount. Due to incomplete information to use for allocation, the adjustment may have inadvertently shifted costs between sub-categories of service (e.g., between generic and brand) or rate groups; however, the total base data adjustment to pharmacy benefit expenditures faithfully represents removal of the total spread reported to us by the health plans.
We have also adjusted experience to reflect supplemental rebates reported as received by the health plans in aggregate.
Physician and ancillary services
Experience for physician and ancillary services has not been repriced. However, claims submitted as paid, but with zero-paid amounts, have been adjusted as described below.
Claims with zero-paid amounts: For some claims, we did not receive a valid paid amount on the encounter. Milliman repriced these claims to the current fee schedule. Where this was not possible, for example if the procedure code is manually priced, we repriced the claim to the average cost of the service category, but checked to make sure this was appropriate. For example, Milliman does not reprice claims that are paid at $0 due to third party liability payments.
Minimum fee schedule for faculty physicians (PFAC program)
In the preliminary April 2021 through December 2021 capitation rate development, we have repriced all professional utilization for providers eligible for the Physician Faculty Access to Care (PFAC) program to the CY 2019 enhanced PFAC fee schedule. Upon release of the CY 2021 enhanced PFAC fee schedule, any material impacts will be reflected in adjustments to the capitation rates.
Further detail regarding this program is described in Section I, item 4 of this report.
Dual eligible adjustments
For the dual eligible rate group, reimbursement was further adjusted to reflect payments expected to be recouped after it has been determined that Medicare is the primary payer.
It has been noted that a portion of this population does not appear to be eligible for all Medicare benefits, perhaps because the Medicare eligibility in this program is generally conferred retroactively. For example some members of this population are enrolled in Medicare Part A but not Part B, and a large percentage appear not to have been

MILLIMAN CLIENT REPORT
HCC re-procurement October 25, 2019 3.741 IMP47-03 10
eligible for Part D benefits. The Medicare reimbursement adjustments have been mediated to reflect Medicare eligibility information for historical dual eligible member months.
Third Party Liability
The encounter data reflects actual third party payments (cost avoidance) reported in the coordination of benefits data. Repriced claims reflect reported third party payments, as well as cost sharing reported on the data.
Copayments
The base data is provided net of historical copayments.
Graduate Medical Education payments
Graduate Medical Education (GME) payments for Medicaid stays are not reflected in the base claims experience. The state makes GME payments directly to providers.
High cost drug carve-out
Select high cost drugs will be carved out of the HCC capitation rates for April 2021 through December 2021. Below is a list of the drugs that have been carved out:
Hepatitis C drugs (identified by a GPI-6 of 125350 or 123599)
Hemophilia drugs (identified by a GPI-4 of 8510), including Hemlibra
Spinal muscular atrophy treatments Spinraza and Zolgensma
Muscular dystrophy treatment Exondys 51
CAR-T therapy agents such as Kymriah, Yescarta
Durable genetic therapy treatments such as Luxturna
Vertex cystic fibrosis drugs, including Orkambi, Kalydeco, and Symdeko
These drugs are illustrated in separate line items labeled “Outpatient Carve-Out Drugs”, “Retail Pharmacy Carve-out Drugs”, and Physician Carve-out Drugs” in Appendices 4 and 5. The impact of these drugs was excluded from our completion factor development as well as our projected trend analysis.
Vaccines for children program changes
New reimbursement policies regarding the vaccines for children (VFC) program will effective January 1, 2020. The VFC program supplies providers with free vaccine products that may be administered to any Medicaid eligible child under the age of 19. Under these new policies, vaccines will not be reimbursed, whether they were supplied from VFC stock or private stock. However, a $15.00 administration payment will be made for each vaccine. We have repriced the base data to reflect this policy.
(e) Exclusion of payments or services from the data
The data was reviewed to ensure the exclusion of non-covered services. The procedure codes, revenue codes, or national drug codes on the claims were compared against a list of covered services. No material exclusions were made.

MILLIMAN CLIENT REPORT
HCC re-procurement October 25, 2019 3.741 IMP47-03 11
3. Projected benefit cost and trends This section provides information on the development of projected benefit costs in the capitation rates.
i. Development of Projected Benefit Costs
(a) Description of the data, assumptions, and methodologies
This section of the report outlines the data, assumptions, and methodology used to project the benefit costs to the rating period. The baseline benefit costs as illustrated in Appendix 3: HCC base data summaries, were developed using the following steps:
Stratify base period data by capitation rate cell and category of service
Apply claim completion factors (shown under Completion Adjustment column)
Apply the following reimbursement adjustments (shown under the Reimbursement Adjustment column): o Reimbursement adjustments for hospital services, emergency room services, and zero-paid
physician and ancillary services o PFAC program, VFC program, and dual eligible reimbursement adjustments o Removal of pharmacy spread and rebates from managed care data
The following adjustments are illustrated in Appendix 4: HCC actuarial cost models:
Managed care efficiency adjustments (shown under Managed Care Adj columns)
Removal of carve-out drugs (shown under Additional Adj Utilization column)
VFC program increased utilization adjustment (shown under Additional Adj Utilization column)
Hospice adjustment (shown under Additional Adj Cost column)
Trend (shown under Applied Trend columns)
In Appendix 5: Capitation Rate Summary, we incorporate the following additional capitation rate components:
Third party liability recovery
Non-benefit cost
Material Adjustments
Managed care efficiency adjustments
Milliman applied percentage adjustments to the encounter base experience data to reflect the utilization differential between the base experience and the levels targeted for the managed care environment in April 2021 through December 2021. We developed the targeted managed care utilization estimates through a review and analysis of experience for comparable populations in other Medicaid programs.
Inpatient hospital services – Inpatient hospital admissions were identified as an area where aggregate health plan utilization was above expected experience from similar managed care populations. For confirmation, Milliman identified potentially avoidable admissions using the AHRQ prevention quality indicators. For HCC, managed care efficiency factor reductions represent 15% of potentially avoidable admissions. Reductions to inpatient hospital admissions were also applied to inpatient physician services.
Preventive visit managed care adjustment – Milliman adjusted base year utilization to reflect increased levels corresponding to incentive arrangement targets for Well Baby/Physical exams.
These adjustments, by population and service category, are provided in Appendix 4 in the Managed Care Adj columns.
Removal of carve-out drugs
Experience for carve-out drugs was excluded from capitation rate development by applying a managed care adjustment factor of 0.000 for drugs that are carved out for the full rating period. This adjustment can be found in the Additional Adj Utilization column of Appendix 4.

MILLIMAN CLIENT REPORT
HCC re-procurement October 25, 2019 3.741 IMP47-03 12
Hospice adjustment
Effective January 1, 2019, HCC allows for full hospice coverage, either in a facility or non-facility setting, with no limitation on the number of days. Previously, in-home hospice coverage has been fully covered, but inpatient hospice services are limited to five days. Other facility-based hospice, such as in a nursing home, is not covered under the current contract (prior to January 1, 2019), and members who require such care have been dis-enrolled from HCC and enrolled in the traditional fee-for-service Medicaid program.
To reflect this, we have adjusted the completed data to reflect claims that are expected to be paid under the new policy. We also examined emerging experience in early CY 2019 to see how hospice costs paid for by the MCEs have changed under this new policy. This adjustment was composed of two types of mutually exclusive claims:
1. Additional payments: Hospice services that had previously been denied, because they were not HCC covered services, will be covered on or after January 1, 2019, and therefore would likely be paid to hospice providers. This includes inpatient hospice care after the fifth day, as well as other facility hospice coverage, such as in a nursing facility. Denied claims for inpatient or nursing facility hospice care were identified in the CY 2018 HCC encounter data and were repriced to the state’s fee-for-service fee schedule. A portion of these claims are expected to be paid under the new policy, while a portion will likely continue to be denied for other reasons. After considering the percentage of other hospice claims that were denied, we reflected 75% of this experience in the April 2021 through December 2021 rates.
2. Shifting from fee-for-service to HCC: Members requiring hospice care in a nursing facility will no longer be automatically dis-enrolled from HCC, so a portion of the care that was previously provided under the traditional fee-for-service Medicaid program is expected to be provided through HCC. To quantify this impact, we identified CY 2018 fee-for-service hospice experience for non-dual members who had been enrolled in HCC prior to their transition to fee-for-service. Based on 2019 experience, it appears that a minimal amount of this experience has shifted to HCC, so we have reflected 5% of this experience as an adjustment to the April 2021 through December 2021 capitation rates. While the health plans are not required to pay facility-based hospice providers at the fee-for-service fee schedule, we felt this fee schedule was appropriate to use due to a lack of credible MCE payment data. Based on the small amount of MCE payment data we have, the MCE per day payment amount is at least roughly consistent with fee-for-service reimbursement.
To create the adjustment, we summarized CY 2018 claims that fit one of the two criteria above and converted them to a per member per month cost, by HCC rate cell. Additionally, we added a factor adjustment to each component to reflect the portion of these claims that are actually being paid by the MCEs in early CY 2019. The adjustments were then trended to the midpoint of the April 2021 through December 2021 rating period, using the ancillary trend rate. This adjustment can be found in the Additional Adj Cost column of Appendix 4.
VFC program increased utilization adjustment
The Reimbursement Adjustments section of this report describes a new VFC policy that will be implemented in CY 2020, which will include a $15 administration payment for each VFC vaccine, to better incentivize provider participation in the VFC program. In the base data, we observed that providers did not always bill an administration code for each vaccine if there was no payment due for the administration under the old policy, which previously provided for no administration payment in the context of an E&M visit. Accordingly, we have added a positive utilization adjustment to reflect that additional administration codes are expected to be billed under the new VFC policy. This adjustment can be found in the Additional Adj Utilization column of Appendix 4.
Third party liability recovery
In addition to actual cost avoidance reflected in the encounter data, Milliman assumed later collection of an additional 0.15% of claims for HCC, reflective of recoveries only.
ii. Projected Benefit Cost Trends
This section discusses the data, assumptions, and methodologies used to develop the benefit cost trends, i.e., the annualized projected change in benefit costs from the historical base period (CY 2018) to the April 2021 through

MILLIMAN CLIENT REPORT
HCC re-procurement October 25, 2019 3.741 IMP47-03 13
December 2021 rating period of this certification. We evaluated prospective trend rates using historical experience for the HCC managed care program, as well as external data sources.
(a) Required elements
(i) Data
Milliman relied primarily on historical experience from the HCC managed care populations. The enrollment, claims, and encounter experience was from calendar years 2017, 2018, and 2019, including adjustments for historical completion patterns. However, for pharmacy reimbursement trends, paid amounts on the encounter data were not provided on a consistent basis through the experience period, so we relied more heavily on national average drug acquisition cost trends, adjusted to reflect the mix of drugs utilized in the HCC program.
Other data sources that were referenced include:
National Health Expenditure (NHE) projections developed by the CMS Office of the Actuary, specifically those related to Medicaid. Please note that as these are expenditure projections, projected growth reflects not only unit cost and utilization, but also aggregate enrollment growth and enrollment mix changes such as aging. For trends used in this certification, we are interested only in unit cost and utilization trends, so in general, our combinations of unit cost and utilization trends should be lower than NHE trends. NHE figures and documentation may be found at: https://www.cms.gov/research-statistics-data-and-systems/statistics-trends-and-reports/nationalhealthexpenddata/nationalhealthaccountsprojected.html.
Milliman Trend Guidelines (formerly S&P trend indices) contain commercial cost per unit, utilization, and PMPM indices, stratified by service category, geographic region, and market (small group, large group, etc.) The information from this source was used to better understand how utilization and pharmacy trends in Indiana compare to national trends. This data source is licensed by Milliman.
CVS, Magellan, and Express Scripts drug trend reports: These reports contain information on both historical and projected U.S. drug trends. Where feasible based on report data, we have tried to remove the effect of carved out drugs such as hepatitis C and re-weighted the impact by therapeutic class to better represent covered populations.
Other sources: Milliman also reviewed internal sources that are not publicly available, such as historical experience from Indiana’s fee-for-service program and other programs and trends used by other Milliman actuaries.
(ii) Methodology
For all categories of service, utilization trends were developed, including changes in the amount, duration, and mix of services. For most services, price changes were also developed. However, for hospital services, for which health plans are directed to pay at a minimum fee schedule, an explicit adjustment has already been made to reflect all recent or planned changes in reimbursement from the base period to the rating period.
The utilization, pricing, and per member per month cost data was stratified by month, population and major category of service. The data was adjusted for completion, and hospital claims were normalized to remove Medicaid reimbursement changes.
Carved out drugs were removed from the historical experience before developing pharmacy trends.
(iii) Comparisons
Historical trends should not be used in a simple formulaic manner to determine future trends; a great deal of actuarial judgment is also needed. We did not exclusively rely on historical trend data due to observation of occasional data anomalies or severe changes unlikely to be sustainable through the rating period.
We also referred to the sources listed in the prior section, considered changing practice patterns, the impact of reimbursement changes on utilization in this specific population, and shifting population mix.
We adjusted the trends derived from historical experience in cases where the resulting trends did not appear reasonably sustainable, or were not within consensus parameters derived from other sources. Other reasons for

MILLIMAN CLIENT REPORT
HCC re-procurement October 25, 2019 3.741 IMP47-03 14
adjustments were to remove the impact of one-time events or to reflect additional information on future or recent events (such as patent expirations for pharmaceuticals).
(iv) Chosen trends
The chosen PMPM trends are illustrated by rate cell and category of service in Figure 6.
When the HCC managed care program was implemented in CY 2015, program goals centered around providing comprehensive preventive care to members, better managing chronic and complex conditions, and reducing emergency and other acute high cost care. Managed care efficiency potential was estimated at 10% to 15% of expenditures overall. Although the program did not immediately achieve these goals, it has experienced steady and consistent utilization reductions for most services, sometimes offset or partially offset by higher acuity service mix and reimbursement, most notably in outpatient hospital services and retail pharmacy. The negative utilization trends reflect long-standing and sustained experience reductions that have occurred and continue to occur through the beginning of CY 2019, mitigated slightly to provide for the possibility of deceleration during CY 2020 and CY 2021.
Another favorable trend we have observed is a reduction in emergency transportation services paired with an increase in non-emergency transportation. Finally, the relatively high trends for physician services in the HCC child and HCC foster populations is primarily related in an increase in ABA services.
(b) Benefit cost trend components
Figures 3, 4, and 5 illustrate the utilization, mix of service, and cost trends used to develop the rates in this report. Figure 6 illustrates the PMPM trend, which combines the trend components in Figures 3, 4, and 5.
FIGURE 3: ANNUALIZED UTILIZATION TREND RATES
Category of Service
Adults & Duals
Children & Fosters
D1 & D3 D2 & D4
Inpatient Hospital (3.0%) (2.0%) Outpatient Hospital (1.0%) (1.0%) Pharmacy (3.0%) (1.0%) Emergency Transportation 2.5% (8.0%) NEMT 2.0% 8.0% Dental (2.0%) 0.0% Ancillary (1.0%) 4.0% Physician (1.0%) 4.6%
FIGURE 4: ANNUALIZED SERVICE MIX TREND RATES
Category of Service
Adults & Duals
Children & Fosters
D1 & D3 D2 & D4
Inpatient Hospital 2.5% (1.0%) Outpatient Hospital 6.0% 0.0% Pharmacy 7.5% 0.5% Emergency Transportation (4.0%) (2.0%) NEMT (2.5%) 2.0% Dental 1.0% (0.5%) Ancillary (2.0%) (2.0%) Physician 0.0% 2.6%

MILLIMAN CLIENT REPORT
HCC re-procurement October 25, 2019 3.741 IMP47-03 15
FIGURE 5: ANNUALIZED REIMBURSEMENT TREND RATES
Category of Service
Adults & Duals
Children & Fosters
D1 & D3 D2 & D4
Inpatient Hospital 0.0% 0.0% Outpatient Hospital 0.0% 0.0% Pharmacy 0.0% (0.5%) Emergency Transportation 0.0% 0.0% NEMT 0.0% 0.0% Dental 0.0% 1.5% Ancillary 1.0% 0.0% Physician 1.0% 0.0%
FIGURE 6: ANNUALIZED PMPM (COMBINED) TREND RATES
Category of Service
Adults & Duals
Children & Fosters
D1 & D3 D2 & D4
Inpatient Hospital (0.6%) (3.0%)
Outpatient Hospital 4.9% (1.0%)
Pharmacy 4.3% (1.0%)
Emergency Transportation (1.6%) (9.8%)
NEMT (0.6%) 10.2%
Dental (1.0%) 1.0%
Ancillary (2.0%) 1.9%
Physician (0.0%) 7.2%
Section I, item 3.B.iii.b of the Medicaid Managed Care Rate Development Guide requests the benefit cost trends be separated into the following components:
1. Changes in price 2. Changes in utilization, including service mix
For the first component, changes in price, please refer to Figure 5. For the change in utilization, including service mix, the components in Figures 3 and 4 should be combined.
The trend is applied to the actuarial cost model in Appendix 4 of the certification, under the columns labeled Applied Trend. Please note the following about the values displayed in Appendix 4:
The trend components are applied to the cost model as follows: o The utilization component is applied to the Utilization per 1,000 values o The service mix and reimbursement components are both applied to the Cost per Unit values
The Applied Trend column displays a factor that represents 37.5 months of trend, rather than an annual trend rate
o The utilization portion of the Applied Trend column displays 37.5 months of the utilization trend rates shown above, rather than an annual trend rate.
o The cost portion of the Applied Trend column displays 37.5 months of reimbursement and service mix trend.
(c) Variation
To limit the variation in benefit cost that is present across the HCC population as a whole, we developed trends by major population and major category of service.

MILLIMAN CLIENT REPORT
HCC re-procurement October 25, 2019 3.741 IMP47-03 16
(d) Material adjustments
Historical trends should not be used in a simple formulaic manner to determine future trends; a great deal of actuarial judgment is also needed. The actuary also referred to the sources listed in the prior section, considered changing practice patterns, the impact of reimbursement changes on utilization in this specific population, and shifting population mix.
Milliman made adjustments to the trends derived from historical experience in cases where the resulting trends did not appear reasonably sustainable, or were not within consensus parameters derived from other sources. Other reasons for adjustments were to remove the impact of one-time events or to reflect additional information on future or recent events (such as patent expirations for pharmaceuticals).
Material adjustments include the following:
HCC – Adults & Duals o Negative service mix trend for dental: Substantially negative trends for dental were adjusted upward
to reflect the expectation that declines will not be sustained through the rating period.
HCC – Children & Fosters o Negative service mix trends for outpatient hospital, pharmacy, and NEMT: Negative trends for
outpatient hospital, pharmacy, and NEMT were adjusted upward to reflect the expectation that declines will not be sustained through the rating period.
Positive service mix trend for Emergency transportation: Positive trends for emergency transportation were adjusted downward to reflect the expectation that the observed increases would not be sustained through the rating period.
(e) Any other adjustments
(i) Impact of managed care
We did not adjust the trend rates to reflect a managed care impact on utilization or unit cost. The capitation rates have an explicit adjustment for the managed care adjustments.
(ii) Trend changes other than utilization and cost
We did not adjust the benefit cost trend for changes other than utilization or unit cost.
iii. Retrospective Eligibility Periods
(a) MCO responsibility
MCOs are not responsible for paying claims incurred during the retrospective eligibility period.
(b) Claims treatment
Claims for retrospective eligibility periods are not summarized in the base data.
(c) Enrollment treatment
There is no retrospective eligibility related to managed care enrollment.
4. Special contract provisions related to payment i. Incentive arrangements
There are no incentive payments included in the HCC program for the April 2021 through December 2021 rating period.
ii. Withhold arrangements
(a) Description of the Withhold Arrangement
(i) Time period and purpose

MILLIMAN CLIENT REPORT
HCC re-procurement October 25, 2019 3.741 IMP47-03 17
The withhold arrangement is generally measured on a calendar year basis, in line with the rating period. For the first nine months of the contract, FSSA may adjust measures to reflect the 9-month measurement period. For HCC, the withhold measure evaluates quality-based performance in health screens/assessments for new members and inpatient behavioral health follow-up.
(ii) Description of total percentage withheld
In CY 2021, withholds constitute 1.85% of the certified rates for HCC. FSSA will determine the amount of the withhold that was earned back based on review of each MCO’s HEDIS data and the MCO’s compliance with the quality measures established in each MCO’s contract with FSSA.
The capitation rates shown in this letter are illustrated before offset for the withhold amount; however, the April 2021 through December 2021 capitation rates documented in this report are actuarially sound after adjustment for the amount of the withhold not expected to be earned.
(iii) Estimate of percent to be returned
During CY 2017, for HCC, approximately 31% of the amount withheld was returned to the plans.
We have estimated that approximately 60% to 70% of the April 2021 through December 2021 withhold is reasonably achievable. This was estimated based on a review of historical plan performance, consideration of changes in the measures for April 2021 through December 2021, and a review of the measures themselves. In addition to reviewing average amounts returned, we also discussed performance expectations with OMPP and took note of measures in which one plan appeared to be underperforming relative to higher performing plans.
(b) Actuarial soundness
The preliminary capitation rates documented in this report minus the portion of the withhold that is not reasonably achievable are actuarially sound. Although we have estimated that a portion of the withhold may not be reasonably achievable, additional funding was provided in the capitation rates through a managed care adjustment to provide an increase for preventive visit utilization. This was done to ensure the health plans have the resources they need to fully meet the specific quality metrics related to the withhold.
iii. Risk sharing mechanisms
(a) Description of Risk-sharing Mechanism
The contract does not contain any other risk-sharing mechanisms, such as a risk corridor or large claims pool.
(b) Medical Loss Ratio
Description
The state requires health plans to maintain a 90% minimum medical loss ratio for HCC in 2021.
The medical loss ratio (MLR) is calculated in a manner consistent with 42 CFR 438.8. Items should reflect payments or revenue for the contract year on an incurred basis (not paid basis).
The numerator includes the following:
Payments to providers for services and supplies
Health quality improvement expenditures
The denominator includes:
Contracted capitation payments and incentive and withhold payments earned
Reductions for taxes, licensing, and regulatory fees. This includes the health insurer assessment fee.
Credibility adjustments are to be implemented as described in the medical loss ratio credibility adjustment CMS bulletin, dated July 31, 2017.

MILLIMAN CLIENT REPORT
HCC re-procurement October 25, 2019 3.741 IMP47-03 18
To avoid material issues with claim liability reserves, a preliminary determination of the MLR is performed with six months of run-out, but the final MLR is determined with 18 months of run-out. After 18 months, no material reserves should remain.
When a plan’s medical loss ratio falls below the minimum, 100% of capitation revenue below the minimum will be recouped.
(c) Reinsurance Requirements and Effect on Capitation Rates
The contract does not require health plans to purchase commercial reinsurance. However, it does require health plans to report on any reinsurance agreement they have entered into, and to provide satisfactory assurance that provisions made to protect against insolvency are adequate.
iv. Delivery system and provider payment initiatives
CY 2018 and CY 2019 §438.6(c) pre-prints have been approved for both of the directed payments arrangements listed above. Pre-prints for CY 2021 are not expected to be materially different.
Utilization of the following provider payment initiatives is included in the capitation rates: In all rate cells, affected services were repriced to the state-directed reimbursement level (the Medicaid fee schedule).
Minimum fee schedule for hospital providers
The HCC health plans are contractually required to reimburse hospital providers at no less than the Medicaid fee-for-service fee schedule. The Medicaid fee schedule for hospitals is set using an upper payment limit methodology.
This payment arrangement is consistent with the pre-print reviewed by CMS. Rates for all rate cells certified in this report are affected by this directed payment arrangement.
Minimum fee schedule for faculty physicians (PFAC program)
The state plan amendment (SPA) for the Physician Faculty Access to Care (PFAC) program became effective April 1, 2015. Enhanced payments under the fee-for-service program have been made under the current SPA for services provided beginning on April 1, 2015.
Eligible providers are faculty physicians or those under their supervision who are employed by one of the following:
Indiana University Health, Inc. (IU)
Health and Hospital Corporation of Marion County and its affiliates (Eskenazi)
Providers must also be licensed in the State of Indiana and enrolled as an Indiana Medicaid provider.
The enhanced payment is the average commercial rate, as rebased every three years, and adjusted based on performance metrics. For calendar years 2018 through 2020, the average commercial rate is 148.40% of Medicare reimbursement. The state is currently using performance metrics listed in the SPA, which relate to access.
In the preliminary April 2021 through December 2021 capitation rate development, we have repriced all professional utilization for eligible providers to the CY 2019 directed fee schedule. Upon release of the CY 2021 enhanced PFAC fee schedule, any material impacts will be included as adjustments to the rates.
v. Pass-through payments
There are no pass-through payments in the HCC managed care program.

MILLIMAN CLIENT REPORT
HCC re-procurement October 25, 2019 3.741 IMP47-03 19
5. Projected non-benefit costs i. Overview
In accordance with 42 CFR 438.5(e), the non-benefit component of the capitation rate includes reasonable, appropriate and attainable expenses related to MCO operation of the HCC managed care program.
The remainder of Section I, item 5 provides documentation of the data, assumptions and methodology that we utilized to develop the non-benefit cost component of the capitation rate.
ii. PMPM versus percentage
For HCC, Milliman has developed the non-benefit cost as a combination of a fixed (PMPM) and variable (percentage) components. This recognizes certain costs as fixed PMPM costs, while others vary with the average claims cost. For HCC Duals, the administrative cost allowance is the same as for HCC Adults.
Variable component
For HCC, the variable non-benefit cost is 6.00%.
The percentages illustrated above are applied as a percentage of the total rate before adding the fixed component. For example, the value of a 5.0% non-benefit component on a $100 benefit cost would be 5%* ($100/(1-5%)) = $5.26.
Fixed component
For HCC, the fixed non-benefit cost is $20.00 PMPM.
The fixed portion of the non-benefit cost is added to the rate after the variable portion has been calculated.
iii. Development of non-benefit costs
A ground-up cost model build-up was used to estimate the non-benefit costs associated with administration of the HCC program. The cost model was built starting with the statement of work from the HCC contracts. It itemizes MCE requirements along with estimates for the resources needed to comply, including both staffing and non-staff costs. Inputs were estimated from MCE reporting, BLS data and other publicly available benchmarks, and from discussions with stakeholders and others with expertise in MCE administration.
In addition to funding for contract requirements, an additional amount of funding was added to allow MCEs the flexibility to spend dollars on cost effective or value-added services. This is itemized as QI/value added funding.
Finally, additional funding was added to provide for margin, taxes and fees. The Health Insurance Providers Fee is not included at this time and will be reflected retrospectively.
(a) Description of the data, assumptions, and methodologies
Data
The primary data sources used in the development of the April 2021 through December 2021 non-benefit costs are listed below:
Contract requirements for the HCC program
MCO administrative reporting, such as call volume, case management caseloads, and IRO hearings.
CY 2018 administrative costs as reported in the financial reporting completed by each MCO. We also compared to reporting for past years to check for reasonableness and consistency.
Statutory financial statement data for each of the MCOs.
Average non-benefit costs from the financial statements of Medicaid MCOs nationally, as summarized by Palmer, Pettit, and McCulla. A link to the 2018 report published in June 2019 (National Summary of Medicaid MCO Financial Results) is here:
http://www.milliman.com/insight/2019/Medicaid-managed-care-financial-results-for-2018/

MILLIMAN CLIENT REPORT
HCC re-procurement October 25, 2019 3.741 IMP47-03 20
Assumptions and methodology
In developing non-benefit costs, we reviewed contract requirements for the program, along with historical administrative expenses for the managed care program and national Medicaid MCO administrative expenses. Historical reported administrative expenses by MCO were also considered. In developing the final administrative cost, the actuary has considered the following:
Size: each of the participating health plans is expected to be assigned membership of a size to realize economies of scale, and is expected to have adequate enrollment in all blocks of business
Tenure: the non-benefit costs developed in this report assumes each of the participating health plans has significant Medicaid experience
Demographic mix of enrollees: generally a healthy population of adults and children, but with sub-populations that require additional attention
Covered services: the covered benefits are comprehensive, including pharmacy and dental for all populations. In addition, mandated reimbursement is robust compared with the average Medicaid program
Nature of the program: the actuary has taken into account the specific administrative requirements of the HCC program
Minimum medical loss ratios required by the state
Historical administrative cost information provided by the health plans
The administrative cost model includes $2.20 per claim as an estimate of the basic administrative cost related to pharmacy administration for April 2021 through December 2021. In addition, the cost model provides funding for pharmacy director positions at both MCEs and six pharmacist (PharmD) professionals to be directly hired by the MCEs and dedicated to the HCC program. Any value-added services that the MCE wishes to provide, whether related to pharmacy or other services, may be funded through the flexible QI/value-added funding included in the cost build-up.
iv. Non-benefit costs, by cost category
The non-benefit cost is estimated to be allocated by category approximately as follows:
FIGURE 7: NON-BENEFIT COST ALLOCATION
Component PMPM Percentage
Administrative costs $ 20.00 2.50%
Additional QI/value added - 2.00%
Taxes, fees, and assessments - 0.10%
Contribution to reserves, risk margin, and cost of capital - 1.40%
Other material non-benefit costs - 0.00%
Total non-benefit cost $ 20.00 6.00%
v. Health insurance providers fee
(a) Whether the fee is incorporated in the rates
The State of Indiana’s historical policy is to retroactively increase the capitation rates to reimburse affected entities for actual fees paid during the contract period, including the tax impact of the fee. This fee is generally due September 30 of each year, and the tax impact may be known shortly after the end of the calendar year. Reimbursement has historically been performed on a retroactive basis in the spring following the contract year, with reimbursement determined as a percentage of all capitation paid during the contract year. Accordingly, the health insurance providers fee is not calculated at this time and is not reflected in the preliminary capitation rates.

MILLIMAN CLIENT REPORT
HCC re-procurement October 25, 2019 3.741 IMP47-03 21
(b) Fee year or data year
The amount to be added to the rates will be based on the fee paid during April 2021 through December 2021 (fee year). However, no fee has been incorporated in the April 2021 through December 2021 capitation rates at this time.
(c) Determination of fee impact to rates
The April 2021 through December 2021 capitation rates that will initially be paid to plans will not reflect the health insurance providers fee. The reimbursement adjustment will be implemented as a flat percentage increase, applied to all rate groups for the full rating period (April 1, 2021 through December 31, 2021). The percentage increase will only apply to plans that are subject to the fee, and the percentage may vary by affected entity.
The percentage adjustment applied to the April 2021 through December 2021 capitation rates is intended to reimburse affected entities for actual fees assessed as payable by September 30, 2021 and allocated to Indiana Medicaid programs, including any additional income tax that may be payable. The percentage adjustment applicable to each plan will be determined by dividing item 1 by item 2 below:
1. Sum of the actual allocated health insurance providers fee and the actual tax impact for each affected entity 2. Actual base capitation revenue for each entity, after any risk adjustment payments, but before the initial
health insurance providers fee rate adjustment
(d) Timing of adjustment for health insurance providers fee
The initial April 2021 through December 2021 capitation rates that will be paid to the MCEs will not reflect the incorporation of the health insurance providers fee. After the actual amount of the health insurance providers fee is known, the capitation rates will be retrospectively adjusted as appropriate to include the health insurance providers fee. We anticipate completing the analysis to amend the April 2021 through December 2021 rates in early 2022.

MILLIMAN CLIENT REPORT
HCC re-procurement October 25, 2019 3.741 IMP47-03 22
6. Risk adjustment and acuity adjustments This section provides information on the risk adjustment included in the contract.
i. Overview
In accordance with 42 CFR 438.5(g), we follow the rate development standards related to budget neutral risk adjustment for the HCC managed care program. To the extent that each of the contracted managed care entities has
sufficient prior year data on its enrolled population, the composite rates will be prospectively risk adjusted by health
plan to reflect estimated prospective morbidity differences in the underlying population enrolled with each health plan. However, if one or more of the contracted entities does not have sufficient prior year data on its members, the state reserves the right to perform retrospective risk adjustment, in a manner cost neutral to the state. The state also reserves the right to change risk adjustment models, tools, and the data periods used.
ii. Cost neutral risk adjustment
(a) Data and adjustments
Retrospective risk adjustment
If a new health plan enters the HCC program effective April 2021, the state will likely perform retrospective risk adjustment during the first rating period.
Retrospective risk adjustment will utilize claims and diagnosis information from the rating period. Scored members must have at least six months of enrollment during the rating period.
Prospective risk adjustment
To the extent sufficient prior period data is available for members in all MCEs, the state intends to perform prospective risk adjustment. Prospective risk adjustment will utilize a snapshot date of in mid-to-late 2020. Scored members must have at least six months of enrollment during the base data period.
For the base data period, Milliman plans to use a 12-month period from 2019 or 2020. In deciding on the base period, we will take into account completion and enrollment patterns. Risk adjustment results are more reliable if the average scored member has a longer average enrollment period during the base period.
There will be no risk adjustment applied to the dual rate group.
(b) Risk adjustment model
Milliman will develop risk scores using the Chronic Illness and Disability System and Medicaid Rx (CDPS + MRx), version 6.4.
This model uses medical diagnosis codes and pharmacy NDC data to assign each scored member to one of 11 age/gender categories and applicable disease categories. This model is intended for use with Medicaid populations.
For April 2021 through December 2021, Milliman is anticipating using customized weights specific to the HCC program, its members, covered benefits, and reimbursement.
(c) Risk adjustment methodology
Milliman will perform cost neutral risk adjustment within rate groups.
The risk adjustment will be performed using the following steps.
1. Raw risk scores: Milliman will aggregate scored members by health plan and by rate group or composite rate group. Within each rate group or composite rate group, average raw risk scores for each health plan will be developed.
2. Normalization of raw risk scores: Within each rate group or composite rate group, average raw risk scores for each health plan will be normalized to 1.000.

MILLIMAN CLIENT REPORT
HCC re-procurement October 25, 2019 3.741 IMP47-03 23
3. Credibility: Milliman will use a credibility threshold of 1,000 scored members (full credibility). When a health plan had less than 1,000 scored members in a rate group, we will apply a credibility factor adjustment. The credibility factor adjustment is limited to +/-7.5%.
4. Normalization: Within each rate group, average credibility-adjusted scores for each health plan will be normalized to 1.000 to achieve overall cost neutrality for the state.
Final risk scores will be applied to the capitation rates specific to each rate group and health plan.

MILLIMAN CLIENT REPORT
HCC re-procurement October 25, 2019 3.741 IMP47-03 24
Limitations The information contained in this report has been prepared for the State of Indiana, Family and Social Services Administration (FSSA) to provide documentation of the development of preliminary rates for the 2021 Hoosier Care Connect (HCC) program re-procurement. The data and information presented may not be appropriate for any other purpose.
It is our understanding that the information contained in this letter will be shared with potential bidders and may be utilized in a public document. Any distribution of the information should be in its entirety. Any user of the data must possess a certain level of expertise in actuarial science and healthcare modeling so as not to misinterpret the information presented.
Milliman makes no representations or warranties regarding the contents of this correspondence to third parties. Likewise, third parties are instructed that they are to place no reliance upon this correspondence prepared for FSSA by Milliman that would result in the creation of any duty or liability under any theory of law by Milliman or its employees to third parties.
Milliman has relied upon certain data and information provided by the State of Indiana, Family and Social Services Administration and their vendors, primarily the managed care encounter data and self-reported data provided to FSSA and provided to Milliman by the fiscal agent or directly by the health plans. The values presented in this letter are dependent upon this reliance. To the extent that the data was not complete or was inaccurate, the values presented in our report will need to be reviewed for consistency and revised to meet any revised data.
It should be emphasized that capitation rates are a projection of future costs based on a set of assumptions. Results will differ if actual experience is different from the assumptions contained in this report.
The services provided for this project were performed under the signed Consulting Services Agreement between Milliman and FSSA approved December 5, 2018.
Guidelines issued by the American Academy of Actuaries require actuaries to include their professional qualifications in all actuarial communications. The actuaries preparing this report are members of the American Academy of Actuaries, and meet the qualification standards for performing the analyses in this report.

HCC re-procurement 25 October 25, 2019 3.741 IMP47-03
Appendix 1: Preliminary April 2021 through December 2021 Rates

State of IndianaFamily and Social Services AdministrationProcurement Rate Model DevelopmentAppendix 1 - Certified rates
Rate CategoryProjected MCE
Member MonthsCY 2021
Capitation RateD1 HCC - Adults 535,788 $1,518.05D2 HCC - Children 194,501 760.91 D4 HCC - Fosters 103,497 327.16 D3 HCC - Duals 4,143 699.78 HCC Composite 837,929 $ 1,191.16
Appendix 1Milliman, Inc.
Page 1 of 1

HCC re-procurement 26 October 25, 2019 3.741 IMP47-03
Appendix 2: Covered services

State of IndianaFamily and Social Services AdministrationProcurement Rate Model DevelopmentAppendix 2 - Covered Services
Category Sortkey Major Service Category Service Category Detail Unit Measure
101 Inpatient Hospital Medical/Surgical/Non-Delivery Maternity Days102 Inpatient Hospital Well Newborn Days601 Inpatient Hospital Inpatient Maternity Delivery Days103 Inpatient Hospital Institution of Mental Disease (IMD) Days104 Inpatient Hospital Behavioral Health Days105 Inpatient Hospital Other Inpatient Days201 Outpatient Hospital Emergency Room Claim Lines202 Outpatient Hospital Outpatient Pharmacy Claim Lines203 Outpatient Hospital Outpatient Carve-Out Drugs Claim Lines204 Outpatient Hospital Other Outpatient Claim Lines301 Pharmacy Generic Drugs Claim Lines302 Pharmacy Brand Drugs Claim Lines303 Pharmacy Specialty Drugs Claim Lines304 Pharmacy Retail Pharmacy Carve-Out Drugs Claim Lines305 Pharmacy Other Drugs Claim Lines401 Ancillaries Emergency Transportation Trips407 Ancillaries NEMT Trips402 Ancillaries DME Claim Lines403 Ancillaries Dental Claim Lines404 Ancillaries Nursing Home Days405 Ancillaries Hospice Days406 Ancillaries Home Health Claim Lines501 Physician Inpatient and Outpatient Surgery Claim Lines502 Physician Office Visits/Consults Claim Lines503 Physician Well Baby Exams/Physical Exams Claim Lines504 Physician Hospital Inpatient Visits Claim Lines505 Physician Emergency Room Visits Claim Lines602 Physician Physician Maternity Delivery Claim Lines603 Physician Physician Maternity Non-delivery Claim Lines506 Physician Radiology Claim Lines507 Physician Pathology Claim Lines508 Physician Outpatient Behavioral Health Claim Lines509 Physician Vision Claim Lines510 Physician Office Administered Drugs Claim Lines511 Physician Physician Carve-Out Drugs Claim Lines512 Physician Other Professional Claim Lines
Appendix 2Milliman, Inc.
Page 1 of 1

HCC re-procurement 27 October 25, 2019 3.741 IMP47-03
Appendix 3: HCC base data summaries

State of IndianaFamily and Social Services AdministrationProcurement Rate Model DevelopmentAppendix 3 - Base data summaries
D1 HCC - Adults Base Data Member Months: 715,051
Repriced Base Data Completed Base Data
Category of ServiceUtilizationper 1,000
Cost perUnit PMPM
Completion Adjustment
Utilizationper 1,000
Cost perUnit PMPM
Inpatient HospitalMedical/Surgical/Non-Delivery Maternity 1,295.7 $ 3,077.97 $ 332.34 1.0000 1,295.7 $ 3,077.97 $ 332.34Well Newborn - - - 1.0000 - - - Inpatient Maternity Delivery 23.0 2,089.51 4.01 1.0050 23.2 2,089.51 4.03 Institution of Mental Disease (IMD) 81.1 971.07 6.56 1.0000 81.1 971.07 6.56 Behavioral Health 338.7 1,009.59 28.49 1.0000 338.7 1,009.59 28.49 Other Inpatient 31.5 3,594.46 9.43 1.0000 31.5 3,594.46 9.43
Subtotal Inpatient Hospital 1,770.0 $ 2,581.97 $ 380.84 1,770.1 $ 2,581.94 $ 380.86
Outpatient HospitalEmergency Room 1,410.8 $ 142.60 $ 16.76 1.0111 1,426.5 $ 142.60 $ 16.95Outpatient Pharmacy 3,289.9 363.70 99.71 1.0111 3,326.5 363.70 100.82 Outpatient Carve-Out Drugs 0.1 17,559.99 0.10 1.0111 0.1 17,559.99 0.10 Other Outpatient 17,794.2 114.53 169.84 1.0111 17,992.1 114.53 171.72
Subtotal Outpatient Hospital 22,494.9 $ 152.79 $ 286.41 22,745.1 $ 152.79 $ 289.59
PharmacyGeneric Drugs 39,782.6 $ 12.11 $ 40.13 1.0000 39,782.6 $ 12.11 $ 40.13Brand Drugs 7,691.0 406.17 260.32 1.0000 7,691.0 406.17 260.32 Specialty Drugs 349.6 3,314.68 96.56 1.0000 349.6 3,314.68 96.56 Retail Pharmacy Carve-Out Drugs 0.3 27,879.07 0.58 1.0000 0.3 27,879.07 0.58 Other Drugs 52.4 50.20 0.22 1.0000 52.4 50.20 0.22
Subtotal Pharmacy 47,875.8 $ 99.71 $ 397.82 47,875.8 $ 99.71 $ 397.82
AncillariesEmergency Transportation 433.6 $ 181.74 $ 6.57 1.0050 435.8 $ 181.74 $ 6.60NEMT 4,307.7 48.37 17.36 1.0050 4,329.4 48.37 17.45 DME 2,732.9 104.80 23.87 1.0215 2,791.5 104.80 24.38 Dental 1,852.1 87.30 13.47 1.0010 1,854.0 87.30 13.49 Nursing Home 115.3 213.24 2.05 1.0823 124.8 213.24 2.22 Hospice 255.7 169.17 3.60 1.0823 276.7 169.17 3.90 Home Health 1,184.6 84.01 8.29 1.0823 1,282.0 84.01 8.98
Subtotal Ancillaries 10,881.8 $ 82.95 $ 75.22 11,094.1 $ 83.30 $ 77.01
PhysicianInpatient and Outpatient Surgery 1,587.9 $ 194.76 $ 25.77 1.0152 1,612.1 $ 194.76 $ 26.16Office Visits/Consults 6,999.2 69.40 40.48 1.0152 7,105.8 69.40 41.10 Well Baby Exams/Physical Exams 456.7 51.75 1.97 1.0152 463.6 51.75 2.00 Hospital Inpatient Visits 3,299.7 84.00 23.10 1.0152 3,349.9 84.00 23.45 Emergency Room Visits 1,588.7 80.60 10.67 1.0152 1,612.9 80.60 10.83 Physician Maternity Delivery 12.2 514.51 0.52 1.0384 12.7 514.51 0.54 Physician Maternity Non-delivery 80.4 81.13 0.54 1.0384 83.5 81.13 0.56 Radiology 3,938.2 34.62 11.36 1.0152 3,998.2 34.62 11.54 Pathology 5,753.6 17.11 8.20 1.0152 5,841.3 17.11 8.33 Outpatient Behavioral Health 2,754.1 40.49 9.29 1.0152 2,796.1 40.49 9.43 Vision 1,187.8 43.77 4.33 1.0152 1,205.9 43.77 4.40 Office Administered Drugs 1,435.7 214.35 25.65 1.0152 1,457.6 214.35 26.04 Physician Carve-Out Drugs 16.4 6,319.19 8.63 1.0152 16.6 6,319.19 8.76 Other Professional 4,404.8 40.40 14.83 1.0152 4,471.8 40.40 15.06
Subtotal Physician 33,515.4 $ 66.36 $ 185.35 34,028.0 $ 66.37 $ 188.20
Total Claims/Benefit Cost 116,538.0 $ 136.50 $ 1,325.63 117,513.1 $ 136.17 $ 1,333.48
D1Milliman, Inc.
Page 1 of 4

State of IndianaFamily and Social Services AdministrationProcurement Rate Model DevelopmentAppendix 3 - Base data summaries
D2 HCC - Children Base Data Member Months: 266,628
Repriced Base Data Completed Base Data
Category of ServiceUtilizationper 1,000
Cost perUnit PMPM
Completion Adjustment
Utilizationper 1,000
Cost perUnit PMPM
Inpatient HospitalMedical/Surgical/Non-Delivery Maternity 425.0 $ 2,974.38 $ 105.35 1.0000 425.0 $ 2,974.38 $ 105.35Well Newborn - - - 1.0000 - - - Inpatient Maternity Delivery 9.6 2,024.13 1.62 1.0050 9.7 2,024.13 1.63 Institution of Mental Disease (IMD) 145.8 948.78 11.53 1.0000 145.8 948.78 11.53 Behavioral Health 106.7 949.24 8.44 1.0000 106.7 949.24 8.44 Other Inpatient 6.9 4,689.93 2.71 1.0000 6.9 4,689.93 2.71
Subtotal Inpatient Hospital 694.1 $ 2,241.55 $ 129.65 694.1 $ 2,241.54 $ 129.66
Outpatient HospitalEmergency Room 751.6 $ 137.18 $ 8.59 1.0111 759.9 $ 137.18 $ 8.69Outpatient Pharmacy 875.6 281.66 20.55 1.0111 885.3 281.66 20.78 Outpatient Carve-Out Drugs 0.0 - - 1.0111 0.0 - - Other Outpatient 7,825.7 105.72 68.94 1.0111 7,912.7 105.72 69.71
Subtotal Outpatient Hospital 9,452.9 $ 124.52 $ 98.09 9,558.1 $ 124.52 $ 99.18
PharmacyGeneric Drugs 12,964.1 $ 36.79 $ 39.74 1.0000 12,964.1 $ 36.79 $ 39.74Brand Drugs 2,176.9 425.88 77.26 1.0000 2,176.9 425.88 77.26 Specialty Drugs 210.5 3,416.08 59.91 1.0000 210.5 3,416.08 59.91 Retail Pharmacy Carve-Out Drugs 1.1 30,673.82 2.88 1.0000 1.1 30,673.82 2.88 Other Drugs 187.2 24.89 0.39 1.0000 187.2 24.89 0.39
Subtotal Pharmacy 15,539.7 $ 139.13 $ 180.18 15,539.7 $ 139.13 $ 180.18
AncillariesEmergency Transportation 123.4 $ 229.12 $ 2.36 1.0050 124.0 $ 229.12 $ 2.37NEMT 984.9 57.49 4.72 1.0050 989.8 57.49 4.74 DME 2,701.3 172.75 38.89 1.0215 2,759.3 172.75 39.72 Dental 4,040.6 47.63 16.04 1.0010 4,044.6 47.63 16.05 Nursing Home 1.0 210.06 0.02 1.0823 1.1 210.06 0.02 Hospice 35.6 177.56 0.53 1.0823 38.5 177.56 0.57 Home Health 551.1 246.17 11.30 1.0823 596.4 246.17 12.23
Subtotal Ancillaries 8,437.9 $ 105.03 $ 73.85 8,553.8 $ 106.22 $ 75.71
PhysicianInpatient and Outpatient Surgery 394.3 $ 255.26 $ 8.39 1.0152 400.3 $ 255.26 $ 8.51Office Visits/Consults 3,854.5 66.04 21.21 1.0152 3,913.2 66.04 21.53 Well Baby Exams/Physical Exams 1,361.7 40.87 4.64 1.0152 1,382.4 40.87 4.71 Hospital Inpatient Visits 1,065.6 92.20 8.19 1.0152 1,081.8 92.20 8.31 Emergency Room Visits 746.3 73.81 4.59 1.0152 757.6 73.81 4.66 Physician Maternity Delivery 5.5 550.27 0.25 1.0384 5.7 550.27 0.26 Physician Maternity Non-delivery 34.9 78.68 0.23 1.0384 36.2 78.68 0.24 Radiology 1,127.6 28.30 2.66 1.0152 1,144.8 28.30 2.70 Pathology 1,516.6 15.08 1.91 1.0152 1,539.7 15.08 1.93 Outpatient Behavioral Health 7,013.6 152.68 89.24 1.0152 7,120.4 152.68 90.59 Vision 1,121.5 39.63 3.70 1.0152 1,138.6 39.63 3.76 Office Administered Drugs 645.7 341.76 18.39 1.0152 655.5 341.76 18.67 Physician Carve-Out Drugs 21.0 3,607.90 6.31 1.0152 21.3 3,607.90 6.40 Other Professional 3,185.6 69.57 18.47 1.0152 3,234.1 69.57 18.75
Subtotal Physician 22,094.2 $ 102.20 $ 188.16 22,431.5 $ 102.20 $ 191.04
Total Claims/Benefit Cost 56,218.8 $ 143.00 $ 669.93 56,777.2 $ 142.82 $ 675.76
D2Milliman, Inc.
Page 2 of 4
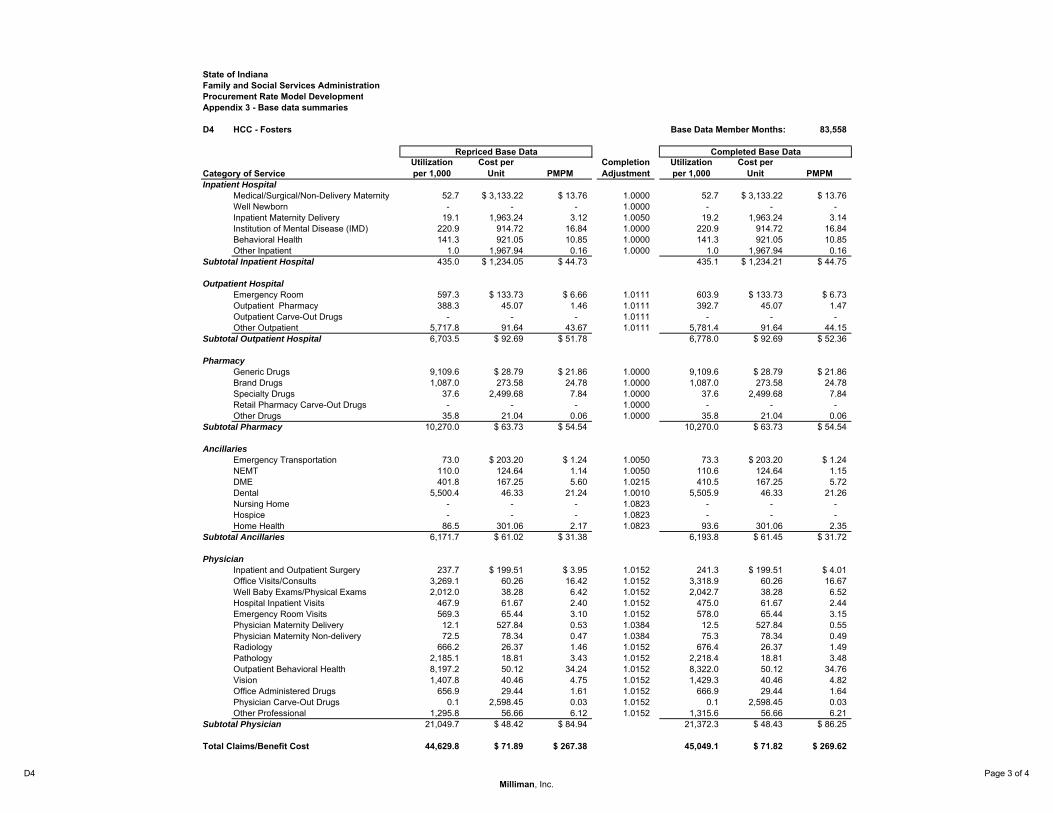
State of IndianaFamily and Social Services AdministrationProcurement Rate Model DevelopmentAppendix 3 - Base data summaries
D4 HCC - Fosters Base Data Member Months: 83,558
Repriced Base Data Completed Base Data
Category of ServiceUtilizationper 1,000
Cost perUnit PMPM
Completion Adjustment
Utilizationper 1,000
Cost perUnit PMPM
Inpatient HospitalMedical/Surgical/Non-Delivery Maternity 52.7 $ 3,133.22 $ 13.76 1.0000 52.7 $ 3,133.22 $ 13.76Well Newborn - - - 1.0000 - - - Inpatient Maternity Delivery 19.1 1,963.24 3.12 1.0050 19.2 1,963.24 3.14 Institution of Mental Disease (IMD) 220.9 914.72 16.84 1.0000 220.9 914.72 16.84 Behavioral Health 141.3 921.05 10.85 1.0000 141.3 921.05 10.85 Other Inpatient 1.0 1,967.94 0.16 1.0000 1.0 1,967.94 0.16
Subtotal Inpatient Hospital 435.0 $ 1,234.05 $ 44.73 435.1 $ 1,234.21 $ 44.75
Outpatient HospitalEmergency Room 597.3 $ 133.73 $ 6.66 1.0111 603.9 $ 133.73 $ 6.73Outpatient Pharmacy 388.3 45.07 1.46 1.0111 392.7 45.07 1.47 Outpatient Carve-Out Drugs - - - 1.0111 - - - Other Outpatient 5,717.8 91.64 43.67 1.0111 5,781.4 91.64 44.15
Subtotal Outpatient Hospital 6,703.5 $ 92.69 $ 51.78 6,778.0 $ 92.69 $ 52.36
PharmacyGeneric Drugs 9,109.6 $ 28.79 $ 21.86 1.0000 9,109.6 $ 28.79 $ 21.86Brand Drugs 1,087.0 273.58 24.78 1.0000 1,087.0 273.58 24.78 Specialty Drugs 37.6 2,499.68 7.84 1.0000 37.6 2,499.68 7.84 Retail Pharmacy Carve-Out Drugs - - - 1.0000 - - - Other Drugs 35.8 21.04 0.06 1.0000 35.8 21.04 0.06
Subtotal Pharmacy 10,270.0 $ 63.73 $ 54.54 10,270.0 $ 63.73 $ 54.54
AncillariesEmergency Transportation 73.0 $ 203.20 $ 1.24 1.0050 73.3 $ 203.20 $ 1.24NEMT 110.0 124.64 1.14 1.0050 110.6 124.64 1.15 DME 401.8 167.25 5.60 1.0215 410.5 167.25 5.72 Dental 5,500.4 46.33 21.24 1.0010 5,505.9 46.33 21.26 Nursing Home - - - 1.0823 - - - Hospice - - - 1.0823 - - - Home Health 86.5 301.06 2.17 1.0823 93.6 301.06 2.35
Subtotal Ancillaries 6,171.7 $ 61.02 $ 31.38 6,193.8 $ 61.45 $ 31.72
PhysicianInpatient and Outpatient Surgery 237.7 $ 199.51 $ 3.95 1.0152 241.3 $ 199.51 $ 4.01Office Visits/Consults 3,269.1 60.26 16.42 1.0152 3,318.9 60.26 16.67 Well Baby Exams/Physical Exams 2,012.0 38.28 6.42 1.0152 2,042.7 38.28 6.52 Hospital Inpatient Visits 467.9 61.67 2.40 1.0152 475.0 61.67 2.44 Emergency Room Visits 569.3 65.44 3.10 1.0152 578.0 65.44 3.15 Physician Maternity Delivery 12.1 527.84 0.53 1.0384 12.5 527.84 0.55 Physician Maternity Non-delivery 72.5 78.34 0.47 1.0384 75.3 78.34 0.49 Radiology 666.2 26.37 1.46 1.0152 676.4 26.37 1.49 Pathology 2,185.1 18.81 3.43 1.0152 2,218.4 18.81 3.48 Outpatient Behavioral Health 8,197.2 50.12 34.24 1.0152 8,322.0 50.12 34.76 Vision 1,407.8 40.46 4.75 1.0152 1,429.3 40.46 4.82 Office Administered Drugs 656.9 29.44 1.61 1.0152 666.9 29.44 1.64 Physician Carve-Out Drugs 0.1 2,598.45 0.03 1.0152 0.1 2,598.45 0.03 Other Professional 1,295.8 56.66 6.12 1.0152 1,315.6 56.66 6.21
Subtotal Physician 21,049.7 $ 48.42 $ 84.94 21,372.3 $ 48.43 $ 86.25
Total Claims/Benefit Cost 44,629.8 $ 71.89 $ 267.38 45,049.1 $ 71.82 $ 269.62
D4Milliman, Inc.
Page 3 of 4

State of IndianaFamily and Social Services AdministrationProcurement Rate Model DevelopmentAppendix 3 - Base data summaries
D3 HCC - Duals Base Data Member Months: 5,529
Repriced Base Data Completed Base Data
Category of ServiceUtilizationper 1,000
Cost perUnit PMPM
Completion Adjustment
Utilizationper 1,000
Cost perUnit PMPM
Inpatient HospitalMedical/Surgical/Non-Delivery Maternity 1,456.5 $ 468.31 $ 56.84 1.0000 1,456.5 $ 468.31 $ 56.84Well Newborn - - - 1.0000 - - - Inpatient Maternity Delivery 10.9 417.30 0.38 1.0050 10.9 417.30 0.38 Institution of Mental Disease (IMD) 8.7 226.12 0.16 1.0000 8.7 226.12 0.16 Behavioral Health 154.1 290.54 3.73 1.0000 154.1 290.54 3.73 Other Inpatient 39.1 409.54 1.33 1.0000 39.1 409.54 1.33
Subtotal Inpatient Hospital 1,669.2 $ 448.93 $ 62.45 1,669.2 $ 448.93 $ 62.45
Outpatient HospitalEmergency Room 1,035.4 $ 40.49 $ 3.49 1.0111 1,046.9 $ 40.49 $ 3.53Outpatient Pharmacy 5,502.4 26.13 11.98 1.0111 5,563.6 26.13 12.11 Outpatient Carve-Out Drugs - - - 1.0111 - - - Other Outpatient 24,386.4 26.09 53.03 1.0111 24,657.6 26.09 53.62
Subtotal Outpatient Hospital 30,924.1 $ 26.58 $ 68.50 31,268.1 $ 26.58 $ 69.26
PharmacyGeneric Drugs 39,997.1 $ 8.52 $ 28.39 1.0000 39,997.1 $ 8.52 $ 28.39Brand Drugs 7,853.1 278.09 181.99 1.0000 7,853.1 278.09 181.99 Specialty Drugs 386.4 2,104.39 67.75 1.0000 386.4 2,104.39 67.75 Retail Pharmacy Carve-Out Drugs - - - 1.0000 - - - Other Drugs 65.1 51.49 0.28 1.0000 65.1 51.49 0.28
Subtotal Pharmacy 48,301.7 $ 69.17 $ 278.41 48,301.7 $ 69.17 $ 278.41
AncillariesEmergency Transportation 306.1 $ 181.62 $ 4.63 1.0050 307.6 $ 181.62 $ 4.66NEMT 4,849.1 49.54 20.02 1.0050 4,873.4 49.54 20.12 DME 3,190.7 91.32 24.28 1.0215 3,259.2 91.32 24.80 Dental 2,077.2 95.67 16.56 1.0010 2,079.3 95.67 16.58 Nursing Home 245.3 28.02 0.57 1.0823 265.4 28.02 0.62 Hospice - - - 1.0823 - - - Home Health 768.4 67.13 4.30 1.0823 831.6 67.13 4.65
Subtotal Ancillaries 11,436.7 $ 73.83 $ 70.37 11,616.5 $ 73.79 $ 71.43
PhysicianInpatient and Outpatient Surgery 1,808.1 $ 77.22 $ 11.64 1.0152 1,835.6 $ 77.22 $ 11.81Office Visits/Consults 6,932.8 26.08 15.07 1.0152 7,038.4 26.08 15.30 Well Baby Exams/Physical Exams 471.0 20.26 0.80 1.0152 478.2 20.26 0.81 Hospital Inpatient Visits 3,381.7 10.95 3.09 1.0152 3,433.2 10.95 3.13 Emergency Room Visits 1,217.7 14.97 1.52 1.0152 1,236.2 14.97 1.54 Physician Maternity Delivery 8.7 124.45 0.09 1.0384 9.0 124.45 0.09 Physician Maternity Non-delivery 58.6 16.03 0.08 1.0384 60.9 16.03 0.08 Radiology 3,633.5 7.75 2.35 1.0152 3,688.9 7.75 2.38 Pathology 4,623.3 2.24 0.86 1.0152 4,693.7 2.24 0.88 Outpatient Behavioral Health 1,521.6 50.16 6.36 1.0152 1,544.7 50.16 6.46 Vision 1,343.6 31.00 3.47 1.0152 1,364.0 31.00 3.52 Office Administered Drugs 1,237.2 84.07 8.67 1.0152 1,256.1 84.07 8.80 Physician Carve-Out Drugs - - - 1.0152 - - - Other Professional 4,655.9 19.52 7.57 1.0152 4,726.8 19.52 7.69
Subtotal Physician 30,893.7 $ 23.91 $ 61.56 31,365.8 $ 23.91 $ 62.50
Total Claims/Benefit Cost 123,225.5 $ 52.71 $ 541.28 124,221.3 $ 52.56 $ 544.05
D3Milliman, Inc.
Page 4 of 4

HCC re-procurement 28 October 25, 2019 3.741 IMP47-03
Appendix 4: HCC actuarial cost models

State of IndianaFamily and Social Services AdministrationProcurement Rate Model DevelopmentAppendix 4 - Actuarial cost models
D1 HCC - Adults Estimated Apr-Dec 2021 Member Months: 535,788
Completed Base Data Managed Care Adj Additional Adj Applied Trend Apr-Dec 2021 Adjusted Experience
Category of ServiceUtilizationper 1,000
Cost perUnit PMPM Utilization Cost Utilization Cost Utilization Cost
Utilizationper 1,000
Cost perUnit PMPM
HAF/PFAC Adjustment
Without HAF/PFAC
PMPMInpatient Hospital
Medical/Surgical/Non-Delivery Maternity 1,295.7 $ 3,077.97 $ 332.34 0.9781 0.9980 1.0000 1.0000 0.9092 1.0802 1,152.2 $ 3,318.28 $ 318.62 2.2604 $ 140.96Well Newborn - - - 1.0000 1.0000 1.0000 1.0000 0.9092 1.0802 - - - 1.0000 - Inpatient Maternity Delivery 23.2 2,089.51 4.03 1.0000 1.0000 1.0000 1.0000 0.9092 1.0802 21.1 2,257.13 3.96 2.5540 1.55 Institution of Mental Disease (IMD) 81.1 971.07 6.56 1.0000 1.0000 1.0000 1.0000 0.9092 1.0802 73.7 1,048.96 6.45 2.1744 2.96 Behavioral Health 338.7 1,009.59 28.49 1.0000 1.0000 1.0000 1.0000 0.9092 1.0802 307.9 1,090.58 27.99 2.1703 12.89 Other Inpatient 31.5 3,594.46 9.43 1.0000 1.0000 1.0000 1.0000 0.9092 1.0802 28.6 3,882.80 9.26 2.2353 4.14
Subtotal Inpatient Hospital 1,770.1 $ 2,581.94 $ 380.86 1,583.6 $ 2,775.53 $ 366.28 $ 162.51
Outpatient HospitalEmergency Room 1,426.5 $ 142.60 $ 16.95 1.0000 1.0000 1.0000 1.0000 0.9691 1.1997 1,382.4 $ 171.08 $ 19.71 2.9694 $ 6.64Outpatient Pharmacy 3,326.5 363.70 100.82 1.0000 1.0000 1.0000 1.0000 0.9691 1.1997 3,223.6 436.34 117.22 2.8463 41.18 Outpatient Carve-Out Drugs 0.1 17,559.99 0.10 1.0000 1.0000 - 1.0000 0.9691 1.1997 - - - 2.9897 - Other Outpatient 17,992.1 114.53 171.72 1.0000 1.0000 1.0000 1.0000 0.9691 1.1997 17,435.8 137.41 199.65 2.4260 82.30
Subtotal Outpatient Hospital 22,745.1 $ 152.79 $ 289.59 22,041.8 $ 183.24 $ 336.57 $ 130.11
PharmacyGeneric Drugs 39,782.6 $ 12.11 $ 40.13 1.0000 1.0000 1.0000 1.0000 0.9092 1.2536 36,170.5 $ 15.17 $ 45.74 1.0000 $ 45.74Brand Drugs 7,691.0 406.17 260.32 1.0000 1.0000 1.0000 1.0000 0.9092 1.2536 6,992.7 509.17 296.71 1.0000 296.71 Specialty Drugs 349.6 3,314.68 96.56 1.0000 1.0000 1.0000 1.0000 0.9092 1.2536 317.8 4,155.21 110.05 1.0000 110.05 Retail Pharmacy Carve-Out Drugs 0.3 27,879.07 0.58 1.0000 1.0000 - 1.0000 0.9092 1.2536 - - - 1.0000 - Other Drugs 52.4 50.20 0.22 1.0000 1.0000 1.0000 1.0000 0.9092 1.2536 47.6 62.94 0.25 1.0000 0.25
Subtotal Pharmacy 47,875.8 $ 99.71 $ 397.82 43,528.7 $ 124.81 $ 452.75 $ 452.75
AncillariesEmergency Transportation 435.8 $ 181.74 $ 6.60 1.0000 1.0000 1.0000 1.0000 1.0802 0.8802 470.7 $ 159.97 $ 6.28 1.0000 $ 6.28NEMT 4,329.4 48.37 17.45 1.0000 1.0000 1.0000 1.0000 1.0638 0.9239 4,605.8 44.69 17.15 1.0000 17.15 DME 2,791.5 104.80 24.38 1.0000 1.0000 1.0000 1.0000 0.9691 0.9685 2,705.2 101.49 22.88 1.0000 22.88 Dental 1,854.0 87.30 13.49 1.0000 1.0000 1.0000 1.0000 0.9388 1.0316 1,740.5 90.06 13.06 1.0000 13.06 Nursing Home 124.8 213.24 2.22 1.0000 1.0000 1.0000 1.0000 0.9691 0.9685 120.9 206.52 2.08 1.0000 2.08 Hospice 276.7 169.17 3.90 1.0000 1.0000 1.0000 1.2281 0.9691 0.9685 268.1 201.21 4.50 1.0000 4.50 Home Health 1,282.0 84.01 8.98 1.0000 1.0000 1.0000 1.0000 0.9691 0.9685 1,242.4 81.36 8.42 1.0000 8.42
Subtotal Ancillaries 11,094.1 $ 83.30 $ 77.01 11,153.6 $ 80.01 $ 74.37 $ 74.37
PhysicianInpatient and Outpatient Surgery 1,612.1 $ 194.76 $ 26.16 0.9891 0.9990 1.0000 1.0000 0.9691 1.0316 1,545.2 $ 200.71 $ 25.84 1.1945 $ 21.64Office Visits/Consults 7,105.8 69.40 41.10 1.0000 1.0000 1.0000 1.0000 0.9691 1.0316 6,886.1 71.60 41.08 1.0698 38.40 Well Baby Exams/Physical Exams 463.6 51.75 2.00 1.9000 1.0000 1.0000 1.0000 0.9691 1.0316 853.7 53.38 3.80 1.0027 3.79 Hospital Inpatient Visits 3,349.9 84.00 23.45 0.9781 0.9980 1.0000 1.0000 0.9691 1.0316 3,175.3 86.48 22.88 1.1338 20.18 Emergency Room Visits 1,612.9 80.60 10.83 1.0000 1.0000 1.0000 1.0000 0.9691 1.0316 1,563.0 83.14 10.83 1.2847 8.43 Physician Maternity Delivery 12.7 514.51 0.54 1.0000 1.0000 1.0000 1.0000 0.9691 1.0316 12.3 530.76 0.54 0.9968 0.54 Physician Maternity Non-delivery 83.5 81.13 0.56 1.0000 1.0000 1.0000 1.0000 0.9691 1.0316 80.9 83.69 0.56 1.0184 0.55 Radiology 3,998.2 34.62 11.54 1.0000 1.0000 1.0000 1.0000 0.9691 1.0316 3,874.5 35.71 11.53 1.1224 10.27 Pathology 5,841.3 17.11 8.33 1.0000 1.0000 1.0000 1.0000 0.9691 1.0316 5,660.6 17.65 8.33 1.0180 8.18 Outpatient Behavioral Health 2,796.1 40.49 9.43 1.0000 1.0000 1.0000 1.0000 0.9691 1.0316 2,709.6 41.77 9.43 1.0154 9.29 Vision 1,205.9 43.77 4.40 1.0000 1.0000 1.0000 1.0000 0.9691 1.0316 1,168.6 45.15 4.40 1.0077 4.36 Office Administered Drugs 1,457.6 214.35 26.04 1.0000 1.0000 1.0000 1.0000 0.9691 1.0316 1,412.5 221.12 26.03 1.0006 26.01 Physician Carve-Out Drugs 16.6 6,319.19 8.76 1.0000 1.0000 - 1.0000 0.9691 1.0316 - - - 1.0000 - Other Professional 4,471.8 40.40 15.06 1.0000 1.0000 1.0000 1.0000 0.9691 1.0316 4,333.6 41.68 15.05 1.0657 14.12
Subtotal Physician 34,028.0 $ 66.37 $ 188.20 33,275.9 $ 65.02 $ 180.31 $ 165.78
Total Claims/Benefit Cost 117,513.1 $ 136.17 $ 1,333.48 111,583.6 $ 151.67 $ 1,410.28 $ 985.53
D1Milliman, Inc.
Page 1 of 4

State of IndianaFamily and Social Services AdministrationProcurement Rate Model DevelopmentAppendix 4 - Actuarial cost models
D2 HCC - Children Estimated Apr-Dec 2021 Member Months: 194,501
Completed Base Data Managed Care Adj Additional Adj Applied Trend Apr-Dec 2021 Adjusted Experience
Category of ServiceUtilizationper 1,000
Cost perUnit PMPM Utilization Cost Utilization Cost Utilization Cost
Utilizationper 1,000
Cost perUnit PMPM
HAF/PFAC Adjustment
Without HAF/PFAC
PMPMInpatient Hospital
Medical/Surgical/Non-Delivery Maternity 425.0 $ 2,974.38 $ 105.35 0.9883 0.9988 1.0000 1.0000 0.9388 0.9691 394.3 $ 2,878.85 $ 94.61 1.9041 $ 49.69Well Newborn - - - 1.0000 1.0000 1.0000 1.0000 0.9388 0.9691 - - - 1.0000 - Inpatient Maternity Delivery 9.7 2,024.13 1.63 1.0000 1.0000 1.0000 1.0000 0.9388 0.9691 9.1 1,961.55 1.49 2.6149 0.57 Institution of Mental Disease (IMD) 145.8 948.78 11.53 1.0000 1.0000 1.0000 1.0000 0.9388 0.9691 136.9 919.44 10.49 2.1139 4.96 Behavioral Health 106.7 949.24 8.44 1.0000 1.0000 1.0000 1.0000 0.9388 0.9691 100.1 919.89 7.68 2.0673 3.71 Other Inpatient 6.9 4,689.93 2.71 1.0000 1.0000 1.0000 1.0000 0.9388 0.9691 6.5 4,544.92 2.46 2.1025 1.17
Subtotal Inpatient Hospital 694.1 $ 2,241.54 $ 129.66 647.0 $ 2,164.91 $ 116.72 $ 60.10
Outpatient HospitalEmergency Room 759.9 $ 137.18 $ 8.69 1.0000 1.0000 1.0000 1.0000 0.9691 1.0000 736.4 $ 137.18 $ 8.42 2.9502 $ 2.85Outpatient Pharmacy 885.3 281.66 20.78 1.0000 1.0000 1.0000 1.0000 0.9691 1.0000 858.0 281.66 20.14 2.8324 7.11 Outpatient Carve-Out Drugs 0.0 - - 1.0000 1.0000 - 1.0000 0.9691 1.0000 - - - 1.0000 - Other Outpatient 7,912.7 105.72 69.71 1.0000 1.0000 1.0000 1.0000 0.9691 1.0000 7,668.1 105.72 67.55 2.5320 26.68
Subtotal Outpatient Hospital 9,558.1 $ 124.52 $ 99.18 9,262.5 $ 124.52 $ 96.11 $ 36.64
PharmacyGeneric Drugs 12,964.1 $ 36.79 $ 39.74 1.0000 1.0000 1.0000 1.0000 0.9691 0.9999 12,563.2 $ 36.78 $ 38.51 1.0000 $ 38.51Brand Drugs 2,176.9 425.88 77.26 1.0000 1.0000 1.0000 1.0000 0.9691 0.9999 2,109.6 425.85 74.86 1.0000 74.86 Specialty Drugs 210.5 3,416.08 59.91 1.0000 1.0000 1.0000 1.0000 0.9691 0.9999 203.9 3,415.82 58.05 1.0000 58.05 Retail Pharmacy Carve-Out Drugs 1.1 30,673.82 2.88 1.0000 1.0000 - 1.0000 0.9691 0.9999 - - - 1.0000 - Other Drugs 187.2 24.89 0.39 1.0000 1.0000 1.0000 1.0000 0.9691 0.9999 181.4 24.89 0.38 1.0000 0.38
Subtotal Pharmacy 15,539.7 $ 139.13 $ 180.18 15,058.2 $ 136.91 $ 171.80 $ 171.80
AncillariesEmergency Transportation 124.0 $ 229.12 $ 2.37 1.0000 1.0000 1.0000 1.0000 0.7706 0.9388 95.6 $ 215.10 $ 1.71 1.0000 $ 1.71NEMT 989.8 57.49 4.74 1.0000 1.0000 1.0000 1.0000 1.2719 1.0638 1,259.0 61.16 6.42 1.0000 6.42 DME 2,759.3 172.75 39.72 1.0000 1.0000 1.0000 1.0000 1.1304 0.9388 3,119.1 162.19 42.16 1.0000 42.16 Dental 4,044.6 47.63 16.05 1.0000 1.0000 1.0000 1.0000 1.0000 1.0313 4,044.6 49.13 16.56 1.0000 16.56 Nursing Home 1.1 210.06 0.02 1.0000 1.0000 1.0000 1.0000 1.1304 0.9388 1.3 197.21 0.02 1.0000 0.02 Hospice 38.5 177.56 0.57 1.0000 1.0000 1.0000 1.0465 1.1304 0.9388 43.5 174.44 0.63 1.0000 0.63 Home Health 596.4 246.17 12.23 1.0000 1.0000 1.0000 1.0000 1.1304 0.9388 674.2 231.11 12.98 1.0000 12.98
Subtotal Ancillaries 8,553.8 $ 106.22 $ 75.71 9,237.2 $ 104.55 $ 80.48 $ 80.48
PhysicianInpatient and Outpatient Surgery 400.3 $ 255.26 $ 8.51 0.9941 0.9994 1.0000 1.0000 1.1495 1.0822 457.4 $ 276.07 $ 10.52 1.3576 $ 7.75Office Visits/Consults 3,913.2 66.04 21.53 1.0000 1.0000 1.0000 1.0000 1.1495 1.0822 4,498.3 71.47 26.79 1.0852 24.69 Well Baby Exams/Physical Exams 1,382.4 40.87 4.71 1.4100 1.0000 1.0157 1.0000 1.1495 1.0822 2,275.8 44.22 8.39 1.0002 8.39 Hospital Inpatient Visits 1,081.8 92.20 8.31 0.9883 0.9988 1.0000 1.0000 1.1495 1.0822 1,228.9 99.66 10.21 1.0469 9.75 Emergency Room Visits 757.6 73.81 4.66 1.0000 1.0000 1.0000 1.0000 1.1495 1.0822 870.9 79.87 5.80 1.3179 4.40 Physician Maternity Delivery 5.7 550.27 0.26 1.0000 1.0000 1.0000 1.0000 1.1495 1.0822 6.6 595.50 0.33 1.0076 0.33 Physician Maternity Non-delivery 36.2 78.68 0.24 1.0000 1.0000 1.0000 1.0000 1.1495 1.0822 41.6 85.15 0.30 1.0102 0.29 Radiology 1,144.8 28.30 2.70 1.0000 1.0000 1.0000 1.0000 1.1495 1.0822 1,316.0 30.63 3.36 1.2967 2.59 Pathology 1,539.7 15.08 1.93 1.0000 1.0000 1.0000 1.0000 1.1495 1.0822 1,769.9 16.32 2.41 1.0366 2.32 Outpatient Behavioral Health 7,120.4 152.68 90.59 1.0000 1.0000 1.0000 1.0000 1.1495 1.0822 8,185.0 165.23 112.70 1.0003 112.67 Vision 1,138.6 39.63 3.76 1.0000 1.0000 1.0000 1.0000 1.1495 1.0822 1,308.8 42.89 4.68 1.0110 4.63 Office Administered Drugs 655.5 341.76 18.67 1.0000 1.0000 1.0157 1.0000 1.1495 1.0822 765.3 369.85 23.59 1.0001 23.59 Physician Carve-Out Drugs 21.3 3,607.90 6.40 1.0000 1.0000 - 1.0000 1.1495 1.0822 - - - 1.0000 - Other Professional 3,234.1 69.57 18.75 1.0000 1.0000 1.0000 1.0000 1.1495 1.0822 3,717.6 75.29 23.32 1.0846 21.50
Subtotal Physician 22,431.5 $ 102.20 $ 191.04 26,442.2 $ 105.46 $ 232.38 $ 222.89
Total Claims/Benefit Cost 56,777.2 $ 142.82 $ 675.76 60,647.0 $ 138.01 $ 697.50 $ 571.92
D2Milliman, Inc.
Page 2 of 4

State of IndianaFamily and Social Services AdministrationProcurement Rate Model DevelopmentAppendix 4 - Actuarial cost models
D4 HCC - Fosters Estimated Apr-Dec 2021 Member Months: 103,497
Completed Base Data Managed Care Adj Additional Adj Applied Trend Apr-Dec 2021 Adjusted Experience
Category of ServiceUtilizationper 1,000
Cost perUnit PMPM Utilization Cost Utilization Cost Utilization Cost
Utilizationper 1,000
Cost perUnit PMPM
HAF/PFAC Adjustment
Without HAF/PFAC
PMPMInpatient Hospital
Medical/Surgical/Non-Delivery Maternity 52.7 $ 3,133.22 $ 13.76 0.9972 0.9956 1.0000 1.0000 0.9388 0.9691 49.3 $ 3,023.03 $ 12.43 2.3329 $ 5.33Well Newborn - - - 1.0000 1.0000 1.0000 1.0000 0.9388 0.9691 - - - 1.0000 - Inpatient Maternity Delivery 19.2 1,963.24 3.14 1.0000 1.0000 1.0000 1.0000 0.9388 0.9691 18.0 1,902.54 2.86 2.5762 1.11 Institution of Mental Disease (IMD) 220.9 914.72 16.84 1.0000 1.0000 1.0000 1.0000 0.9388 0.9691 207.4 886.44 15.32 2.1104 7.26 Behavioral Health 141.3 921.05 10.85 1.0000 1.0000 1.0000 1.0000 0.9388 0.9691 132.7 892.57 9.87 2.0541 4.80 Other Inpatient 1.0 1,967.94 0.16 1.0000 1.0000 1.0000 1.0000 0.9388 0.9691 0.9 1,907.09 0.15 2.6935 0.06
Subtotal Inpatient Hospital 435.1 $ 1,234.21 $ 44.75 408.3 $ 1,193.81 $ 40.62 $ 18.56
Outpatient HospitalEmergency Room 603.9 $ 133.73 $ 6.73 1.0000 1.0000 1.0000 1.0000 0.9691 1.0000 585.3 $ 133.73 $ 6.52 2.9425 $ 2.22Outpatient Pharmacy 392.7 45.07 1.47 1.0000 1.0000 1.0000 1.0000 0.9691 1.0000 380.5 45.07 1.43 2.9436 0.49 Outpatient Carve-Out Drugs - - - 1.0000 1.0000 - 1.0000 0.9691 1.0000 - - - 1.0000 - Other Outpatient 5,781.4 91.64 44.15 1.0000 1.0000 1.0000 1.0000 0.9691 1.0000 5,602.7 91.64 42.79 2.5369 16.87
Subtotal Outpatient Hospital 6,778.0 $ 92.69 $ 52.36 6,568.4 $ 92.69 $ 50.74 $ 19.57
PharmacyGeneric Drugs 9,109.6 $ 28.79 $ 21.86 1.0000 1.0000 1.0000 1.0000 0.9691 0.9999 8,827.9 $ 28.79 $ 21.18 1.0000 $ 21.18Brand Drugs 1,087.0 273.58 24.78 1.0000 1.0000 1.0000 1.0000 0.9691 0.9999 1,053.4 273.55 24.01 1.0000 24.01 Specialty Drugs 37.6 2,499.68 7.84 1.0000 1.0000 1.0000 1.0000 0.9691 0.9999 36.5 2,499.48 7.59 1.0000 7.59 Retail Pharmacy Carve-Out Drugs - - - 1.0000 1.0000 - 1.0000 0.9691 0.9999 - - - 1.0000 - Other Drugs 35.8 21.04 0.06 1.0000 1.0000 1.0000 1.0000 0.9691 0.9999 34.7 21.04 0.06 1.0000 0.06
Subtotal Pharmacy 10,270.0 $ 63.73 $ 54.54 9,952.4 $ 63.72 $ 52.85 $ 52.85
AncillariesEmergency Transportation 73.3 $ 203.20 $ 1.24 1.0000 1.0000 1.0000 1.0000 0.7706 0.9388 56.5 $ 190.77 $ 0.90 1.0000 $ 0.90NEMT 110.6 124.64 1.15 1.0000 1.0000 1.0000 1.0000 1.2719 1.0638 140.6 132.60 1.55 1.0000 1.55 DME 410.5 167.25 5.72 1.0000 1.0000 1.0000 1.0000 1.1304 0.9388 464.0 157.02 6.07 1.0000 6.07 Dental 5,505.9 46.33 21.26 1.0000 1.0000 1.0000 1.0000 1.0000 1.0313 5,505.9 47.78 21.92 1.0000 21.92 Nursing Home - - - 1.0000 1.0000 1.0000 1.0000 1.1304 0.9388 - - - 1.0000 - Hospice - - - 1.0000 1.0000 1.0000 1.0000 1.1304 0.9388 - - - 1.0000 - Home Health 93.6 301.06 2.35 1.0000 1.0000 1.0000 1.0000 1.1304 0.9388 105.8 282.64 2.49 1.0000 2.49
Subtotal Ancillaries 6,193.8 $ 61.45 $ 31.72 6,272.8 $ 63.01 $ 32.94 $ 32.94
PhysicianInpatient and Outpatient Surgery 241.3 $ 199.51 $ 4.01 0.9986 0.9978 1.0000 1.0000 1.1495 1.0822 277.0 $ 215.44 $ 4.97 1.3110 $ 3.79Office Visits/Consults 3,318.9 60.26 16.67 1.0000 1.0000 1.0000 1.0000 1.1495 1.0822 3,815.1 65.22 20.73 1.0443 19.85 Well Baby Exams/Physical Exams 2,042.7 38.28 6.52 1.5700 1.0000 1.0116 1.0000 1.1495 1.0822 3,729.1 41.43 12.88 0.9999 12.88 Hospital Inpatient Visits 475.0 61.67 2.44 0.9972 0.9956 1.0000 1.0000 1.1495 1.0822 544.5 66.44 3.02 1.0289 2.93 Emergency Room Visits 578.0 65.44 3.15 1.0000 1.0000 1.0000 1.0000 1.1495 1.0822 664.4 70.82 3.92 1.1945 3.28 Physician Maternity Delivery 12.5 527.84 0.55 1.0000 1.0000 1.0000 1.0000 1.1495 1.0822 14.4 571.23 0.69 1.0145 0.68 Physician Maternity Non-delivery 75.3 78.34 0.49 1.0000 1.0000 1.0000 1.0000 1.1495 1.0822 86.6 84.78 0.61 1.0087 0.61 Radiology 676.4 26.37 1.49 1.0000 1.0000 1.0000 1.0000 1.1495 1.0822 777.5 28.54 1.85 1.1531 1.60 Pathology 2,218.4 18.81 3.48 1.0000 1.0000 1.0000 1.0000 1.1495 1.0822 2,550.1 20.36 4.33 1.0061 4.30 Outpatient Behavioral Health 8,322.0 50.12 34.76 1.0000 1.0000 1.0000 1.0000 1.1495 1.0822 9,566.3 54.24 43.24 1.0007 43.21 Vision 1,429.3 40.46 4.82 1.0000 1.0000 1.0000 1.0000 1.1495 1.0822 1,643.0 43.79 6.00 1.0037 5.97 Office Administered Drugs 666.9 29.44 1.64 1.0000 1.0000 1.0116 1.0000 1.1495 1.0822 775.5 31.86 2.06 1.0004 2.06 Physician Carve-Out Drugs 0.1 2,598.45 0.03 1.0000 1.0000 - 1.0000 1.1495 1.0822 - - - 1.0000 - Other Professional 1,315.6 56.66 6.21 1.0000 1.0000 1.0000 1.0000 1.1495 1.0822 1,512.3 61.31 7.73 1.0301 7.50
Subtotal Physician 21,372.3 $ 48.43 $ 86.25 25,955.7 $ 51.79 $ 112.01 $ 108.67
Total Claims/Benefit Cost 45,049.1 $ 71.82 $ 269.62 49,157.7 $ 70.59 $ 289.16 $ 232.58
D4Milliman, Inc.
Page 3 of 4

State of IndianaFamily and Social Services AdministrationProcurement Rate Model DevelopmentAppendix 4 - Actuarial cost models
D3 HCC - Duals Estimated Apr-Dec 2021 Member Months: 4,143
Completed Base Data Managed Care Adj Additional Adj Applied Trend Apr-Dec 2021 Adjusted Experience
Category of ServiceUtilizationper 1,000
Cost perUnit PMPM Utilization Cost Utilization Cost Utilization Cost
Utilizationper 1,000
Cost perUnit PMPM
HAF/PFAC Adjustment
Without HAF/PFAC
PMPMInpatient Hospital
Medical/Surgical/Non-Delivery Maternity 1,456.5 $ 468.31 $ 56.84 0.9839 1.0019 1.0000 1.0000 0.9092 1.0802 1,302.9 $ 506.86 $ 55.03 2.6556 $ 20.72Well Newborn - - - 1.0000 1.0000 1.0000 1.0000 0.9092 1.0802 - - - 1.0000 - Inpatient Maternity Delivery 10.9 417.30 0.38 1.0000 1.0000 1.0000 1.0000 0.9092 1.0802 9.9 450.77 0.37 2.6715 0.14 Institution of Mental Disease (IMD) 8.7 226.12 0.16 1.0000 1.0000 1.0000 1.0000 0.9092 1.0802 7.9 244.26 0.16 2.0993 0.08 Behavioral Health 154.1 290.54 3.73 1.0000 1.0000 1.0000 1.0000 0.9092 1.0802 140.1 313.85 3.66 2.2563 1.62 Other Inpatient 39.1 409.54 1.33 1.0000 1.0000 1.0000 1.0000 0.9092 1.0802 35.5 442.39 1.31 2.7090 0.48
Subtotal Inpatient Hospital 1,669.2 $ 448.93 $ 62.45 1,496.3 $ 485.50 $ 60.54 $ 23.05
Outpatient HospitalEmergency Room 1,046.9 $ 40.49 $ 3.53 1.0000 1.0000 1.0000 1.0000 0.9691 1.1997 1,014.5 $ 48.58 $ 4.11 2.9879 $ 1.37Outpatient Pharmacy 5,563.6 26.13 12.11 1.0000 1.0000 1.0000 1.0000 0.9691 1.1997 5,391.6 31.35 14.08 2.7541 5.11 Outpatient Carve-Out Drugs - - - 1.0000 1.0000 - 1.0000 0.9691 1.1997 - - - 1.0000 - Other Outpatient 24,657.6 26.09 53.62 1.0000 1.0000 1.0000 1.0000 0.9691 1.1997 23,895.2 31.31 62.34 2.1247 29.34
Subtotal Outpatient Hospital 31,268.1 $ 26.58 $ 69.26 30,301.3 $ 31.89 $ 80.53 $ 35.83
PharmacyGeneric Drugs 39,997.1 $ 8.52 $ 28.39 1.0000 1.0000 1.0000 1.0000 0.9092 1.2536 36,365.6 $ 10.68 $ 32.36 1.0000 $ 32.36Brand Drugs 7,853.1 278.09 181.99 1.0000 1.0000 1.0000 1.0000 0.9092 1.2536 7,140.1 348.61 207.42 1.0000 207.42 Specialty Drugs 386.4 2,104.39 67.75 1.0000 1.0000 1.0000 1.0000 0.9092 1.2536 351.3 2,638.02 77.22 1.0000 77.22 Retail Pharmacy Carve-Out Drugs - - - 1.0000 1.0000 - 1.0000 0.9092 1.2536 - - - 1.0000 - Other Drugs 65.1 51.49 0.28 1.0000 1.0000 1.0000 1.0000 0.9092 1.2536 59.2 64.55 0.32 1.0000 0.32
Subtotal Pharmacy 48,301.7 $ 69.17 $ 278.41 43,916.1 $ 86.71 $ 317.32 $ 317.32
AncillariesEmergency Transportation 307.6 $ 181.62 $ 4.66 1.0000 1.0000 1.0000 1.0000 1.0802 0.8802 332.3 $ 159.87 $ 4.43 1.0000 $ 4.43NEMT 4,873.4 49.54 20.12 1.0000 1.0000 1.0000 1.0000 1.0638 0.9239 5,184.5 45.77 19.78 1.0000 19.78 DME 3,259.2 91.32 24.80 1.0000 1.0000 1.0000 1.0000 0.9691 0.9685 3,158.4 88.44 23.28 1.0000 23.28 Dental 2,079.3 95.67 16.58 1.0000 1.0000 1.0000 1.0000 0.9388 1.0316 1,952.1 98.69 16.06 1.0000 16.06 Nursing Home 265.4 28.02 0.62 1.0000 1.0000 1.0000 1.0000 0.9691 0.9685 257.2 27.14 0.58 1.0000 0.58 Hospice - - - 1.0000 1.0000 1.0000 1.0000 0.9691 0.9685 - - - 1.0000 - Home Health 831.6 67.13 4.65 1.0000 1.0000 1.0000 1.0000 0.9691 0.9685 805.9 65.01 4.37 1.0000 4.37
Subtotal Ancillaries 11,616.5 $ 73.79 $ 71.43 11,690.4 $ 70.30 $ 68.48 $ 68.48
PhysicianInpatient and Outpatient Surgery 1,835.6 $ 77.22 $ 11.81 0.9919 1.0010 1.0000 1.0000 0.9691 1.0316 1,764.5 $ 79.74 $ 11.72 1.1357 $ 10.32Office Visits/Consults 7,038.4 26.08 15.30 1.0000 1.0000 1.0000 1.0000 0.9691 1.0316 6,820.8 26.91 15.29 1.0954 13.96 Well Baby Exams/Physical Exams 478.2 20.26 0.81 1.8400 1.0000 1.0000 1.0000 0.9691 1.0316 852.7 20.90 1.48 1.0014 1.48 Hospital Inpatient Visits 3,433.2 10.95 3.13 0.9839 1.0019 1.0000 1.0000 0.9691 1.0316 3,273.5 11.32 3.09 1.1160 2.77 Emergency Room Visits 1,236.2 14.97 1.54 1.0000 1.0000 1.0000 1.0000 0.9691 1.0316 1,198.0 15.44 1.54 1.3380 1.15 Physician Maternity Delivery 9.0 124.45 0.09 1.0000 1.0000 1.0000 1.0000 0.9691 1.0316 8.7 128.38 0.09 1.0000 0.09 Physician Maternity Non-delivery 60.9 16.03 0.08 1.0000 1.0000 1.0000 1.0000 0.9691 1.0316 59.0 16.54 0.08 1.0000 0.08 Radiology 3,688.9 7.75 2.38 1.0000 1.0000 1.0000 1.0000 0.9691 1.0316 3,574.8 8.00 2.38 1.1554 2.06 Pathology 4,693.7 2.24 0.88 1.0000 1.0000 1.0000 1.0000 0.9691 1.0316 4,548.6 2.31 0.88 1.0331 0.85 Outpatient Behavioral Health 1,544.7 50.16 6.46 1.0000 1.0000 1.0000 1.0000 0.9691 1.0316 1,497.0 51.75 6.46 1.0442 6.18 Vision 1,364.0 31.00 3.52 1.0000 1.0000 1.0000 1.0000 0.9691 1.0316 1,321.9 31.98 3.52 1.0106 3.49 Office Administered Drugs 1,256.1 84.07 8.80 1.0000 1.0000 1.0000 1.0000 0.9691 1.0316 1,217.2 86.73 8.80 1.0002 8.80 Physician Carve-Out Drugs - - - 1.0000 1.0000 - 1.0000 0.9691 1.0316 - - - 1.0000 - Other Professional 4,726.8 19.52 7.69 1.0000 1.0000 1.0000 1.0000 0.9691 1.0316 4,580.6 20.14 7.69 1.0838 7.09
Subtotal Physician 31,365.8 $ 23.91 $ 62.50 30,717.2 $ 24.62 $ 63.03 $ 58.33
Total Claims/Benefit Cost 124,221.3 $ 52.56 $ 544.05 118,121.4 $ 59.93 $ 589.90 $ 503.01
D3Milliman, Inc.
Page 4 of 4

Appendix 5: HCC capitation rate summary

State of IndianaFamily and Social Services AdministrationProcurement Rate Model DevelopmentAppendix 5 - Capitation rate summary
Rate CategoryProjected MCE
Member MonthsBase
Medical RateTPL Recovery
AdjustmentAdmin / Profit /
Surplus
Apr through Dec 2021
Capitation RateD1 HCC - Adults 535,788 $ 1,410.28 0.9985 $ 109.88 $1,518.05D2 HCC - Children 194,501 697.50 0.9985 64.45 760.91 D4 HCC - Fosters 103,497 289.16 0.9985 38.43 327.16 D3 HCC - Duals 4,143 589.90 1.0000 109.88 699.78 HCC Composite 837,929 $ 1,102.30 0.9985 $ 90.51 $ 1,191.16
HCC Rate SummaryMilliman, Inc.
Page 1 of 1

Milliman is among the world’s largest providers of actuarial and related products and services. The firm has consulting practices in life insurance and financial services, property & casualty insurance, healthcare, and employee benefits. Founded in 1947, Milliman is an independent firm with offices in major cities around the globe.
milliman.com
CONTACT
Brad Armstrong [email protected]
Andrew Dilworth [email protected]
Christine Mytelka [email protected]
Rob Damler [email protected]
© 2019 Milliman, Inc. All Rights Reserved. The materials in this document represent the opinion of the authors and are not representative of the views of Milliman, Inc. Milliman does not certify the information, nor does it guarantee the accuracy and completeness of such information. Use of such information is voluntary and should not be relied upon unless an independent review of its accuracy and completeness has been performed. Materials may not be reproduced without the express consent of Milliman.