millennium development goals in ghana - the dhs … development goals in ghana: a new look at data...
TRANSCRIPT
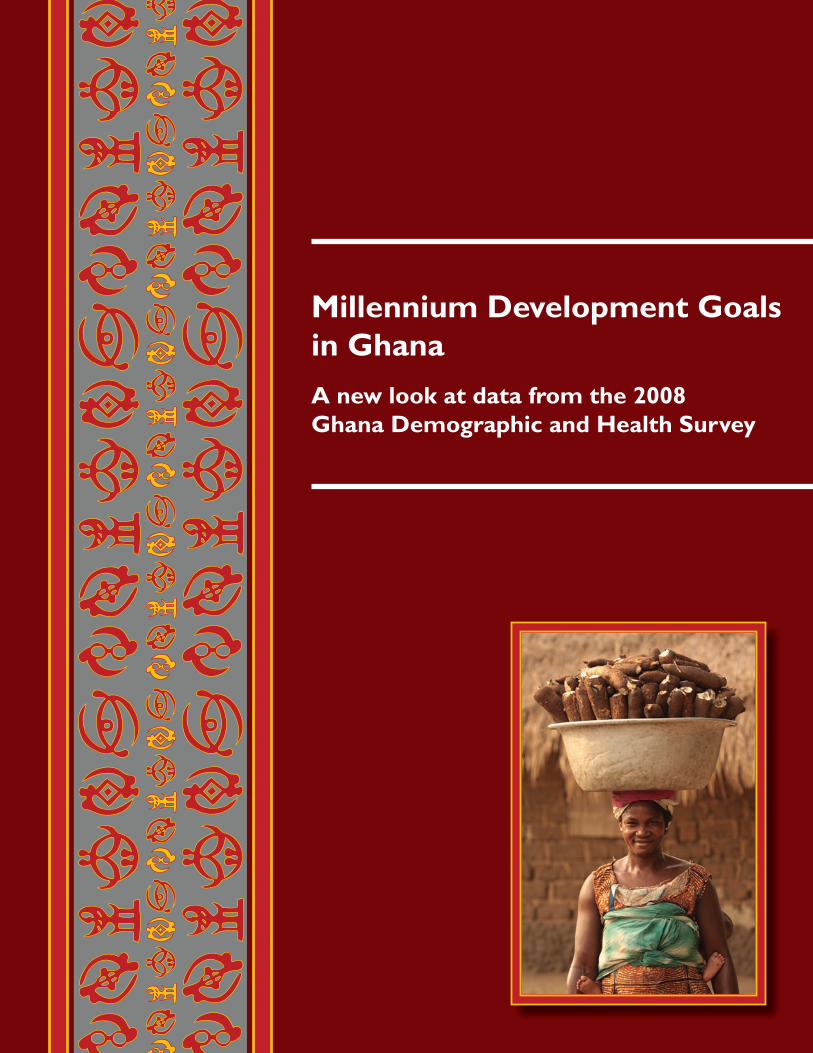
Millennium Development Goals in Ghana
A new look at data from the 2008Ghana Demographic and Health Survey


Millennium Development Goals in Ghana
A new look at data from the 2008 Ghana Demographic and Health Survey
The 2008 Ghana Demographic and Health Survey (GDHS) was carried out by the Ghana Statistical Service and the Ghana Health Service. ICF Macro, an ICF International company, provided financial and technical assistance for the survey through the USAID-funded MEASURE DHS programme. Local costs for the survey were partially funded by: the Ministry of Health (MOH), the Ghana Statistical Service (GSS), the Ghana AIDS Commission (GAC), UNICEF, UNFPA, and Danita. Additional information about the survey may be obtained from the Ghana Statistical Service (GSS), P.O. Box 1098, Accra, Ghana; Telephone: 233-21-671-732; Fax: 233-21-671-731. Information about the DHS programme may be obtained from the MEASURE DHS Project, ICF Macro, 11785 Beltsville Drive, Suite 300, Calverton, MD 20705, USA; Telephone: 301-572-0200; Fax: 301-572-0999; E-mail: [email protected]; Internet: http://www.measuredhs.com. Recommended citation: ICF Macro. 2010. Millennium Development Goals in Ghana: A new look at data from the 2008 Ghana Demographic and Health Survey. Calverton, Maryland, USA: ICF Macro.
Ghana Statistical Service
Ghana Health Service
Ghana AIDS Commission

iii
Contents About the Survey ......................................................................................................................................... 1
2008 Ghana Demographic and Health Survey ............................................................................. 1 Introduction to the Millennium Development Goals ............................................................................... 2 Goal 1: Eradicate Extreme Poverty and Hunger ..................................................................................... 3
Indicator 1.8: Prevalence of underweight children under 5 years .............................................. 3 Prevalence of underweight by education and wealth ........................................... 4 Prevalence of underweight by residence and region ............................................ 4
Goal 2: Achieve Universal Primary Education ......................................................................................... 6
Indicator 2.1: Net attendance ratio (NAR) in primary school .................................................... 6 Primary school NAR by region ............................................................................ 6 Primary school NAR by wealth ........................................................................... 7
Indicator 2.3: Literacy rate of 15-24-year-olds ........................................................................... 8
Literacy rate of adolescents age 15-24 years by residence and region ................. 8 Literacy rate of 15-24-year-olds by wealth .......................................................... 9
Goal 3: Promote Gender Equality and Empower Women .................................................................... 10
Indicator 3.1: The Gender Parity Index: Ratio of girls to boys in primary school; Ratio of girls to boys in secondary school ......................................................... 10
Goal 4: Reduce Child Mortality ............................................................................................................... 11
Indicator 4.1: Under-five mortality rate .................................................................................... 11
Indicator 4.2: Infant mortality rate ............................................................................................ 11 Trends in childhood mortality ............................................................................ 11 Childhood mortality by residence and region .................................................... 12 Childhood mortality by education and wealth ................................................... 13
Indicator 4.3: Percentage of 1-year-old children immunized against measles ......................... 14
Measles vaccine coverage by region .................................................................. 14 Measles vaccine coverage by education and wealth .......................................... 15
Goal 5: Improve Maternal Health ........................................................................................................... 16
Indicator 5.2: Percentage of births attended by skilled health personnel ................................. 16
Indicator 5.3: Contraceptive prevalence rate (any contraceptive method, currently married women age 15-49) .............................................................................................. 17 Current use by background characteristics ......................................................... 18
iv
Indicator 5.4: Adolescent birth rate (per 1,000 women age 15-19) .......................................... 19
Indicator 5.5 (part1): Antenatal care coverage by a skilled health professional (at least one visit) ............................................................................................................. 19
Indicator 5.5 (part 2): Antenatal care coverage by any provider, skilled or unskilled
(at least four visits) ............................................................................................. 21
Indicator 5.6: Unmet need for family planning among currently married women ................... 21 Goal 6: Combat HIV/AIDS, Malaria, and Other Diseases .................................................................... 23
Indicator 6.2: Condom use at last higher-risk sex: youth 15-24 years ...................................... 23
Indicator 6.3: Proportion of population age 15-24 years with comprehensive correct knowledge of HIV/AIDS ................................................................................... 24
Indicator 6.4: Ratio of school attendance of orphans to school attendance of non-orphans
age 10-14 years .................................................................................................. 25
Indicator 6.7: Proportion of children under age 5 sleeping under insecticide-treated bednets ............................................................................................................... 25
Indicator 6.8: Proportion of children under age 5 with fever who are treated with
appropriate antimalarial drugs ............................................................................ 25 Goal 7: Ensure Environmental Sustainability ........................................................................................ 26
Indicator 7.8: Proportion of population using an improved drinking water source .................. 26
Indicator 7.9 Proportion of population using an improved sanitation facility ......................... 27 Conclusions ................................................................................................................................................ 28 Appendix: Official List of MDG Indicators ........................................................................................... 30
1
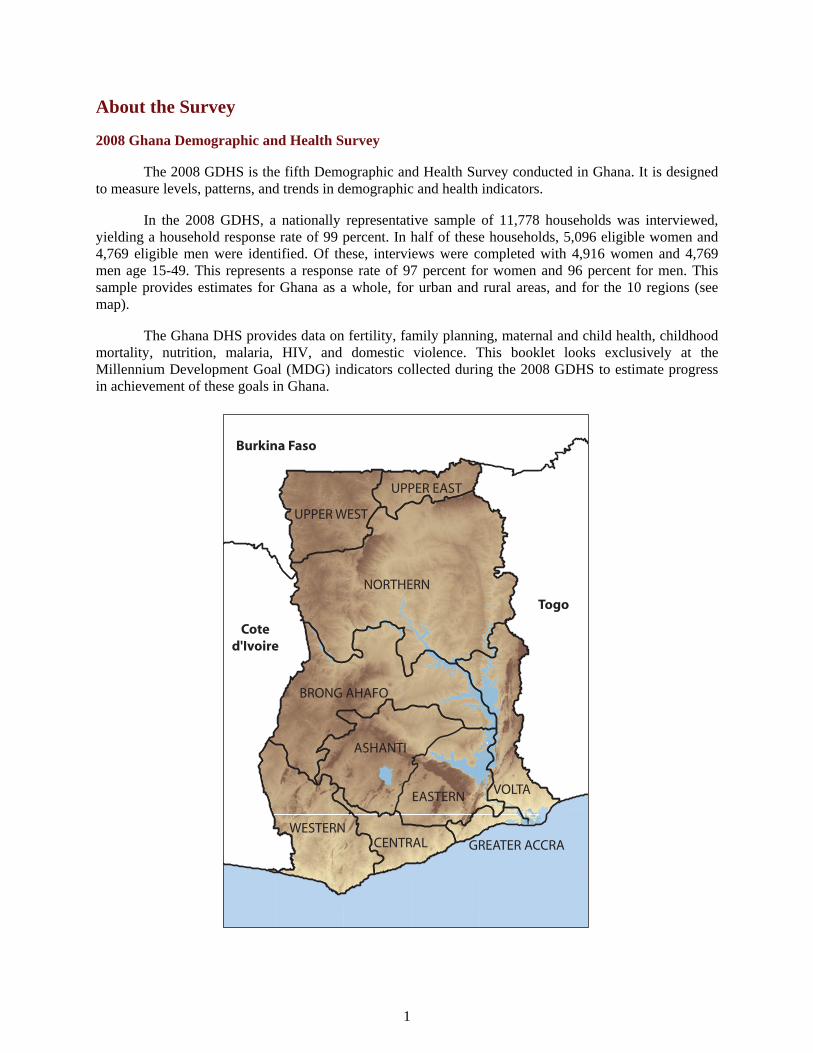
About the Survey
2008 Ghana Demographic and Health Survey
The 2008 GDHS is the fifth Demographic and Health Survey conducted in Ghana. It is designed to measure levels, patterns, and trends in demographic and health indicators.
In the 2008 GDHS, a nationally representative sample of 11,778 households was interviewed, yielding a household response rate of 99 percent. In half of these households, 5,096 eligible women and 4,769 eligible men were identified. Of these, interviews were completed with 4,916 women and 4,769 men age 15-49. This represents a response rate of 97 percent for women and 96 percent for men. This sample provides estimates for Ghana as a whole, for urban and rural areas, and for the 10 regions (see map).
The Ghana DHS provides data on fertility, family planning, maternal and child health, childhood mortality, nutrition, malaria, HIV, and domestic violence. This booklet looks exclusively at the Millennium Development Goal (MDG) indicators collected during the 2008 GDHS to estimate progress in achievement of these goals in Ghana.
NORTHERN
VOLTA
ASHANTI
BRONG AHAFO
WESTERN
EASTERN
UPPER WEST
CENTRAL
UPPER EAST
GREATER ACCRA
Burkina Faso
Togo
Coted'Ivoire
2
Introduction to the Millennium Development Goals
The DHS surveys collect a wealth of information and data on the Millennium Development Goals (MDGs). Ghana has made substantial progress over the past few years in achieving its goals. Although progress has been made, there are still many areas to improve. This booklet summarizes the major findings on 20 key indicators from the 2008 Ghana Demographic and Health Survey (GDHS). These indicators refer to the household population, to women and men of reproductive age, to youth, age 15-24, and to children, age 6-11 and under 5. Wherever possible, data have been grouped by various background characteristics, and patterns that emerge have been discussed in detail. Trends over time have been presented to assess progress toward reaching the goals in Ghana.
3
Goal 1: Eradicate Extreme Poverty and Hunger
Target 1.A: Halve, between 1990 and 2015, the proportion of people whose income is less than one dollar a day
Target 1.B: Achieve full and productive employment and decent work for all, including women and young people1
Target 1C: Halve, between 1990 and 2015, the proportion of people who suffer from hunger
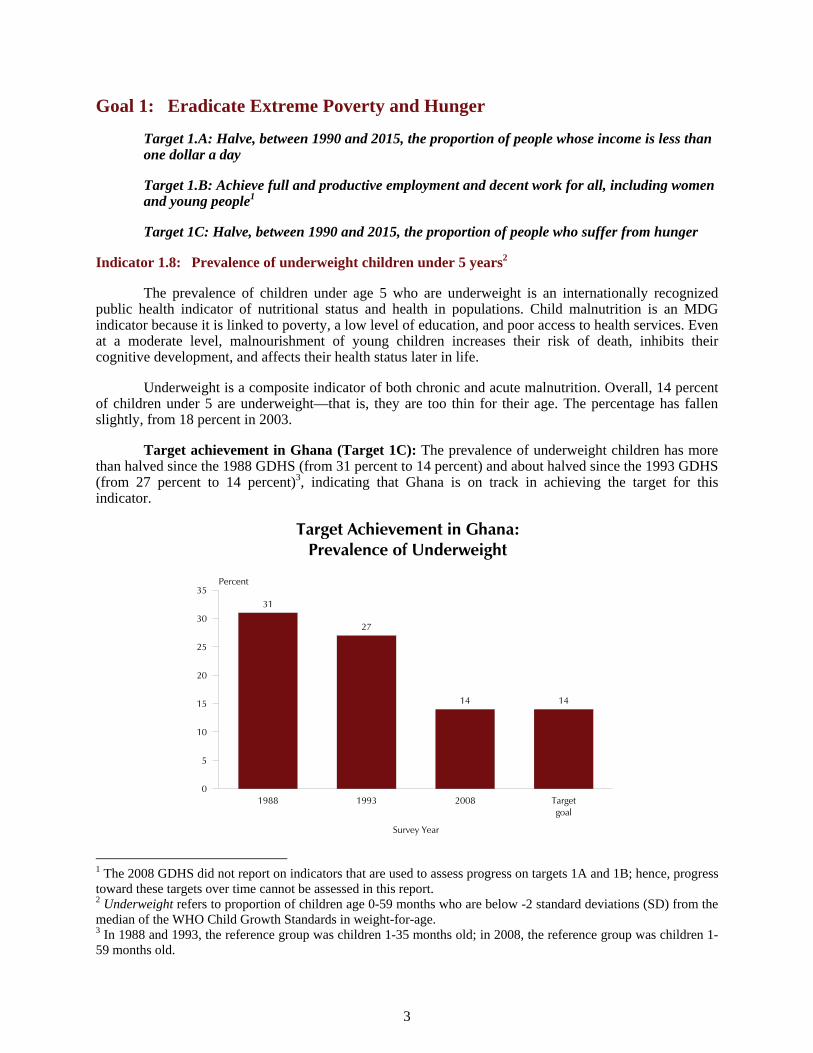
Indicator 1.8: Prevalence of underweight children under 5 years2
The prevalence of children under age 5 who are underweight is an internationally recognized public health indicator of nutritional status and health in populations. Child malnutrition is an MDG indicator because it is linked to poverty, a low level of education, and poor access to health services. Even at a moderate level, malnourishment of young children increases their risk of death, inhibits their cognitive development, and affects their health status later in life.
Underweight is a composite indicator of both chronic and acute malnutrition. Overall, 14 percent of children under 5 are underweight—that is, they are too thin for their age. The percentage has fallen slightly, from 18 percent in 2003.
Target achievement in Ghana (Target 1C): The prevalence of underweight children has more than halved since the 1988 GDHS (from 31 percent to 14 percent) and about halved since the 1993 GDHS (from 27 percent to 14 percent)3, indicating that Ghana is on track in achieving the target for this indicator.
Target Achievement in Ghana:Prevalence of Underweight
31
27
14 14
1988 1993 2008 Targetgoal
Survey Year
0
5
10
15
20
25
30
35Percent
1 The 2008 GDHS did not report on indicators that are used to assess progress on targets 1A and 1B; hence, progress toward these targets over time cannot be assessed in this report. 2 Underweight refers to proportion of children age 0-59 months who are below -2 standard deviations (SD) from the median of the WHO Child Growth Standards in weight-for-age. 3 In 1988 and 1993, the reference group was children 1-35 months old; in 2008, the reference group was children 1-59 months old.

4
Peak levels of low weight for age occur among children age 18-23 months (19 percent) and children age 9-11 months (18 percent). Male children (15 percent) are somewhat more likely to be underweight than female children (12 percent).
Prevalence of underweight by education and wealth
The underweight prevalence among children decreases with a mother’s education and with household wealth. Seventeen percent of children born to mothers with little or no education are underweight compared with 7 percent of children born to women with secondary or higher education. Nineteen percent of children from households in the lowest wealth quintile are underweight compared with only 8 percent of children from households in the richest two quintiles.
Prevalence of Underweight by Education and Wealth
17
14
12
7
19
17
13
8
9
Mother’s education
No education
Primary
Middle/JSS
Secondary+
Wealth quintile
Lowest
Second
Middle
Fourth
Highest
0 5 10 15 20 25
Percent
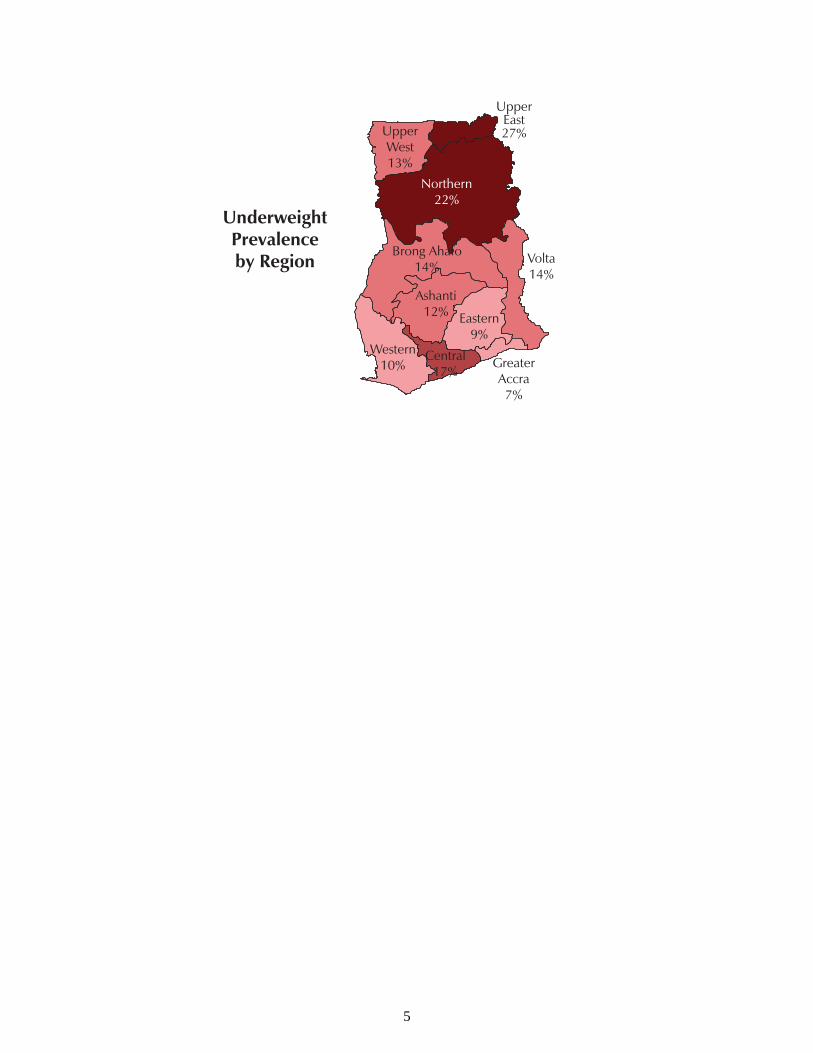
Prevalence of underweight by residence and region
The underweight prevalence among young children is higher in rural than in urban areas (16 percent versus 11 percent). The prevalence of underweight children ranges from 7 percent in the Greater Accra region to 27 percent in the Upper Eastern region.
5
UpperEast27%
Northern22%
Brong Ahafo14%
Volta14%
Ashanti12% Eastern
9%Western
10%Central
17%Greater Accra7%
UnderweightPrevalenceby Region
Upper West13%

6
Goal 2: Achieve Universal Primary Education
Target 2A: Ensure that, by 2015, children everywhere, boys and girls alike, will be able to complete a full course of primary schooling
Indicator 2.1: Net attendance ratio (NAR) in primary school4
The percentage of children age 6-11 years who attend primary school is used for the net attendance ratio indicator. This indicator monitors progress towards achievement of universal primary education.
Seventy-four percent of children age 6-11 years who should be attending primary school are currently doing so. The NAR for primary school has increased sharply from 60 percent in 2003.
Target achievement in Ghana (Target 2A): Ghana needs to increase its efforts to achieve the target goal of ensuring that all children age 6-11 who should be attending primary school are currently doing so.
Target Achievement in Ghana:Net Attendance Ratio (NAR) in Primary School
74
100
Primary school NAR in Ghana Target goal0
20
40
60
80
100Percent
The results show a similar ratio for female and male youths at the primary school level (74 percent versus 73 percent), which indicates that there is not much of a gender gap in primary school attendance.
Primary school NAR by region
The primary school attendance ratio is lower in rural than in urban areas (70 percent versus 80 percent). Regional differences exist. Only 53 percent of children age 6-11 in the Northern region attend primary school versus 86 percent in Ashanti.
2 The 2008 GDHS data are based on reported attendance, not enrolment, for children age 6-11 years. Indicator is based on de facto population. Numerator is children age 6-11 years currently attending school; denominator is children age 6-11 years.

7
UpperEast72%
Northern53%
Brong Ahafo76%
Volta72%
Ashanti86% Eastern
75%Western
72%Central
75%Greater Accra80%
Primary SchoolNet Attendance Ratio
by Region
Upper West65%
Primary school NAR by wealth
There is a strong relationship between household economic status and primary school attendance. The net attendance ratio in primary school increases from 59 percent among pupils from poorer households to as high as 86 percent among pupils from richer households.
Primary School Net Attendance Ratio by Wealth
59
7277
8286
Lowest Second Middle Fourth Highest0
20
40
60
80
100Percent

8
Indicator 2.3: Literacy rate of 15-24-year-olds5
The youth literacy rate reflects the outcomes of primary education over a 10-year period. As a measure of the effectiveness of the primary education system, it is often seen as a proxy measure of social progress and economic achievement.
A lower percentage of young women age 15-24 years (77 percent) is literate compared with young men the same age (84 percent).
Literacy rate of adolescents age 15-24 years by residence and region
Urban youth are more likely to be literate (85 percent of women and 94 percent of men) than rural youth (69 percent of women and 76 percent of men).
Literacy Rate of Adolescents Age 15-24 Years by Residence
85
69
94
76
Urban Rural
Residence
0
20
40
60
80
100Percent
Women Men
Among both young women and young men, the lowest percentage of literacy is in the Northern region (45 percent for women and 61 percent for men), and the highest percentage is in Greater Accra (87 percent of women and 96 percent of men).
5 Refers to respondents age 15-24 years who attended secondary school, or higher, or who can read a whole sentence

9
UpperEast68%
Northern45%
Brong Ahafo72%
Volta77%
Ashanti83% Eastern
82%Western
83%Central
80%Greater Accra87%
Literacy Rate ofAdolescents Age
15-24 Yearsby Region
UpperEast63%
Northern61%
Brong Ahafo84%
Volta91%
Ashanti88% Eastern
90%Western
86%Central
89%Greater Accra96%
Upper West68%
Women Men
Upper West57%
Literacy rate of 15-24-year-olds by wealth
The literacy rate among youth is positively associated with wealth. It increases from 43 percent for women and 54 percent for men in the lowest wealth quintile to 91 percent for women and 100 percent for men in the highest wealth quintile.
Literacy Rate of Adolescents Age 15-24 Years by Wealth
43
69
83 8491
54
79
8993
100
Lowest Second Middle Fourth Highest
Wealth Quintile
0
20
40
60
80
100Percent
Women Men

10
Goal 3: Promote Gender Equality and Empower Women
Target 3.A: Eliminate gender disparity in primary and secondary education, preferably by 2005, and in all levels of education no later than 2015
Indicator 3.1: The Gender Parity Index: Ratio of girls to boys in primary school; Ratio of girls to boys in secondary school6
The ratio of girls to boys attending primary or secondary school, referred to as the Gender Parity Index, or the GPI, is an indicator of equality in educational opportunity as well as a measure of both fairness and efficiency in education. Eliminating gender disparity at all levels of education would help to increase the status and capabilities of women. Furthermore, female education is an important determinant of economic development.
A GPI of less than 1 indicates that a smaller proportion of girls than boys attends school. In Ghana, the GPI is 1.01 for primary and secondary school attendance, indicating that the gender gap is relatively small. There are no differences in the GPI by urban-rural residence or wealth. The Northern and Greater Accra regions lag slightly behind in GPI for primary school attendance, and the Central and Western regions lag somewhat behind for secondary school attendance.
Target achievement in Ghana (Target 3A): The fact that the Gender Parity Index (GPI) for Ghana is above 1 for both primary and secondary education illustrates that Ghana is on track in achieving the target for this indicator.
Target Achievement in Ghana:Gender Parity Index (GPI)
1.01 1.01 1.00
PrimaryEducation
GPI
SecondaryEducation
GPI
Target goalfor Primary
and SecondaryEducation
0.00
0.20
0.40
0.60
0.80
1.00
1.20
1.40
GPI
6 The Gender Parity Index for primary school is the ratio of the primary school NAR for females to the NAR for males. The Gender Parity Index for secondary school is the ratio of the secondary school NAR for females to the NAR for males. It is based on a de facto population age 6-24 years. The GPI in the GDHS refers to ‘attendance” and not ‘enrolment’, which is the standard MDG definition.

11
Goal 4: Reduce Child Mortality
Target 4.A: Reduce by two-thirds, between 1990 and 2015, the under-five mortality rate
Indicator 4.1: Under-five mortality rate
Indicator 4.2: Infant mortality rate7
The under-five and infant mortality rates are measures of child survival. They also reflect the social, economic, and environmental conditions in which children live in a society. Because data on the incidence and prevalence of diseases frequently are unavailable, mortality rates are often used to identify vulnerable populations.
The under-five mortality rate (probability of dying between birth and age 5) is 80 deaths per 1,000 live births in the most recent five-year period, and the infant mortality rate (probability of dying between birth and age 1) is 50 deaths per 1,000 live births.
Trends in childhood mortality
Results from five GDHS surveys show a decline in childhood mortality over the past 20 years. This decline appeared to halt briefly during the period 1999-2003, but then mortality declined even further from 2003 to 2008. The infant mortality rate has declined from 64 deaths per 1,000 for the 0-4 years preceding the 2003 GDHS to 50 deaths per 1,000 during the same four-year period prior to the 2008 GDHS. The under-five mortality rate decreased from 111 deaths per 1,000 for the 0-4 years preceding the 2003 GDHS to 80 deaths per 1,000 during the same period prior to the 2008 GDHS.
Mortality Trends, Ghana 1998-2008
77
155
66
119
57
108
64
111
50
80
Infant Under-five
Mortality rate
0
20
40
60
80
100
120
140
160Deaths per 1,000 live births
1983-1987 1989-1993 1994-1998 1999-2003 2004-2008
7 Mortality rates refer to a 5-year period before the survey, and they are expressed as a rate per 1,000 live births.

12
Target achievement in Ghana (Target 4A): The under-five mortality rate was 119 deaths per 1,000 live births for the period 1989-1993. In order to reach its target of reducing under-five mortality rate by two-thirds, Ghana needs to have an under-five mortality rate of 40 deaths per 1,000 live births by year 2015. The current rate of 80 deaths per 1,000 live births is twice as high as the target rate, indicating that Ghana needs to increase its efforts to achieve the target for this indicator.
Target Achievement in Ghana:Under-five Mortality Rate
80
40
Ghana2004-2008
Target goal0
20
40
60
80
100Deaths per 1,000 live births
Childhood mortality by residence and region
Mortality levels in rural areas are higher than those in urban areas. In the 10-year period before the survey, infant mortality in rural areas was 56 deaths per 1,000 live births compared with 49 deaths per 1,000 live births in urban areas. The under-five mortality rate during the same period was 90 deaths per 1,000 live births in rural areas and 75 deaths per 1,000 live births in urban areas.
Childhood Mortality by Urban-Rural Residence
49
75
56
90
InfantMortality
Rate
Under-fiveMortality
Rate
Mortality rate
0
20
40
60
80
100Deaths per 1,000 live births
Urban Rural
13
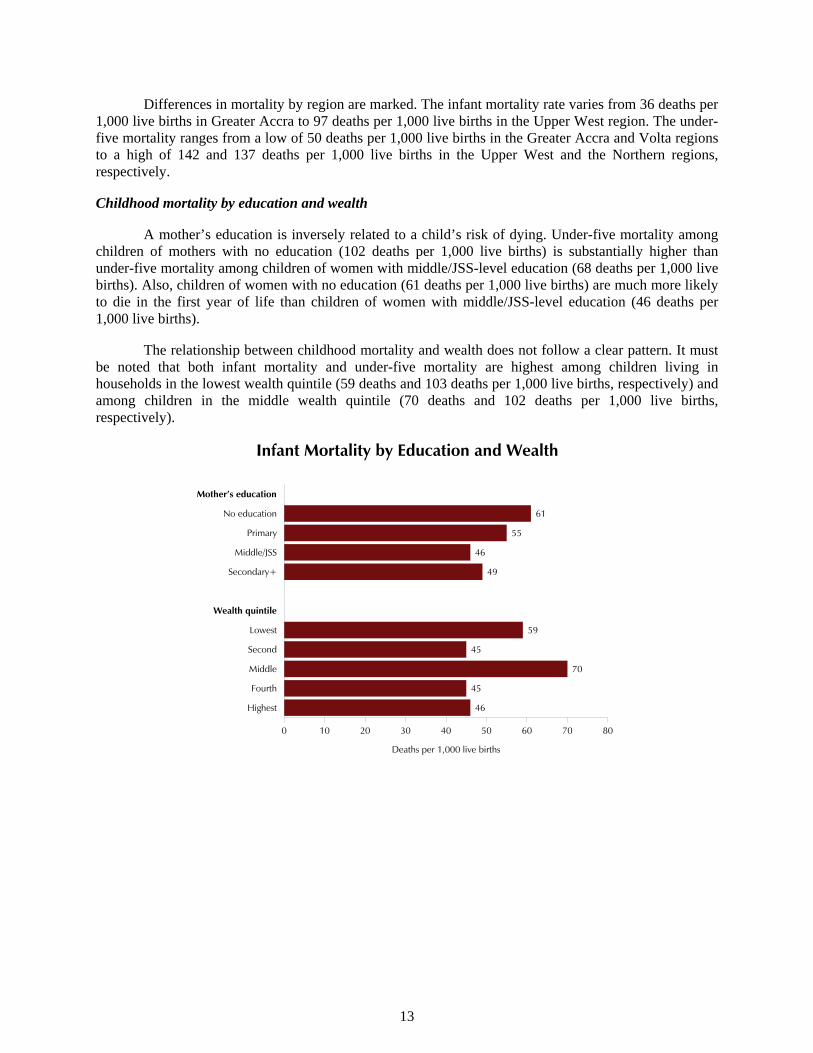
Differences in mortality by region are marked. The infant mortality rate varies from 36 deaths per 1,000 live births in Greater Accra to 97 deaths per 1,000 live births in the Upper West region. The under-five mortality ranges from a low of 50 deaths per 1,000 live births in the Greater Accra and Volta regions to a high of 142 and 137 deaths per 1,000 live births in the Upper West and the Northern regions, respectively.
Childhood mortality by education and wealth
A mother’s education is inversely related to a child’s risk of dying. Under-five mortality among children of mothers with no education (102 deaths per 1,000 live births) is substantially higher than under-five mortality among children of women with middle/JSS-level education (68 deaths per 1,000 live births). Also, children of women with no education (61 deaths per 1,000 live births) are much more likely to die in the first year of life than children of women with middle/JSS-level education (46 deaths per 1,000 live births).
The relationship between childhood mortality and wealth does not follow a clear pattern. It must be noted that both infant mortality and under-five mortality are highest among children living in households in the lowest wealth quintile (59 deaths and 103 deaths per 1,000 live births, respectively) and among children in the middle wealth quintile (70 deaths and 102 deaths per 1,000 live births, respectively).
Infant Mortality by Education and Wealth
61
55
46
49
59
45
70
45
46
Mother’s education
No education
Primary
Middle/JSS
Secondary+
Wealth quintile
Lowest
Second
Middle
Fourth
Highest
0 10 20 30 40 50 60 70 80
Deaths per 1,000 live births

14
Under-five Mortality by Education and Wealth
102
88
68
64
103
79
102
68
60
Mother’s education
No education
Primary
Middle/JSS
Secondary+
Wealth quintile
Lowest
Second
Middle
Fourth
Highest
0 20 40 60 80 100 120
Deaths per 1,000 live births
Children in households in the highest wealth quintile have the lowest under-five mortality rates, while infant mortality is lowest among children in the second, fourth, and fifth wealth quintiles.
Indicator 4.3: Percentage of 1-year-old children immunized against measles8
This indicator provides a measure of the coverage and the quality of the child health care system in a country. Immunization is essential for reducing under-five mortality. Among the vaccine-preventable diseases of childhood, measles is the leading cause of preventable child mortality. Health and other programmes targeted at specific causes of mortality are one practical way to reduce child mortality.
Ninety percent of children age 12-23 months old are vaccinated against measles, an increase from 83 percent in 2003.
Eighty-six percent of boys are immunized against measles versus 92 percent of girls. Urban children are more likely to be immunized against measles than rural children (93 percent versus 88 percent).
Measles vaccine coverage by region
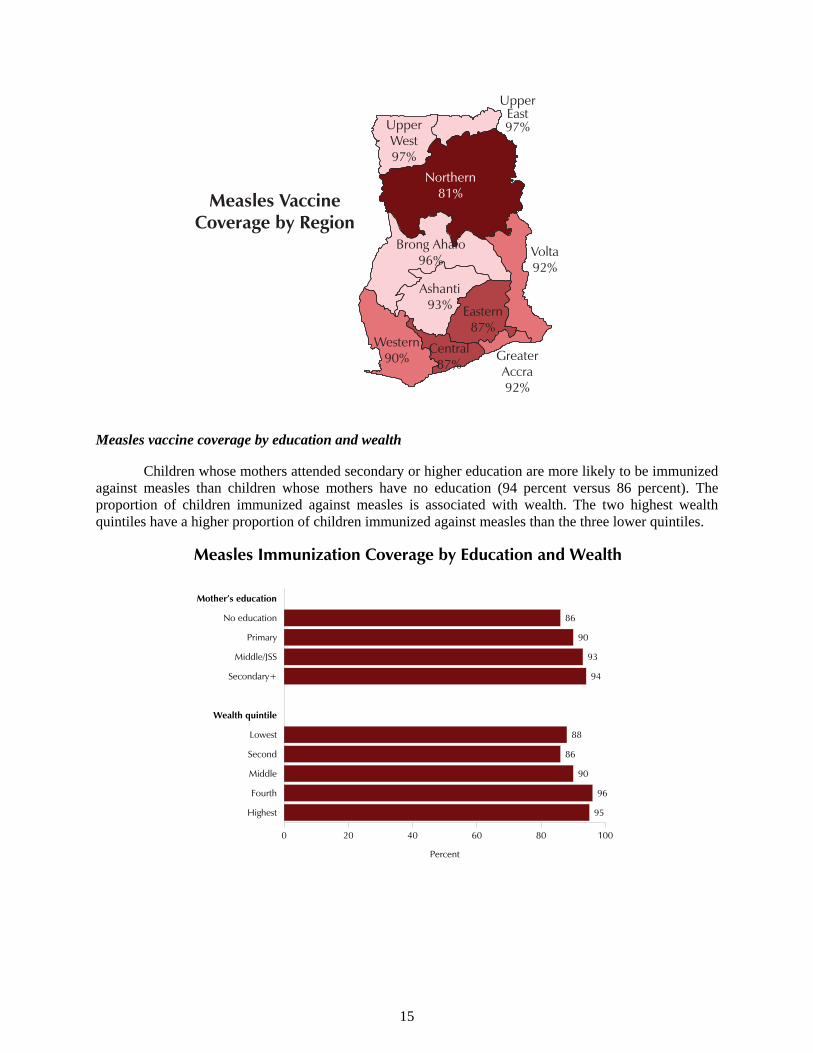
Measles vaccine coverage ranges from 81 percent in the Northern region to 97 percent in the Upper East and Upper West regions.
8 In Ghana, the measles vaccinations are given at age 9 months. The values presented here are for children age 12-23 months who have been vaccinated at any time against measles.
15
UpperEast97%
Northern81%
Brong Ahafo96%
Volta92%
Ashanti93% Eastern
87%Western
90%Central
87%Greater Accra92%
Measles VaccineCoverage by Region
Upper West97%
Measles vaccine coverage by education and wealth
Children whose mothers attended secondary or higher education are more likely to be immunized against measles than children whose mothers have no education (94 percent versus 86 percent). The proportion of children immunized against measles is associated with wealth. The two highest wealth quintiles have a higher proportion of children immunized against measles than the three lower quintiles.
Measles Immunization Coverage by Education and Wealth
86
90
93
94
88
86
90
96
95
Mother’s education
No education
Primary
Middle/JSS
Secondary+
Wealth quintile
Lowest
Second
Middle
Fourth
Highest
0 20 40 60 80 100
Percent
16
Goal 5: Improve Maternal Health
Target 5.A: Reduce by three quarters, between 1990 and 2015, the maternal mortality ratio9
Target 5.B: Achieve, by 2015, universal access to reproductive health10
Indicator 5.2: Percentage of births attended by skilled health personnel11
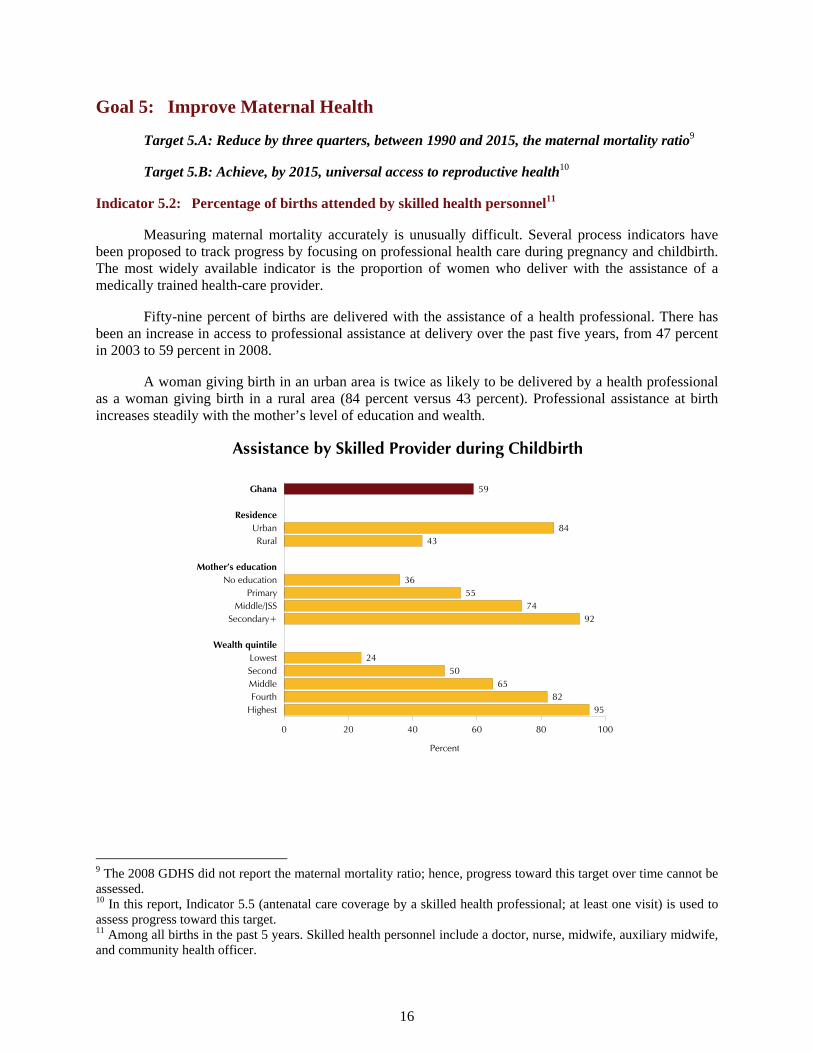
Measuring maternal mortality accurately is unusually difficult. Several process indicators have been proposed to track progress by focusing on professional health care during pregnancy and childbirth. The most widely available indicator is the proportion of women who deliver with the assistance of a medically trained health-care provider.
Fifty-nine percent of births are delivered with the assistance of a health professional. There has been an increase in access to professional assistance at delivery over the past five years, from 47 percent in 2003 to 59 percent in 2008.
A woman giving birth in an urban area is twice as likely to be delivered by a health professional as a woman giving birth in a rural area (84 percent versus 43 percent). Professional assistance at birth increases steadily with the mother’s level of education and wealth.
Assistance by Skilled Provider during Childbirth
59
8443
3655
7492
2450
6582
95
Ghana
ResidenceUrbanRural
Mother’s educationNo education
PrimaryMiddle/JSS
Secondary+
Wealth quintileLowestSecondMiddleFourth
Highest
0 20 40 60 80 100
Percent
9 The 2008 GDHS did not report the maternal mortality ratio; hence, progress toward this target over time cannot be assessed. 10 In this report, Indicator 5.5 (antenatal care coverage by a skilled health professional; at least one visit) is used to assess progress toward this target. 11 Among all births in the past 5 years. Skilled health personnel include a doctor, nurse, midwife, auxiliary midwife, and community health officer.

17
Indicator 5.3: Contraceptive prevalence rate (any contraceptive method, currently married women age 15-49)
This indicator is useful in tracking progress in health, gender equality, and poverty goals. It also serves as a proxy measure of access to reproductive health services that are essential for meeting many of the MDGs, especially the child and maternity mortality and HIV/AIDS goals.
Seventeen percent of currently married women are using a modern method of contraception. Almost one in four (24 percent) are using a modern or traditional method. Injectables (6 percent), pills, and rhythm (5 percent each) are the most commonly used methods.
Family PlanningPercent of married women age 15-49 who currently use family planning
24
17
6
5
2
2
7
Any method
Any modern method
Injectables
Pill
Male condom
Female sterilization
Traditional method
0 5 10 15 20 25 30
Percent
Contraceptive use increased dramatically between 1998 and 2003 but has remained relatively stable since 2003.
Trends in Current Use of Contraceptive Methods,Ghana 1988-2008
13
5
8
20
10 10
22
13
9
25
19
7
24
17
7
Any method Any modern method Any traditional method0
5
10
15
20
25
30Percentage currently married women
1988 1993 1998 2003 2008
18
Current use by background characteristics
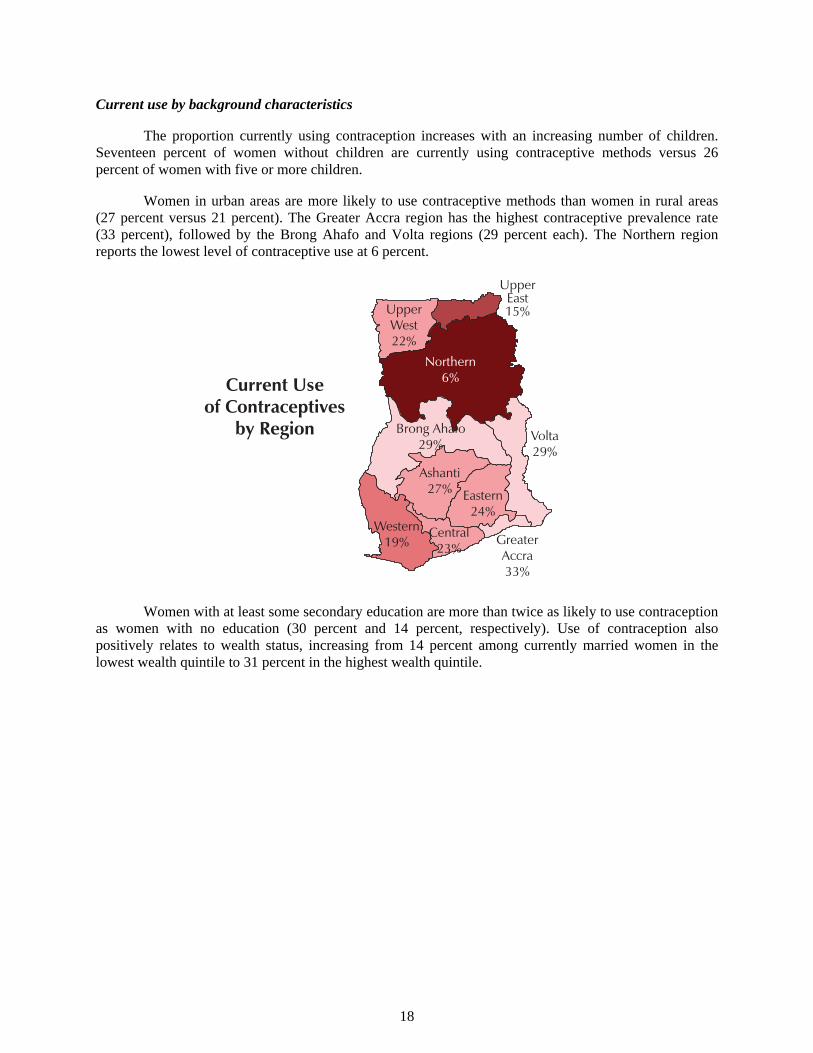
The proportion currently using contraception increases with an increasing number of children. Seventeen percent of women without children are currently using contraceptive methods versus 26 percent of women with five or more children.
Women in urban areas are more likely to use contraceptive methods than women in rural areas (27 percent versus 21 percent). The Greater Accra region has the highest contraceptive prevalence rate (33 percent), followed by the Brong Ahafo and Volta regions (29 percent each). The Northern region reports the lowest level of contraceptive use at 6 percent.
UpperEast15%
Northern6%
Brong Ahafo29%
Volta29%
Ashanti27% Eastern
24%Western
19%Central
23%Greater Accra33%
Current Useof Contraceptives
by Region
Upper West22%
Women with at least some secondary education are more than twice as likely to use contraception as women with no education (30 percent and 14 percent, respectively). Use of contraception also positively relates to wealth status, increasing from 14 percent among currently married women in the lowest wealth quintile to 31 percent in the highest wealth quintile.

19
Current Use of Contraception by Education and Wealth
14
27
27
30
14
20
22
29
31
Mother’s education
No education
Primary
Middle/JSS
Secondary+
Wealth quintile
Lowest
Second
Middle
Fourth
Highest
0 10 20 30 40 50
Percent
Indicator 5.4: Adolescent birth rate (per 1,000 women age 15-19)
The adolescent birth rate measures the annual number of births to women 15-19 years of age per 1,000 women in that age group. It represents the risk of childbearing among adolescent women 15-19 years of age. It is also referred to as the age-specific fertility rate for women age 15-19.
There are 66 births per 1,000 women age 15-19 in Ghana. The adolescent birth rate is significantly higher among rural women (82 births per 1,000 women age 15-19) than urban women (49 births per 1,000 women age 15-19). The number of births to adolescent girls has decreased from 74 to 66 per 1,000 women age 15-19 since 2003, with the largest decline observed among rural women (from 113 births to 82 births per 1,000 women).
Indicator 5.5 (part1): Antenatal care coverage by a skilled health professional (at least one visit)12
Antenatal care by a skilled health professional is another indicator that is used to measure progress in maternal health by tracking the quality of health care received during pregnancy.
More than 9 in 10 mothers (95 percent) receive antenatal care from a health professional (doctor, nurse, midwife, or community health officer). This percentage has increased steadily over the last two decades from 82 percent in 1988 to 95 percent in 2008.
12 Among all births in the past 5 years. Skilled health personnel include a doctor, nurse, midwife, auxiliary midwife, and community health officer.

20
Trends in Antenatal Care Coverage by a Skilled Health Professional (At Least One Visit), Ghana 1988-2008
Note: Data for 1988, 1993, and 1998 are with reference to births, whereas data for antenatal care and tetanus toxoid for 2003 and 2008 are with reference to women who had a live birth. The reference period is five years preceding the survey except for 1993, which refers to the three years preceding the survey. In the 2008 GDHS, a skilled provider includes a doctor, nurse, midwife, auxiliary midwife, and a community health officer, while in all previous surveys a community health officer was not included.
8286 89 92 95
0
20
40
60
80
100Percentage of births
1988 1993 1998 2003 2008
Target achievement in Ghana (Target 5B): With 95 percent of mothers having received antenatal care from a health professional and the proportion steadily increasing over time, Ghana is well on its way to reach its target of universal access to reproductive health care.
Target Achievement in Ghana:Universal Access to Reproductive Health Care
95100
Received antenatal carefrom health professional
Target goal for access toreproductive health care
0
20
40
60
80
100Percent
Mothers are somewhat more likely to receive antenatal care from a health professional for the first birth (99 percent) than for births of order six or higher (92 percent).
Health professionals provide antenatal care services for 98 percent of mothers in urban areas versus 94 percent of mothers in rural areas. The large majority of mothers receive antenatal care services
21
from health professionals regardless of region of residence (96 percent to98 percent). However, mothers in the Volta and Central regions are less likely than other women to have access to antenatal care (91 percent and 92 percent, respectively).
The use of antenatal care services relates to women’s educational level. Almost all mothers (99 percent) with at least some secondary education receive prenatal care services from a health professional compared with 94 percent of mothers with primary or no education.
There is also a positive relationship between professional antenatal care coverage and wealth quintile, with 99 percent of women in the highest wealth quintile receiving care from a health professional compared with 93 percent of women in the lowest wealth quintile.
Indicator 5.5 (part 2): Antenatal care coverage by any provider, skilled or unskilled (at least four visits)13
Seventy-eight percent of women age 15-49 who had a live birth in the last five years had four or more antenatal care visits to a provider (skilled or unskilled). The percentage is higher for urban women (88 percent) than for rural women (72 percent). The percentage of women who had four or more antenatal care visits to a provider for their most recent birth in the last five years has increased from 69 percent in 2003 to 78 percent in 2008.
Indicator 5.6: Unmet need for family planning among currently married women
Unmet need for family planning is defined as the percentage of women who want to wait at least two years before their next birth, or stop childbearing entirely, but who are not using contraception.
More than one-third (35 percent) of married women in Ghana have an unmet need for family planning; 23 percent is unmet need for spacing births and 13 percent is unmet need for limiting births. Unmet need for family planning has changed very little from 34 percent in 2003 to 35 percent in 2008.
Unmet need is greatest among young women. Sixty-two percent of women age 15-19 have an unmet need for family planning, compared with 33 percent of women age 30-34. Unmet need is lower among women with secondary or higher education (28 percent) than amongwomen with primary education (41 percent) or no education (35 percent). It is also lowest among women from the wealthiest households (24 percent).
Unmet need is higher among women in rural households than women in urban households (38 percent versus 32 percent). Among regions, need is lowest in Greater Accra (27 percent) and highest in the Central region (50 percent).
13 Among last births in the past 5 years. Four or more visits to any provider, whether skilled or unskilled.

22
UpperEast32%
Northern32%
Brong Ahafo35%
Volta34%
Ashanti37% Eastern
40%Western
39%Central
50%Greater Accra27%
Unmet Need forFamily Planning
by Region
Percent of marriedwomen with
an unmet needfor family planning
Ghana35%
Upper West28%

23
Goal 6: Combat HIV/AIDS, Malaria, and Other Diseases
Target 6.A: Have halted by 2015 and begun to reverse the spread of HIV/AIDS
Target 6.B: Achieve, by 2010, universal access to treatment for HIV/AIDS for all those who need it
Target 6.C: Have halted by 2015 and begun to reverse the incidence of malaria and other major diseases14
Indicator 6.2: Condom use at last higher-risk sex: youth 15-24 years15
Consistent use of condoms in non-regular sexual partnerships substantially reduces the risk of sexual HIV transmission. This is especially important for young people who typically have relatively high numbers of non-regular sexual partnerships.
In Ghana higher-risk sex is more common among young men (86 percent) than among young women (52 percent). Condom use at last higher-risk sexual intercourse is also greater among young men (46 percent) than among young women (28 percent).
Condom use at the last higher-risk sex is somewhat more common among older respondents age 20-24 years (31 percent for women and 49 percent for men) than younger respondents age 15-19 years (24 percent for women and 40 percent for men). Urban youth age 15-24 (34 percent of women and 52 percent of men) are more likely to use a condom at higher-risk sexual intercourse than rural youth (22 percent of women and 41 percent of men).
Condom Use at Higher-risk Sex among Youthby Urban-Rural Residence
34
22
52
41
Urban Rural
Residence
0
20
40
60
80
100Percent
Women Men
14 The 2008 GDHS did not report on indicators that are used to assess progress on targets 6A, 6B and 6C; hence, progress toward these targets over time cannot be assessed in this report. 15 Based on de facto population age 15-24. Higher risk refers to sexual intercourse with a non-marital, non-cohabiting partner; time frame is 12 months preceding the survey.

24
Condom use at higher-risk sexual intercourse is most prevalent among young women in the Greater Accra (46 percent) and lowest in Ashanti (12 percent). Among young men, it ranges from 28 percent in the Northern region to 61 percent in Volta.
The proportion of women and men age 15-24 who used a condom at higher-risk sexual intercourse in the 12 months preceding the survey is highest among those with secondary or higher education (42 percent for women and 58 percent for men) and among youth in the highest wealth quintile (39 percent for women and 65 percent for men).
Indicator 6.3: Proportion of population age 15-24 years with comprehensive correct knowledge of HIV/AIDS16
This indicator reflects the success of national information, education, and communication programmes in promoting knowledge of valid HIV-prevention methods and reducing misconceptions about the disease.
Twenty-eight percent of women and 34 percent of men age 15-24 years in Ghana have comprehensive knowledge of AIDS. Comprehensive knowledge is highest among men age 23-24 (42 percent) and among never-married men age 15-25 years who have ever had sex (37 percent). Among women age 15-24 years these factors do not have an impact on comprehensive knowledge.
Women and men in urban areas (34 percent and 42 percent, respectively) have a higher level of comprehensive knowledge of HIV/AIDS than rural women and men (22 percent and 28 percent, respectively). The highest percentage of comprehensive knowledge of HIV/AIDS is among women living in the Volta and Upper East regions (39 percent each) and among men in the Greater Accra region (51 percent). It is also highest among youth with secondary or higher education (42 percent of women and 55 percent of men), and youth in the highest wealth quintile (34 percent of women and 50 percent of men).
Comprehensive Knowledge of HIV/AIDS among Youthby Education and Wealth
18
16
29
42
17
22
30
33
34
13
22
29
55
23
27
31
38
50
Education
No education
Primary
Middle/JSS
Secondary+
Wealth quintile
Lowest
Second
Middle
Fourth
Highest
0 10 20 30 40 50 60
Percent
Women
Men
16 Respondents with “comprehensive, correct knowledge” of AIDS are those who (1) say that using a condom every time for sexual intercourse and having just one HIV-negative and faithful partner can reduce the chances of getting the AIDS virus, and further, (2) say that a healthy-looking person can have the AIDS virus, and (3) reject the common misconception that HIV can be spread by mosquito bites and by sharing food with someone with AIDS.

25
Indicator 6.4: Ratio of school attendance of orphans to school attendance of non-orphans age 10-14 years
Orphan prevalence is rising steadily in many countries due to HIV/AIDS deaths among an ever-growing number of adults. Having fewer relatives within the prime adult ages means that orphaned children face an increasingly uncertain future. Children and adolescents orphaned by AIDS face decreased access to adequate nutrition, basic health care, housing, and clothing. They are likely to drop out of school owing to discrimination, emotional distress, inability to pay school fees, and the need to care for infected parents or caretakers or for younger siblings.
The GDHS asked questions to assess the situation of children who are orphaned or live in a house with chronically ill adults and who may be at a greater risk of dropping out of school. The survey collected information on school attendance of children age 10-14 by parental survival. The proportion of children age 10-14 attending school whose parents are both dead is 67 percent, and the proportion whose parents are both living and the child is residing with at least one parent is 88 percent. As a result, the overall ratio of school attendance of children whose parents are dead to those whose parents are living, and the child resides with at least one parent, is 0.76.
Indicator 6.7: Proportion of children under age 5 sleeping under insecticide-treated bednets17
Malaria is endemic for many countries and continues to be a major public health concern. It is one of the leading causes of morbidity and mortality in many parts of the world, especially among pregnant women and children under the age of five. Use of insecticide-treated nets (ITNs) is a very effective measure to prevent infection from malaria.
More than one in four children (28 percent) under age 5 slept under an ITN. The proportion of children under age 5 who slept under an ITN the night before the survey has increased sharply from 4 percent in 2003 to 28 percent in 2008.
Children less than one year of age were most likely to sleep under an ITN (35 percent) the night before the survey than other children. Children in rural areas were more likely than those in urban areas to have slept under an ITN the night before (31 percent vs. 24 percent). The proportion of children who slept under an ITN is highest in the Brong Ahafo region (50 percent) and lowest in the Northern region (11 percent).
Indicator 6.8: Proportion of children under age 5 with fever who are treated with appropriate antimalarial drugs
Fever is a symptom of malaria. Use of appropriate antimalarial drugs is another effective measure to prevent vulnerable groups from getting infected with malaria, hence preventing malaria-related morbidity and mortality.
One in five children under five years (20 percent) had a fever in the 2 weeks preceding the survey. Of these, 43 percent received an antimalarial drug. Artemisinin Combination Therapy (ACT) is by far the most common anti-malarial drug given to children for fever (22 percent).
Older children age 36-59 months are slightly more likely (47 to 48 percent) to be given antimalarial drugs for the treatment of fever than younger children under the age of 12 months (32 percent). Children living in urban areas are much more likely to be given anti-malarial drugs (53 percent) than children in rural areas (38 percent). Children of more educated mothers and children of mothers in the highest three wealth quintiles are more likely than other children to be given antimalarial drugs. 17 An insecticide-treated net (ITN) is (1) a factory-treated net that does not require any further treatment, (2) a pre-treated net obtained within the past 12 months, or (3) a net that has been soaked with insecticide within the past 12 months.

26
Goal 7: Ensure Environmental Sustainability
Target 7.C: Halve, by 2015, the proportion of people without sustainable access to safe drinking water and basic sanitation18
Indicator 7.8: Proportion of population using an improved drinking water source19
This indicator monitors access to improved water sources based on the assumption that improved sources are more likely to provide safe water. Unsafe water is the direct cause of many diseases in developing countries.
Overall, 84 percent of the population in Ghana obtains drinking water from an improved source. Thirteen percent have access to piped water in their dwelling, yard, or plot, 28 percent access drinking water from a public tap, and 31 percent get their drinking water from a tube well or borehole.
Population Using Improved Drinking Water by Source
13
28
31
6
01
Piped waterinto dwelling/
yard/plot
Public tap/standpipe
Tube wellor borehole
Protecteddug well
Protectedspring
Rainwater0
5
10
15
20
25
30
35Percent
The urban population is more likely than the rural population to use any improved source of drinking water (93 percent versus 77 percent).
Target achievement in Ghana (Target 7C): Analyses of available data by the Water and Sanitation Sector Monitoring Platform (WSMP) show that the proportion of the population that used improved drinking water sources was 56 percent in 1990.20 Given that 44 percent of the population did not use an improved drinking water source in 1990, the MDG target 7C for 2015 is 78 percent. Ghana has already met the target for safe water.
18 Target 7C is the only one under Goal 7 for which progress over time can be assessed based on 2008 GDHS data. 19 De jure population. Improved drinking water sources include water from pipe/tap, public tap, borehole or pump, protected well, protected spring, or rainwater. Improved water sources do not include vendor-provided water, bottled water, tanker trucks, or unprotected wells and springs. 20 Source: WSMP Ghana, March 2009

27
Target Achievement in Ghana:Use of Improved Drinking Water
8478
Obtains drinking waterfrom an improved source
Target goal0
20
40
60
80
100Percent
Indicator 7.9 Proportion of population using an improved sanitation facility21
Good sanitation is important for urban and rural populations, but the risks of poor sanitation are greatest in urban areas where it is more difficult to avoid contact with waste.
An improved toilet facility is considered the most efficient and hygienic method of human waste disposal. Overall, only 12 percent of the Ghana population use improved, not shared toilet facilities. There are marked differences by urban-rural residence. Eighteen percent of the urban population and 8 percent of the rural population use improved toilet facilities that are not shared with other households.
21 De jure population. Improved sanitary means of excreta disposal include facilities that hygienically separate human excreta from human, animal, and insect contact. Facilities such as sewers or septic tanks, pour-flush latrines, and simple pit or ventilated improved pit (VIP) latrines are assumed to be adequate, provided that they are not public (not shared).

28
Conclusions
Overall, Ghana has made substantial progress in reaching the Millennium Development Goals. However, there is still room for improvement and progress.
Fourteen percent of children under age five are underweight. The percent of children underweight has decreased slightly from 18 percent in 2003 to 14 percent in 2008.
Seventy-four percent of children age 6-11, who should be attending primary school, are currently doing so. The NAR for primary school increased sharply from 60 percent in 2003 to 74 percent in 2008. There is a slightly higher NAR for female youths than for male youths at the primary school level, indicating that there is not much of a gender gap in primary school attendance.
The infant mortality rate has declined from 64 deaths per 1,000 for the five-year period preceding the 2003 GDHS to 50 deaths per 1,000 during the same period prior to the 2008 GDHS. The under-five mortality rate decreased from 111 deaths per 1,000 for the five-year period preceding the 2003 GDHS to 80 deaths per 1,000 during the same period prior to the 2008 GDHS.
Ninety percent of children age 12-23 months old in Ghana are vaccinated against measles, an increase from 83 percent in 2003.
Fifty-nine percent of births are delivered with the assistance of a health professional. There has been an increase in access to professional assistance at delivery over the past five years, from 47 percent in 2003 to 59 percent in 2008.
Only 17 percent of currently married women are using a modern method of contraception. Almost one in four (24 percent) are using any method (modern or traditional).
There are 66 births per 1,000 women age 15-19 in Ghana. The adolescent birth rate is significantly higher among rural women (82 births per 1,000 women 15-19) than urban women (49 births per 1,000 women 15-19). The number of births to adolescent girls has decreased from 74 to 66 per 1,000 women age 15-19 since 2003, with the largest decline being observed among rural women (from 113 births to 82 births per 1,000 women).
More than nine in ten mothers (95 percent) receive antenatal care from a health professional (doctor, nurse, midwife, or community health officer). This percentage has increased steadily over the last two decades from 82 percent in 1988 to 95 percent in 2008.
More than one-third (35 percent) of married women in Ghana have an unmet need for family planning; 23 percent is unmet need for spacing births and 13 percent is unmet need for limiting births. Unmet need for family planning has remained relatively unchanged since 2003.
In Ghana higher-risk sex is more common among young men (86 percent) than among young women (52 percent). Only 46 percent of young men and 28 percent of young women used a condom at their last higher-risk sexual encounter. Only about one in four (28 percent) young women and one-third (34 percent) of young men in Ghana have comprehensive knowledge of AIDS.
The proportion of children age 10-14 attending school whose parents are both dead is 67 percent, and the proportion whose parents are both living and who are residing with at least one parent is 88 percent. Therefore, the overall ratio of school attendance of children whose parents are dead to those whose parents are living, and the child resides with at least one parent, is 0.76.

29
More than one in four (28 percent) children under age 5 slept under an ITN. The proportion of children under age 5 who slept under an ITN the night before the survey has increased sharply from 4 percent in 2003 to 28 percent in 2008.
One in five children under 5 years (20 percent) had a fever in the two weeks preceding the survey. Of these, 43 percent received an antimalarial drug.
Overall, 84 percent of the population in Ghana obtains drinking water from an improved source, while only 12 percent of the Ghana population uses improved, non-shared toilet facilities.

Official list of MDG indicators
All indicators should be disaggregated by sex and urban/rural as far as possible.
Effective 15 January 2008
Millennium Development Goals (MDGs) Goals and Targets
(from the Millennium Declaration) Indicators for monitoring progress
Goal 1: Eradicate extreme poverty and hunger Target 1.A: Halve, between 1990 and 2015, the proportion of people whose income is less than one dollar a day
1.1 Proportion of population below $1 (PPP) per daya 1.2 Poverty gap ratio 1.3 Share of poorest quintile in national consumption
Target 1.B: Achieve full and productive employment and decent work for all, including women and young people
1.4 Growth rate of GDP per person employed 1.5 Employment-to-population ratio 1.6 Proportion of employed people living below $1 (PPP) per day 1.7 Proportion of own-account and contributing family workers in total
employment Target 1.C: Halve, between 1990 and 2015, the proportion of people who suffer from hunger
1.8 Prevalence of underweight children under-five years of age 1.9 Proportion of population below minimum level of dietary energy
consumption Goal 2: Achieve universal primary education Target 2.A: Ensure that, by 2015, children everywhere, boys and girls alike, will be able to complete a full course of primary schooling
2.1 Net enrolment ratio in primary education 2.2 Proportion of pupils starting grade 1 who reach last grade of primary 2.3 Literacy rate of 15-24 year-olds, women and men
Goal 3: Promote gender equality and empower women Target 3.A: Eliminate gender disparity in primary and secondary education, preferably by 2005, and in all levels of education no later than 2015
3.1 Ratios of girls to boys in primary, secondary and tertiary education 3.2 Share of women in wage employment in the non-agricultural sector 3.3 Proportion of seats held by women in national parliament
Goal 4: Reduce child mortality Target 4.A: Reduce by two-thirds, between 1990 and 2015, the under-five mortality rate
4.1 Under-five mortality rate 4.2 Infant mortality rate 4.3 Proportion of 1 year-old children immunised against measles
Goal 5: Improve maternal health Target 5.A: Reduce by three quarters, between 1990 and 2015, the maternal mortality ratio
5.1 Maternal mortality ratio 5.2 Proportion of births attended by skilled health personnel
Target 5.B: Achieve, by 2015, universal access to reproductive health
5.3 Contraceptive prevalence rate 5.4 Adolescent birth rate 5.5 Antenatal care coverage (at least one visit and at least four visits) 5.6 Unmet need for family planning
Goal 6: Combat HIV/AIDS, malaria and other diseases Target 6.A: Have halted by 2015 and begun to reverse the spread of HIV/AIDS
6.1 HIV prevalence among population aged 15-24 years 6.2 Condom use at last high-risk sex 6.3 Proportion of population aged 15-24 years with comprehensive correct
knowledge of HIV/AIDS 6.4 Ratio of school attendance of orphans to school attendance of non-
orphans aged 10-14 years Target 6.B: Achieve, by 2010, universal access to treatment for HIV/AIDS for all those who need it
6.5 Proportion of population with advanced HIV infection with access to antiretroviral drugs
Target 6.C: Have halted by 2015 and begun to reverse the incidence of malaria and other major diseases
6.6 Incidence and death rates associated with malaria 6.7 Proportion of children under 5 sleeping under insecticide-treated
bednets 6.8 Proportion of children under 5 with fever who are treated with
appropriate anti-malarial drugs 6.9 Incidence, prevalence and death rates associated with tuberculosis 6.10 Proportion of tuberculosis cases detected and cured under directly
observed treatment short course
30

Goal 7: Ensure environmental sustainability Target 7.A: Integrate the principles of sustainable development into country policies and programmes and reverse the loss of environmental resources Target 7.B: Reduce biodiversity loss, achieving, by 2010, a significant reduction in the rate of loss
7.1 Proportion of land area covered by forest 7.2 CO2 emissions, total, per capita and per $1 GDP (PPP) 7.3 Consumption of ozone-depleting substances 7.4 Proportion of fish stocks within safe biological limits 7.5 Proportion of total water resources used 7.6 Proportion of terrestrial and marine areas protected 7.7 Proportion of species threatened with extinction
Target 7.C: Halve, by 2015, the proportion of people without sustainable access to safe drinking water and basic sanitation
7.8 Proportion of population using an improved drinking water source 7.9 Proportion of population using an improved sanitation facility
Target 7.D: By 2020, to have achieved a significant improvement in the lives of at least 100 million slum dwellers
7.10 Proportion of urban population living in slumsb
Goal 8: Develop a global partnership for development Target 8.A: Develop further an open, rule-based, predictable, non-discriminatory trading and financial system Includes a commitment to good governance, development and poverty reduction – both nationally and internationally Target 8.B: Address the special needs of the least developed countries Includes: tariff and quota free access for the least developed countries' exports; enhanced programme of debt relief for heavily indebted poor countries (HIPC) and cancellation of official bilateral debt; and more generous ODA for countries committed to poverty reduction Target 8.C: Address the special needs of landlocked developing countries and small island developing States (through the Programme of Action for the Sustainable Development of Small Island Developing States and the outcome of the twenty-second special session of the General Assembly) Target 8.D: Deal comprehensively with the debt problems of developing countries through national and international measures in order to make debt sustainable in the long term
Some of the indicators listed below are monitored separately for the least developed countries (LDCs), Africa, landlocked developing countries and small island developing States.
Official development assistance (ODA) 8.1 Net ODA, total and to the least developed countries, as percentage of
OECD/DAC donors’ gross national income 8.2 Proportion of total bilateral, sector-allocable ODA of OECD/DAC donors
to basic social services (basic education, primary health care, nutrition, safe water and sanitation)
8.3 Proportion of bilateral official development assistance of OECD/DAC donors that is untied
8.4 ODA received in landlocked developing countries as a proportion of their gross national incomes
8.5 ODA received in small island developing States as a proportion of their gross national incomes
Market access 8.6 Proportion of total developed country imports (by value and excluding
arms) from developing countries and least developed countries, admitted free of duty
8.7 Average tariffs imposed by developed countries on agricultural products and textiles and clothing from developing countries
8.8 Agricultural support estimate for OECD countries as a percentage of their gross domestic product
8.9 Proportion of ODA provided to help build trade capacity Debt sustainability 8.10 Total number of countries that have reached their HIPC decision points
and number that have reached their HIPC completion points (cumulative)
8.11 Debt relief committed under HIPC and MDRI Initiatives 8.12 Debt service as a percentage of exports of goods and services
Target 8.E: In cooperation with pharmaceutical companies, provide access to affordable essential drugs in developing countries
8.13 Proportion of population with access to affordable essential drugs on a sustainable basis
Target 8.F: In cooperation with the private sector, make available the benefits of new technologies, especially information and communications
8.14 Telephone lines per 100 population 8.15 Cellular subscribers per 100 population 8.16 Internet users per 100 population
The Millennium Development Goals and targets come from the Millennium Declaration, signed by 189 countries, including 147 heads of State and Government, in September 2000 (http://www.un.org/millennium/declaration/ares552e.htm) and from further agreement by member states at the 2005 World Summit (Resolution adopted by the General Assembly - A/RES/60/1, http://www.un.org/Docs/journal/asp/ws.asp?m=A/RES/60/1). The goals and targets are interrelated and should be seen as a whole. They represent a partnership between the developed countries and the developing countries “to create an environment – at the national and global levels alike – which is conducive to development and the elimination of poverty”.
a For monitoring country poverty trends, indicators based on national poverty lines should be used, where available. b The actual proportion of people living in slums is measured by a proxy, represented by the urban population living in households with at least one of the four characteristics: (a) lack of access to improved water supply; (b) lack of access to improved sanitation; (c) overcrowding (3 or more persons per room); and (d) dwellings made of non-durable material.
31