milking the system: how agricultural supply management impedes
TRANSCRIPT

A Macdonald-Laurier Institute Publication – June 2012 1A Macdonald-Laurier Institute Publication – June 2012 1
HUNGRY FOR CHANGE SERIES
The Economic Implications of Agricultural Supply Management in CanadaCHRISTOPHER SARLO AND LARRY MARTIN
Canada’s Trade Opportunities at Risk from Supply Management IAN LEE
Edited By JASON CLEMENS AND BRIAN LEE CROWLEY
Milking the System How Agricultural Supply Management Impedes Trade Opportunities and Egregiously Transfers IncomeJune 2012
A Macdonald-Laurier Institute Publication

Board of Directors
CHAIR Rob Wildeboer Chairman, Martinrea International Inc., Toronto
MANAGING DIRECTOR Brian Lee Crowley Former Clifford Clark Visiting Economist at Finance Canada
SECRETARY Lincoln Caylor Partner, Bennett Jones, Toronto
TREASURER Martin MacKinnon CFO, Black Bull Resources Inc., Halifax
DIRECTORSJohn Beck Chairman and CEO, Aecon Construction Ltd., Toronto
Erin Chutter President and CEO, Puget Ventures Inc., Vancouver
Navjeet (Bob) Dhillon CEO, Mainstreet Equity Corp., Calgary
Keith Gillam Former CEO of VanBot Construction Ltd., Toronto
Wayne Gudbranson CEO, Branham Group, Ottawa
Stanley Hartt Chair, Macquarie Capital Markets Canada
Les Kom BMO Nesbitt Burns, Ottawa
Peter John Nicholson Former President, Canadian Council of Academies, Ottawa
Rick Peterson President, Peterson Capital, Vancouver
Jacquelyn Thayer Scott Past President, Professor, Cape Breton University, Sydney
Advisory Council
Purdy Crawford Former CEO, Imasco, Counsel at Osler HoskinsJim Dinning Former Treasurer of AlbertaDon Drummond Economics Advisor to the TD Bank, Matthews Fellow in Global Policy and Distinguished Visiting Scholar at the School of Policy Studies at Queen’s UniversityBrian Flemming International lawyer, writer and policy advisorRobert Fulford Former editor of Saturday Night magazine, columnist with the National Post, TorontoCalvin Helin Aboriginal author and entrepreneur, VancouverHon. Jim Peterson Former federal cabinet minister, Partner at Fasken Martineau, TorontoMaurice B. Tobin The Tobin Foundation, Washington DC
Research Advisory Board
Janet Ajzenstat Professor Emeritus of Politics, McMaster University
Brian Ferguson Professor, health care economics, University of Guelph
Jack Granatstein Historian and former head of the Canadian War Museum
Patrick James Professor, University of Southern California
Rainer Knopff Professor of Politics, University of Calgary
Larry Martin George Morris Centre, University of Guelph
Christopher Sands Senior Fellow, Hudson Institute, Washington DC
William Watson Associate Professor of Economics, McGill University
For more information visit: www.MacdonaldLaurier.ca
True North in Canadian Public Policy

Executive Summary ...........................................2
Introduction ....................................................... 2
Clarifying Terms ................................................. 2
Income Transfer Implicit in Supply Management ....................................................... 3
Supply Management as a Barrier to Trade .......... 3
Conclusion ......................................................... 4
Sommaire ...........................................................5
Introduction ....................................................... 5
Précisions terminologiques ................................ 5
Le transfert de revenus inhérent à la gestion de l’offre .................................................................. 6
La gestion de l’offre en tant qu’obstacle au commerce .......................................................... 6
Conclusion ......................................................... 7
The Economic Implications of Agricultural Supply Management in Canada ........................8
Introduction ............................................................ 8
Supply Management versus the Market .................. 9
The Basic Economics of Supply Management ......... 9
Ontario and Marketing Boards ........................ 11
The Impact of Supply Management on Food Prices ....................................................... 11
The Impact of Supply Management on Low-Income Canadian Consumers ............................................. 12
The Impact of Supply Management on Producers of Regulated Farm Products ...................................... 14
The Value of Quotas ......................................... 14
Higher Revenues to Farmers ............................ 14
Canadian Farm Businesses ................................ 14
Canadian Farm Families .................................... 15
A Note on Quotas ............................................. 15
Conclusion ............................................................ 16
About the Authors ................................................. 17
Endnotes ................................................................ 18
References ............................................................. 18
Appendix 1 Ontario Marketing Boards ................. 20
Canada’s Trade Opportunities at Risk from Supply Management .......................................21
Introduction .......................................................... 21
Trade as a Government Priority .......................... 21
A Short History of the Trans Pacific Partnership ... 22
Canada’s Trade Partners ........................................ 23
Trans Pacific Partnership Countries and Asia-Pacific Region: Opportunities for Canada ...... 26
Opposition to Canada’s Entry ............................... 29
Conclusion ............................................................ 29
About the Author .................................................. 30
Endnotes ................................................................ 30
The authors of this document have worked independently and are solely responsible for the views presented here. The opinions are not necessarily those of the Macdonald-Laurier Institute, its Directors or Supporters.
Table of Contents

Milking the System: How Agricultural Supply Management Impedes Trade Opportunities and Egregiously Transfers Income2
Executive SummaryExecutive Summary
IntroductionAgricultural supply management and marketing boards are normally sleeper issues in Canada. However, an unusual confluence of events has necessitated greater scrutiny of both policies and in particular, supply management. Specifically, the decision by the federal government to unwind one of the more prominent marketing boards (the Canadian Wheat Board) coupled with the obstacles supply management poses to trade negotiations with both Europe and the Trans Pacific Partnership (TPP) have put these issues front and centre in the public mind.
As our contribution to informed public debate on supply management, the Macdonald-Laurier Institute (MLI) commissioned two essays. The first, by Chris Sarlo and Larry Martin, looks at who wins under supply management and who pays the bill. The second, by Ian Lee, details the obstacles supply management poses to Canada’s efforts to gain access to important foreign markets.
Clarifying TermsThe terms “supply management” and “marketing board” are often used interchangeably in Canada. The term “supply management”, however, is a narrow concept that applies to a few agricultural commodities such as milk, cheese, poultry, and eggs. Supply management is a government-provided mechanism to raise agricultural prices and farm incomes. This is achieved by controlling who is allowed to produce these commodities as well as how much they’re permitted to produce, thanks to a strictly enforced system of licences and quotas. In addition, high tariffs are imposed on imports of the supply-managed commodities. By thus controlling both domestic and foreign supply, supply management increases the price producers can charge for their commodity.
Marketing boards, on the other hand, involve a broader range of agricultural products and include such tasks as promotion, collective sales, price negotiation, and facilitation of international trade. The majority of marketing boards do not possess the power to control supply, prices, and restrict imports as does supply management.
A Macdonald-Laurier Institute Publication – June 2012 3
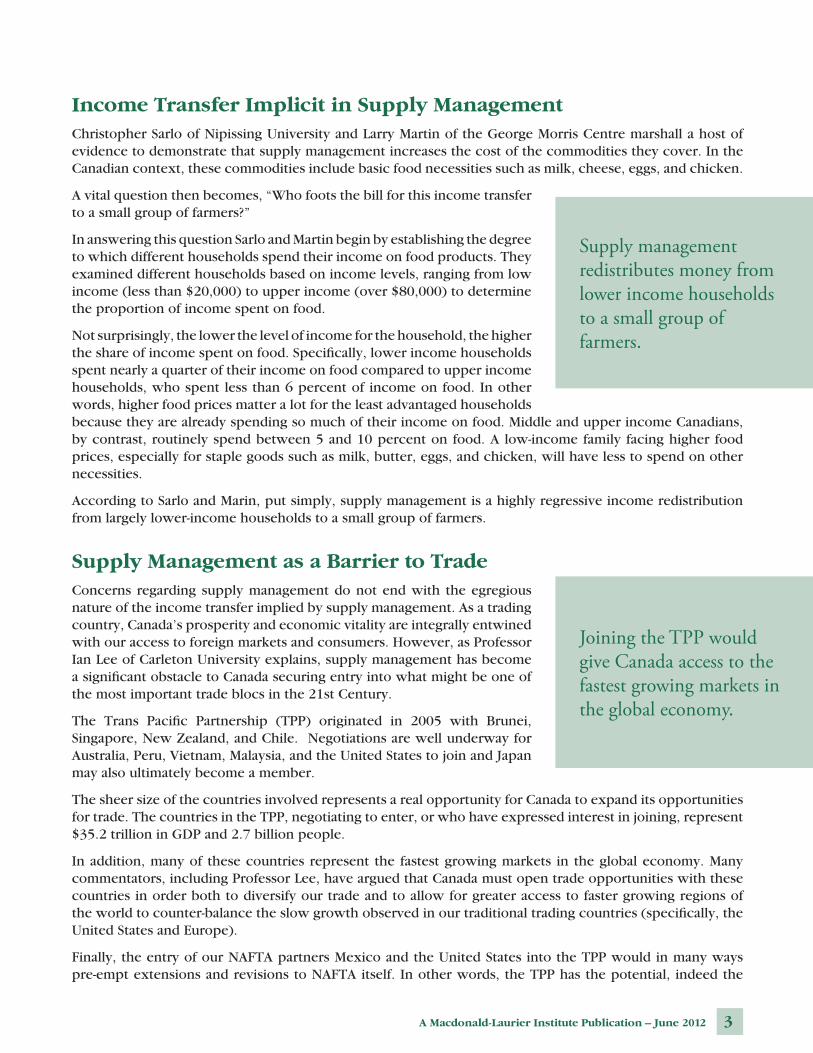
Income Transfer Implicit in Supply ManagementChristopher Sarlo of Nipissing University and Larry Martin of the George Morris Centre marshall a host of evidence to demonstrate that supply management increases the cost of the commodities they cover. In the Canadian context, these commodities include basic food necessities such as milk, cheese, eggs, and chicken.
A vital question then becomes, “Who foots the bill for this income transfer to a small group of farmers?”
In answering this question Sarlo and Martin begin by establishing the degree to which different households spend their income on food products. They examined different households based on income levels, ranging from low income (less than $20,000) to upper income (over $80,000) to determine the proportion of income spent on food.
Not surprisingly, the lower the level of income for the household, the higher the share of income spent on food. Specifically, lower income households spent nearly a quarter of their income on food compared to upper income households, who spent less than 6 percent of income on food. In other words, higher food prices matter a lot for the least advantaged households because they are already spending so much of their income on food. Middle and upper income Canadians, by contrast, routinely spend between 5 and 10 percent on food. A low-income family facing higher food prices, especially for staple goods such as milk, butter, eggs, and chicken, will have less to spend on other necessities.
According to Sarlo and Marin, put simply, supply management is a highly regressive income redistribution from largely lower-income households to a small group of farmers.
Supply Management as a Barrier to TradeConcerns regarding supply management do not end with the egregious nature of the income transfer implied by supply management. As a trading country, Canada’s prosperity and economic vitality are integrally entwined with our access to foreign markets and consumers. However, as Professor Ian Lee of Carleton University explains, supply management has become a significant obstacle to Canada securing entry into what might be one of the most important trade blocs in the 21st Century.
The Trans Pacific Partnership (TPP) originated in 2005 with Brunei, Singapore, New Zealand, and Chile. Negotiations are well underway for Australia, Peru, Vietnam, Malaysia, and the United States to join and Japan may also ultimately become a member.
The sheer size of the countries involved represents a real opportunity for Canada to expand its opportunities for trade. The countries in the TPP, negotiating to enter, or who have expressed interest in joining, represent $35.2 trillion in GDP and 2.7 billion people.
In addition, many of these countries represent the fastest growing markets in the global economy. Many commentators, including Professor Lee, have argued that Canada must open trade opportunities with these countries in order both to diversify our trade and to allow for greater access to faster growing regions of the world to counter-balance the slow growth observed in our traditional trading countries (specifically, the United States and Europe).
Finally, the entry of our NAFTA partners Mexico and the United States into the TPP would in many ways pre-empt extensions and revisions to NAFTA itself. In other words, the TPP has the potential, indeed the
Joining the TPP would give Canada access to the fastest growing markets in the global economy.
Supply management redistributes money from lower income households to a small group of farmers.

Milking the System: How Agricultural Supply Management Impedes Trade Opportunities and Egregiously Transfers Income4
likelihood, to become a super-NAFTA, in which Canada obviously has direct and immediate interests in participating.
One of the most significant barriers to Canada’s entry comes from several of our strongest allies. Both New Zealand and Australia have adamantly and publicly opposed Canada’s participation unless we commit to unwinding our use of supply management. To some degree this opposition is understandable, given the wrenching reforms these two countries went through to eliminate similar programs. The reality for Canada is that it will be very difficult for us to negotiate and secure entry into the TPP if supply management remains. Put simply, forgoing membership in the TPP to protect supply management would endanger broad economic prosperity including job creation, investment, and business development across the country in order to maintain a program that benefits a very small number of farmers.
ConclusionThere should be little doubt of the enormous benefits available to Canadians from phasing out supply management. The resulting reduction in the price of staple goods such as milk, cheese, eggs, and chicken would disproportionately benefit lower-income households who spend a higher share of their income on food. In addition, the elimination of supply management will allow Canada to participate in negotiations and secure access to the TPP, which offers the country enormous opportunities for business investment, job creation, and trade more broadly.

A Macdonald-Laurier Institute Publication – June 2012 5
SommaireSommaire
IntroductionEn temps normal, la gestion de l’offre et les offices de commercialisation agricoles sont des questions qui restent à l’écart des projecteurs dans les débats canadiens. Toutefois, une série d’événements exceptionnels a rendu nécessaire un examen plus approfondi de ces deux mesures et en particulier de la gestion de l’offre. Notamment, la décision du gouvernement fédéral de démanteler l’un des principaux offices de commercialisation (la Commission canadienne du blé) de même que les obstacles dressés par la gestion de l’offre dans le cadre des négociations commerciales avec l’Europe et avec le Partenariat transpacifique ont mis ces sujets à l’avant-scène.
En guise de contribution aux débats publics sur la gestion de l’offre, l’Institut Macdonald-Laurier a commandé deux articles. Le premier, signé par Chris Sarlo et Larry Martin, évalue qui profite du système de gestion de l’offre et qui acquitte la facture. Le second, de Ian Lee, documente les obstacles dressés par la gestion de l’offre dans le cadre des efforts du Canada visant à accéder à d’importants marchés étrangers.
Précisions terminologiquesLes expressions « gestion de l’offre » et « office de commercialisation » sont souvent employées indistinctement au Canada. Le terme « gestion de l’offre », cependant, est un concept plus étroit qui s’applique à seulement quelques denrées agricoles comme le lait, le fromage, la volaille et les œufs. La gestion de l’offre est un mécanisme mis en place par l’État afin d’augmenter les prix et les revenus agricoles. Cet objectif est atteint en imposant des restrictions – par l’entremise d’un régime de permis et de quotas strict – au nombre de producteurs de ces denrées de même qu’à la quantité qu’ils ont l’autorisation de produire. De plus, des tarifs douaniers élevés sont appliqués lors de l’importation des denrées couvertes par la gestion de l’offre. En limitant ainsi l’approvisionnement local et étranger, la gestion de l’offre augmente le prix que les producteurs peuvent demander pour leur production.
Les offices de commercialisation, à l’inverse, couvrent un éventail plus large de produits agricoles et comprennent des fonctions comme la promotion, la vente collective, la négociation des prix et la facilitation du commerce international. La majorité des offices de commercialisation n’ont pas le pouvoir de gérer l’offre, de fixer les prix et de restreindre les importations comme c’est le cas dans le cadre du système de gestion de l’offre.

Milking the System: How Agricultural Supply Management Impedes Trade Opportunities and Egregiously Transfers Income6
Le transfert de revenus inhérent à la gestion de l’offreChristopher Sarlo de l’Université Nipissing et Larry Martin du Centre George Morris ont rassemblé une série de données démontrant que la gestion de l’offre augmente le coût des denrées qu’elle couvre. Dans le contexte canadien, ces denrées comprennent des produits de première nécessité comme le lait, le fromage, les œufs et le poulet.
Une question essentielle se pose : « qui paie la facture pour ce transfert de revenus vers un groupe restreint d’agriculteurs? »
Pour répondre à cette question, MM. Sarlo et Martin commencent par déterminer quelle proportion de leur revenu différentes catégories de ménages dépensent pour l’alimentation. Ces catégories ont été divisées en fonction de leur revenu, allant des revenus annuels les plus faibles (moins de 20 000 $) aux plus élevés (plus de 80 000 $).
Sans surprise, plus le revenu du ménage est faible, plus la proportion de ce revenu consacrée aux dépenses d’alimentation est élevée. Plus précisément, les ménages à plus faibles revenus ont dépensé près du quart de leur revenu pour s’alimenter, comparativement à moins de 6 % pour les ménages aux revenus les plus élevés. En d’autres mots, des prix alimentaires plus élevés ont une grande incidence pour les ménages
les moins favorisés puisqu’ils dépensent déjà une proportion si élevée de leur revenu pour se nourrir. En revanche, les ménages canadiens à revenu moyen et élevé consacrent habituellement de 5 à 10 % de leur revenu à l’alimentation. Une famille à faible revenu devant payer des prix plus élevés pour se nourrir, particulièrement pour des produits de base comme le lait, le beurre, les œufs et le poulet, aura moins d’argent disponible pour combler ses autres besoins.
En bref, d’après MM. Sarlo et Martin, la gestion de l’offre constitue une forme de redistribution des revenus très régressive principalement de ménages à plus faible revenu vers un groupe restreint d’agriculteurs.
La gestion de l’offre en tant qu’obstacle au commerceLes préoccupations à propos de la gestion de l’offre ne se limitent pas à la nature discutable du transfert de revenus inhérent à ce système. La prospérité et la vitalité économique du Canada, en tant que pays comptant dans une large mesure sur le commerce, sont fortement liées à son accès aux marchés et consommateurs étrangers. Cependant, comme l’explique le professeur Ian Lee de l’Université Carleton, la gestion de l’offre est devenue un important obstacle à la volonté du Canada d’obtenir un accès à ce qui pourrait être l’un des blocs commerciaux les plus importants du XXIe siècle.
Le Partenariat transpacifique (PTP) a vu le jour en 2005 avec comme membres Brunéi, Singapour, la Nouvelle-Zélande et le Chili. Les négociations sont très avancées pour admettre l’Australie, le Viet Nam, la Malaisie et les États-Unis. Le Japon pourrait aussi devenir membre à un moment ultérieur.
L’immense taille des pays concernés représente une occasion concrète pour le Canada de développer ses échanges commerciaux. Les pays membres du PTP, ceux qui négocient actuellement leur admission ou ceux qui ont fait part de leur intérêt à ce sujet ont un PIB combiné de 35,2 billions de dollars et une population de 2,7 milliards de personnes.
La gestion de l’o�re redistribue de l’argent
des ménages à plus faible revenu vers un groupe
restreint d’agriculteurs.
En joignant le Partenariat transpaci�que, le Canada
obtiendrait un accès aux marchés a�chant la plus forte croissance de
l’économie mondiale.

A Macdonald-Laurier Institute Publication – June 2012 7
En outre, beaucoup de ces pays sont parmi les marchés affichant la croissance la plus rapide de l’économie mondiale. De nombreux observateurs, dont le professeur Lee, soutiennent que le Canada doit libéraliser ses relations commerciales avec ces pays afin de les diversifier et de permettre un accès plus grand aux régions à la croissance la plus forte dans le monde afin de contrebalancer la faible croissance observée dans les endroits qui sont nos partenaires commerciaux traditionnels (en particulier, les États-Unis et l’Europe).
Finalement, l’admission du Mexique et des États-Unis – nos partenaires dans l’ALENA – dans le PTP aurait pour effet de devancer sous plusieurs aspects des ajouts et révisions à l’ALENA lui-même. En d’autres mots, il est possible – et même probable – que le PTP devienne un super-ALENA. Évidemment, la participation du Canada à cette entente a un intérêt direct et immédiat pour lui.
L’un des principaux obstacles à l’admission du Canada est l’objection de certains de nos plus grands alliés. Tant la Nouvelle-Zélande que l’Australie ont catégoriquement et publiquement fait connaître leur opposition à la participation du Canada à moins qu’il s’engage à démanteler son système de gestion de l’offre. Cette opposition est compréhensible dans une certaine mesure, étant donné les réformes difficiles mises en œuvre par ces deux pays pour éliminer des programmes semblables. La dure réalité pour le Canada est qu’il sera très difficile pour lui de négocier et d’être admis dans le PTP si la gestion de l’offre reste en place. En bref, renoncer à devenir membre du PTP pour protéger la gestion de l’offre mettrait en péril des occasions inestimables de développement de la prospérité générale, qui comprend la création d’emplois, des investissements et le développement d’entreprises aux quatre coins du pays, tout cela dans le but de maintenir un programme qui ne profite qu’à un nombre très restreint d’agriculteurs.
ConclusionIl ne fait aucun doute que la population canadienne obtiendrait d’énormes avantages à la suite de l’abandon progressif de la gestion de l’offre. La réduction subséquente du prix de produits de base comme le lait, le fromage, les œufs et le poulet avantagerait particulièrement les ménages à plus faible revenu qui dépensent une plus grande proportion de leur revenu pour se nourrir. De plus, l’élimination de la gestion de l’offre permettrait au Canada de participer aux négociations liées au Partenariat transpacifique et d’obtenir un accès aux marchés des pays membres, ce qui lui donnerait un nombre inestimable d’occasions d’investissement, de création d’emplois et d’expansion des échanges commerciaux.

Milking the System: How Agricultural Supply Management Impedes Trade Opportunities and Egregiously Transfers Income8
The Economic Implications of Agricultural Supply Management in CanadaCHRISTOPHER SARLO AND LARRY MARTIN
IntroductionIn the Canadian context, the terms “marketing board” and “supply management” are often used to refer to the same thing. However, the term “supply management” is a narrower concept than marketing boards and applies to five agricultural commodities. Supply management is a government-provided mechanism to raise agricultural prices and farm incomes. Supply management is incomplete (and ultimately ineffective) without
government involvement to enforce licensing and quotas and to restrict imports.
Marketing boards, on the other hand, involves a broader range of agricultural products and includes such tasks as promotion, collective sales, price negotiation, and facilitation of international trade. The majority of marketing boards do not possess the same powers to control supply, prices, and restrict imports as does supply management.
The system of agricultural marketing boards, according to one historian,1 stems back to the Farm Products Control Act, enacted by the government of Ontario in 1937. The vast majority of marketing boards are formed and organized under provincial legislation. Agriculture, under the Canadian constitution, is a shared jurisdiction between federal and provincial governments: Provinces have jurisdiction over markets within a province,
while the federal government has jurisdiction when transactions are made between provinces.
The special case of national supply management boards for dairy, eggs, chicken, and turkey, established under the Canadian Dairy Commission Act in 1966 and the National Farm Products Marketing Agencies Act in 1972, is more controversial. These acts, along with the pre-existing provincial laws, permitted the formation of national boards that work in conjunction with provincial boards to manage supply and price in the domestic market. Their power to do this is additionally enabled by two decisions by the federal government. The first is to exempt the agencies from The Competition Act, which expressly forbids price fixing and coordinated supply restriction in other industries. The second is to apply very high tariffs to imports of dairy and poultry products from other countries.2
Supply management restricts domestic
production and foreign imports to raise prices.

A Macdonald-Laurier Institute Publication – June 2012 9
Supply Management versus the MarketAn unfettered market is one in which the forces of demand and supply determine the market price and quantity without any interference or involvement by the state. The interactions between buyers and sellers determine prices. The market is competitive if there are a great many buyers and sellers, no one of which is able to (alone) influence the price. Economists consider this situation ideal from an efficiency perspective. However many markets have uncompetitive aspects; for example, when there are significantly large buyers or sellers. An example of the latter is a cartel. A cartel is an association of producers of a particular product who voluntarily combine to act as a monopoly and try to raise the price substantially above the market equilibrium.
A marketing board that also possesses supply management powers is somewhat like a cartel but is more robust due to the role that the government plays in the process. There are three critical powers that such marketing boards have that make its grip on the domestic market far stronger than is the case with a cartel:
1) All producers (of the product) must be part of the marketing board. They require a government license and a quota to be part of the scheme. There are no “free riders” in the system as there can be with a cartel.
2) The government ensures that there is no external competition in the domestic market by (effectively) prohibiting imports. Cartels cannot do that and are limited to trying to persuade outsiders to join the group.
3) Marketing boards are exempt from anti-combines (anti-competition) laws.
The prevention of competition in the domestic market for the product is key. This allows the marketing board (with supply management powers) to set and maintain higher than market prices and have substantially less volatility in pricing to the extent that supply is effectively managed. Consumers, facing higher prices for the product, cannot rely on imports or new entrants into the market to put pressure on the high prices, as would be the case in a competitive market. Consumers are limited to making feasible substitutions based on relative prices.
The Basic Economics of Supply ManagementMarketing boards in general and supply management in particular were established in response to pressure from producer associations to both raise and stabilize farm incomes. Concerns about the level and stability of farm income stems from several factors. Among them are:
• Perceived lackofmarketpowerof individual farmersdealingwith suppliers andcustomers,manyofwhich were large and had considerable market power.
• Demandforagriculturalproductsis“priceinelastic,”meaningthatsmallchangesinproductioncanhavelarge effects on prices and incomes.
• Agricultureissubjecttoparticularrisks,especiallyweather,thatcanaffectproductionand,therefore,prices and income as above.
Supply management is not feasible without government intervention.

Milking the System: How Agricultural Supply Management Impedes Trade Opportunities and Egregiously Transfers Income10
These arguments, together with the fact that food is a basic necessity and the widespread perception that producers of food are historically special helped foster the view that substantial policies to assist food producers were needed. The fact that most other developed countries support their farmers put additional political pressure on Canada.
Supply management is essentially a system whereby a government sanctioned association of producers of a particular food category (for example, eggs) can maintain higher than market prices for its product by restricting supply. As mentioned, the federal government accommodates this strategy by effectively shutting out imports thus protecting the marketing board from competition.
Figure 1 illustrates the economic theory behind marketing boards.
FIGURE 1 The economics of marketing boards
The reduction in supply to the vertical line at Q2 pushes the price up to P2, to the advantage of producers. Each producer is assigned a quota and is limited to that much production. The sum of all member quotas is equal to quantity Q2. By managing supply, the board can ensure that the price stays at or near P2 over time, thus achieving a key benefit to farmers – that of price and income stability. As well, because many farm products (like milk, cheese, eggs, and chicken) have price inelastic demands, the rise in price will generate more revenue for farmers, again to their advantage.
The principle arguments against marketing boards are that by protecting the domestic market for Canadian producers, they raise prices above market levels; they operate less efficiently and with less innovation as a result; and they transfer wealth from a large number of consumers and processors to a small number of farmers. A further (and more recent) argument against marketing boards is that they constitute an impediment to trade arrangements with other nations.
Price
D
S
P1
Q1Q2
P2
D
S
Quantity

A Macdonald-Laurier Institute Publication – June 2012 11
Ontario and Marketing Boards Ontario is the largest Canadian province (by population) and it has the most extensive array of marketing boards. The current legislation guiding marketing boards in Ontario is the Farm Products Marketing Act (1990). The Act lays out the powers of the Ontario Farm Products Marketing Commission and the powers vested to each of the individual marketing boards by the Commission.3
In addition to those products specifically regulated, the Act (in section 12) provides for the “designation” of other producer associations if requested by a majority of the producers of a farm product. The Act provides somewhat similar powers and protections for these section 12 “designated” producers.
Appendix 1 displays an up-to-date list of the marketing boards in Ontario, including the section 12 associations.
The Impact of Supply Management on Food PricesThe most recent Canadian studies (CD Howe 2010; Conference Board 2009), examining the economic impact of supply management confirm the theoretical predictions and support the results of earlier studies (Montreal Economic Institute 2005; Lippert 2001; Barichello 1996). All of the studies show that supply management raise prices to consumers and processors and result in a significant transfer of wealth to farmers of regulated products, largely in the form of valuable quotas.
A Conference Board study (2009) showed that the price of milk in Canada is determined by a complex formula involving market conditions, producer costs, and “fair” return for producers. That “fair” return, for dairy farmers at least, is about five times the profit margin in the (unregulated) animal production sector. The study compares the prices of dairy products in Canada, the United States (which, while not a free market in dairy products, provides less government support to its dairy farmers than Canada according to the OECD [Conference Board 2009, 12]) and Australia-New Zealand, which represents a free market in dairy. The results are stark. By 2009, the Canadian (retail) price of milk was 38 percent higher than the United States and 42 percent higher than Australia; the price of butter was 26 and 57 percent higher, respectively (Conference Board 2009, 10-15). The study also points to the high (and still rising) cost of quotas as a source of unfairness and inefficiency. The study concludes by stating that “high prices, profits, and high quota values discourage inefficient producers from leaving the market” and “the system unfairly distributes benefits to producers at the expense of processors, consumers and restaurants”(Conference Board 2009, 34).
The CD Howe study (2010) examines the costs of the marketing board system in general and proposes a scheduled transition from the existing system to a fully free market within 20 years. In terms of price impacts, the study states that, between 1995 and 2009 when “prices of all food purchased from stores rose 39 percent over that period, prices for poultry, dairy and eggs rose 61, 51 and 54 percent, respectively” (CD Howe 2010, 6). The study points out that the increasing costs of quotas and the need for new entrants to have higher prices and protected markets further entrenches the system making it more difficult to make even modest changes. However, the study concludes that the supply management system must be eliminated for both economic and political reasons. It is inefficient, transfers economic benefits unfairly, and hurts our chances of engaging in further trade agreements.
Studies have repeatedly shown that supply management increases the prices of covered commodities.

Milking the System: How Agricultural Supply Management Impedes Trade Opportunities and Egregiously Transfers Income12
Figure 2 illustrates milk prices for eastern Canada, the upper Midwest of the U.S., and New York-New Jersey from January 1997 through to January 2011. The prices are depicted in Canadian dollars per hectolitre. As is clearly evident by Figure 2, Canadian prices exceed those observed in the U.S., in some cases by fairly large amounts, over the entirety of the period.
FIGURE 2 Comparative Milk Prices: Canada and the U.S.
SOURCE: Canadian Dairy Commission and US Department of Agriculture Agricultural Marketing Service; calculation by the authors.
The Impact of Supply Management on Low-Income Canadian ConsumersSupply management boards raise the prices of regulated food products above that which would prevail in a competitive market. There is also evidence that these boards stifle innovation and product development because there is less incentive to do so when the domestic market is protected. It shelters inefficient producers. Finally, there is likely to be a disproportionately adverse impact on lower income Canadians who spend a larger share of their income on food. This distributional impact has, arguably, been less emphasized in analyses of marketing board impacts. However, it is important, especially so to the extent that food products controlled by marketing boards have low price elasticities. Goods with low price elasticities have few substitutes and so increases in price result in little change in quantity demanded. It is fair to say that many of the major supply managed food products (milk, cheese, butter, eggs, and chicken) have this characteristic.4
80.00
70.00
60.00
50.00
40.00
30.00
20.00
10.00
0.00
$C
an/H
L
New York-New Jersey @ 3.5 BF Test (Can $/HL)
Upper Midwest @ 3.5 BF Test (Can $/HL)
Eastern Canada/P5 Blend Price @ 3.6 BF Test (Can $/HL)

A Macdonald-Laurier Institute Publication – June 2012 13
Table 1 displays the proportions of total income spent on food by income class in 2008. It is important to note that incomes and food expenditures are determined on an “adult equivalent” basis so that lower-income households (which have fewer members, on average) can be fairly compared to higher income households.
TABLE 1 Spending on food by income class, 2008
CANADA
Income Category Range Average annual income
Percentage of annual
income spent on food
Percentage of average annual income spent on food
in stores
Low Income <$20,000 $13,592 23.73% 19.93%
Lower-Middle $20,000-$40,000
$29,427 14.65% 11.92%
Middle $40,000-$60,000
$48,508 10.26% 7.82%
Upper-Middle $60,000-$80,000
$68,006 8.74% 6.40%
Upper Income >$80,000 $117,394 5.85% 4.11%
ONTARIO
Income Category Range Average annual income
Percentage of annual
income spent on food
Percentage of average annual income spent on food
in stores
Low Income <$20,000 $13,068 23.15% 18.91%
Lower-Middle $20,000-$40,000
$29,722 13.59% 11.66%
Middle $40,000-$60,000
$48,422 9.84% 7.42%
Upper-Middle $60,000-$80,000
$68,031 8.60% 6.28%
Upper Income >$80,000 $110,543 5.97% 4.24%
SOURCE: Statistics Canada, Survey of Household Spending, microdata file (SHS2008), and calculations by author.
The simple fact is that poorer Canadians spend up to one-quarter of their total income on food, and higher food prices do matter for the least advantaged households. Middle and upper income Canadians, in contrast, routinely spend between 5 and 10 percent on food. A low-income family facing higher food prices, especially for staple goods such as milk, butter, eggs, and chicken, will have less to spend on other necessities. This can be perceived as an unfair burden on poorer Canadians and should be an important policy consideration in any discussion of supply management.
It would be ideal if the proportional values were available for the specific foods under the control of supply management as well as the more general marketing boards. However, that data is not publicly available.

Milking the System: How Agricultural Supply Management Impedes Trade Opportunities and Egregiously Transfers Income14
Statistics Canada stopped providing detailed spending on specific foods in 2001. However, calculations by the senior author confirm that spending on dairy and eggs in 2001 as a proportion of income displayed essentially the same differential pattern shown in 2008 for food in general.
The Impact of Supply Management on Producers of Regulated Farm ProductsJust as there are adverse distributional effects of supply management on low-income Canadians, there are positive distributional effects for producers of regulated farm products. There are two sources of gains for farmers of regulated products: The value of the quotas and the higher incomes flowing to farmers in this higher-price, supply managed system.
The Value of QuotasAt the time supply management mechanisms were established, producers received their quotas for free. Because these quotas allow a producer to sell the regulated product at above market prices without fear of competition, these quotas are highly valued. Their market value is tracked because they are traded (when existing farmers leave or when, occasionally, new quotas are available). One source puts the value of the average dairy farm quota at “a minimum of $2 million (or $28,000 per cow)” (Conference Board 2009, ii). For chickens, the quota price in April 2012 is $125 per broiler5 so a quota for a farm with 16,000 birds would be worth about $2 million. The Conference Board of Canada has estimated that the aggregate value of dairy production quotas was about $28 billion in 2009 (2009, ii)
and growing at about 11 percent annually. The CD Howe Institute, using Statistics Canada data, put the value of poultry and egg quotas in 2008 at about $7.2 billion, growing at about 14 percent annually (2010, 3). This suggests that the aggregate value of quotas in Canada in these three product areas would be approaching $50 billion in 2012. These enormous increases in quota values represent one form of gain to farmers of a regulated product (in a supply restricted market).
Higher Revenues to FarmersTo the extent that farmers of regulated products face above market prices for their commodity, they stand to make higher revenues than would have been the case in a competitive market, assuming inelastic demands. The supply management system therefore results in a transfer of income from millions of Canadian consumers who pay higher prices for regulated food products (like milk, eggs, chicken, turkey) to several thousand domestic farmers. It is important to distinguish here between the farm as a corporate entity and the farm family.
Canadian Farm BusinessesCanadian farms, as businesses, do very well on average. In 2010, for example, the typical Canadian farm had total farm revenues of about $298,000 and net operating income (profit) of $51,000, for an average profit
�e market value of the average dairy farm quota
is $2 million.

A Macdonald-Laurier Institute Publication – June 2012 15
“margin” of 17 percent. The margin for dairy farmers was 26 percent (Agriculture and Agri-Food Canada (2012B, Table A.2)).
Canadian Farm FamiliesFarm families appear to be doing every bit as well. Average farm family income during the period 2006-2010 was about $97,300 annually, compared to about $89,000 in 2008 for families in general.6 The fact that the majority (about 78 percent) of that income is earned outside the farm might suggest to the naïve observer that farming is not a profitable occupation. Two considerations help explain this apparent anomaly.
1) Farming is very capital intensive. As well, a portion of it is seasonal. It would not be surprising, therefore, to have farm spouses and even some adult farm children working and earning income off-farm. Unlike the traditional and more labour intensive family farm of several decades ago, there is not a daily need for spouses and children to “work the farm.”
2) For those in the farm family who are employed on the farm, it is advantageous from a tax perspective to minimize the amount they pay themselves. Corporate (farm) profits are taxed at a much lower rate than personal income. This tax-minimization strategy also serves to build up the value of the farm business and would be a central form of savings for farmers.
Perhaps the most important gauge of the financial well-being of farms is that the average net worth of Canadians farms is expected to reach $1.7 million in 2012,7 and is much higher than the net worth of Canadian families in general (approximately $364,000).8
A Note on QuotasThere is an important qualification to this wealth transfer narrative. Farmers who received the original quotas free or those who purchased them at much lower prices years ago will have done very well by supply management. However, new entrants into the farming of regulated products will likely have seen much less profit. The cost of buying a quota (often borne as significant debt charges) and to a lesser degree, the cost of board fees used to lobby to maintain or enhance the supply management system can weigh heavily on the bottom line. In addition, the demand for some supply managed products (like dairy and eggs) has declined over the past several decades (CD Howe 2010, 6).9
The CD Howe (2010) study compared the annual returns to quotas in the supply management system versus alternate investment returns. They found that, in the decade between 1999 and 2008, the return to quotas (in the form of the net operating income of supply managed farms) was somewhat below the returns to government of Canada bonds. They explain that “the higher revenues generated by the cartel system’s restriction of supply are not reflected in the bottom line because the system also generates costs” (CD Howe 2010, 4) and they specifically mention the amortized cost of purchasing a quota (it can be the largest single cost of start up for farms) and the cost of lobbying – which they argue makes sense for farmers but is a re-direction of resources away from more productive uses.
�e average net worth of a Canadian farm in 2012 is $1.7 million.

Milking the System: How Agricultural Supply Management Impedes Trade Opportunities and Egregiously Transfers Income16
ConclusionThis essay serves to highlight the economic implications of the Canadian system of supply management. The cost of supply management in terms of higher prices to consumers and the transfer of economic benefits from consumers (and some businesses that use supply managed products) to producers is well known and well established. What is perhaps less well known is the adverse impact on lower-income Canadians. The evidence presented in this paper is that disadvantaged Canadian households spend disproportionately more on food than middle and upper income households. The higher prices of supply managed food products – many of them basic staples like milk, butter, chicken, eggs, and cheese – will clearly hurt these households more. The Conference Board estimates that the prices of key regulated foods like milk and butter are about 40 to 60 percent higher than they would be in a competitive market, suggesting that the impact on low-income households is hardly trivial. Due to the marketing board system, low-income Canadian families are likely to be spending several hundred dollars more, per person, on food annually than would be the case if we had free markets in food. These are monies that poorer families could otherwise re-direct to other pressing necessities.
It is difficult to justify having a sector that is essentially protected from competition and, via the power of the state, able to restrict supply to ensure a high price for its goods. Most other sectors have no such protection and are granted no powers to combine (act as a monopoly) and restrict supply. Farming has changed substantially over the past century. It has gone from being a sector having a great many smaller family farms to one which has fewer, larger, corporate players. While we might consider food to be special in some ways, domestic producers are not special. They are similar to farmers anywhere else, except they don’t always face competitive pressures to be efficient and innovative. As well, not all food consumed in Canada is produced domestically. Canadians have imported a substantial portion of their food for decades. That is not going to change whatever we do about marketing boards.
While it is true that the governments in other nations can and do provide assistance to their farm sector and that such assistance gives those farmers
an unfair advantage in selling food, it is also true that the nature and severity of their subsidies have been reduced substantially, as is the case in the European Union and is apparently about to occur in the United States.10 This is presumably what negotiations toward achieving freer trade are all about. Canada is in a position to provide leadership, as it has in other areas such as aid and peacekeeping, and to reduce and ultimately eliminate these costly barriers to trade in a multilateral context. All Canadian consumers, and especially those in lower-income households, stand to benefit.
Higher food prices, which particularly impact
low-income Canadian families, and barriers to
international trade are the current e�ects of supply
management.

A Macdonald-Laurier Institute Publication – June 2012 17
About the AuthorsChris Sarlo is Professor of Economics at Nipissing University in North Bay and is a senior fellow at the Fraser Institute. Professor Sarlo has research interests in the areas of poverty, inequality, income and wealth distribution, the economics of marriage and divorce, and libertarian issues.
Larry Martin has 40 years of experience in the agricultural and food sectors. He has or has had various leadership and advisory roles with the George Morris Centre (founding Executive Director and subsequent CEO), various farms, agribusinesses, and food companies in Canada and the United States, and chaired a national task force on competitiveness in the agri-food sector. He writes for popular, academic, and professional publications on all aspects of the economics of food.
Milking the System: How Agricultural Supply Management Impedes Trade Opportunities and Egregiously Transfers Income18
Endnotes1 McMurchy, 1990. Available at http://www.omafra.gov.on.ca/english/farmproducts/factsheets/history.
htm.
2 Originally import quotas controlled imports. However, these were removed in 1995 as a result of the WTO and replaced by a combination of so-called tariff rate quotas (TRQs) and tariffs. They work in tandem. The TRQs allow tariff-free imports equal to 5 to 8 percent of domestic consumption. When the TRQs are filled, tariffs jump to approximately 250 percent for dairy products, 238 to 246 percent for chicken, 155 to 165 percent for turkey, and 164 percent for eggs.
3 It provides, for example, authorization for the licensing and granting of quotas for “regulated products,” products for which a marketing board is already in place. It allows the Commission, the Director, or the boards to refuse, suspend, or revoke licences; assess and collect any fees required by the Boards or Commission; to set restrictions and prohibitions relating to quotas; to set the prices and the characteristics of regulated products; and to prohibit any consumption or use of the regulated product that has not been purchased through the marketing board. In addition, the Act provides substantial powers to agents or inspectors of the boards to enter premises and investigate if they believe, on reasonable grounds, that an offence against the Act has been committed and provides substantial powers to seize and detain products suspected of being in contravention of the Act with all costs borne by the owners of said products.
4 This has been confirmed in many studies over the years and more lately in a study of the elasticities of Canadian food products by Agriculture and Agri-Food Canada (2007, 33-36).
5 See http://www.farmsincanada.ca/research/poultry.html.
6 See Agriculture and Agri-Food Canada 2012B, Table 3 and http://www.statcan.gc.ca/tables-tableaux/sum-som/l01/cst01/famil05a-eng.htm.
7 See http://www.betterfarming.com/online-news/record-breaking-net-farm-income-2011-says-agriculture-canada-5120.
8 See http://www.statcan.gc.ca/tables-tableaux/sum-som/l01/cst01/famil111a-eng.htm.
9 See http://www.agr.gc.ca/poultry/gleg_eng.htm.
10 Please see http://www.conference-agsap.org/AgSAP%20keynotes/Keynote%20AgSAP%20Haniotis.pdf.
ReferencesAgriculture and Agri-Food Canada. 2007. “The Estimation of Food Demand Elasticities in Canada.” Agriculture and Agri-Food Canada. http://ageconsearch.umn.edu/bitstream/52705/2/estimation_e.pdf.
Agriculture and Agri-Food Canada. 2011. “The Future of Farms and Food in Canada.” Conference Proceedings. http://www.ag-innovation.usask.ca/2011policyconference.html.
Agriculture and Agri-Food Canada. 2012A. “Canada’s Egg Industry at a Glance.” Agriculture and Agri-Food Canada. http://www.agr.gc.ca/poultry/gleg_eng.htm.
Agriculture and Agri-Food Canada. 2012B. “Canada’s Farm Income Forecast for 2011 and 2012.” Agriculture and Agri-Food Canada. http://www4.agr.gc.ca/AAFC-AAC/display-afficher. do?id=1328906101616&lang=eng.

A Macdonald-Laurier Institute Publication – June 2012 19
Barichello, R. 1996. “Capitalizing Government Program Benefits: Evidence of Risk Associated with Holding Farm Quotas.” In Antle and Sumner’s (editors) Essays on Agricultural Economics in Honour of D. Gale Johnson. Chicago: University of Chicago Press.
Barichello, R., J. Canfield, and Karl Mielke. 2009. “Options for Reform of Supply Management in Canada with Trade Liberalization.” Canadian Public Policy, 35(2): 203-217.
Cairns, A., Karl Meilke, and Nick Bennett. 2010. “Supply Management and Price Ceilings on Production Quota Values: Future or Folly.” Working paper for CATPRN. http://www.uoguelph.ca/catprn/PDF-WP/ Working_Paper_2010-4_CairnsMeilkeBennett.pdf.
C. D. Howe Institute. 2010. “Freeing Up Food: The Ongoing Cost, and Potential Reform of Supply Management.” C. D. Howe Institute.
Conference Board of Canada. 2009. “Making Milk: The Practices, Players and Pressures Behind Dairy Supply Management.” Conference Board of Canada.
GO5. 2012. “WTO and Agriculture - Supply Management.” GO5 Coalition. http://www.go5quebec.ca/en/ gestion.php.
Green, C. 1983. “Agricultural Marketing Boards in Canada: An Economic and Legal Analysis.” The University of Toronto Law Journal, 33(4): 407-433.
McMurchy, J. 1990. “A History of Agriculture Marketing Legislation in Ontario.” Ontario Ministry of Agriculture, Food and Rural Affairs. http://www.omafra.gov.on.ca/english/farmproducts/factsheets/history.htm.
Montreal Economic Institute. 2005. “Dairy Production: The Costs of Supply Management in Canada.” Montreal Economic Institute.
OECD. 2009. “Agricultural Policies in OECD Countries: Monitoring and Evaluation.” OECD.
OECD. 2011. “Agricultural Policy Monitoring and Evaluation: OECD Countries and Emerging Economies.” OECD. http://www.keepeek.com/Digital-Asset-Management/oecd/agriculture-and-food/agricultural- policy-monitoring-and-evaluation-2011_agr_pol-2011-en.
Ontario. 2011. Farm products Marketing Act (1990). Service Ontario e-laws. http://www.e-laws.gov. on.ca/html/statutes/english/elaws_statutes_90f09_e.htm.
Ontario Ministry of Agriculture, Food and Rural Affairs. 2011. “Overview of the Farm Products Marketing Act.” Ontario Ministry of Agriculture, Food and Rural Affairs. http://www.omafra.gov.on.ca/english/ farmproducts/factsheets/overview.htm.
Ontario Ministry of Agriculture, Food and Rural Affairs. 2012. “Farm Products Marketing Commission Factsheet.” Ontario Ministry of Agriculture, Food and Rural Affairs. http://www.omafra.gov.on.ca/ english/farmproducts/factsheets/factsheet_index.htm.
Ontario Veal Association. 2011. “Proposal for Veal Marketing Board Powers.” Ontario Veal Association. http://www.ontarioveal.on.ca/pdfs/Veal%20Farm%20Products%20Marketing%20Board%20Proposal-%20 REVISED.pdf.
Ragan, C. and R. Lipsey. 2005. Economics. 11th edition. London: Pearson-Addison Wesley.
Statistics Canada. 2001. “Food Expenditure Survey (2001).” Statistics Canada.
Statistics Canada. 2005. “Family Units and Net Worth by Net Worth Group.” Statistics Canada. http://www. statcan.gc.ca/tables-tableaux/sum-som/l01/cst01/famil111a-eng.htm.
Statistics Canada. 2008. “Survey of Household Spending (2008).” Statistics Canada.
Statistics Canada. 2011. “Average Total Income by Economic Family Types.” Statistics Canada. http://www. statcan.gc.ca/tables-tableaux/sum-som/l01/cst01/famil05a-eng.htm;
Wallace, Kenyon. November 20, 2011. “Is the price of Milk Too High?” Toronto Star. http://www.thestar. com/news/insight/article/1089581--is-the-price-of-milk-too-high.

Milking the System: How Agricultural Supply Management Impedes Trade Opportunities and Egregiously Transfers Income20
Appendix 1 Ontario Marketing BoardsName
1 Chicken Farmers of Ontario
2 Dairy Farmers of Ontario
3 Grape Growers of Ontario
4 Grain Farmers of Ontario
5 Ontario Apple Growers
6 Ontario Asparagus Growers Marketing Board
7 Ontario Bean Producers Marketing Board
8 Ontario Broiler Hatching Egg and Chick Commission
9 Egg Farmers of Ontario
10 Ontario Flue-Cured Tobacco Growers Marketing Board
11 Ontario Fresh Grape Growers Marketing Board
12 Ontario Greenhouse Vegetable Growers
13 Ontario Pork Producers Marketing Board
14 Ontario Potato Board
15 Ontario Processing Vegetable Growers
16 Seed Corn Growers of Ontario
17 Ontario Sheep Marketing Agency
18 Ontario Tender Fruit Producers Marketing Board
19 Ontario Tomato Seedling Growers Marketing Board
20 Turkey Farmers of Ontario
Section 12 Associations
1 Ontario Canola Growers Association
2 Ontario Coloured Bean Growers Association
3 Ontario Ginseng Growers Association
4 Flowers Canada (Ontario) Inc.
SOURCE: http://www.omafra.gov.on.ca/english/farmproducts/factsheets/marketing.htm.
A Macdonald-Laurier Institute Publication – June 2012 21
Canada’s Trade Opportunities at Risk from Supply Management IAN LEE
Canada follows a policy that many governments used to follow but most have moved forward. It is called supply management. It is completely inconsistent with tariff elimination. We will be looking for clear political signals of a reasonably broad-based understanding that it is not just a matter of turning up at the club and demanding membership.
TIM GROSER, NEW ZEALAND MINISTER OF TRADE, NOVEMBER 23, 20111
IntroductionAs a small, open economy, Canada is reliant on trade with other countries (as well as internally) to promote and secure economic prosperity. The current federal government has not been shy about its intentions to deepen existing trade relationships and forge new agreements in order to promote greater trade and economic prosperity. While negotiations for a comprehensive trade agreement with Europe reach a conclusion, the trade horizon holds potentially even greater opportunities in the form of Canada’s possible entry to the Trans Pacific Partnership (TPP), which includes some of the fastest growing countries in the world. A major stumbling block, however, exists in the form of Canada’s ongoing support for agricultural supply management. Some members of the TPP, as highlighted in the initial quote, have adamantly opposed Canada’s entry to the TPP unless supply management is radically reformed.
Trade as a Government Priority In 2009, then Minister of International Trade and Minister for the Asia-Pacific Gateway Stockwell Day released Canada’s Global Commerce Strategy,2 which identified global commercial engagement as key to Canada’s economic growth. The Strategy committed to:
• BoostCanadiancommercialengagementinglobalvaluechains;
• SecurecompetitivetermsofaccesstoglobalmarketsandnetworksforCanadianbusinesses;
Expanding existing trade deals and opening up new trade opportunities is a key goal for the federal government.

Milking the System: How Agricultural Supply Management Impedes Trade Opportunities and Egregiously Transfers Income22
• IncreaseforeigndirectinvestmentinCanadaandCanadiandirectinvestmentaroundtheworld;and
• Forge stronger linkages between Canada’s science and technology community and global innovationnetworks.3
The Strategy also identified Canada’s 13 priority markets around the world where “Canada’s opportunities and interests have the greatest potential for growth.”4 They are:
• TheAmericas:Brazil,LatinAmericaandtheCaribbean,MexicoandtheUnitedStates.
• AsiaPacific:AssociationofSouthEastAsianNations(ASEAN),Australia,andNewZealand,China,India,Japan, and Korea.
• EuropeandtheMiddleEast:Europe,Russia,andtheGulfCooperationCouncil(GCC).
A Short History of the Trans Pacific PartnershipThe objective of the TPP is to eliminate trade tariffs by 2015 on over 11,000 tariff categories. However, the TPP is far more expansive in that negotiators aim to include standards for the environment, labour, intellectual
property, rules of origin, investment, government procurement, and dispute remedies.5
The agreement that became known as the Trans Pacific Partnership originally developed from informal discussions in the 1990s at Asia Pacific Economic Cooperation conferences (APEC) between the United States, Australia, New Zealand, Chile, and Singapore. The impetus to conclude an agreement came from the increasing recognition that the WTO Doha Round were floundering and that attempts to negotiate a Pacific free trade agreement within APEC in the first decade of the 21st century would fail. An alternative path to trade liberalization was to negotiate an agreement with a small number of countries strongly committed to liberalization of trade with an accession clause that would allow the agreement to grow incrementally by adding countries at later dates.
In a forthcoming book that traces the origins and discussions that led to the TPP, Professor Elms states:
The TPP has always been called a “high quality, 21st century” agreement that covers a range of topics not always found in free trade agreements. This includes not just trade in goods, services and investment, but also intellectual property rights, government procurement, labor, environment, regulations, and small and medium enterprises.6
The informal discussions of the 1990s led to more formal discussions between Singapore, New Zealand, and Chile at APEC 2002, which in turn led to successive rounds of negotiations between 2003 and 2005. These discussions became known as the Pacific Three Closer Economic Partnership, or P3 CEP. Brunei joined in 2005 and the first agreement came into force in 2006.
In September 2008, US President George Bush’s trade representative, Susan Schwab, announced the United States would seek to join the agreement. Australia, Malaysia, and Peru quickly followed with similar announcements while Vietnam sought observer status.
�e TPP is a broad, comprehensive agreement
that potentially includes most of the Asia-Paci�c
region.

A Macdonald-Laurier Institute Publication – June 2012 23
As Professor Elms noted, Canada was one of the first countries approached by the then P4 (the original four countries that founded what later became the TPP).7 However, Canada was not interested at that time and rejected the opportunity. In 2010-11, Canada reversed course and announced it would seek membership in what is now known as the TPP.
Five additional countries are currently negotiating to extend the trade agreement: Australia, Malaysia, Peru, the United States, and Vietnam. Japan also indicated its interest to enter the agreement. The first round of what is now the TPP took place in March 2010 in Melbourne with seven countries: Australia, Brunei, Chile, New Zealand, Peru, Singapore, and the United States, with Vietnam as an observer (Vietnam formally joined the TPP later that year).8 In October 2010, Malaysia became the ninth country to officially join the TPP.9
In August 2010, Canada sent negotiators to meet with individual TPP country negotiators to discuss joining, but was rejected due to Canada’s system of supply management and its policy on intellectual property.10 However, in the period leading to the 2011 APEC conference in Honolulu, Japan announced its interest in joining the TPP. Canada and Mexico quickly announced their interest as well.11 On November 13, 2011, Prime Minister Harper formally notified TPP members of Canada’s interest in joining.12
Following the 2011 Asia Pacific Conference, Canada discovered with great shock that New Zealand and Australia, our long-time allies, did not want Canada to join the TPP due to our unyielding support for supply management. A 2005 unanimous vote in the House of Commons confirmed this support by instructing Canada’s WTO negotiators to preserve supply management at all costs.
Professor Elms notes that the original P4 members designed the TPP with an accession clause to facilitate future expansion of the TPP. However, they did not establish a mechanism or policy to address whether new members would be required to accepting the existing agreement when they joined or whether there would be fresh negotiations with each new aspirant member concerning differences such as supply management.13 This issue has not yet been resolved.
Canada’s Trade PartnersThe nature of Canada’s trade mirrors our historical development. Canada transitioned from relying disproportionately on the United Kingdom for its trade both before and after Confederation to its current bilateral reliance on the United States.
Canada’s export performance has been suffering, however, given that our main trading partners have experienced prolonged periods of slow economic growth. In addition, the reforms in both China and India from heavily protected and government subsidized economies to more market driven economies has resulted in marked shifts in export activity. Since reforming, both countries have experienced annual GDP growth rates in the 8 to 10 percent range. Most countries in the region have also experienced similar growth rates.
This divergence in economic growth and exporting has shown up in Canada’s poor export performance over the last decade. For example, the Governor of the Bank of Canada, Mark Carney, recently stated:
Emerging markets represent the greater opportunity for Canadian exporters. Since the recession, these economies have accounted for roughly two-thirds of global economic growth and one-half of the growth in global imports. In a process that can be expected to continue for decades, emerging
Canada’s relative export performance has been declining over the last decade.

Milking the System: How Agricultural Supply Management Impedes Trade Opportunities and Egregiously Transfers Income24
Asia is rapidly urbanizing. China and India are housing the equivalent of the entire population of Canada every 18 months. In parallel, a massive new middle class is being formed, growing by 70 million people each year and representing a fast-rising share of global demand for all types of goods. This is where Canadian businesses must increasingly look for export growth.14
Figure 1 shows the change (percentage) in the relative share of world exports for a select group of countries, namely the G-20 countries.
FIGURE 1 Percent change in share of world exports among G-20, 2000-2010
SOURCE: International Monetary Fund
Over the ten-year period (2000-2010) covered in figure 1, only the United Kingdom had a larger drop in their relative share of world exports compared to Canada within the G-20. In other words, Canada more so than any other G-20 country except for the United Kingdom saw its proportional share of world exports drop over the first decade of the century. Critically, other commodity-oriented countries like Australia and Brazil saw their relative share of exports increase. As a trading country, this trend should be worrisome and cause for concern.
Table 1 shows the destinations of Canadian exports. Part of the explanation for Canada’s decline in its share of world exports is the countries with whom Canada mainly trades. As table 1 illustrates, six of the top ten countries Canada trades with are in North America or Europe, which all experienced relatively slow economic growth during this time period. In particular, the slow economic growth of the United States affected Canada’s performance since it constitutes roughly three-quarters of Canadian export trade. In addition, Japan, which ranks fourth in terms of the value of exports, has also experienced a prolonged period of economic stagnation.
U.K.CanadaFranceJapan
U.S.Mexico
ItalyGermany
IndonesiaSouth Afroca
ArgentinaKorea
Saudi ArabiaAustralia
BrazilRussia
TurkeyIndia
China
-50 0 50 100 150 200 %

A Macdonald-Laurier Institute Publication – June 2012 25
TABLE 1 Total Canadian exports (top 10 countries), 2007-2011
2007 2008 2009 2010 2011 % 2011
United States (U.S.) 355,610 375,480 270,090 299,075 330,091 73.7%
United Kingdom (U.K.) 12,789 12,996 12,052 16,367 18,791 4.2%
China 9,512 10,468 11,151 13,232 16,820 3.8%
Japan 9,223 11,086 8,316 9,195 10,671 2.4%
Mexico 4,958 5,844 4,803 5,008 5,476 1.2%
Korea, South 3,008 3,837 3,529 3,709 5,098 1.1%
Netherlands 4,041 3,699 2,757 3,272 4,807 1.1%
Germany 3,865 4,484 3,734 3,937 3,955 0.9%
France (incl. Monaco, French Antilles) 3,126 3,240 2,677 2,349 3,081 0.7%
Hong Kong 1,551 1,771 1,494 1,880 2,967 0.7%
SUB-TOTAL 407,683 432,905 320,604 358,026 401,757
OTHERS 42,638 50,583 39,150 41,274 46,045
TOTAL (ALL COUNTRIES) 450,321 483,488 359,754 399,300 447,802
SOURCE OF DATA: Statistics Canada REPORT DATE: 23-May-2012
The relationship between the destination of Canadian exports and the economic growth of those countries is better illustrated in figure 2.
FIGURE 2 Average economic growth rates of Canada’s major trading partners, 2000-2010
SOURCES: International Monetray Fund World Economic Outlook, Industry Canada, Bank of Canada Calculations. LAST OBSERVATION: 2010
12
10
8
6
4
2
0
%
United Sta
tes
United Kingdom
Japan
Germany
Netherla
nds
Norway
France
Belgium
Italy
China
Mexico
Korea
Brazil
India
Hong Kong
Russia*
Indonesia
*
Saudi Ara
bia*
Turkey*
Poland*
* This country is not one of Canada’s top 15 trading partners Note: Export shares in 2010 are reported
Accounts for 85% of exports
Accounts for 8% of exports

Milking the System: How Agricultural Supply Management Impedes Trade Opportunities and Egregiously Transfers Income26
It’s fairly easy to see that the bulk of Canadian exports (85 percent) over the decade from 2000 to 2010 went to slower growing countries. Countries that experienced more rapid economic growth over this period represented only 8 percent of Canadian exports. Canada has focused on slow growth countries for export markets while paying much less attention to the high growth markets which represent greater opportunities.
Trans Pacific Partnership Countries and Asia-Pacific Region: Opportunities for Canada
Herein is the explanation for why entry into the Trans Pacific Partnership (TPP) is so important. The Asia Pacific region accounts for roughly 40 percent of the world’s population. The TPP countries comprised 28 percent of world GDP in 2010. Even more importantly, most of the countries in this region are experiencing annual GDP growth approximately double the growth rate of the European Union or the United States.
Table 2 documents the population size, GDP, and GDP growth rates of three groups: Countries now in the TPP, the three countries most likely to join the TPP in the near future, and the remaining countries in the Asia-Pacific region. These three groupings sum to $35 trillion in GDP and 2.7 billion people – staggering numbers in terms of both population (i.e. future customers) and GDP.
TABLE 2 GDP, population and GDP growth rate of TPP and APEC countries, 2010
CountryGDP in USD
– Billions (2010)
Population in millions
(2010)
GDP per capita (PPP)
(2010)
Real GDP growth (%)
TPP Countries
Australia $1,237 22.2 $39,764 2.68%
Brunei $12 0.4 $48,333 2.60%
Chile $203 17.2 $15,040 5.19%
Malaysia $238 28.3 $14,744 7.19%
New Zealand $141 4.4 $27,130 1.66%
Peru $154 29.6 $9,358 8.79%
Singapore $223 5.2 $56,694 14.47%
Viet Nam $104 88.3 $3,143 6.78%
Non US TPP Total $2,312 195.6
US $14,527 310 $46,860 3.03%
Total TPP $16,839 505.6
�e TPP covers 40 percent of the world’s
population and 29 percent of its GDP.

A Macdonald-Laurier Institute Publication – June 2012 27
Near Term Potential TPP
CountriesCountry
GDP in USD – Billions
(2010)
Population in millions
(2010)
GDP per capita (PPP)
(2010)
Real GDP growth (%)
Canada $1,577 34.1 $39,171 3.22%
Japan $5,459 127.6 $33,885 3.96%
Mexico $1,034 108.6 $14,406 5.42%
Total $8,070 270.3
Other APEC
China $5,878 1341.4 $7,544 10.33%
Hong Kong $224 7.1 $45,944 6.97%
Indonesia $707 237.6 $4,347 6.11%
South Korea $1,014 48.9 $29,997 6.16%
Papua New Guinea
$10 6.5 $2,307 7.03%
Philippines $200 94 $3,920 7.63%
Russia $1,480 142.9 $15,612 4.00%
Taiwan $430 23.2 $35,604 10.88%
Thailand $319 63.9 $9,221 7.78%
Total $10,262 1965.5
APEC Total $35,171 2741.4
SOURCE: IMF World Economic Outlook, September, 2011.
As currently constituted, the TPP countries account for $2.3 trillion in GDP (2010) and 195.6 million people. The addition of Japan would add another $5.5 trillion in GDP and 127.6 million people. The larger prize, however, may be down the road with the possible addition of countries like China, Indonesia, South Korea, Russia, Taiwan, and Thailand. These other APEC countries possess $10.3 trillion in GDP and nearly 2 billion people.
Indeed, one interesting angle of the TPP opportunity that is often ignored is the effect on Canada if the United States were the only NAFTA country in the agreement. This would create an advantage for the United States in attracting business development, investors, and entrepreneurs who want to access the TPP countries but remain in North America. In addition, it would simultaneously erode the advantaged access Canada currently enjoys under NAFTA. Such an asymmetry in trade access would constitute a real advantage for the countries in the TPP.
Currently, Canada does not have a regional or bilateral free trade agreement with six of the nine members of the TPP. Access (as shown in tables 3a, 3b, and 3c) to those six markets is relatively small (less than 1 percent) but with all nine members, the TPP would cover 76 percent of Canada’s export market. It can be argued that the United States accounts for the lion’s share and Canada already has NAFTA. However, it must be recognized that TPP, if agreed to, will become a “super NAFTA.” It will include areas that were excluded from NAFTA such as financial services, telecom, intellectual property, and government procurement. If Japan and Mexico are added, the figure would rise to 80 percent. In other words, the TPP is the key to unlocking the door to the largest trade agreement in history.
Canada could potentially be the only NAFTA country not included in the TPP.

Milking the System: How Agricultural Supply Management Impedes Trade Opportunities and Egregiously Transfers Income28
Tables 3a, 3b and 3c break down the current exports by Canada to current and potential TPP countries.
TABLE 3A 2010 Exports to 6 TPP countries that have no regional or bilateral trade agreement with Canada15
Country C$ (000s) Percentage of Trade
Brunei 12,167 0.00
New Zealand 321,473 0.08
Singapore 834,846 0.21
Australia 1,751,792 0.44
Malaysia 785,956 0.20
Viet Nam 264,730 0.07
Total 3,970,964 0.99
TABLE 3B 2010 Exports to TPP countries with whom Canada already has an FTA
Country C$ (000s) Percentage of Trade
US (NAFTA and TPP) 298,068,444 74.87
Peru (Bilateral & TPP) 479,022 0.12
Chile (Bilateral & TPP) 587,462 0.15
Total 300,136,464 75.14
Total Current TPP 304,107,572 75.13
TABLE 3C 2010 Exports to potential new TPP members
Country C$ (000s) Percentage of Trade
Japan 9,195,136 2.30
Mexico 5,008,167 1.25
China 13,232,998 3.31
Others 10,538,127 2.64
Total potential future TPP 37,974,428 9.51
Current + potential future TPP 342,080,320 85.64
Total exports to the world 399,432,796 100.00
The tables reveal that the TPP countries with no trade agreements with Canada represent a very small amount of Canada’s trade, thereby indicating very significant potential export growth. Likewise, exports to potential new TPP members, while not yet large, represent very large export potential, due to the sheer size of both China and Japan. And while the numbers are skewed due to the inclusion of the United States, which already has a trade agreement with Canada, nonetheless the proposed TPP would de facto involve a rewriting of NAFTA due to the US demand that the sectors excluded in NAFTA are included in the TPP.
But the future scenario for Canada most likely does not end with TPP. It is merely the base from which to expand to all APEC members. The region is home to 40 percent of the world’s population, produces over 50

A Macdonald-Laurier Institute Publication – June 2012 29
percent of global GDP, and includes some of the fastest growing economies in the world. Petri, Plummer, and Zhai estimate that “the annual welfare gains to the world economy would rise to $144 billion on the TPP track and $862 billion with an FTAAP”16 (Free Trade Agreement of Asia-Pacific).
Opposition to Canada’s EntryWhile Canada has signaled its clear intent and interests to join the TPP, there is a significant obstacle to securing a negotiated deal. In particular, several powerful countries within the TPP are opposing Canada’s entry due to our ongoing support for agricultural supply management.
The former trade representative of the United States Ambassador Clayton Yeutter stated it bluntly:
Canada needs to address policies in its dairy and poultry sectors that are opposed by the U.S., Australia and New Zealand before it can join TPP. Canada currently limits foreign access to its dairy and poultry markets through a system of supply management.17
As the companion piece explains in more detail, agricultural supply management entails the restriction of domestic production for covered commodities to control the supply while simultaneously blocking imports through high tariffs. Supply management evolved in the 1950s and 1960s at the provincial level in an attempt to stabilize farm incomes, which fluctuated dramatically in those years. In the early 1970s, the Government of Canada passed legislation to establish marketing boards, or legal cartels, which were granted authority to set the annual production and prices of milk, eggs, chicken, and turkey by awarding quotas to individual farmers. Concurrently, very high tariffs on agricultural products were announced on the same products that effectively limited imports to very low levels. The system of marketing boards, agricultural quotas, and high tariffs to manage competition and imports and thus supply and prices became known as supply management
ConclusionIf Canada is to maintain its high standard of living, it must secure access to other markets for our country’s goods and services. This is particularly true with respect to developing countries, who offer the opportunity and likelihood of participating in faster growing economies. However, long-time allies – the United States, Australia, and New Zealand – blocked Canada from joining the TPP because of Canada’s intransigence on supporting supply management.
A program that benefits a small group of farmers, mostly in rural Ontario and Quebec, is preventing Canada’s 34 million citizens from participating in the most important trading agreement in modern history with the most dynamic and populated part of the globe – Asia-Pacific. This puts Canada’s future at risk.
Allies in New Zealand and Australia adamantly oppose our entry to TPP because of our support for supply management.

Milking the System: How Agricultural Supply Management Impedes Trade Opportunities and Egregiously Transfers Income30
About the AuthorIan Lee is an Assistant Professor at Carleton University’s Sprott School of Business where he teaches strategic management and international business. Professor Lee earned his Ph.D. in Public Policy from Carleton University. Professor Lee has also taught courses at Carnegie Mellon, University of Washington, University of Pittsburgh, SUNY Buffalo, University of Calgary, Dalhousie, Carleton, UQAM, and the University of Ottawa, and for MBA programs in China, Cuba, Iran, Poland, Romania, Ukraine, Latvia, Slovenia, Croatia, and Mexico. Professor Lee has also done consulting work for the World Bank, CIDA, Coca Cola, and France Telecom.
Endnotes1 November 24, 2011. “New Zealand disputes Harper’s stand on tariff walls.” Globe and Mail.
2 Government of Canada. March 2009. Seizing Global Advantage: A Global Commerce Strategy for Securing Canada’s Growth and Prosperity.
3 Government of Canada. March 2009. Seizing Global Advantage: A Global Commerce Strategy for Securing Canada’s Growth and Prosperity, 4.
4 Government of Canada. March 2009. Seizing Global Advantage: A Global Commerce Strategy for Securing Canada’s Growth and Prosperity, 11.
5 For more information, see http://www.ustr.gov/about-us/press-office/fact-sheets/2011/november/outlines-trans-pacific-partnership-agreement.
6 Deborah Elms and C.L. Lim. 2008. “The Trans-Pacific Partnership Agreement (TPP) Negotiations: Overview and Prospects.” RSIS Working Paper series.
7 Yuen Pau Woo. November 14, 2008. “Canada Risks Being Left Out of Trans-Pacific Trade Deal.” Asia Pacific Foundation of Canada.
8 Deborah Elms and C.L. Lim. 2008. “The Trans-Pacific Partnership Agreement (TPP) Negotiations: Overview and Prospects.” RSIS Working Paper series, 8.
9 Deborah Elms and C.L. Lim. 2008. “The Trans-Pacific Partnership Agreement (TPP) Negotiations: Overview and Prospects.” RSIS Working Paper series, 9.
A Macdonald-Laurier Institute Publication – June 2012 31
10 Deborah Elms and C.L. Lim. 2008. “The Trans-Pacific Partnership Agreement (TPP) Negotiations: Overview and Prospects.” RSIS Working Paper series, 12. See also “Canada Still In No Position to Join TPP Talks,” Inside U.S. Trade, October 25, 2010.
11 Deborah Elms and C.L. Lim. 2008. “The Trans-Pacific Partnership Agreement (TPP) Negotiations: Overview and Prospects.” RSIS Working Paper series, 20.
12 November 13, 2011. “Canada to strike new trans-Pacific free trade deal: Harper.” Postmedia News.
13 Deborah Elms and C.L. Lim. 2008. “The Trans-Pacific Partnership Agreement (TPP) Negotiations: Overview and Prospects.” RSIS Working Paper series, 22.
14 Governor Mark Carney, April 2, 2012. “Exporting in a Post-Crisis World.” Speech to Kitchener-Waterloo Chamber of Commerce.
15 Laura Dawson. February 2012. Can Canada Join the Trans-Pacific Partnership? Why Wanting It is Not Enough. Commentary 340, C.D. Howe Institute.
16 Peter Petri, Michael Plummer and Fan Zhai. 2011. “The Trans-Pacific Partnership and Asia-Pacific Integration: A Quantitative Assessment.” East-West Center Working Papers, 119.
17 Inside US Trade, April 2012.

Critically Acclaimed, Award-Winning Institute
The Macdonald-Laurier Institute fills a gap in Canada’s democratic infrastructure by focusing our work on the full range of issues that fall under Ottawa’s jurisdiction.
• “One of the Top 5 New Think Tanks in the World” for 2011 as rated by the University of Pennsylvania.
• Cited by five present and former Canadian Prime Ministers, as well as by David Cameron, the British Prime Minister.
• First book, The Canadian Century: Moving out of America’s Shadow, won the Sir Antony Fisher International Memorial Award in 2011.
• Executive Director & Founder Brian Lee Crowley named one of 100 most influential people in Ottawa in 2012.
• The Wall Street Journal, The Economist, The Globe and Mail, The National Post and many other leading national and international publications have quoted the Institute’s work.
Where You’ve Seen Us
True North in Canadian Public Policy
Former Speaker of the House of Commons Peter Milliken, former Prime Minister Joe Clark, former Prime Minister Jean Chrétien, and MLI Managing Director Brian Lee Crowley.
Ideas Change the World
Independent and non-partisan, the Macdonald-Laurier Institute is increasingly recognized as the thought leader on national issues in Canada, prodding governments, opinion leaders and the general public to accept nothing but the very best public policy solutions for the challenges Canada faces.
For more information visit: www.MacdonaldLaurier.ca

What Do We Do?
When you change how people think, you change what they want and how they act. That is why thought leadership is essential in every field. At MLI, we strip away the complexity that makes policy issues unintelligible and present them in a way that leads to action, to better quality policy decisions, to more effective government, and to a more focused pursuit of the national interest of all Canadians. MLI is the only non-partisan, independent national public policy think tank based in Ottawa that focuses on the full range of issues that fall under the jurisdiction of the federal government.
What Is in a Name?
The Macdonald-Laurier Institute exists not merely to burnish the splendid legacy of two towering figures in Canadian history – Sir John A. Macdonald and Sir Wilfrid Laurier – but to renew that legacy. A Tory and a Grit, an English speaker and a French speaker – these two men represent the very best of Canada’s fine political tradition. As prime minister, each championed the values that led to Canada assuming her place as one of the world’s leading democracies. We will continue to vigorously uphold these values, the cornerstones of our nation.
Working for a Better Canada
Good policy doesn’t just happen; it requires good ideas, hard work, and being in the right place at the right time. In other words, it requires MLI. We pride ourselves on independence, and accept no funding from the government for our research. If you value our work and if you believe in the possibility of a better Canada, consider making a tax-deductible donation. The Macdonald-Laurier Institute is a registered charity.
Our Issues
The Institute undertakes an impressive programme of thought leadership on public policy. Some of the issues we have tackled recently include:
• The impact of banning oil tankers on the West Coast;
• Making Canada a food superpower in a hungry world;
• Aboriginal people and the management of our natural resources;
• Population ageing and public finances;
• The vulnerability of Canada’s critical infrastructure;
• Ottawa’s regulation of foreign investment; and
• How to fix Canadian health care.
About the Macdonald-Laurier Institute
For more information visit: www.MacdonaldLaurier.ca
For more information visit: www.MacdonaldLaurier.ca
Macdonald-Laurier Institute Publications
The Canadian CenturyBy Brian Lee Crowley, Jason Clemens, and Niels Veldhuis
Economics of Intellectual Property Protection in the Pharmaceutical Sector
Pills Patents & Profits II
PharmaceutIcal serIes 2
The Role of Patents In the Pharmaceutical Sector: A Primer
Brian Ferguson, Ph.D.
Intellectual Property Law and the Pharmaceutical Industry: An Analysis of the Canadian Framework
Kristina M. Lybecker, Ph.D.
MLI-PharmaceuticalPaper12-11Print.indd 1 12-01-16 9:40 AM
1 Andrew Graham Canada's Critical Infrastructure: When is Safe Enough Safe Enough? 1Canada's Critical Infrastructure: When is Safe Enough Safe Enough Andrew Graham
CANADA’S CRITICAL INFRASTRUCTUREWhen is Safe Enough Safe Enough?
Andrew Graham
NATIONAL SECURITY STRATEGY FOR CANADA SERIES2
MLI-CanadasCriticalInfrastructure11-11.indd 1 11-12-20 11:00 AM
By Jason Clemens October 2011
A Macdonald-Laurier Institute Publication
Turning Point 2014 Series
Applying the welfare reform
lessons of the 1990s to healthcare
today
Reforming the Canada Health Transfer
By Benjamin PerrinOctober 2011
Migrant SmugglingCanada’s Response to a Global Criminal Enterprise
With an Assessment of The Preventing Human Smugglers from Abusing
Canada’s Immigration System Act (Bill C-4)
Photo courtesy of the Department of National Defence.
October 2011The Macdonald-Laurier Institute
True N rthIn Canadian Public Policy
1 Christopher Ragan: Canada’s Looming Fiscal Squeeze
Pull quote style if appropriate. Word document shows no pull quotes but we can place them wherever they are required to emphasize a point.
By Christopher Ragan
NOVEMBER 2011
Canada’s LoomingFiscal Squeeze
A Macdonald-Laurier Institute Publication
The oldest babyboomers reach 65 this year.In order to avoid a return to the high-debt situation of the mid 1990s,
Canadians and their governments must soon begin thinking in a systematic and critical way about their long-term �scal priorities.
MLI-FiscalSqueezePrint.indd 1 11-11-08 2:12 PM
Crime is measured badly in CanadaSerious crime is not downWe don’t know how the system is workingToute la vérité? Les statistiques de la criminalité au Canada
Why Canadian crime statistics don’t add upNOT THE WHOLE TRUTH
Scott Newark
In Canadian Public Policy
February 2011The Macdonald-Laurier Institute
True N rth HUNGRY FOR CHANGE SERIES
October 2011
Sector in decline or industry of the future? The choice is ours.
by Larry Martin and Kate Stiefelmeyer
Canadian Agriculture and FoodA Growing Hunger for Change
Pills, Patents & Profits IIBrian Ferguson and Kristina Lybecker
Canada’s Critical InfrastructureAndrew Graham
Reforming the CanadaHealth TransferJason Clemens
Clarity on theLegality of SecessionHon. Stéphane Dion
Migrant SmugglingBenjamin Perrin
Canada’s LoomingFiscal SqueezeChristopher Ragan
Why Canadian CrimeStatistics Don’t Add UpScott Newark
Canadian Agricultureand FoodLarry Martin and Kate Stiefelmeyer
RESEARCH PAPERS
Winner of the Sir Antony Fisher
International Memorial Award BEST THINK
TANK BOOK IN 2011, as awarded by the Atlas Economic Research
Foundation.
Do you want to be first to hear about new policy initiatives? Get the inside scoop on upcoming events?
Visit our website www.MacdonaldLaurier.ca and sign up for our newsletter.
Secession and the Virtues of ClarityBy �e Honourable Stéphane Dion, P.C., M.P.
COMMENTARY/COMMENTAIRE
�e Honourable Stéphane Dion, P.C., M.P. (Privy Council of Canada and Member of Parliament for Saint-Laurent/Cartierville)
House of Commons, Ottawa
Stéphane Dion (PC) is the Member of Par-liament for the riding of Saint-Laurent–Cartierville in Montreal. He was �rst elected in 1996 and served as the Minister of Intergovernmental A�airs in the Chre-tien government. He later served as leader of the Liberal Party of Canada and the Leader of Her Majesty’s Loyal Opposition in the Canadian House of Commons from 2006 to 2008. Prior to entering politics, Mr. Dion was a professor at the Université de Montréal. �is Commentary is based on Mr. Dion’s presentation, entitled Seces-sion and the Virtues of Clarity, which was delivered at the 8th Annual Michel Basta-rache Conference at the Rideau Club on February 11, 2011.
Stéphane Dion (CP) est député fédéral pour la circonscription de Saint-Laurent–Cartierville à Montréal. Il a été élu pour la première fois en 1996 et a servi en tant que ministre des A�aires intergouverne-mentales dans le gouvernement Chrétien. Il est par la suite devenu chef du Parti libéral du Canada et chef de l’Opposition à la Chambre des communes de 2006 à 2008. Avant de faire de la politique, M. Dion était professeur à l’Université de Montréal. Ce Commentaire reprend les principaux éléments de l’allocution de M. Dion intitulée « La sécession et les vertus de la clarté », prononcée lors de la 8e Con-férence annuelle Michel Bastarache au Rideau Club le 11 février 2011.
It is an honour and a pleasure for me to have been invited to the Michel Bastarache Commission… excuse me, Conference.
When they invited me, Dean Bruce Feldthusen and Vice-Dean François Larocque sug-gested the theme of “clarity in the event of secession”. And indeed, I believe this is a theme that needs to be addressed, because the phenomenon of secession poses a major challenge for a good many countries and for the international community. One question to which we need the answer is this: under what circumstances, and by what means, could the delineation of new international borders between populations be a just and applicable solution?
I will argue that one document which will greatly assist the international community in answering that question is the opinion rendered by the Supreme Court of Canada on August 20, 1998 concerning the Reference on the secession of Quebec. �is opin-ion, a turning point in Canadian history, could have a positive impact at the interna-tional level. It partakes of the great tradition of our country’s contribution to peace and
CONTACT US: Macdonald-Laurier Institute 8 York Street, Suite 200 Ottawa, Ontario, Canada K1N 5S6
TELEPHONE: (613) 482-8327
WEBSITE: www.MacdonaldLaurier.ca
CONNECT WITH US:
True North in Canadian Public Policy
@MLInstitute
www.facebook.com/ MacdonaldLaurierInstitute
www.youtube.com/MLInstitute
What people are saying about the Macdonald-Laurier Institute
I commend Brian Crowley and the team at MLI for your laudable work as one of the leading policy think tanks in our nation’s capital. �e Institute has distinguished itself as a thoughtful, empirically-based and non-partisan contributor to our national public discourse.
PRIME MINISTER STEPHEN HARPER
As the author Brian Lee Crowley has set out, there is a strong argument that the 21st Century could well be the Canadian Century.
BRITISH PRIME MINISTER DAVID CAMERON
In the global think tank world, MLI has emerged quite suddenly as the “disruptive” innovator, achieving a well-deserved pro�le in mere months that most of the established players in the �eld can only envy. In a medium where timely, relevant, and provocative commentary de�nes value, MLI has already set the bar for think tanks in Canada.
PETER NICHOLSON, FORMER SENIOR POLICY ADVISOR TO PRIME MINISTER PAUL MARTIN
�e reports and studies coming out of MLI are making a di�erence and the Institute is quickly emerging as a premier Canadian think tank.JOCK FINLAYSON, EXECUTIVE VICE PRESIDENT
OF POLICY, BUSINESS COUNCIL OF BRITISH COLUMBIA
Very much enjoyed your presentation this morning. It was �rst-rate and an excellent way of presenting the options which Canada faces during this period of “choice”... Best regards and keep up the good work.
PRESTON MANNING, PRESIDENT AND CEO, MANNING CENTRE FOR BUILDING
DEMOCRACY