military' standard - halt & hass consulting nz ltd
TRANSCRIPT
NO
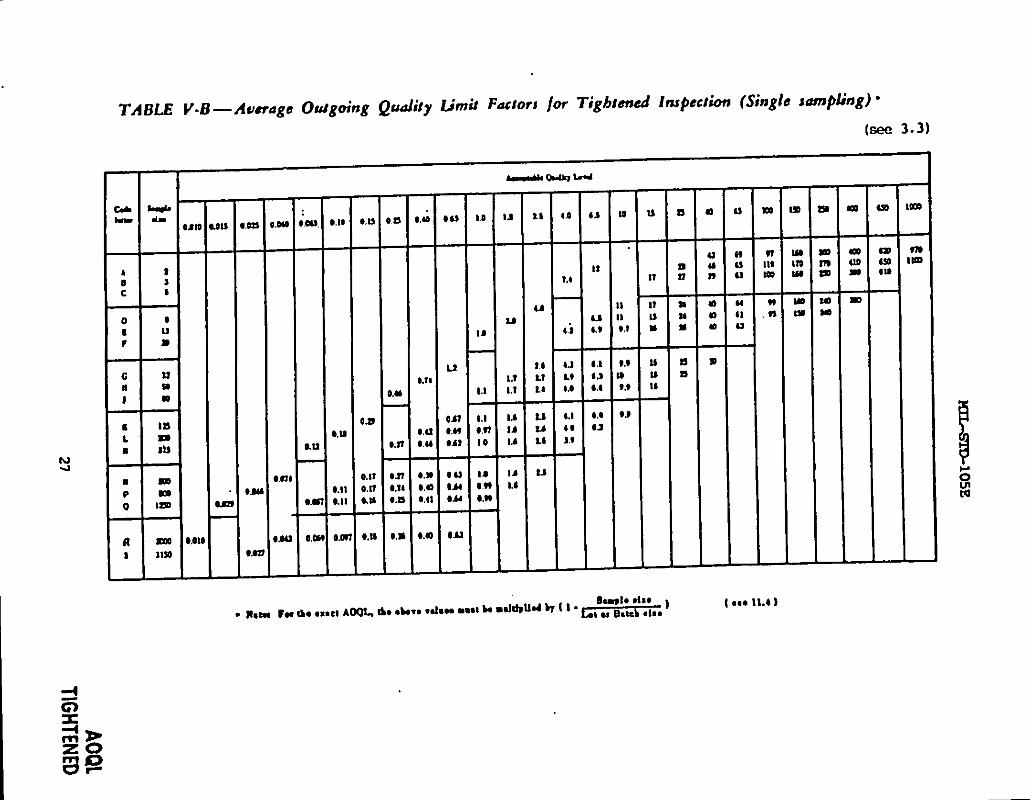
TM
EA
SU
REM
EN
T
MV
F
MIL-S
TO-1
D5
E
10
MA
Y1989
SU
PER
SED
ING
MIL-S
TD-1
D5
D
29
AP
RIL
1963
MILIT
AR
Y’
ST
AN
DA
RD
SA
MP
LING
PR
OC
ED
UR
ES
AN
DT
AB
LES
FO
RIN
SP
EC
TIO
NB
YA
ITR
IBU
TE
S
I
AM
SC
N/A
AR
EA
QC
IC
~~
.A
pp
rove
dfo
rp
ub
licre
lee
se;
dlstrlb
utlo
nis
un
limite
d.

MIL-STO-1O5E
DEP~
OFDEFENSE
Washington,EC
20301
SN-lPL13KPRKEDUWS
ANDTABLESFORINSPECTIONBY~
1.
‘hismilitarystaxiardisapprovedforusebyallCeprwmts
andAgencies
of*
~t
ofMf==e.
2.
Ikneficial~ts
(recmmmdations,additions,deletims)andany
prtinentdatawhitimaybeofuseininprovingthisdocumntshouldbe
addressedto:
Ccmmnder
Us.
ArmyArmmentReseardn,Develop-rentand
EnginerinqCenter
ATIN:
SKAR-BAC-S/BldcJ.6
PicatinnyArsenal,NJ
07806-5000
byusing&“
self-addressedStandardization~t
-r
ovww.ntProposal
(ODForm1426)am=ring
atthemd
ofthisdommnt
orletter.
ii

MII-S’ID-105E
‘ItLisp.blitationprovidez.sampliqproceduresandreferenetablesforusein
planningandconductinginspectionbyattributes.‘Thesamplingconceptisbased
ontheprokbilisticreaxrenteofeventshhenaseriesoflotsorMxhes
are
prtducedinastableenvimrmmt.
‘Mispublicationshouldixusedtoguidetheuserintherk?velqzwntofan
~ion
strategythatprmidesacosteffectiveq+math
toattw
amfidmm
inprcchxtanpliancewithcon-~actualtechn.iralrquimmnts.
Tne
useriswrned
oftheasmmxlrisksrelativeco*
rhozensanplesizead
MK-
Mili@
~ifications
should~t
~t~
r.”
equmrents
foruseofwfic
ssIIQlingplans,norshouldtheyprovideAQL’sorLl?D’sasarequimmnt.
Sal@ingplansforcontinuous,ratherthanlot~ion,
arecontainedin
MllAIV-1235,“’SingleandMlci-LevelContinuousSanplingPmcedxes
andTables
forI
.nscectionbyAttrihxes”.
iii

MIL-STC-105E
Paragraph1.
1.1
1.2
2.
2.1
3.
3.1
3.2
3.3
3.4
3.5
3.6
3.7
3.8
3.9
3.10
3.11
3.12
3.13
3.14
3.15
3.16
3.17
3.18
3.19
3.20
3.21
3.22
3.23
4.
4.1
4.2
4.3
4.4
——
..
SCOPE...............................................
-se
....................................-.”.”-”
A@ication.......................................
REmwKED
lxKuMmrs.................................
Nonapplicable....................................
DEFIMTICMS.........................................
_t*leCmlity-1
(ML)....................
....................
AverageGutgoingQualityLimit(=L)
.............
ClassificationofDefects.........................
CriticalDefect...................................
CriticalDefective...........:....................
Cefect............................................
Defective..........................................
[email protected].........................
Inspection........................................
InspectionbyAttributes ..........................
I_ctorBat*......................................
I.mor
EatchSize.................................
MajorDefect......................................
MajorDefective...................................
MinorDefect......................................
MinorEefective...................................
PercentDefective..................................
P-ss
Average...................................
Sanpl
e....
........................................
Sa@e
SizeCedeLetter...........................
san@ingPlan.....................................
UnitofPrcdmt...................................
GmJ=m~s
--------------------------
------
WrittenProcedures................................
Noncunformnm....................................
FormtirmandIdentificationoflotsorBatches...
ML...............................................
4.4.1
AQLUse...........................................
4.4.2
Limitation........................................
4.4.3
Chasingins.....................................
11111222222.,
2333333333344.444444455555
iv

mL?S’m-lo5s
C@m2?l’s-
CQ
ntin
ue
d.
4.5.1
4.5.2
4.5.3
4.6
4.7
4.7.1
4.7.2
4.7.3
4.7.4
4.8
4.9
4.9.1
4.9.2
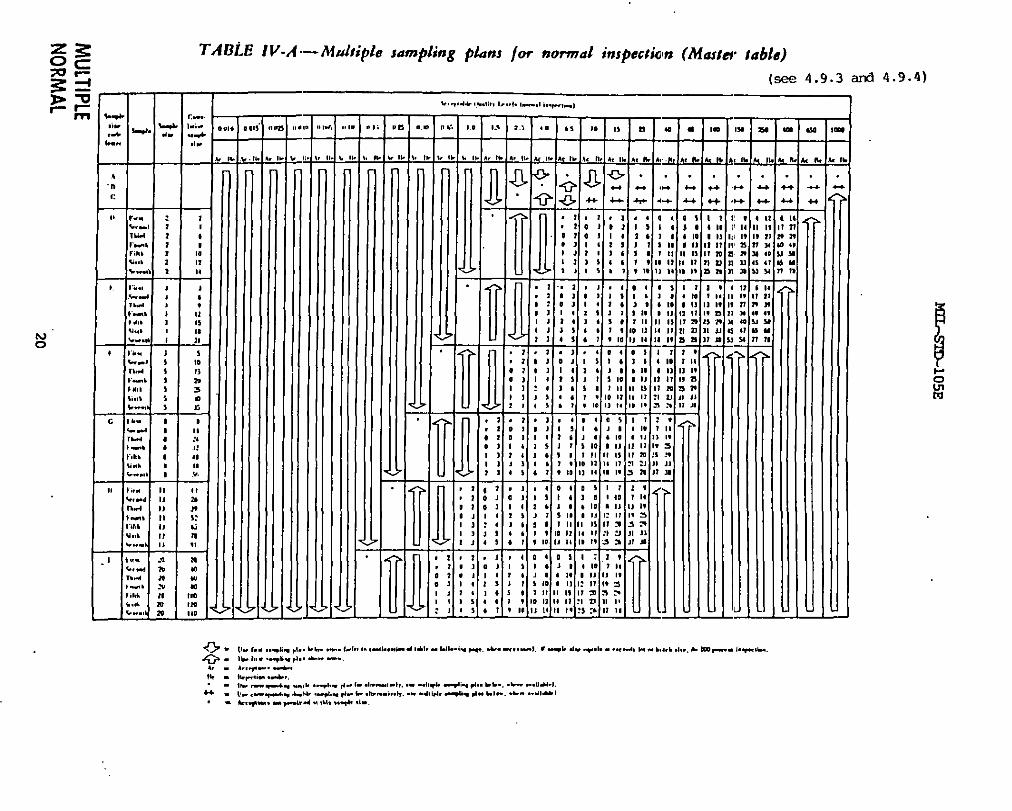
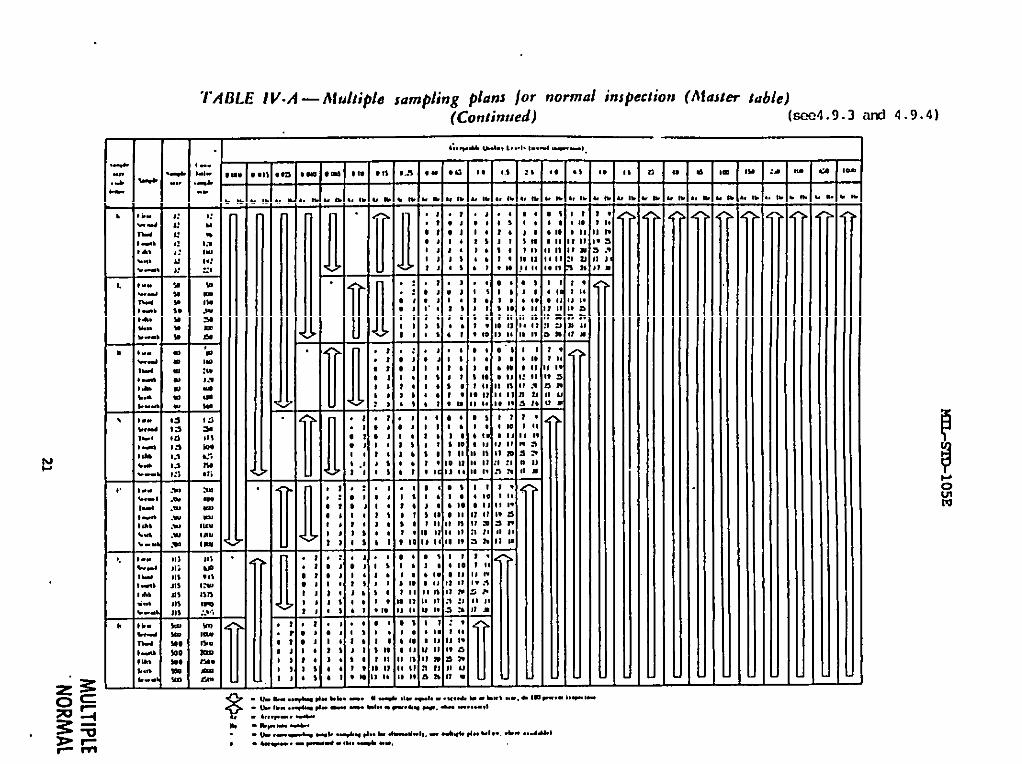
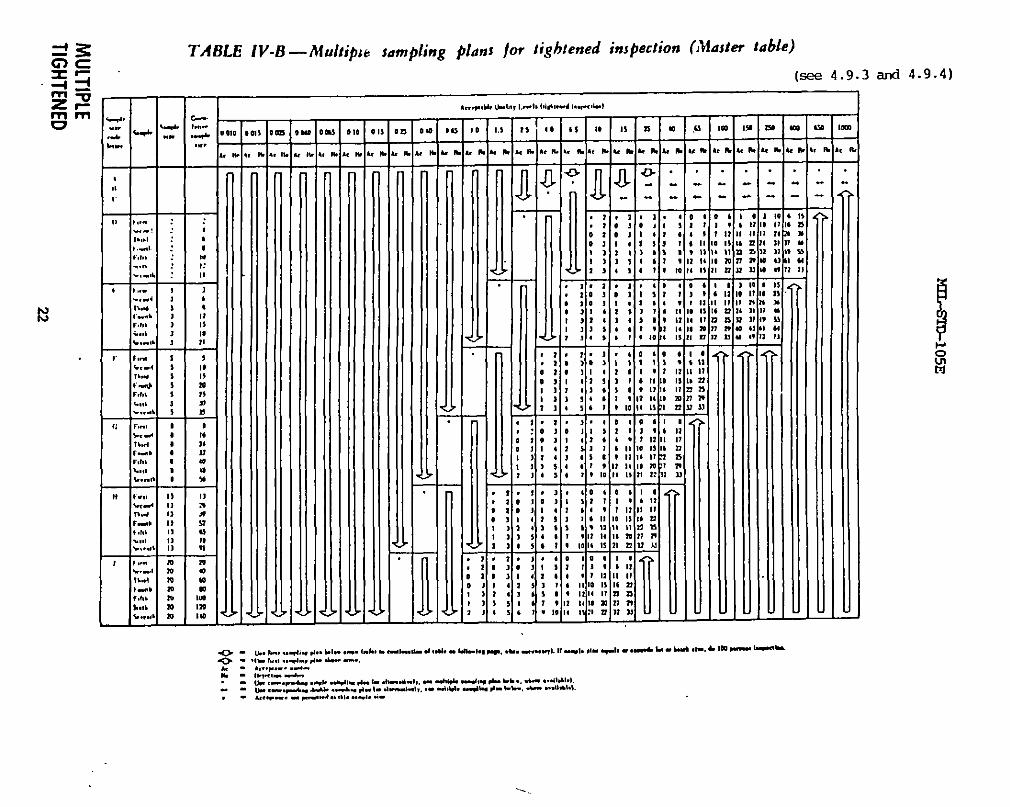
4.9.3
4.9.4
4.10
4.10.1
4.10.1.1
4.10.1.2
4.10.1.3
4.10.1.4
4.10.2
4.11
4.12
4.12.1
4.12.2
sa71Qlhg.........................................
RepresentativeSanding....
......................
Tim20fS.a@@
.................................
~&irrP&tiple
Saupling......................
............................
.SwitchiqP~
.............................
Mxm.lcoTightened.............
.................
Ti@tenedtoNorml..............................
Noz-mltoFamed
................................
Reducedtot+xm.l................
................
DkxmtinuationofI
nspection.
...................
San@ingPlans...................................
~ion==l..
...................
............
Clxk?l.ettera
.....................................
Maining
sanplinGolan.........................
TYF=of*l%l
Plens..........................
Determinationofkxeptabi.lity....................
PercentDefectiveInspection.....................
SingleSa@ingPlab.............................
CoubleSamplingPlan.............................
tiltipleSa@ingPlab...........................
Sp2CialProce&reforRdweclIrsection.........
.............
L.imitingOmlity
Protectkn......................
...........................................
-t%-=-i=ic
~..................
AverageSa@e
SizeCurvea.:.....................
5.
TABLES...............................................
Table
I.
II-A.
II-B.
11<.
III-A.
III-B.
III-C.
[email protected].........................
ShgleSenpMngPlansforNonm.1
~ion
Mster
table)....................:.
SingleSaWMng
PlansforTight&
InspectionMastertable) ......................
SingleSanpM.ngPlansforReduced
Irqection(M3stertable)......................
CoubleSamplingPlansforNormal
~ion
043stertable)......................
CuubleSanplingPlansforTightened
~ion
(Mastertable)......................
CoubleSa@ing
PlansforReduced
I~ion
(Masterteble)......................
v
q
5:56666667177788888t!9,9999
11
13
14
15
16
17
18
19

CcNIENrs-Cclnthuled.
Table
IV-A.
IV-B.
Iv-c.
V-A.
V-B.
\T-A.
VI-B.
VII-A.
VII-B.
VIII.
Ix.
MTL-S’IC-105E
M.dtipleSaplingPlansforNornksl
~im
(~ert~le)
......................
MiltipleSamplingPlansforTightened
Inspection(Msstertable)......................
[email protected]@ingPlansforReduced
~im
(Msstertable)......................
AveragzDutgoingQualityLimitFacLorsfor
Normal~ion
(Stiglesampling)............
Average@tgoing@alityLimitFactorsfor
TightenedIn-ion
(SingleSan@ng)
.........
Limittig(Xality(inPercentDefective)for
whichaPa=10%(forNormal~ion,
Singlesanplti
g).............................
LimitingQuality(inCefectsperHundred
Units)forwhichthePa=10%(forNormal
~im,
StigleSa@ing)
...................
limiting@it
y(inPercentDefective)for
whichthePa=5%
(forNormslI.nsp?ction,
Singlesanplin
g).............................
Ltitk.gCMality(inDefectsperHundred’
Wits)
forwhitithePa=5%
(forNormsl
~ction,
Si.ngle*ling)
....................
LimitNun&rsfor
P&ducaiInspection.............
AverageSa@e
SizeCumes
forDoubleand
tWltipleSampling...............................
Sa@ing
Plansand~rating
Characteristic
Curves(andData)for:
X-A.
Sa@e
SizeCc&
I.etterA........................
X-B.
San@e
SizeCodeb?tterB........................
x-c.
SanpleSizeCa5eLetterC...:....................
X-D.
San’pleSizeCcxieLetterD........................
X-E.
Sa@e
SizeCedeLetterE........................
X-F.
San@e
SizeCedeLetterF........................
x-G.
Sa@e
SizeCo&
LetterG........................
X-H.
San@e
SizeCodeI.etterH........................
X-J.
San@e
SizeCockLetterJ........................
X-K.
SanpleSizeCcrZeI.etterK........................
X-L.
San@e
SizeCo&
LetterL........................
x-M.
Sa@e
SizeCcckLetterM........................
X-N.
San@e
SizeCodeLectern........................
x-P.
SanpleSizeCodeLetterP........................
x-Q.
San@e
S$zeCmieIetterQ........................
X-R.
San@e
SizeCockLetterR........................
20
22
24
26
27
28
29
30
31
32
33
3436
3840
4244
4648
5052
54
56586062
64
//’
vi

MR-.5TD-1OSE
)
x-s.
PanCJraph
6.
6.1
6.2
6.3
CmnENrs
-amnued.
~
Sa@e
SizeCc@eLetters........................
66
twnzs............................................
61
IntendedUse...................................
67,
SubjectTezm(keywozd)Listing................
_fmp=viousIs
sue.,................
...
:
aNmlDIrK
tamRIAL
..............................
68
vii

W*1OSE
,,
sJueLIKP~
ANDTAEES
FCRlNSP~ICM
BYATmmlm2S,
1.
-DE
1.1
Purpose.~s
publicationestablisheslotorbatchsanplingplansad
prcesiuresforinspectionbyattributes.‘mis@limtion
shallnotbe“inter
pretedco~
oramflictwithanycontractualm@xwmtS.
me
Wrds
‘Bae”’,
“~”,
“~tile”,
etctrefer~y
to~
~tr~o~s
useof
theqling
plarscontainedinthisstandard~donotitrplym
agre9mntby
the@vernmm
toSaept
anyprcduct.
GOVS17X~
Shallk
as
Eeterndnationofacceptabilitybythe
&scri&d
inamtrectualdoam-ems.
me
San@ingplans
describsdinthisstandsdareS@iable
toA(2L’sof.01~rcent
orhigherand
arethereforenotsuitablefora@i~tions
wherequalitylemls
inthe&fective
partsp
millioprangecanberealized.
1.2
lwl:~$.
San@ingplans&signat.e3inthispubli=tionareeppli~le,
ML
notlmt
,toimpectionofUlefollcwing:
a.
Fmlitens.
c.
*rations
orservices.
d.
Materialsinpmmss.
e.
Su@ies
instorage.
f.
Maintenanceqerstions.
9.
Dataorremrds.
h.
Adniniszrativeprocecbres.
lWse
pla
ns
are
inte
nd
sdprimsrilytoM
usedforacontinuingseriesof10CS
orbat-.
l?h2plansmy
alsobeusedfortheinspectionofisolatedlotsor
bacchss,but,inthislattercase,theuseriscautionedtoconsulttheqx3rSting
characteristiccumes
tofindaplanwh.itiwillyieldthe&sired
protection
(Sse4.11).
2.
2.1
3.
PEm@Km
IxnMNcs
‘
Not~licable.
DEFINITI@JS
1
mL-s’Imlo5E
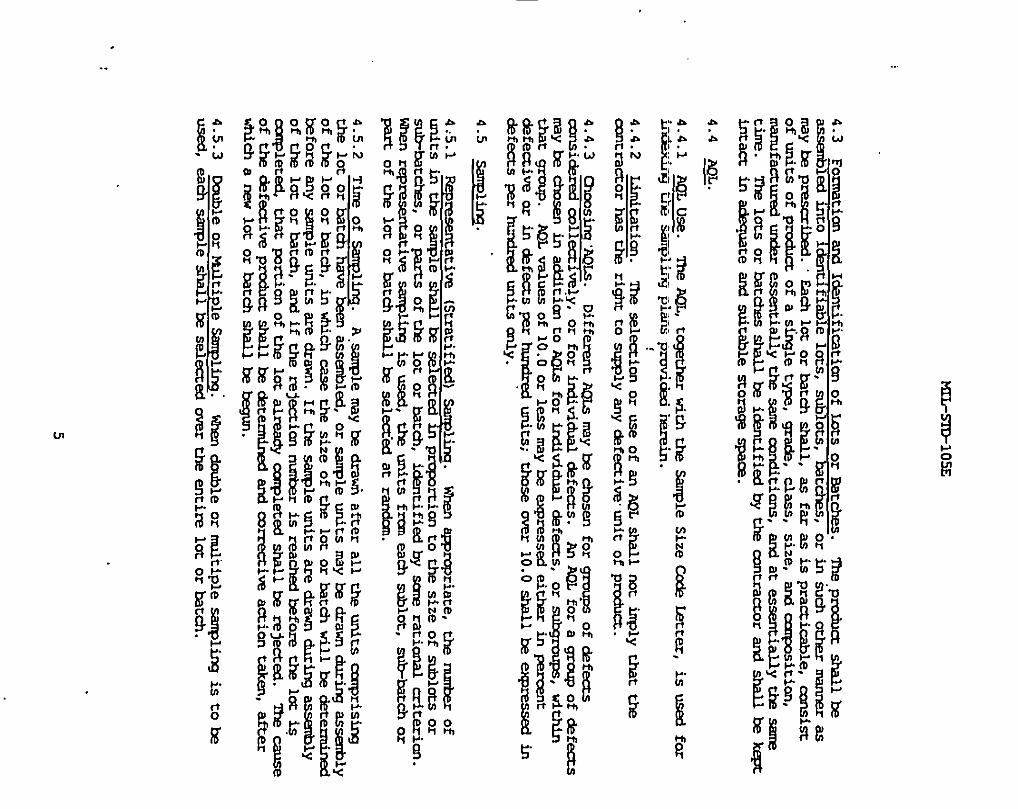
3.1
AcceptableCualityLevel(ML).
macontinuousseriesoflotsis
considered,theAQListhequalitylevelwhich,forthepurpsesofsanpling
inspection,istheltit
ofasatisfactoryprocessaverage(See3.19).
Nc7rE:AsanplingplanandanAQLaretisen
inaccordaro?withtheriskassunsd.
UseofavalueofAQLfora~ain
defectorgroupofdefectsindicatesthatthe
s~ling
Pl~
tilla-
the-t
~joritYof@
lotsorbat-
P*-
*processaveragelevelofpercat&fective
(ordefectsparhundredunits)inthese
lotsorbatchesbenogreaterthanthedesignatedvalueofAQL.
Tnus,theAQLis
adesiqaatedvalueofp2rcentdsfective(ordefects~
hurdredunits)forwhich
lotswillbeacceptedITOStofthetfi
bythesaplingprcedurebeingused.
The
aanplingplansprovidedhereinaresoarrangedthattheprdabilityofacceptance
atthedesignatedAQLvaluedeps!ndsuponthesanplesize,~ing
9enerallYhi~er
forlarges.snplesthanforsmallones,foragivenAQL.
TheAQLdone
doesnot
identifythechancesofaccqZingorrejectingindividuallotsorbatchesM
nure
directlyrelatestowhatmightteexp+ctedfranaseriesoflotsorbatches,
providedthestepsindicatedinthispublicationaretaken.
ItisnecessarYto
refertothe~ating
&aracteristiccurveoftheplantodeterndnetherelative
risks.
3.2
AverageGutgoingGuality(AD2).
Foraparticularprocessaverage,the7@
is
theaveragequalityofo~tgoingprcductincludingallacceptedlotsorbatches,
plusallreject+lotsorbat&esaftertinerejected’lotsorbatcheshavekeen
effectively100~rcent
irqxctedandalldefectivereplacedbynon-rkfectives.
3.3
AveragecXIt90ingC?JdityLimit(ACQL).
TheJKX)Listhen-axhrnAD2fora
givena~ptance
Sa@ing
plan.Factorsfor-t
ingAD2LVS1=
~9ivenin
TableV-Aforeachofthesinglesaplingplansfornormalinspectionandin
TableV-Bforearhofthesinglesanplingplansfortightenedinqection.
3.4
ClassificationofDefects.AclassificationofdefectsistheemnerationOf
PssibledefecLsoftheunitofprcductclassifiedaccordingtotheirseriousness.
3.5
Criti&
Eefect.Acriticaldefectisadefectthatjud-t
andexperience
indicatewouldresultinhazardousorunsafeconditionsforindivitialsusing,
maintaining,orciqendingupontheproduct,oradefectthatjudgmt
ard
~rien=
indimteislikelytoprevent~rformsne
ofthetacticalfunctionofa
majorenditemsuchasaship,aircraft,tank,missile,orspacevehicle.
3.6
CriticalDefective.Acritid
defectiveisaunitofproductwhich
containsoneormre
criticsldefectsandnayalsoconcainIMjorand/or&or
defects.
3.7,~fe.
Adefectisanynonconformanceoftheunitofproductwith
ef~d
requirements.
2

MIL-mlosE
3.8
Cefectiw.
Adefectiveisaunitofprocbctwhid
containsoneornure
defects.
3.9
Defectspr
givenquantityofunitsofproductisonehundrd
tires
.ttienu-&eroftkfects
anltainedtherein(oneornuredefemsbsing~ssibleinanyunitofproduct)
dividedbythetotalnunbsroftics
ofproduct,i.e.:
Defectsper
.Nun&r
ofdefectsx
100
lmldredunits
Nun&r
ofunitsimpe@sd
3.10
-ion.
Inspectionistheprotessofmssuring,
testing,
or~se
~in9
thetit
ofprtckmwiththerequirsfmts.
,
3.11
~on
byAttributes.
~ion
byatcri.butesis
“ ~on
Whersby
eithertheurucofprcduct1sclassifiedsinplyasdefectiveornon-defective,or
thernm&r
ofdefectsintheunitofprcductiswunted,withrespcttoagivz2n
~~t
orsetorrqi~ts.
3.12
LOKorBatd.
Thetermlotorbatchshallnean“inspectionlot”or
“’-Lion
batch-,i.e.,acollectionofunitsofproductfromwhichasapie
istobedrawnandirspsctedad
raydifferfranacollectionofunitsdesignatd
..—..—.....
...
..
asa
Laoroacm
rorouer
pupses
(e.g.,prooucuon,snqnent,etc.).
3.13
EorBst~
Size.Thelotorbatchsizeisthenunberofunitsofprcduct
inalotorbatch.
3.14
MsjorDefect.Amjor
defectisa&fect,
otherthancritical,thatis
likelytoresultinfailure,ortoA=
mteriallytheusabilityoftheunit
ofprcductforitsintendedprpose.
3.15N!ajorCefective.Amjor
defectiveisaunitofprtductwhichcontainsone
ormre
msjor*fects,andrayalsocontainminordefectsbutcontainsnocritical
defect.
3.16
minorDefect.Aminordefectisadefectthatisnotlikelytoreduce
materiallytheusabilityoftheunitofpraiuctforitsintendedpupose,orisa
-=
frm
establiah05stmhrds
-littlebearingontheeffectiveuseor
qerationoftheunit.
3.17
MinorDefective.Aminordefectiveisaunitofproductwhi&
containsone
ornxxeminordefectsbutmains
nocritid
ormjordefect.
3

MIL-STD-105E
3.18
PercentDefective:Thepercent&fectiveofanygivenquantityofunits
ofproductisonehundredtk
thenun-herofdefectiveunitsofprcductcontained
thereindividsdbythetotalrnnnkerofunitsofproduct,i.e.:
PercentDefective
=Nwber
ofdefective
x100
Nun&r
ofunitsinspected
3.19
Pnxess
Average.Thep-ss
averageistheaverageprcent
defectiveor
averagenu&er
ofdefectsperhundredunits(whitieveris.s@icable)ofprodu~
subnittedbythesqplierfororiginalinspection.Original~ion
isthe
firstinspectionofaparticularquantityofprcductasdistinguishedfrcanthe
-tiion
ofPrOdUCttiti
haskeenresuhn.ittedafterpriorrejection.
3.20
Sanple.A.sa@e
consistsofoneor!mreunitsofprduct
drawnfra
alot
orbatti,theunitsofthesanplebeingselectedatrancbnwithoutregardtotheir
quality.Thentnrberofunitsofproductinthesa@e
isthesa.nplesize.
3.21
SanPleSizeCedeLetter.Thesanplesizecodeletterisadeviceused
alongwiththeAQLforlocating’asanplingplanonatableofsan’plingplans.
3.22
SanplingPlan.
Asanplingplanindicatesthenunberofunitsofprcduct
franeachlotorbattiwhi&
aretobeinspscted(sanplesizeorseriesof
sa@e
sizes)andthecriteriafor*tenninin g
theacceptabilityofthelotor
batti(arreptanmandrejectionn-rs)
.
3.23
UnitofProduct.Theunitofproductisthethinginspsctedinorderto
determineitsclassificationasdefediveornon-defectiveortocountthenunber
ofdefects.ItnBybeastiglearticle,a
pair,aset,alength,an~,
an
opsratia,avolm,
accsrponentof
anendproduct,ortheendprcductitself.
TheunitofprcductIMYornBynotk
thesam
astheunitofpur&ase,aqply,
production,orshipt.
4.1
WrittenProcedures.Writtenproceduresareo~ily
develo@
andmde
availableforthe~t
representative’sreview,uponrequest.Wnenthe
writtenp~
indicateuseofthisstadard,theyShallDYl@ywiththe
~S
ofthisstandardandreferenceappropriatepartsasnecY2s.SaZy.
4.2
Nonconfonnanm.
Theextentofnoncnnfonranceofproductshallbeexprersed
eitherintermsofpercentdefective‘orintermsofdefectsperhundredunits.
4
FKL+TW105S
4.3
Forrnatianad
Ick!ntif
irationof&s
orBatches.Theprcductshallb
asssn’bledintoicknt.ifiablelots,sublets,batches,oriniuti
othermrun2ras
mayb?prescribed.EachlotorMtch
shall,asfarasispracticable,consist
ofunitsofproductofasinglet~,
grack,class,size,andcrqosition,
manufactureduncisressentiallyt.&saneainditians,andatessentiallyt&
saue
tim.
Tis310tsorbstchesshallbei&ntified
bytheamtractor
andshallbekept
intactini@quateandsuitablestoragespace.
4.4
AQL.
—
4.4.1.AQLuse.
‘MeAQL,tqstherwiththeSa@e
SizeCo&
b?tter,isLEA
for
~-
-1*
Plm
provi&dhareixl.
4.4.2
Limitation.Thesele&n
oruseofanAQLshallnotiK@y
thatthe
contractorhast&
righttosqply
any&fective.unitofprodua.
Ziis%%%%%iy,
orforindivicha.1&fects.
AnAQLforagroupof&f_
DifferentAQ1.sraybechosenforgruupsof&fects
my
Ixchoseninackiitionto
AQIaforindividualdefects,ors@roups,
within
thatgfoup.AQLvalussof10.0orlesswaybeeqxassedtitherinprcent
defectiveorindefectspsrllundrqdt5;
thoseoverlo.o
shallbeeqress@k
defectsperhundredunitsonly.
4.5
San@inq.
4.’5.1@xesentative
C3tratified)SallQlinq.
When~ropriate,
thenunterof
unitsinthesanpleshallEeselectedin~rtim
tothesizeofsubletsor
Su&bStCkS,
orpartsofthelotorhat*,
identifiedbym
rationalcriterion.
Whenreprasentatives.a@irqiaused,theunitsfrm
eati-lot,
s&-batdlor
partofthelotorbatd
shall&
sel~”.edatrandan.
4.5.2
TineofSamJinq
1A.sanplemy
bedratiafteralltheunitsculprisiirq
tk
lotorbatchhave&en
assmlsd,
oraanpleunitsmaybedrawnduringassenbly
ofthelotorbatch,inwhiticasethesizeofthe10Corbattiwillbedetermined
&fore
anyample
unitsaredrawn.Iftl-e.5an@eunitsaredrawnduring~ly
ofthelotorhtti,
andifthsrejectionnun&r
isreachedbeforethelot*
Cnl@eta
thatpxtianofthelotalreadyclxlpletedshallberejected.m
cause
ofthedefectiveprcductal
bedeterminedandwrrectiveactiontaken,after
whichanewlotorbatch~h
begun.
4.5.3
LhubleorFldtipleSaq3Ml-q
Ussd,Sa
hhendoubleormultiplesanplingistobe
chsarpleshallbeselecttiovertheentirelotorbatch.
5

MIL-S’ID-1O5E
4.6
InspectionP~.
Normal~ion
willkeusedatthestartof
~ion.
Normal,tightenedorreducedimpction
shallcontinueunchangedfor
eachclassofdefectsordefectiveonsuccf2ssivelotsorbatchesexceptwherethe
switdd.ngpmcedums
givenbelowrequire&ange.
Thetit-9
P~
s~l
bea@ied
toeachclassofdefectsordefectiveindependently.
4.7
switdimq
Procedures.
4.7.1
NormaltoTightened.Whennormalinspctionisineffect,tightened
~ion
shallbeinstitutedwhen2outof2,3,4,or5consecutivelotsor
bat&eshavebeenrejettedonoriginalinspction(i.e.,ignoringresutxnittedlots
orbatchesforthisprocdure)-
4.7.2
TigirtemdtoNormal.Whentightenedin-ion
is.tieffeet,normal
~ion
shallEeinstitutedwhen5consecutivelotsorbatcheshavebeen
consideredaceptableonorigti
inqection.
4.7.3
Nod
toReduced.t?nennormalinspectionisineffect,reducedinspection
shallkeinstitutedprovidedthatallofthefollowingconditionsaresatisfied:
a.
T’FISpreceding10lotsorbazches“(ormore,as
indicated
bythenoteto
TableVIII)havebeenonnorrnslinspectionandallhavebeenaceptedonorigha.1
~ion;
and
Thetotalnumberof*fectives(ordefects)in*
samles
frm
the
pm&”
10lotsorbatde.s(orsutio-
nmber
as-
usedforconditim“a”
amve)isqua.1toor.lessthantheappliwblen-r
gi-
inTable~11.
If
doubleormltiplesan@ingisinuse,allsanplesinspectedshouldteticluded,
not“first”sanplesonly;and
c.
Productionisatastezdyrate;and
d.’Reducedinspectionisconsickreddesirable.
4.7.4
RducA
toNor&l.
men
reducedinspectionisineffect,norml
inspection
shallbeinstitutedifanyofthefollowingoccuronoriginalinspction:
a.
Alotorbatchisrejected;or
b.
AlotorbatchiscmsideredacceptableundertheproceduresOf
4.10:1.4,or
c.
Productionkecmes
irregularordelayed;or
d.
Otherconditionswarranttit
normalin~~~ion
shallbeinstituted.
6
~-S’ID-105E
4.8
DiscontinuationofInspection.
Ifthecumnul.atimrnnrberoflotsmt
a~~
inasequenceofmnsecutivelotsonoriginaltightened~ion
reachesfive,theacqxanoe
pmcedums
~ion
we
p~sions
ofthis
ofthissllamlardshallbedismntilnled.
stmdardshallnotberesumeduntil
correctiveactionhasteentaken.TigthenedinspecU“onshallthenteusdasif
4.7.1hadkeeninvciked.
4.9
~.mg
Plans.
.
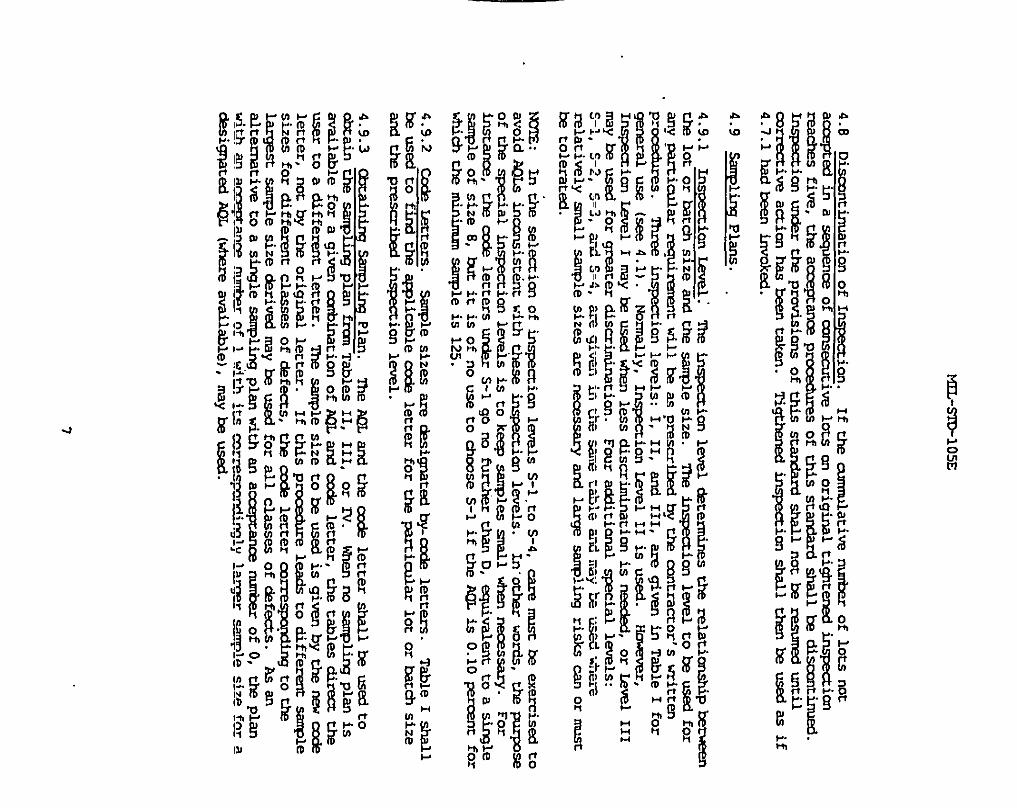
4.9.1
Inspectionlevel:me
“inspectionlevel&terminestherelationshipketu=en
thelotort.atchsizeandthessnplesize.
mehsp2ction
leveltobeusedfor
.-Y
Particuk
Ze@mnent
tillbeasprescribedbythemmractor’s
written
prceddres.
l?ireeirqectionlevels:I,II,andIII,aregiveninTableIfor
genemiluse(s&4.1).
Normally,InspectionEvel
IIisused.
However,
Inspectionml
Imy
&usedwhenlessdiscriminationisneedsd,orI.@_dIII
my
*usedforgreauerdiscrimination.Fouradditionalsfeciallevels:
S-1,S-2,S-3,andS-4,aregiveninthedam
tableandmy
~usedkhre
relativelysm.11sanplesizesare~sary
andlargesanplingrisks~
orrust
betolerated.
~
NYIE:
IntheselectionofinspectionlevelsS-1,coS-4,~
rustbeex-~isedto
avoidAQ1.sincnnsist4ntwith+ase
impectionlevels.
ofthespecial“
In”othsrwords,thepurpsa
~ion
levelsistokeepsanplessmll
wtiennem.ssary.For
~=,
tb5CO&
letterSun&r
S-1gonofurtherthanD,equivalenttoaSi.@e
sampleofsize8,butitisofno
useto
-Se
S-1
ifthaAQLis0.10peromrfor
wfi~
themininnmsampleis125.
4.9.2~
~ters.
Ssnplesizesare&signatejby-tzxb?letters.TableIshall
beusedtofindtheapplicablecodeletterforthe~icu.lar
lotorbatdlsize
ad
theprescrikeslirqectionlevel.
4.9.3Cbta.Wq
SanplingPlan.
‘lkAQLandthe
codslettershallbeusedto
obtainthesartplingplan.&m
TablesII,111,orIV.
WnennosmplingplaniS
am.ilableforagivencombinationofAQLandco&
letter,thetablesciinxZthe
usertoadifferentletter.TneSan@esize
tokusd
isgivenbythenewade
letter,notbytheoriginalletter.Ifthisp~
leadstodifferentsanple
sizesfordifferentclassesofdefems,
thecedeletteraimespmdq
to*
_~le
size-ie
my
keusedforallCI.SSSCSofckfeci.s.k
an
alternativetoasinglesanplingplanwithana~
nurr&rofo,
theplan
witim
~nm&r
of1withitscor~
lylargersanplesizefora
-igqated
AQL(whereavailable),maybeused.
MIL-S’ID-1OSE
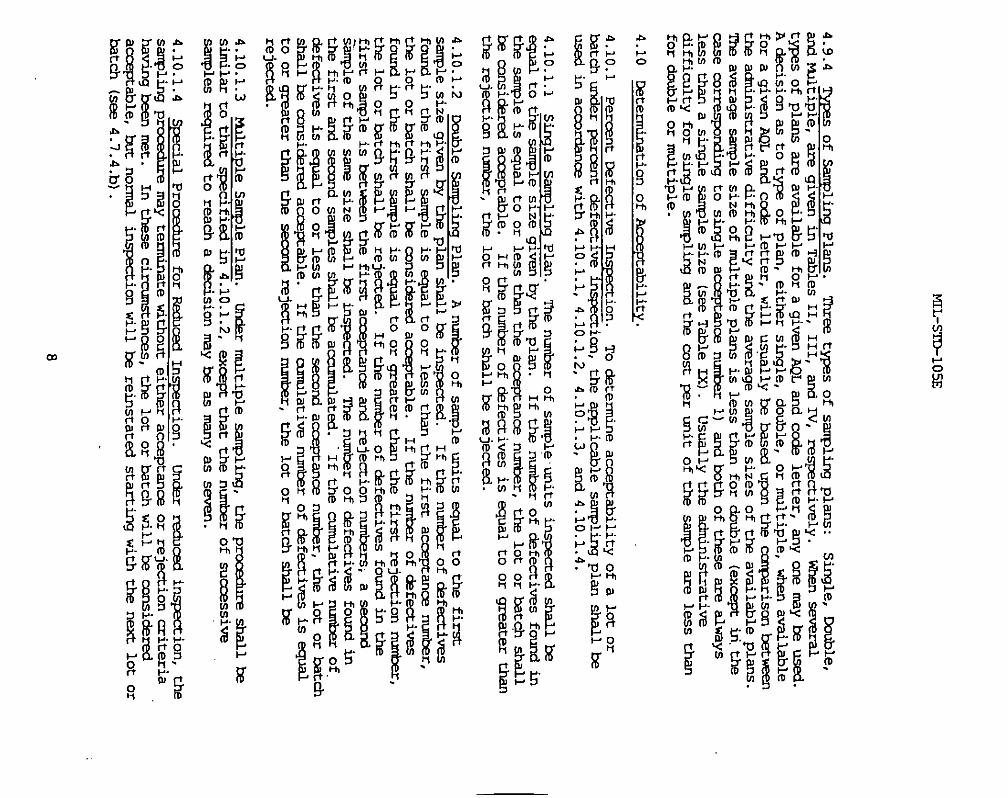
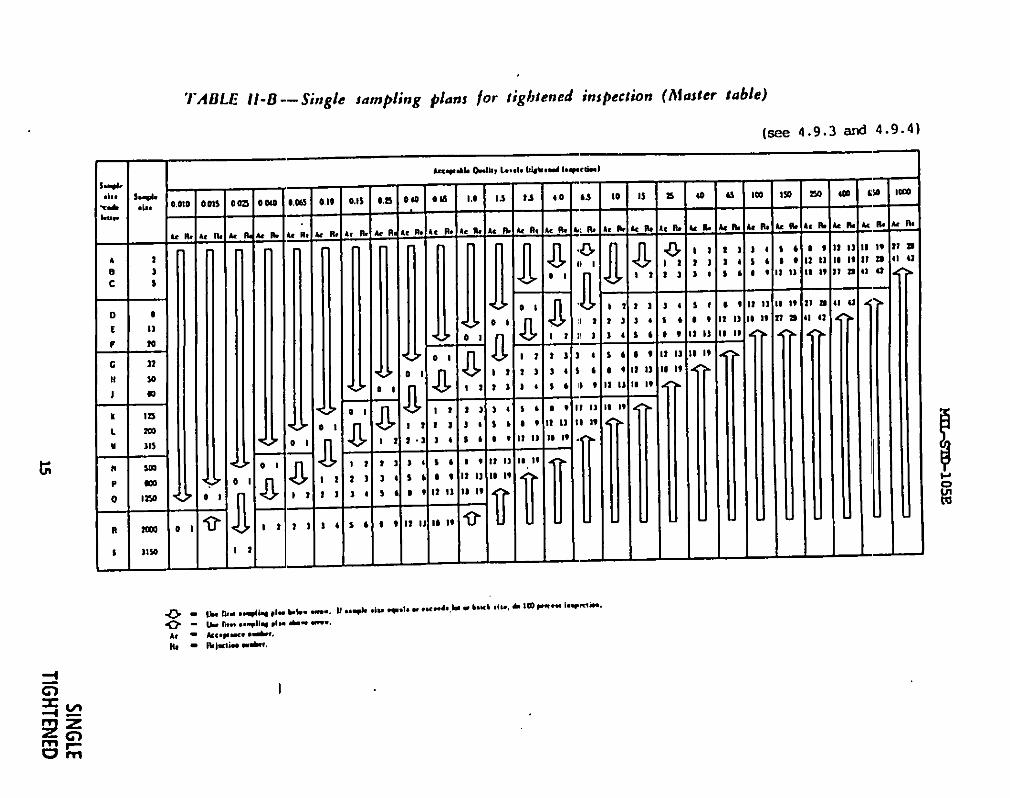
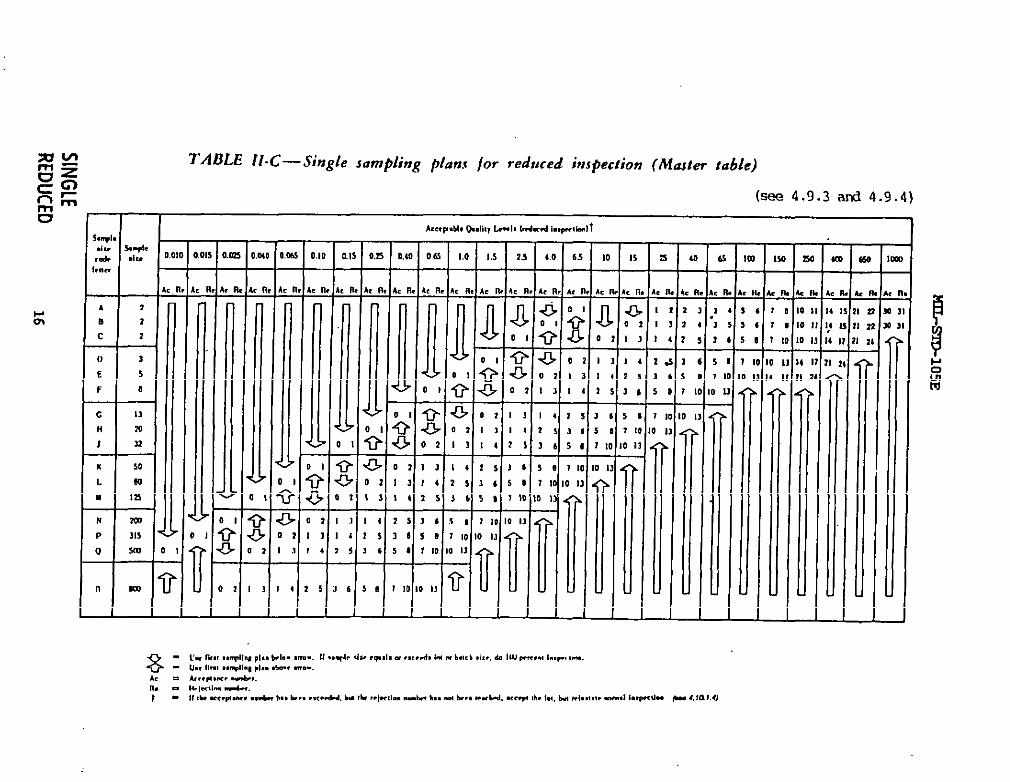
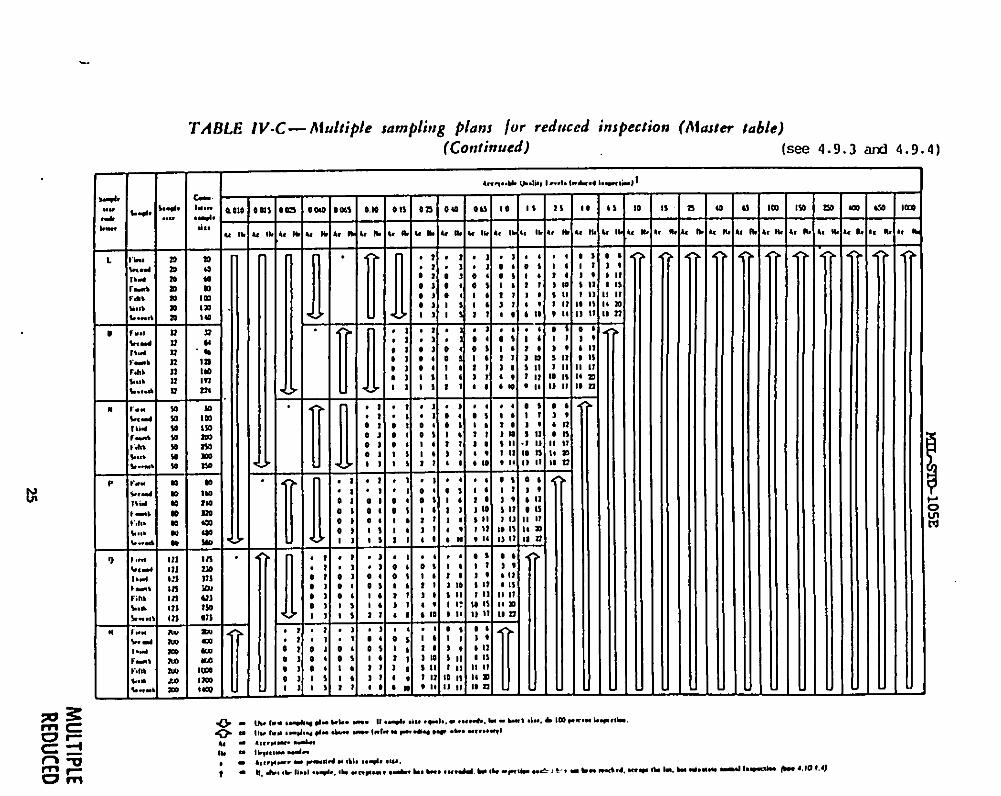
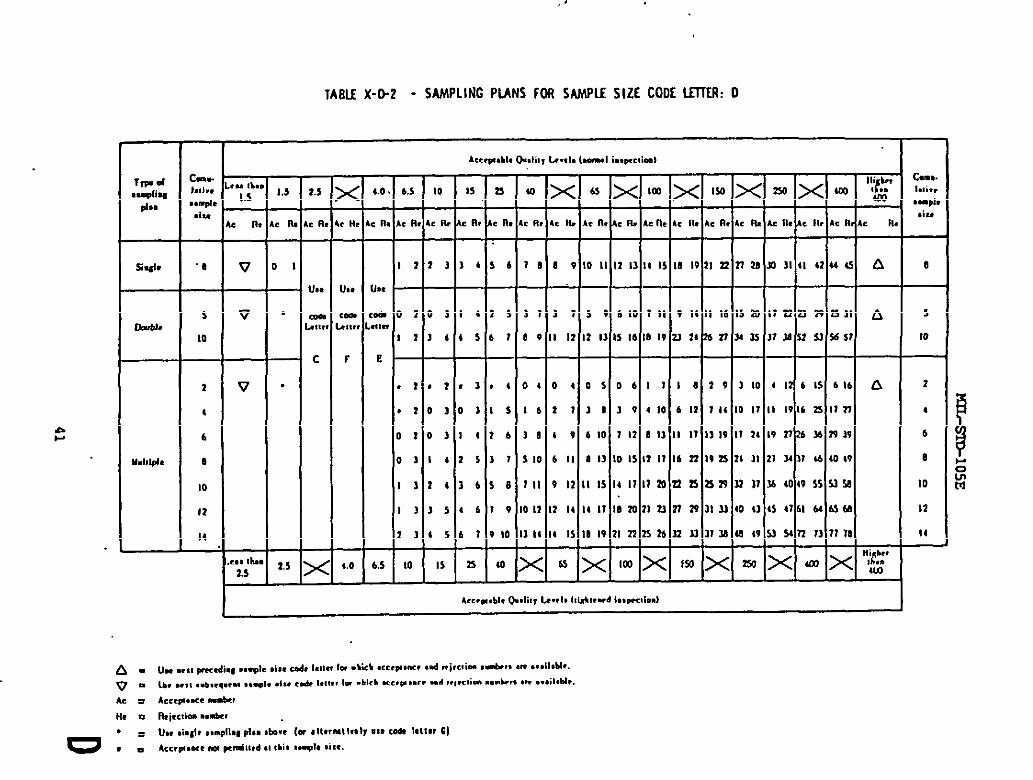
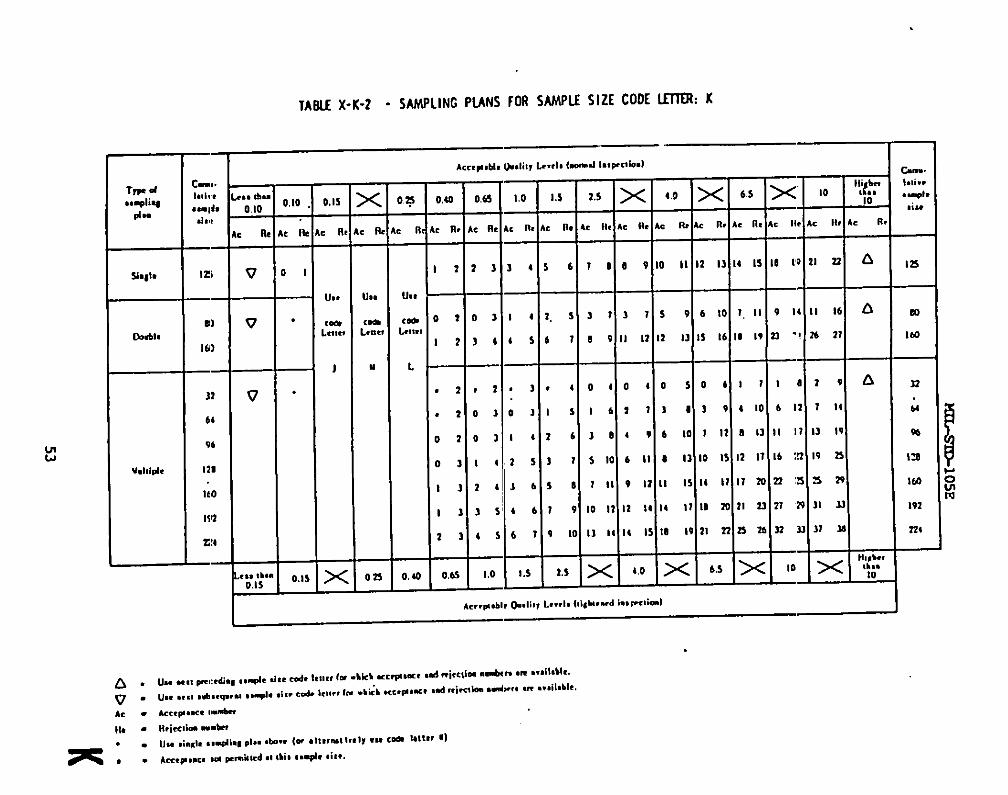
4.9.4Typ2SofSalIplingPlans.Threet~s
ofsanpltigplans:
Single,Eooble,
andmltiple,aregiveninTablesII,III,andIV,respectively.Whenseveral
typesofplansam2availableforagivenAQLandcodeletter,anyonemy
keused.
Adecisionastotypeofplan,eithersingle,double,ornultiple,whenamilable
foragivenAQLandccxieletter,willusyallyhebaseduponthecmparisonbet-
theadministrativediffim.ltyandtheaveragesanplesizesoftheavailableplans.
Tneaverageaanplesizeofmltipleplansislessthanfordouble(exceptiri.the
casecorreqmndingtosingleacce@nce
nmber
1)andbothofthesearealways
lessthm
asinglesanplesize(seeTableIX).
Usuallythe~Stiatim
difficultyforsinglesanplingandthemet
perunitofthe.san@earelessthan
fordoubleormultiple.
4.10
Determinationof~
ability.
4.10.1PercentDefectiveInspection.Todetermineacceptabilityofalotor
batchunderperrsmtdef=hiveinspection,thea@icable
sanplingplanehallbe
usedinaccordancewith4.1O.1.1,4.10.1.2,4.10.1.3,and4.10.1.4.
4.10.1.1SingleSaq3ltigPlan.
Thenunbarofsampleunitsinspectedshallbe
equaltothe~le
sizegivenbytheplan.
Ifthenumberofdefectivefoundin
thesanpleisequaltoorlessthantheacceptancenumber,thelotorbst@
Shall
beconsidereda-ptable.
Ifthenunkerofdefectiveisequaltoorgreaterti
therejectionnunbr,
thelotorbattishallberejected.
4.10.1.2DoubleSap
q1’
Plan.
An-r
ofsanpleunitsequaltothefirst
sanplesizegivenbytheplanshallk
~ed.
Ifthenumberofdefective
foundinthefirsteanpleisequaltoorlessthanthefirstaccqtanm
number,
thelotorbat~
shallbemnsideredacceptable.Ifthenuntxrofdefective
foundinthefirst.san@eisequaltoorgreaterthanthefirstrejectionrmbert
thelotorbattishallberejected.Ifthenmber
ofdefectivefoundh
the
~irstsmple
isketweenthefirstaccqtane
andrejectionnumbers;asecond
smpleofthesamesizeshallbeinsp3cted.Thenurberofdefectivefoundin
thefirstandsecondsanplesshallM
acnnmlated.
Ifthecumlativenmber
of.
defectiveisequaltoorlessthanthesecondaqane
number,thelotorbatd
shall*
mnsideredacceptable.IftheemulativenunterofdefectiveisW
toorgreaterthantheae.mndrej-ion
nunber,thelotorbatchshall&
rejetted.
4.10.1.3~tiple
SanplePlan.Undermltiplesapling,theproedureshallm
similartothatspecifiedin4.10.1.2,exceptthatthenmber
ofsuassive
sanplesrequiredtoreachackcisionmy
beasmanyasseven.
4.10.1.4
~al
Procedurefor-cd
Irqectim.
Undertied
insp52tion,the
Swim
P~
~Y
terminatewithouteitheracceptanceorrejectioncriteria
hatigteenmt.
Inthesecircmstantes,thelotorbatchwillk
considered
a~able,
butnormalimpsctionwillk
reinstatedstartingwiththenx
lotor
batch(See4.7.4.b).
8
MIL+3IW1OSE
4.10.2Oefectsp
HundredUnitsInspection.
Todeterminet+?a
“ityofa
lotorbatch
un&r*fectspsr
hundredunitsinspection,thepromdum
~~fid
forpermnt
defective
inSpettiM
aiwve
shall&
used,exceptthattheword
“defects”shallk
substitutesfor“Ck!fectives”
.
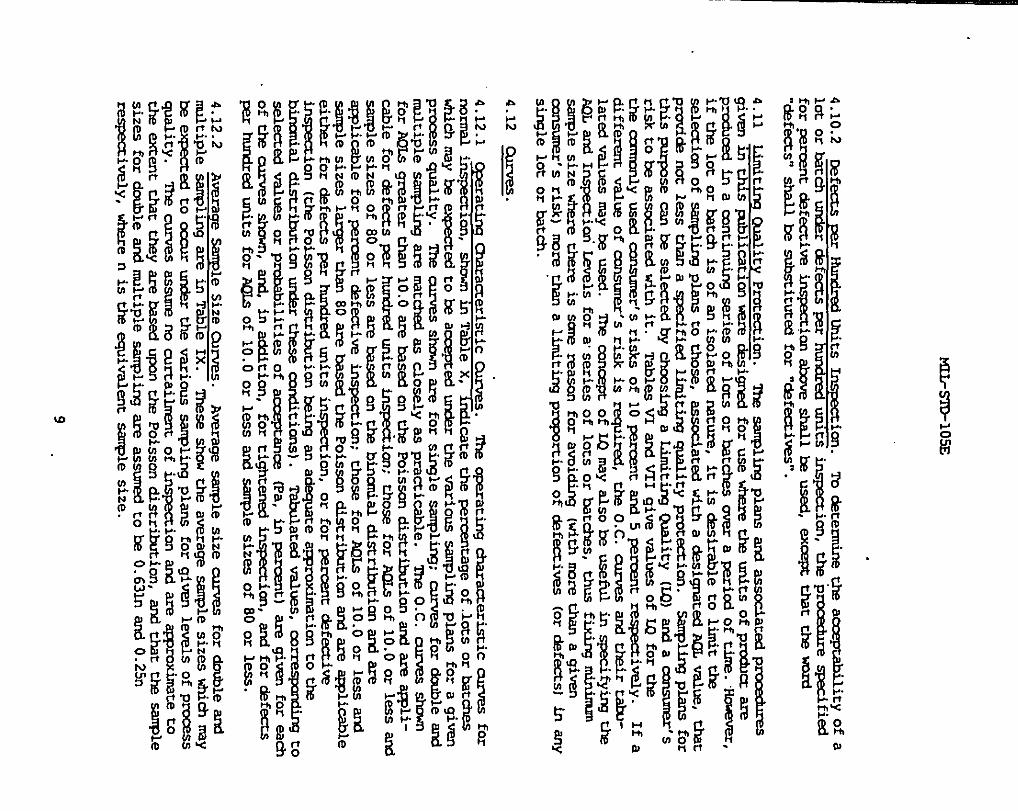
4.11
Limiting
wity
Protection.IIY2~hg
plansW
~a~
P~
-s
publimtion=
&signedforusewheretheunitsofproductare
~XG
inacontinuingseriesoflotsorbatchesoveraperiodoftim2.‘Mouemr,
ifthelotorbatcAisofanisolatedrbstum,itiscksirabletolimitthe
se.kcdonofsanplingplanstothose,associatedwithadsal~t~
_~~1
~t
prcmt¬lessthanaspecifiedlimitingqualityprotection.Ssnplingplansfor
thisPUZFOSScm
*seksed
by-sing
aLimiting~ity
(UD
-a~’s
risktoteassociatedwithit.
TablesVIantiVIIgivevaluesofLQforthe
theCxmnnlyusedcomumr’s
risksof10percentand5~t
respectively.Ifa
differentvalueofcomunT#s
riskisrquired,tk
O.C.curvesardtkirti-
latedvaluesmy
beuse5.Tmmncept
ofmmlyalsobe
usem
inspacify+lgthe
AOLandI~im”
Levelsforaseriesoflotsorbat-s,
thusfixingndsumnn
.sanplesizewherethereisSam
reasonforavoiding(~fimm
~a9i=
mnsmer’s
risk)ITCIrethanalimitingproportionof&fecti-
(orc@f~s)
in-Y
singlelotorbatti.
4.12
Curves.
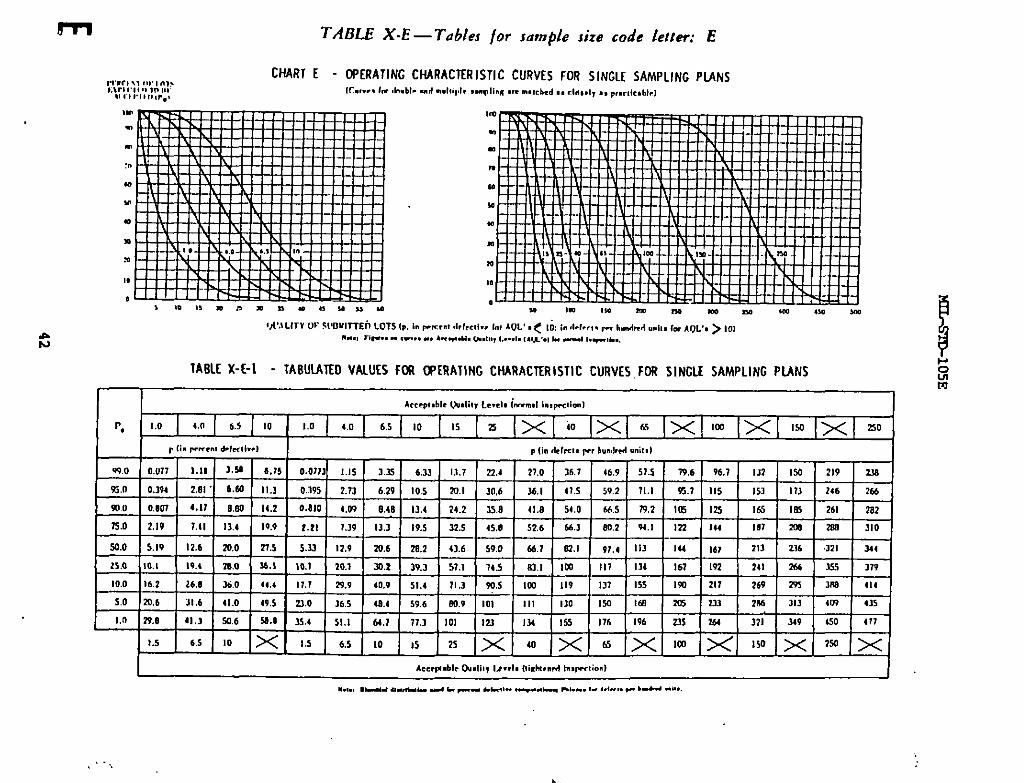
4.12.1@cratingmaramsristiccumes.
‘meoparating~eristic
~for
norml
irqection,showninTableX,
mte
thepercentageoflotsorbatdes
whichmaybeenp2rtedtobearceptedunderthevariousSS@ing
plansforagiven
proa?ssquality.T&
mrvesahcnmareforsingleSa@ing;
cumes
fordmble
and
-forAOLsgreaterthan10.0am
basedonthePoissondistributionad
area#i-
cablefordefectsperhundredunitsinspe&cion;thoseforAQLsof10.0orlessand
~le
SiZeSof80or1=s
arebasedonthebinonialdistrilmtimad
are
qlirable
forpermnt
defectiveinspection;thosefor~
of10.0
or
less
@
sam
ple
sizeslargerthan80arebasedthePoissondistributionandareS@icable
eitherfordefectsp3rhurdredunits~ion,
orforparent
defective
-on
(*
poissm-him
beinganadequateapproximationtothe
binmualdistributionunderthesemnd.itiona).
Tabulatedvalues,~
to
4-4
VS-hIasorpmbabiliciesof~anm
(pa,inpercent)aregivenforeati
Ofthealrvee
shown,m
inaddition,fortighten@inspection,h
for~f~
p2rlnmiredunitsforAQIsof10.0orlessandSan@e
sizesof80or1-.
4.12.2
Awsraqe~le
SizeCumes.
AverageSan@e
SizeC@FSS
for=le
and
multipleaa!plingareinTableIX.
Theseshowtheaveragesamplesizesuhirhmy
be~ed
toocmr
underthevariousaanplingplansforgivenlevelsofprcKJ2SS
quality.lhecurvesassurenocurtailrmntofinsertionarslare~roximte
to
theextentthattheyarebaseclupontttePoissondistribution,andthattheSa@e
sizesfordoubleandmltipleaanplingareassuredtobeO.631nandO.25n
~itiY,
tie
nistheequim.km
qle
size.
9,

MIL-STD-105E
=ICN
5
TABI&SANDmInlES
11

“fABLE 1’— .$amph Jizecode /eflers
(see4.9.1ad 4.9.2)
!ipecid i.qwcdon level, Gencr81 Inspection hwda
lxx cu bmb aim
, s. I s-2 s-3 S-4 I II 111
2 la 0 A A A A A A u
9 to 15 A A A A A B c
16 to s A A u D 0 .C 0
26 . to so A D o c c 1) E
51 to 93 B D “c c c E F
91 to 1s0 D B c o. D F G
1s1 to 280 B c D E E G II
281 10 S30 B c .0 E F II J
sol 10 1200 c c E F G J K
iml to 3203 c D E G N K L
3?0) to Imoo c IJ F G J L 1!
lmol to mooo c 0 F N K N“ N
3s001 10 IW303 II E G 1 L N P
Isoool 10 Woooo D E G J N P o
S00301 md over D t IIK.
N u n

191*1~-I
AA
”I
-I
1:1
,i~-lvv
-1.
-I
NO
RM
AL
14
15
.
SIN
GLE
TIG
HT
EN
ED
I
TABLE II-C— Single sampling plans /or reduced inspection (Mater table)
(see 4.’3.3 ad 4.9.4)
—
5,.d ,.-..!
4
B
c—
[)
E
F—
c
H
J—
M
L
u—
N
P
0—
n
—0.01s
—
A, R,—
6
.
s..+!.d w
—
2
1
1
~
-&
t
0—
1
I
1—
1
5
11—
10
—
z—
~
1
1
1—
2
3
s—
1
,
3
5
a—
1>
m
II
;
02,
Ill
1,1
2,3
165
981
7 1010
10 13
II
50
w
18—
m
11s
m
01
v—m
— I , 1
0- h ii., .. W11”4pi.” WI.. m.. 1! -d. J“ q.,!. - ?.CK+S !+ “ b.kh .:2., ti lw w-.., hp.< 8!”..
0 : ,C,vvti=,~*,,u., n“, . ..+1.. ph. b.. .“..
k!,. - u., -, 1- .--1... — . ... .... “.—t - 11,k =..,8.%. . ..+.. b.. k.. ,.<6, b. *b ..kh. ..-b.. h. w k.. “Ad, .,9, ,A. 1.,, M .$.,,,,. -d l..pa.” P.. 4,tal,4,

83
;.
..
-.”.”
.-.._==a
T
2ltldl::
1::1::1::1:il::l::l::l~l
-1,1
-1.
lf=l’+
lO-
i--l--
1--1
--1-,1
-=l,slk
-””-—l
DO
UB
LE
NO
RM
AL
17
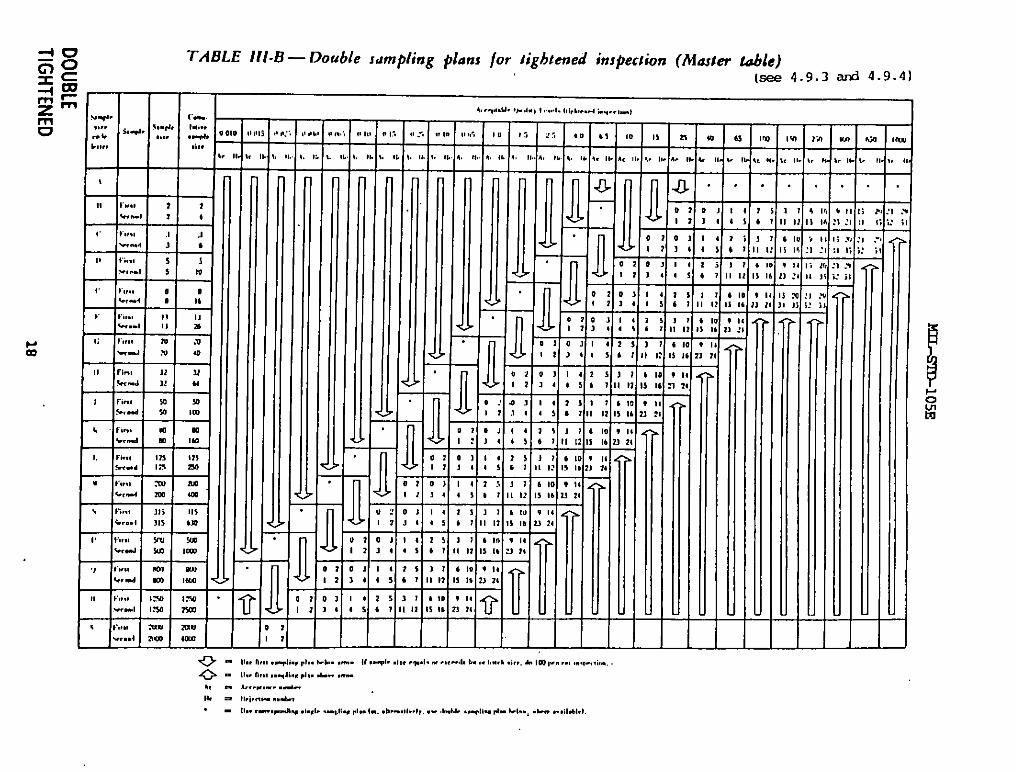
TABLE III-B — Double sumpfing plans /or tightened inspection (Mater lulde)
(see 4.9.3 and 4-9.41
.+? [“.
,,,, ~d. ,,.+, 1.,..,.. ,,,. ..4..,,,, ,1,.
,
,, F“., ? i* -I , ,
,. ! ,,., ., ,
-“., , ,
,8 +;,., s ;“! . . . , ,9
, , ,,., 0
..,..4 m ,:
v , ,,., ,,1, :
,; I:,”’ ; .-J
* s., .x! 40
,, n “, ,/
* 4 12 :
1 rl “8
s . ..d : 1:, 1,.,,
‘.. “4 : ,:
,, r,, ,, ,H ,,,. . . 12s m
w v,,., m m% . m .x4
\ K, ., , ,; ,,,& . . . , ,5 *m
1, v,,.s m Ym. 4 W, cm
,, $- 0 ml Ku%. d ml, nm.
,, l’,,. ! ,..-w ,.ww.. .1 Ima Z5m
t’,!,! w “m “+. .A aw ton
—,,,,,—,. ,
—.,—
—,,.-,—,. ,,—
II, “
_
/“1I
:
s
12
,.,.”... !)..,., , ..,.,. ,,,,, !...., ..”..,,m,
—,,,,,—
,,—
1r-
—
17
!12
I*1,
,,1’
T4. ● 1 ,,
,. ,, ,. ,,. ,,
u
i
@,
7-]
-J
T,
—o1
-7,
7-6
T11
T,5—
1:—
e- 1!.. n?.! ..+,., ,1.. hi.. ,“”. II ..+ .,,. -#. - ,W...l. 1.. ,. 1..,, ,,,,, A. ,m ,.”,., ,“.WA..
I,!
,.
—0
I
o- ,!., n,,, ,.q,k, ,,,. .I-.. ,.”.
,, - .,,... =, ..*-
“, = $,.,.4” .,dm
- U,. C.”W...% .4.,,, .q.,,v ,8” k. .h.-m,..,,, .“ ,+”!., ..+..+ 1.1.., .!-. . ..tl.hl.l

lm#
_S
m-lo
5E
1
!1tl~l.
Ibldl::l::’1
..
11
11
!1
I1
11
,1
,1
19
DO
UB
LE
RE
DU
CE
D
,,,,,,9
w“
~.1
.
NO
RM
AL
20
.-: -+4 z
,.. ,:.4 L!
c:2 ,!, a, ,:.“,
.-. :
,. ,.. *..d .
, -b :.
, a. su.,. ..-4 “
. *.. ...4 .
.:: .,*. .. :..- .
. ,... ::,*8*-s ::,- ,.,.4
--- ::
r ,.. .W%.-8 .-
.Ws ,=,lb, .9!
.- .9J
.-., .W
,. I -. 01. ..4 ,,;,b.1 ,,,
,-1 ,,$,ti m. . . ,,,.-., ,,,
h ,,.
. E
. wt -..1 ma, *. *,*.. .*-. .
TABLE [V-A — Muhible samblin~ idam /or normal in$Peclio~~ (~laJl~ table)(SCwl.9.3 and 4.9.4)
..1
.
.ICI—
,, m—
1{.,[
,M *M!
1, “lb
nv
n.1
Iiu,,*,,.1
t
n.1 ,
.10n?.● ,O1,8,,,2.,
,2, ,..* .,*,8,11,11*Y,> 1,3,11s9,,4s6
4;,.!.4 * I ., ,,..,. ,-.-, . . ...+.
- U-”..+.a#-. b. -. . ..+. .1--1 .-. ”..4. --.-$ “-.-@-,-lo-o-- Lb. !.. ..+.” t!.. - - b.1.o .-. *. -, - . . . ..”!1. ,,,.!. -.. -
. ..”..-
. & .--e ..!. ..+” IA. 1. .l.”..d+, -..6”. @ -1.., * . . ..44..
. ,----- -d . 1.! 4 . . .
,, “
—,19
—
,,
,7
t!I
l""'""'""l-"-"--"l-------l-------l=:2====leeeR
aeel
11
,,11
1
$@
.1-
/
MU
LTIP
LE
TIG
HT
EN
ED
22

M3A
3ID-105E
MU
LTIP
LE
TIG
HT
EN
ED
23
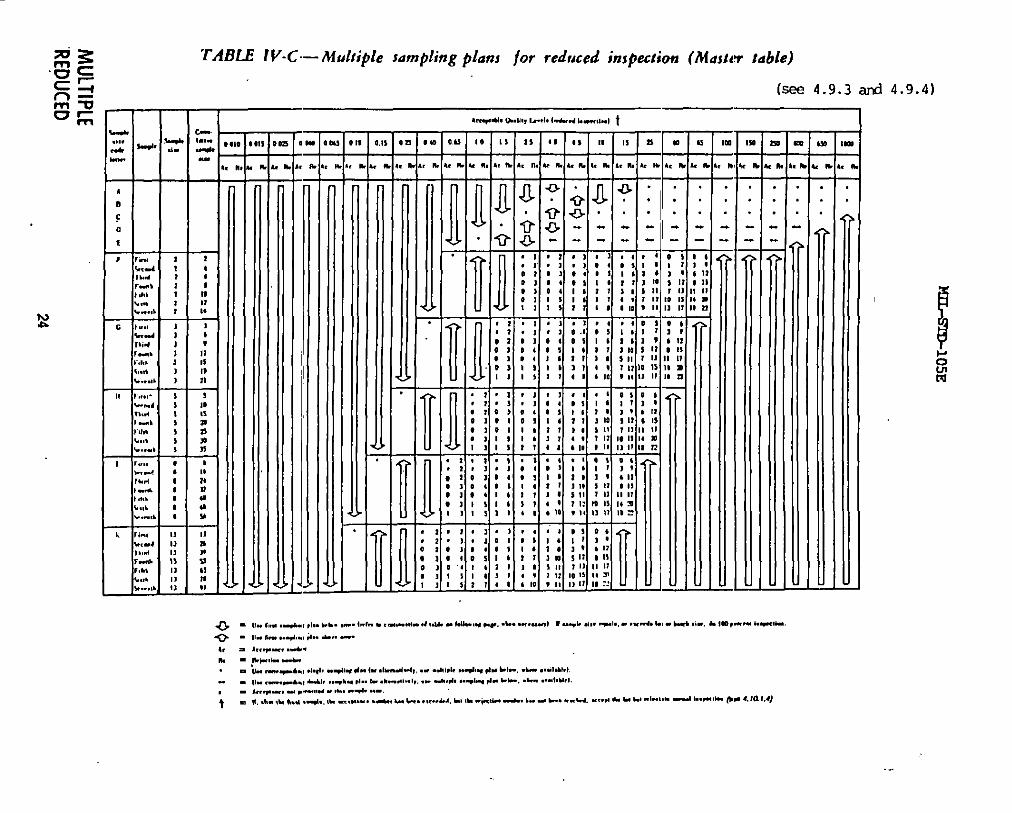
m
MU
LTIP
LE
“R
ED
UC
ED
24
#,”m
n#
ln
c)@
.,.l.
*
11
(1
:::2:::~
..-.==C=
..==
=~
fj
,--.
..-.==~
--------
-.-s=::
-..-.=
2C
:..:=
=~
~
.-”-----
.“..=
::-----
s=
(1
-.”.
..
..~---s:=:
---=2==--ce=
aa
..
-”----------
.-..=
=:
-----3s
.-”----
-..--.
..s
-.-~:g:
.-
.=:==
...-””-
----------------
.--.--=
:
---------------
-..---.=
---=-r.----
..
6---”.-
e-””-
.e
-””--.-
””,,.-.
..
..
..
.--------
-------------.
*
...e.--
..
e---”.e
e.”-.
.0-..”..
..
..
..
..
..
..
...-
..
..
..
..
..
..
...-
..eeoe
-.------
..
0----
..--..”-
-:::::::
::::::::::::::
..
..
..
.“..---..-
-~
-------.--*---
.“..”.”.
~~
-------
MU
LTIP
LE
RE
DU
CE
D25

MLL-STD-ICISE
1I
II
II
j{-m
uO
wk
ur-
Xaa!
Zn.
oa
I
26
MIA
3IW
105E
II
1
-..
-.is
:..
:::
:--”I
I
II
.
14°I---1-’”
1=44U
sgilg
I.
II
II
I1
+t]
I--V
I”--Ie=
-ltia=l=
-ol‘-
I
.
AO
QL
TIG
HT
EN
ED

TABLE VI-A — Limiting Quality (in@rcent dejectiue) /or which Pa =Zz 10 Percent~~ (jor Normal Inspection, Single sampling) .
>M (see 4.11)
!s
—
0.01—
0,29
—
—
0,02
—
).46
.20
—
—
0.04
—
0.73
—
0.31
.
D.27
—
—
0.06
—
I .2
1.49
1.43
.33
—
—
0,1(—
1,8
0.78
0,67
D,53
—
).46
—
Acceptable Qu.lity Level
-n
R=! code Sample< 1=,,,, .i.~ -
m 0.010
A 2
D 3
c 5
D 8
E 13
F 20
G 32
II 50
J 80
K 125
L 21m
w 315
x 500
1’ m
1) I250 0.18
II 2000
—
0.15—
2.0
—
1.2
—
1.1
3.84
).74
—
),59
—
—
0.2—
4,5
2.0
1.7
—
I .3
1.2
0.94
—
2.77
—
0,40 0.65 1.0 ]. :
25
16
11
6.9 12
7.6 10
4.8 6.5 0.2
3.1 4.3 5.4 7.4
2,7 3.3 4.6 5.9
2.1 2,9 3.7 4.9
1.9 2,4 3,1 4,0
1.5 1.9 2,5 3.5
1.2 1.6 2.3
1.0 1.4
—
6.:
—
68
41
36
30
—
27
22
19
—
16
14
—
r
10
—
58
—
54
44
42
—
34
29
24—
23
—
l.. . .
..
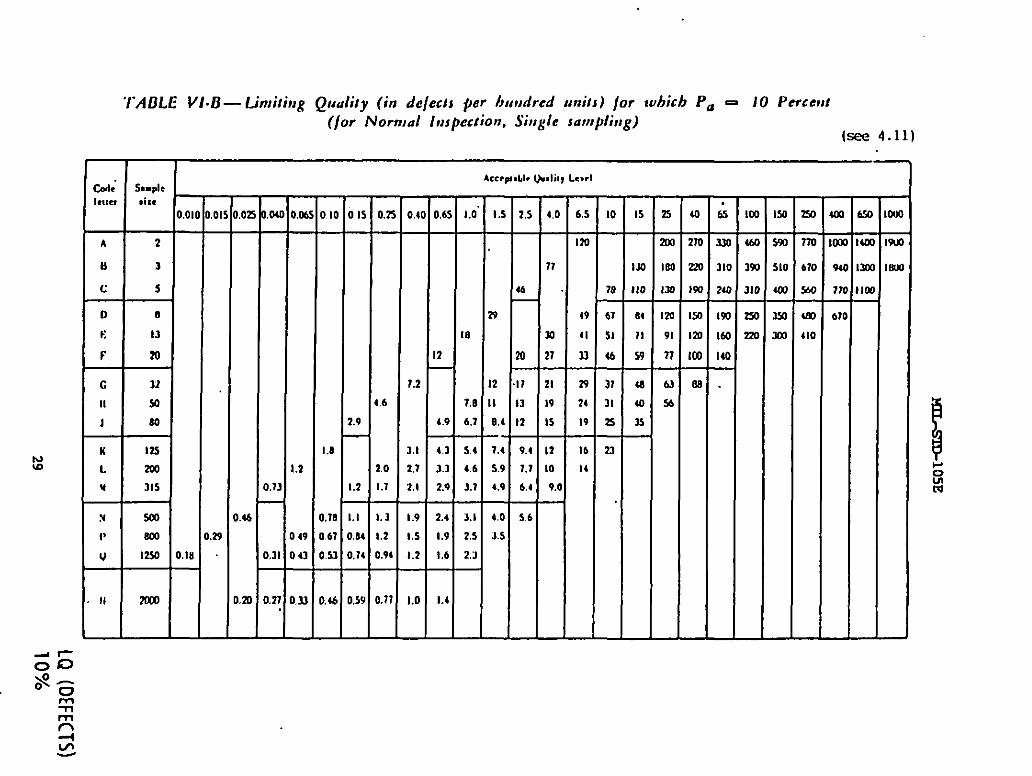
TAL?LE VI-B — Limitiog Qmdity (in de/ec:$ per hudred units) /or which Pa = 10 Percen:
(Ior Nom,al inspection, Single farupling)(=X 4.11)
CA ~+1,,,” al,,
0.01
A 2
II 3
c 5
0 0
E 13
F 20
c 32
II 50
J 20
K In
L mil
u 315
!i 503
1, 203
u 1250 0 .18
II m
,02
,A6
m
m
7,,
,3
,1
,W
2
49
43—
23
1:
,9
,2
I
b
1!
s!
m
6
,0
.7—
,3
,2
,94—
,11
—
04
1.2
1,1
2,7
2,I
I ,9
I ,5
1,2—
1.0
D,6
12—
4.,—
4,:
3.:
2)
2.,
I.!
1,1—
1. (
—
4mpIAJ. wI;I, Led
—
1.0’—
18
1,0
6,1—
54
4,6
3,1—
3,1
2,5
2,3—
J
I .5 2,5 4,0 6,5
Im
71
46
2? 49
m 11
m 21 33
12 11 2i ‘2?
II 13 N 24
8,4 12 Is 19
7,4 9,4 12 16
5.9 7.1 10 14
4.9 6,4 9,0
6,0 S,6
3.s
10
78
67
51
46
31
31
25
n
—
15
—
120
’10—
84
71
59—
68
40
35—
—
—
25
E
la
13(—
12(
91
71
h!
St
6
i
1
?
1,
1(
1(
la
i
3%
311
2s
22(
,60
~
m
lol—
w
m
w
ii
61(
w
la
tic
u
i
94
v
61
Et
ii
30
I@—
m
zIkax
—
11-0Inm
vi

TABLE VII-A — Limiiing Quality (in percent defecii.e) for which Pa =. s Percetatgs (for Normal Inspection, Single s~mpling)
$; (see 4.11)
.0
cede S.mple
letter qi ze
A 2
B 3
c 5
D 8
E 13
F 20
G 32
H 50
J 80
K 125
L 200
M 315
N 500
P 800
v 1250
R 2000
—
0.01(
—
—
). 24—
—
—
0.01
—
.38
—
—
0.02
—
,60
,24
—
—
0.04(
—
).%
—
). 38—
1.32
—
—
0.06
—
.5
.59
.50—
.39
—
Acceptable Quality Level
—
0.10
—
!. 4
.%
. 79
.62—
.53
—
0.15
—
3.7
—
1.s
1.3
).97
).84
).66
—
0.25
—
5.8
2.4
2.0—
1.6
1.3
[.1—
1.05
—
—
0.4(
—
&9
1.8
1.2
2.5
—
2.1
1.6
1.4—
.1
—
0.65 1.0
21
14
9.1
5.8 7.7
5.0 , 6.2
3.9 5.3
3.3 4.2
2.6 3.4
2.1 2.7
1.0 2.4
1.5
—
I .5
—
31
14
12
9,4
—
8.4
6.6
5.4
—
4.4
3.8
—
—
2,5
—
45
—
22—
18
15
13
—
11
8.5
7.0—
6.1
—
—
4.0
63
32
28
23
2G
16
14
11
9.6
.
—
6.5
7B
41
41
34
30
2s
20
18
15
—
10
—
66
—
60
50
46
—
37
32
26
—
24
—

TABLE VII-B — Limiting Quality (in da/cc/s Per hundred unifs) /or which Pa = .5 Percent
(/or Norn,til Inspection, Single smttpling) -
(SC!? 4.11)
Gdo so.+
1,11,1 ,!tl
A 2
B 3
c s
o 8
E 13
F m
G 32
n w
I m
~ Ii In
L 200
u 31s
N m
P 6m
Q I=
t, m
ml-
s~
g
-n
n
,01
,24
01!
, J6
—
m
‘.C4
,.2(
—
26
—
,s
39
SO
—
.39
—
,11
,4
v,.
,7
,6
s
).1!
1,0
.2
.3
.91
.64
,63
—
).2
5.0
1.4
Lo
1.6
1.3
1.1—
SE
—
Accqltabh IJdil, IA*,I
—
0.41—
9.1
3.0
1.2
2.s—
!.1
1.6
1.4—
1.1
—
).6
Is
i .9
i.O
!,9
1.3—
L6
!.1
1.0
1.5
1.1
22
9:
7.!
h
s:
4,:
3.4
2.1
Z4
—
15 2.s 4.0 63
MO
Im
a
24 E9
31 42
24 32 29
U 20 24 23
13 16 21 26
9.1 13 16 21
6A 11 It la
&6 8.s II 15
5,4 7.0 9.6
6.4 61
3.8
10
$5
?3
m
E2
41
36
27
—
24
—
6s
—
WI
%0
10
—
2J0
170
, s0—
—
—
m—
m
w
340
—
270
220
—
1s
m
w
64(—
m
IIc
—
‘5
05
n
61(
—
w
4417worn
tm m
ml 140
010 110
rlo
1
Im
—
Ku
Im
—
iw
E

II
Ial...
......
.--I’---
I==I
I:1
..
.‘...
....
..
“..-1--1
-A=-
lIMIT
NU
MB
ER
S32
..
..
..
..
..
..--
m

MXIAID-105E
.:+
33A
VE
RA
GE
SA
MP
LES
IZE
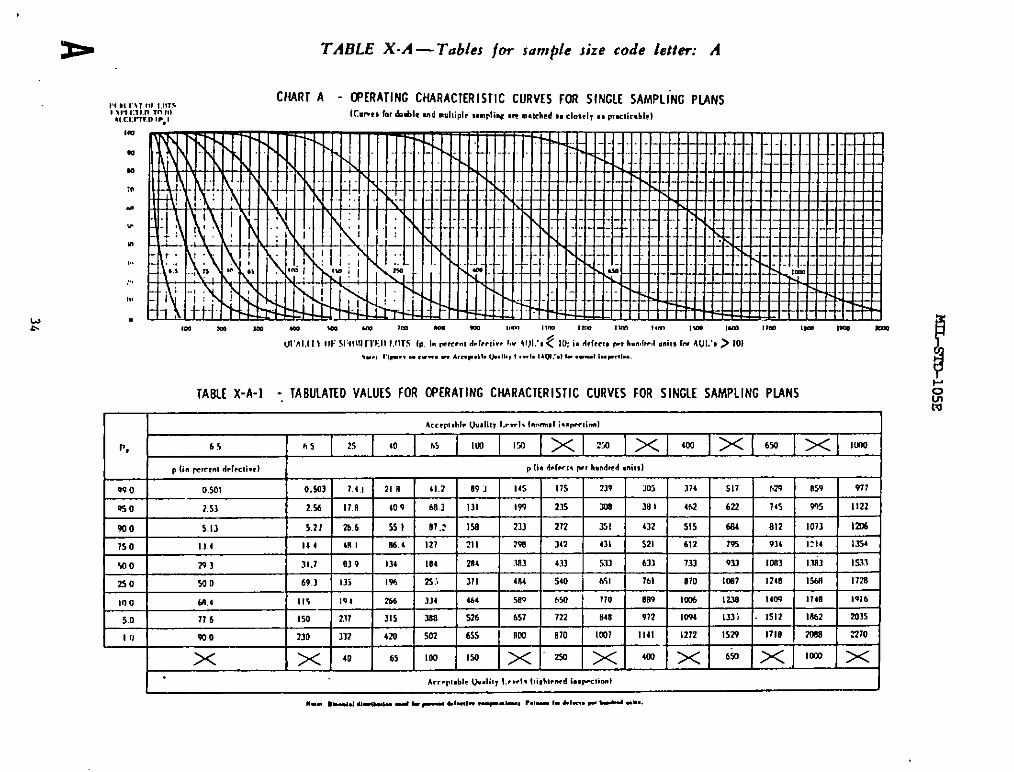
3=- TABLE X-A — Tables jot- samp!e size code letter: A
CNART A - CPERATINC CNARACTIRISTIC CURV[S FOR SINGLE SAMPLiNC PLANSW * t ,,101 1.07s, ,,, (,,,,” m ,,, ICn”e. 1., &&.le -d ..ltipl, S..plinK .- ..trhed . . .l..d, . . prwtiir.blp),K,:,-rr.n 1,.,
om
.
.
:“
.,
.
10
,..
.. .
!!!
.
ul’hl.l I ) 111:S11!,11WF.11LIITS b h I-I-.1 d.ki;v. f,. W.’,< 10: i. d?frm V, h..,rw,l ..it. k. W;. > 10),.., I, F.. -...,. “, 4,”.,,!. 0..!,!, ! . ..!. !La; ., 1. .-1 ,.. P-,..,
TABL[ X-A-1 -, TABULATIO VALU[S FOR WERATING CNARACTIRISTIC CURWS FOR SINGLE SAMPLING PLANS
au” I “ w, I 0.!431 1.4, I 21n I 41.2 I 091 I 16 I 175 I 23! I 305 I 174 I 517 I 629 I 859 I 977 I;; I ;.;. 1 , , , ,
2.% 17,0 I 409 a.] 111 I 199 I 2.s I 202 I 18 I I 462 w I 715 I 995 I 1121
cm” I 511 15.2, 12L61551107., I1M 121112121 MI14121S151W] 812t1071ilZdl.- - . . ,7s 0 1).1 184 WI ML 121 ?1I ?9U 342 431 521 61’2 7% 914 1?14 1154
-1oo 291 31.1 019 134 188 284 .J83 Km 512 631 131 -+22 1081 I.ti] 15-13
250 S&o 69.2 Ili 196 22: 31I 184 540 6’,1 161 870 ID27 1218 Iwu 1128
Ill 0 ma 115 !Q1
5.0 116 150 2.17 31s 288 526 657 722 848I
972 !w1 133; 1512 1.!42 ‘2015
1 II W,o 210 112 a 502 6$s m B70 [OX I 1141 I 1272 I 1S29 I 1710 I m I ?270
x ~ 40 65 Iw 120 x “~ ~14mlX]6ml~l’W]~l
! I 1 1 Ii
1“ A.r?,,.bk U“.liq l....!. hi,!+..<d im.I”clknlI
“.” ,-., *-. A b - .1...1 .-.-, r.!..- 1..1.”. ?. *+ .I-.
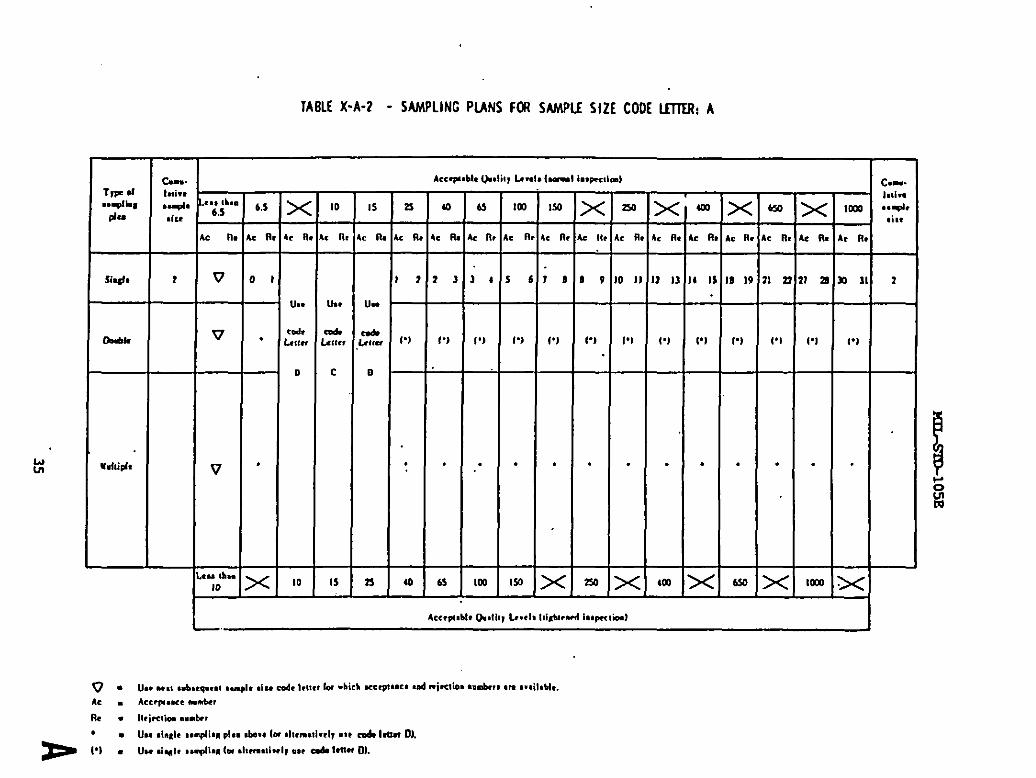
TABLE X-A-2 - SAMPLING PIANS F@ SAMPLE SIZE COOE I.MW A
L.JLn
v=
Aeqi.bl. l)dil, b“ls (-l Imvelml
.,, ,4,.6,S
,,s x ,, ,5 % 40 6s ,00 ,50x “ x “ x - x 1020
c n. kc R, 4, W A. R. A. R. k % k lb k R. A. II. k R. AC It, Ac R. A, R, SCR4 A. II. A. R, k Il. AC R
v 01 ) 2 23 34 s 6 7B 09 10 II 12 13 11 Is In 19 21 n 21 Ss YJl
u.. lb u-
V . ‘i’ * ~ ,.)I.W” lam ,&itCi I.) I,) t.) {0) l.) (.1 (.) l,) P) 1.1 W (.1
D c n
v ‘. . . . , . . . . . . . .
‘:;b- ~ 10 Is B 40 As ,00 1ss x m ~ 6m x 6s0 ~ lox ~
At,q!.bl. lj,.th, bet. I,isbt.ud I.tpraim)—.
U.. .*.I osb*T.mI ,9.+, d- cd, I.ucf la .hicb UCCW*C* ●E4 -i-t :.. ●mbw I m 9.JUM..kc+.,., en.ba
Neirc t .m. ..t . t
u.,.i””le,*wlil”PI*.&a.*(-91trm*11. cl, .1* KS&I* U.
u“ +1. M@.” (0( .IWM.11..I, .,, 4 l.twf 0).
c.” .l.ti... . +.it*
2
—

TABLE X-B — Tobles fox jutnple size code [et$er: B
TABLI X-E-I - lABULA1[D VALUES FOR CHRATING CNARACTIRISTIC CURWS fOR SINCII SAMPLING PL4NS
I 4CCWUW Ondit, L-d. (.-.1 I. OFIIO.)
r. 4,0I
4.0 15I
7340 G ,m]~],w.]~]solxlalx 16YJ]XIICOI
p(1. pmw.t *fccll.d p (1. &lPC,, pa b.”ti -Il.)
9?.0 0,134 0,135 a,vl 14.s ‘37,4 S9.5 %,9 117 159 203 24? 14s .419zyxwvutsrqponmlkjihgfedcbaZYXWVUTSRQPONMLKJIHGFEDCBA51? 65 I 941 1027
%,0 1.70 l.?! 11.B 27.3 45,3 87.! 133 1s7 m m m 41s W W la Iw I 1s2
$00 1.6 1.51 17.1 X.7 9,2 Im 13s 181 231 m 3U 64 541 116 m 1131 1222
750 9.14 9.59 12.0 s1.6 8&5 141 19? 223 ml 347 4m m ~ ~ W3 1249 1344
%0 m.6 ‘m 1 5?9 w 1 In !89 m 209. 3% 422 W 622 ml m Ion 1!49 Im
’350 310 43,2 09,0 131 170 247 123 Ml W W ma 124 832 1M5 1152 13.W 1644
10.0 9.6 76.3 I ,30 171 221 m 192 4U 511 593 67I an 939 116S 1211 Mm Ilw
so al W.* 133 210 356 3$4 4s3 dnl %3 w 130 m 1~ 1241 I 356 1113 In%
1,0 18.5 151 nl m 115 437 $33 3.30 611 161 64 1019 Ills 1392 1s13 19$1 ‘3069
6,5 6,s % 10 6S 100 x 1= x = x 4W ~ ml ~ IKO ~
I Acc.pt.ble O..li$y 1..?.1. I!irh!..rd i.,?= li=mlI
,“., ,,-,. ,,...!,.!.. A ,. p... . . .. . ... . .-.I...4 ,.- b tik” 1.. .--.4 ..!!..
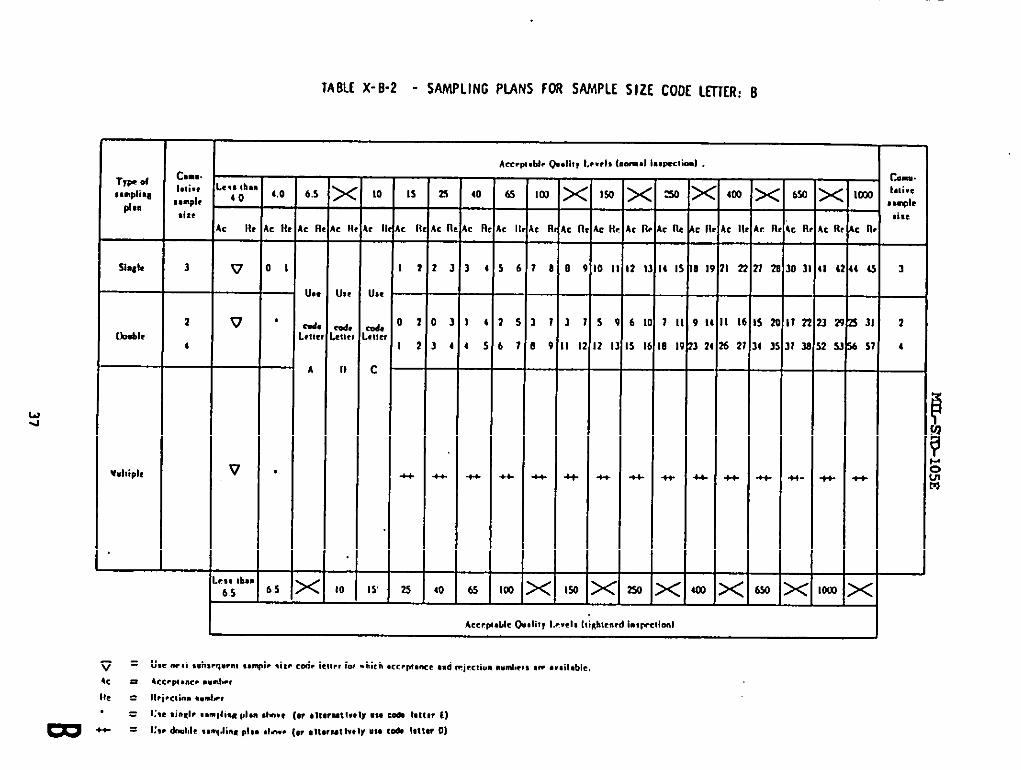
TAEL[ X- 6-2 - SAMPLING PIANS FOR SAMPL[ SIZE COO[ LESTER: B
Cm.m.I.*i.*
,Ssipt,
*i tt
3
r.m..
I.ti.e
s .d,
d,,
1
2
4
Twe d
*.mpli.~
d, .
m,!,
WI,
Wtiole
10
,
u.!
d,,,,,
c
—
Is—
—
6s—
K I—
5f
—
1:
51
—
+6
—
Im—
—
1$4
—
kc Il.
—
2—(c II(—
18 19
—,<., ,h,
40 6s Is 2s—
Ac I—
2
—
o
>
—
++
—
40—
40 ml
—
k I—
H :
—
11 I
52
—
++
2
lax—
,. n—
141!
,. n—
v
k rc 1{—
cm—
u,,
cd.,,,
A
c1 c1 L. n—
3
—
I
t;
—
++
—
65—
1 B 10 I
—
s
21
1? \
v
—
v
.
—
.
3
II
61
Is I
7 II
8 19
—
*
z—
9 1’
!3 ‘2
—
++
—
4m—
52
,4 1
—
+
—
bso
11 2
113
—
+!-
:
23:
52!
—
*
—
loco
cd.?!1,
1) —
* 4+-
—
1s4—
.++
z—
+!-
—
2s0
*
L- —,,, lb
6.S <,,5 to 25—
.
.
.=.
kc. p,.mc. ..”!-,
11.i.., i.. ..rd~t
t:,, .i.ql. ,.”,di.” ,,l.. ,1”,, (“ ,It,,”,l,,ly ,** W 1,11,, [)
1;9. drd,l. ..n.+4i.n pi,. .I.w. {W .It.rwt W*1V .,. C& !.ttw 0)

wal
TABLE X-C— Tables for sample ~ize code letter: C
CHART C - CFERATING CMRACTERISTIC CURVES FOR SINGLE SAMPLING PLANS
(Cur.c. f.r .bsblc ..d .dt!ple . ..plln~. = nmitbed.. cl.=!, ., prmlddd
E;C$W%-W?Caccllr 0, L(7TS
&cctnl.n (?.,Cxrt:clm m atAcCWTCO(P.!
lm m
. w
la 00
. m
. .
“ .
. .
m m
m m
,. ,.
0 .. 0C8, wlm?slm ,mIcOtm. a WIM!MDC4 aa,nnl,mlza
UUALITY OF Slillulnm LoTS (p, i. WW<.I d.ktl.c t- AfJL’. < IO; 1. d+.!, w. b-d ..il. (c. AOL’. >101“..., ,,I-.. “ . . . . . A...,! *,.,*,,,, L...!. ,.(XW l., ..-., .. . . . ... . .
TABLE X-C-1 - IABULATEO VALUES FCfl CPERATING CNARACSERISTIC CURVES FC$I SINGLE SAMPLING PLANS
I Aec.po.b!elJ..li(T l.., d.4.c... I i.m.. !iwl 1
p. 2,3 InzyxwvutsrqponmlkjihgfedcbaZYXWVUTSRQPONMLKJIHGFEDCBA2.5 10 15 5 40 +.5 ]~11.lx]lsolx]zwl~]wo Ixlwa
P (i” P?me.1 dri..,~wl p (i. Mt.,. Fr kdfd ..il. )
-“ “ all 1.71 0.301 I ?.91 I 0.72I 16.5I 31.5 I 50,I I 70,1 I 95.4 I 12211301 ZN ISI I 343 391 w I 618. ... . .. ---- , .
93.0 I !.02 I 1,64 I .OJ 1.11 164 21.3 S2,3 I T%6 9J.V In 1$4 165 249 m ]V6 449 639 671
W,o 2.W 11.2 I ?,11 10.6 22.0 X.9 610 93,1 ICV 110 17J m 27J 15 !39 482 619 I 111
I x. . . . I ,0, I ,.,, I 10, I .21.5 I W.7 I B,., I 119 I IJ1 [1721 ~S1245111E[3141M5 15(2174916061,,.. . .. . ..- ---- .. ’-
50.0 12,9 3t.4 IJ.9 33,6 51.3 73.4 111 1s1 171 213 m 293 373 W 553 6!1 &33 aw
8.0 24.2 456 21.7 51.9 70.4 !02 148 1V4 216 ml 304 348 i33 W
10.0
621 691 97.2 $~
26.9 5L.4 16, I n,a 106 IJ6 183 235 263 309 3% 401 4% 244 649 7.56 1010 1076
I S.o w I 65.7 S9.9 94,9 1% 1s5 210 263 26$ J- 38V m $34 KS 745 B!4 1064 1131
1,0 60.2 77.0 92.I I 1 , 144 201 262 ]m w 103 4s, m 612 601 63s W 1171 1261
,,, ~ ,,0 ,$ a 40 ~ x IW x 1~ x m x ~ x ~ x“

Tp d
●#u
d-
SJ*
D4J.
U.dtid.
3
6
—
—
TARlf X-C-2 - SAMPLING PLANS FOR SAMP1.f SIZE COD[ lfTTIR: C
v
—
v
Ktbs.
AR_
M—
d
I
—
.
—
.
—
4.0
—
z—id
1“
.*“m
E
—
6,3—
—
6,S—
d
b
maat.
0
—
10—
—
25—
$-l
I
—
1
I
—
++
—
60
—
—
60—
LB
!6
—
‘5
il
—
*
—
65—
G—LE
8!
—
11
I 11
—
+’+
—
Im
—
—
mm—
U-@l
o II
—
59
2 13
—
+
z—
%—
k-l!
12 12
—
6 1(
Is 1(
—
*
—
E4
—
—
x—
S-E
1 1,
—
I 1{
la
—
4+
—
50
—
—
ma
—
&t
12
—
I 1(
$2
—
+$.
G—
z—
in!
I 42
—
313
2SI
—
+
—
w
—
—
—
s-e
u“
Al
n
—
—
u“ “u .&..*ti .U@t. d“ ,049 t,.., k4 -k, WCeptar. ,,+ “j..,lm e,, u, . ..lld..
kc, @ .** m.
N-i.. . . . ..
Uu aid, ●npll* d.. a.. (or ,It,?m, ho,y .“ <d ,,,,” {}
VW 4044. 0..t6lt6 PIO. It-. (w *ltwmt Iv*IY LIM c8dI Iattw 0]
d“
.
—
—

TABLE X-D — Tables for sample size code letter: D
CNART D - OPERATINC CNARACIERISTIC cuRws FGR slNcLE 5AMFILING’ PLANS
ICsme. l. , d-Lie .sd _.ltipl. .qli.c .“ ~dc6cd . . .l.selr u pmctlmbld
P.”CC”T 0, LOTS.X PKTUIm w “Ccl,”l. ,,.,
m
.
.
m
.
I@
.
.
❑
,,
.I.im,ma imtco,ca
1JWLIT% OF SUBW7TED LOTS (P, i. win,., dclcc!iw la AQL’. <10 In dekt. pm h.nA’ed .-it. k AOL’. > IO)
“.., n- “ — . . A-F. M. a..!!!, 1.”!. Imt’.l 1. .-1 1-!...
TABLE X-O-1 - TABUMTEO VALUES FOR C+’ERATINC CNARACCERISTIC CURVES FCX7 SINGLE SAMPLING PUNS
hm-plk @. litvIx.rl. (-l !.sr.xti.ml
2’, ‘“5 6’5 ‘01,5 65 10
I15 35
I40 ]~1651x] ,mlx],.l~lis0]x]6m
p (1. perm.t dcfec, i.d p lia dtlccts P, 6.u.d~d onhd
9?.0 0.126 1,91I 6,06 O.l,d 1,2.5 665 10,2
I22,3
Ix.] U.o 59.6 16,2 91,2 123
I151
I21s W 353 w
95,0 0.639 -~ 11.1 0,541 ~~~ 102 11.1 32,7 49,8 sa.7 71.1I
96.1 116 Is 186 249 221 399 432
50.0 1.31 6.22 , . , ---- )1 4?4 a1 I r I ,
1s,0 3,s 12.1 22, I ].m 12.0 21.6 31,1 52.1 74.5 8s.s 108 1s IS 193 234 303 339 w 206
..A. . .. . ---- ---- --- 1]
=.0 I 5.9
521 554
2m3 43.3 11.1 U,7 49,0 d3.9 %9 121 135 163 193 ?11 272 312 391 U2 577 611
100 25,0 4116 51.8 =,6 486 w., n5.5 116 147 162 !93 m 252 339 W 631 419 ml 612
5,0 31.2 41,1 54.0 31,4 59.3 10,7 W,9 111 164 184 212 Ml 2N 114 378 us m 655 707
I ,0 13,8 59.0 70:1 57.6 610 105 126 Iu m ?18 2s2 263 llB m 6i9 522 M 712 776
2,5 10 x 2.5 ,0 15 25 . x 6 x ID3 x ,30 x 7s2 x 033 x
I ,, 7 I ,“,> I 665 i ,1,8 I 21,0 I 39.6 i 3.2 I 67.9 I 07.8 I KM I In I 171 i 201 I 166 I X
m.. ,.m, 1,,, ””1 ,641,,.0 12J6 I (s.91 70.91 $5.911m 1 [13 1154 1122 I 233 I 171 I 366 I 1!
I 4CWI.2.IC (MM Le.tl, [iig+m=d I.v.xlim ] 1
I
mJb5.
M.lllpl.
TA811 X-O-2 - SMPLING PLANS FOR SMW.E SIZE CODE I.EIW.R: D
—
c-.M....+
.i”
.8
s
10
—
1
4
6
0
10
12
14
—,“ ,* ,
M
—
v
v
—
v
,,, lb
2,s
—
1.5
—
:n
—
—
.
—
.
—
2s
—
!,5
—
:0
1..
M,,,(
c
ti
<
!14
JO*
,m,,,(
f
1,0
Att+.bl. @.lity La..l. (-l i..~clirnl
8.0. 6.s 10 Is n
, n. A, R. 4. h A. fl. A. R.
12 23 14 56
h
& 02 03 14 2s“t”
12 34 45 61
e
.2 ,2 -3 .4
.2 03 03 Is
02 01 14 ?6
01 14 2s J1
13 14 36 58
13 J5 46 19
11 15 61 9 10
b,5 to Is n M
k.pt.bl, 0-1;,, I.r..h Iliabl-rd i.w-cdd
U. . ..! ..bs.w..l .0.91..1.. Cdc 1.!1.. 1- +k~ .-t P -.* -4 “1.c!;m““b.- .“ . ..il.hl..
Accvl.mce *,
U.. ti.’lt ..wllq tin. *ta.c (w altmmt I**V U*. cti letter C)
kc.pt.ut m Fndtt*d .0 tbi* ..+. *in*.
—
cm, .I.ni...H,l.
.iti
e
,Pw
TABLE X-E — T~bles for sample ~ize code [etter: E
CHART [ - CPIRATINC CNARACTER ISTIC CURVES FOR SINGL[ SAMPLING PIANS,?#rr\l !!!’, ” , ,twbro,, ,mwo IC.,.,, k ,h.bl. .nd wlti,,lr mqll.” .- ..,cbed ,, .16,+ ., p,.., ic,bl.)
,!,, !’,,,,,,.,
,A’J LtTV W StWITTEli LOTS (P, i. r.~,m ,4?1?<1!.. h AW.S.< ID: h d. f..,. r.r km.++ -1,. I- A13L’, >101“.., ,Ia... “ ,-... -, ,-.,4,. Lb.!,,, ,,...,. ,,lJ_,., b —, ,.q..,l,..
TAB1[X-[-l- TABULAIID VALUES FWl CfERATINC CHARACTERISTIC CURVES, FOR SINGLE SAMPLING PIANS
111( 1! 11111Ammt,bl, &,Ii,, Le.,1, (-.1 I.,w,Io.)
r, 1.0 4.0 6.5 10 1,0 4,0 6,5 10 IS a 1~1 io 1~1 . l~[,m lx] ,wl~l 250
I , G. F.r,.s d. fcctl..l o (i, dcfec!. F, h.”drwl unit.1
*,O 0.U77 1,11 1,s0! 6.13 0.0111 1.1s I 3.2s 6.33 13.7
I ‘2’2,4 27.0 I36.1 46.9 51.s 1%6 96,7
IlJ1 1S’2
I219 Z2s I
,.,
I
1.S ] $22 I 12,9 [ 20.6 I 20.2 I 4].6 I S9,0 I 667 I E2.1 I w,, I 111 I 144 I ,4, I 213 I ‘L16 I .121 I 344 I
930 0.294 2..91. 6,64 11,1 0.395 2.73 6,29 I 0.5 20. I 10,6 26, I (7.s 5V,2 71.1 92.7 11s I 51 I 73
Wo 0,8U2 4.11 0,130 14,2 0,810 4,09 0,40 11,4 24.2
246 1s6
15,s 4!,8 54.0 64,2 19.2 116 123 16s 16 261 2a2
75.0 2,19 1.{1 13,6 I 9,9 t.tl 7.19 13,3 19.5 32.5 45,0 52,6 66.3 80,2 94. } 122 144 887 2X m 110
30.0 $19 12.6 Z9.o n, I ,
2s.0 10.1 19.4 2%0 26,1 10.7 20.1 YJ.1 I 39,3 57.1 ?4.s r12.1 lm 1Ill )34 167 I192 2* I 2s6 3ss 379
10.0 )6,2 16,B %,0 48.4 17,1 29.9 40,9 51.4 71.3 SQ.5 Im 119 137 I 1ss I’m 217 I 2691 m13Rs 1414
so m,6 31,6 41.0 49,5 22.0 16.S 4s1 I so. M19 101 Ill 110
I ,0 29,8 41,3 %,6 5s.1 2s.4 $1.11 1 1 I I I I I I I 1 1 1
1.5 6,2 10 x Is 6.$ ,01 ,51,, 1~1 40 1=]6$ t~]120/~1 lsO/~]2W]~
! 1 1. 1 I Isa Isa m 232 2ss 313 40? 43s
64.1 71.3 1101 1123 113s !55 I 116 I 196 I 2SS I 264 I 121 I 349 I LSO ] 471 I
1 , 1 1 . . 1 I . . 1zyxwvutsrqponmlkjihgfedcbaZYXWVUTSRQPONMLKJIHGFEDCBA1 .
kc.p.bl, Ou.m, 1,.,1, (,;,hl.mrd I“,r.rr, k.)I

:-.I*I”
●1”
—
13
1
16
—
>
6
9
12
1$
10
n
.
!.
TABLEX-E-2- SAMPLING PUNS FM SAMPLE SIZE CODC LEfTfR: E
v
—
v
G,bta
u-
—
I ,0
—
f—
—
.
—
.
—
1.s—
—
M
—
R—
J“
a
D
2—
—
x—,P—
u“
+“m
(i
—
‘3,s—
4m.#1. C9dll, k“!, (UmI kink.)
M 4.0 6.6 10 Is = x ax 65 x lm ~ 130 ~ m ~
, Rl Acfh M R. AS5k k n, AC n$ AC n. At w AC 5196C n, A, fft AC fk ACk A. n, Ac * AC R. tin
I 1 23 14 S6 78 09 10 1! 11 13 14 Is 10 l! 21 ‘u 373A 10 al (1 u 6663 b
b
,* 01 01 I 4 15 31 31 S9 6 10 7 11 9 la II 16 s~ 11 a 27s a 11 .&
“t-)1 lb 1 5 61 89 II 11 It 13 15 1 !8 19 n 14 a 37 343s 17 36 S353 % s?
*
, ! ● Z ● 1 .4 04 04 05 06 11 1 8 1* 3 10 4 12 6 IS 6 16 a
. 1 03 0 3 1s 16 21 36 J* 4 10 6 12 1 14 10 11 11 19 lb 3s 11 37
0 ? 03 1 4 26 Jo 49 6 10 T 11 I 13 II 11 13 19 11 14 19 ?f 7636 2?59
01 14 2 5 37 s 10 6 II 8 II 10 M II 17 1$ 32 19 s 24 II 7736 17 66 60 49
13 14 3 6 S8 J II 9 12 II Is 11 1111 m i5 a 827 3331zyxwvutsrqponmlkjihgfedcbaZYXWVUTSRQPONMLKJIHGFEDCBAId 40 (9 55 $3s
13 15 46 19 10 11 11 14 N l? m a 21 25 n s 11n 496165 47 61 bb td64
11 Is 67 9 10 11 14 14 15 la 19 n13 am 12 53 37s 6a 19 5354 nn 7773
4.0 6,5 10 1$ = x @ x ~ ~ Im x 1= ~ m x Wf30
ci - U“ .ti p
v-A. -lla -
—
c-
M.
w.lrl
—
13
—
1
16
—
3
6
9
11
15
18
3J
—

I +Q
TABLE X-F— Tabies jor s~mple size code letter: F
CHART F - OPERATING CHARACTERISTIC CURVES FLWI SINGL[ SAMPLING PLANSlT,cchl m mmmrmto TOOOK [(k... 3Mdad? .nd m.hiple .mpll,” .* .,,hed . . CI.=lt s. prm,ic.b!~),Cclr, ,..,,.0,
v!$,,.,Tv ,,!: WU\WrTF.t, !,,, rz l,, h ~,rm, &f,c,l.. k+ $uI: , < 10; 1. &l,,,, pm be.d,r,l ..,,, k A@’, > IO)
“.,, ,,..”, “ . . . . . . .. AC,w.,, C..,,,r ,.. ”,. ,Aw., ,- —, ,..P,,,”,
TABLE X-F-1 - lABULATID VALUES FOR &’[RATING CtLARACTIRISTIC CURVES FOR SINGLE SAMPLING PLANS
II A.c.,r,hl. ()”,l ;,, L,,.1, (.,m”.l In, m,;.n) I
Iv.
%
O.Owl 0,141
O.z% 1,70
0,327 2 M
1.41 481 E2,1.9 4.12
(W 6,23
5,51 8,12
o.M 12,7
I065 2s 10 6.S lU 0,65 2,5 4,0 65 10 ,5 1~123
I40 Ixjfi
pli. v=.., +1.cli.el *I,.,. p, hd,d .nh, )
w. 0 0,052? 0. 1s9 2,21 4.33 9.7s !4.5 17.5 23.9 30,s 37,6 S!,l 62.9
9s.0 0.2% 1,81 In 1,14 14,0 19.9 23,5 WE M.4 4&2 b2,2 14,5
5.10 OS5 2,69 5,44 901 16,6 ’273 21.2 3s, 1 43,2 51,3 M.4 01.2
75.0 1.41 481 8,70 128 21.6 2?.8 34.2 43,1 52.1 6! .1 79,5 93,1
143.1 5.3.3 5.2.3 73.3 91.1 Im
11.1 40.4 24,0 6$1 76.1 81,0 Im 122
41,4 1 52.9 65,0 71.o 22.9 108 124 141
1P (i”
s8.91
83.1
15,.9
21.1
E23.0
!0.0
34,R
41,5+
6.93 13,5
11.5 19.4 E19.6 25,5
26.6 31,3
B
5,0 13,9 21,6 2?,2 w.! !S 6 )s,0 23.7 11.5 ma 52,6 65.2 12,2 B4,6 97,2 Iw Ill 151
1.0 ~,6 ZJ9 3s,8 42.1 63.2 2.20 32.2 42,0 52.2 65.5 mo B7.O 101 114 127 1s3 I 72
1.0 4,0 6,2 10 x 1.0 4,0 6,3 10 15x ‘ x @ x ~ ~
I Ac..p.bl, Qb.liq !,.,4. hi”hmmd i.,pmird I

u.
Eullallm
aD
::--
F45
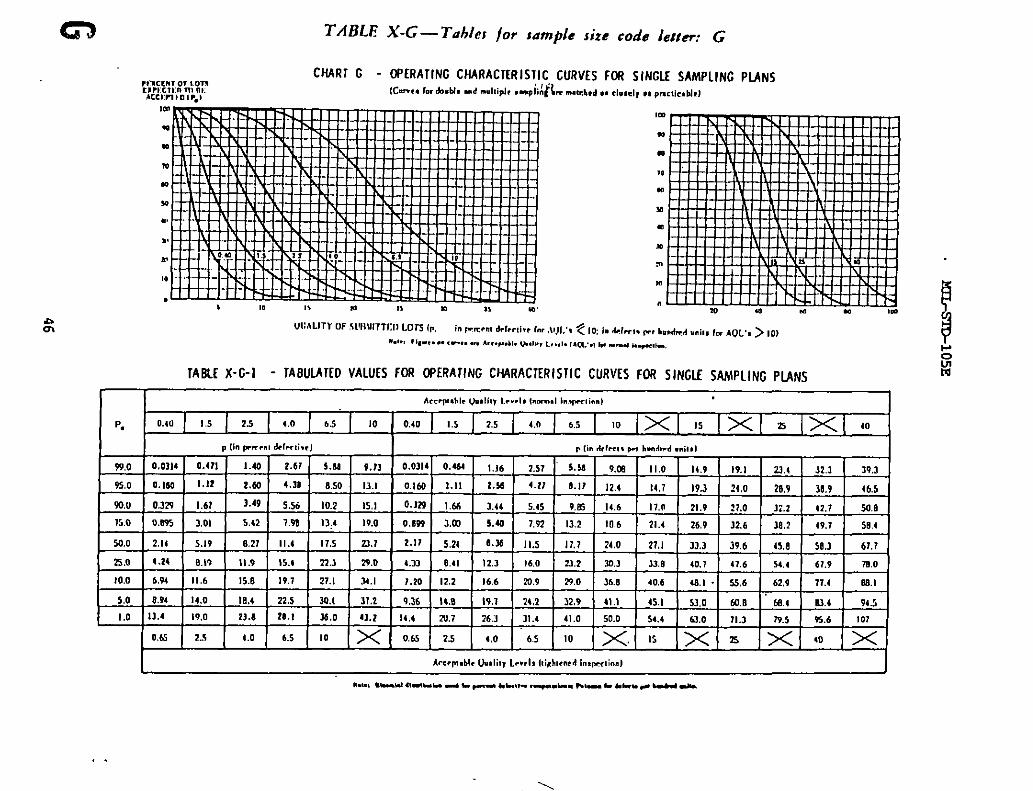
TABLE X-G — Toh[es /or sample size code letter: G
CNART c - oPIRATING CNARACT[R15TIC CuRv[5 Foff SINIW SAMPLING PLANSwacmr or tonCIPICTI.. m w,Cclrl, o,,.,
&ire m,,$.d ,..1.,,1,,, Pmc,l..2W(c.-.. 1.r A.M. ..d .Ultipl, .qi;~ :
UUALITY OF s1WWn611 1075 (,, in mm.., d.1.ril.? (“r .l!)l .,. t In 1. .i.ki. W, b..,kd ..i#. k. AOLb > 10)..,., ,’,.,. ..,-,.... .,!. *.W !+.,., L,.,,. ,, U..., b, . . . ,e,,”.
TABL[ X-C-1 - TABULAT[D VALUES foR ~ERATING C~RAc~RISTIC CURV[S FOR SINGLE SAMPLING PLANS
Acr.p#.hl. IJn.li, y L...l. (nm.1 I.,mn;..)
P. 0.40 I I,5 25 4.0 6.5 10 0.40 I .s I 2s 4.0I 6,5 I 10 lx] ,5 [xl 25 1~1 ,0
p (i” I.m..l M.rti.cl o (i. Akl. PI h“.kd .“;1.1
-,0 0,0114 0.471 1.60 1.61 9.s6 9.13 0,0314 0, 4s4 1.16 1,57 !.68 9,26 11.0 14.9 19.1 U.( 31.1 39,3
%,0 O,lf.a 1.12 l,a 4,38 8,S0 13.1 0.16.2 1.1! z.% 4.21 8.11 12,4 14,7 19.3 ?4,0 28,9 30.9 46,5
mu 0.2?7 1.67 3.49 5,56 10.2 15,1 0,129 I .M 3.44 5.45 9,05 14,6 17,0 21.9 17,0 1;.2 42,7 50.6
15,0 0S95 3.0) 5,42 7.9t )3:4 19.0 O,!w 3,20 S40 7.92 13.2 10,6 21.4 26,9 12.6 18,2 49,1 S8,4
50.0 2.14 5,19 8,27 11,4 11,5 23,7 2.11 5,2{ a.% 1Is 17.7 24.0 27,1 13,3 19.6 45,8 58,1 67,7
a.o 4.24 8.1! 11.9 15.$ 22.3 29.0 4.33 0,41 12.3 16,0 22.2 2s,3 13,8 40,7 47,6 54,6 61.9 no
)0.0 6,94 11,6 15.8 19.7 21,I 34.1 1,20 12,2 )6,6 m.9 2%0 36,8 40,6 48.1 . 3.S6 62,9 77.4 22.I
5,0 8.94 14,0 18,4 22.s 30.1 37.1 9.36 14.8 19.1 14,2 YZ9 41.1 4s.1 S3.O @2.B fa6 22.4 94.5
1.0 11,4 19,0 23.6 28.1 33,0 43.t 14,4 73,7 26,3 31.4 41.0 50.0 54.4 .S0 71.3 7V.5 95.6 I07
0.6! 2.5 4.0 6.5 10 x 0,65 2,5 ,,0 6.5 ,0 x, ,$ x . x ,, ~
,.
,\

1
:

TABLE X-H —Ta&les /or Sample size code letter: H
CHARI H - CHRATING CtMRACTER15TIC 131RVE5 FOR SINGLE 5AAIP11NLI PUN5,C, r. , . , o, I. rns, . , , . ,C* ,I! , I>,w {Cw.ts b double .d ❑),ipl. . ..+z.U .= ..t.b,d . . .l.ulr . . w.ctlc. bl.)AC.CP,,, ”! F.!
BI)tlA1.l TYoFsln Ml~Ell LOT2 (p, i. r.rrcr.t d$f.ctlwe (w AOL(. tlti in W.ct,wf h.mirtd ..it, (., 4UL’, > 10)
“.,, ,,”,. ”,”...” ,m.p.,,. m.l,,, t,” b,,a.,, b.-, ,..@,,,..,
TABLE X%l - lABUIATEO VALUES FOR OPfRATING CHARACTfRISTIC CURVES FOR SINCII SAMPLING PUNS
I I Ac..ptahl, 4)w.1197[.e.,1, (.urn.l i.$vctiwlI
I P. 10.25110 11.5 125 140 16.5 1X1 101- 1 1 1 1 1 1 1 . . I 1 1 I 1 I I I ,., ,- .,-- ,/
P (i. IWC..J d.1.r,ivrl
99.0 O.oml O,ml O.JM I .66 1,69 6,01 1,3& 10,1
%.0 0,103 0,J15 l.td 2,)8 5.36 5 2t 9.1? 12,9
500 0210 107 2,22 3,5J 6,41 9.54 112 14,5
75,0 0.574 1.92 1,46 5.10 0,51 12,0 138 11.s
$20 I.M 3.33 5.31 1,29 81.3 1$.2 17,2 21.2
so 2,73 5, m 1.69 10.0 1,.5 10.8 21.0 25.2
E100
so
Lo
4,50 1.56 10.J I2,9 17,2 22,4 24.1 29.1
5,82 9.14 12.1 14,6 19,9 24,7 2?,0 31.6
8,00 12.6 15.8 18.7 24.2 m. 2 31.7 361
0,40 1,3 2,3 4,0 6,5 ~ 10 ~
4,61 1.78 10.3 13,4 18.5 215 26.0 20.8 35.6 40.3 49..
5.W 9,49 12,6 155 21.0 %,2 m,9 33,$ 2a9 an 53! 60.5
9.21 13.2 16,8 ml 26.2 12.0 ?40 40,3 4$6 50.9 6).1 6A,1
0.40 1,5 2,5 40 63 ~ 10 ~ IS ~ 25 ~
9.5 1 s. t I
I A..ep.bl, w.l;tr l,..c Is (, IR+I..-I In,w.li.nlI
“.., ,,-., ,W,lt.,h . ..4..-,., ,,,..,,,. ,-. I..., ,.I.._ ,. ,,,., !. p ,..6.4 ..”..

TABLf X-H-2 - SAMPLING PLANS FCR SWLE SIZE CODE LEflER: H
II Am.@l. 0..!11, 1#.d. (-$1 I.opctb.) I c.”.
T,F= dr-. 11“1..
.mtAiq , C.qJa ‘s ““ on0.23
O,M x 065 1,0 1.$ 1,5 4,0#-
6,5 x ,0 x 1, x 2s !~ :;?
d 1.
Ach At m Ac II? AC nl AC n, k n. k II* kc n? he k he m AC R, 4. n, AC n, At He Ac lb AC m Ac n,
zi.~. Jo v 01 12 23 34 5 6 18 09 10 It 12 13 14 Is M 19 21 22 A w
u.. u.* u..
x v . * 02 01 14 1 s 37 17 59 6 10 7 It 9 11 II 16 A1% L?. IOlla
J2rba!c
6A 12 34 45 6 7 09 II 12 12 13 15 !6 18 19 n 2! 26n M
G K J
83 v . .2 .2 .1 . 4 06 o~ 0s 06 11 18 29 A u
26 . 2 01 01 I 5 16 21 38 39 6 10 6 12 7 14 16
J9 02 01 14 2 b 18 4 Q 6 10 1 12 n 13 II 17 13 IQ 29
*ltivl* 32 03 It 2s 1 7 s 10 6 II 8 13 10 15 12 1? 16 22 I* 25 $2
.65 II 24 16 s. n 1 II v 12 11 15 II 11 11 20 JJ23 SJ9 65
23 IJ 1$ 46 1 ‘A 10 12 12 14 14 !1 13 to 11 23 27- 31 11 78
91 2 J *S 61 9 10 t] 14 I* Is la 19 n ?2 2s.% J2 1) 17 38 91
... s lb”040
,,,0 x 0,6s 1.0 Is 25 do 65 x 10 ~ Is x a ~ “$’
Accrp.tk ti.lior L..el - ltimh,c.rd io.rminl

w0
TABLE X-] — Tab/es )or sample size code le!ter: ]
pg;:~rmmCNART J - OPERATING CNARACTER1511C CURVfS FOR SINGLE SAMPLING’ PIANS
Accwll.n, , . , (C.!... 1., dmM. -d ..lliple . ..pliq m ..t.hed .S .l.tcly . . p“.tlc. U.)
UU4LtTY OF SUBW’TF.D L07S 1P, 1. F.=..t dtlrc!l.c f., AUL’. ( 10: i. d. fici. Vr h..dwd .. It. 10I 40 L’. >10),.0.! nr. “ c-.. . 4...,*. 0..,,,, L“.,. ,MJL’., 1. .-.,,. q.t,k,
TAB1. f X-J-1 - TABUIATEO VALIJES FOR CPIRATING “CHARACTERISTIC CURVES FOR SINGLE S~PLINC PIANS
I I k. ,w. l, i. w.litr 1,,.el. I,m.1 I..nm, i.m) I
h 0,15 I 0,65I
1,0I
1.sI
2.5 I 4,0 ]~1 65 1>1 ,0 0,,510,85 j ,,0 I ,., j ,,2 I ,,, 1~] ,,, 1~1 ,, lx] ,,
p (i. ptrc., &kti.. ) P II” 6.(..1. r=. hm.kd En;,,)
99.0 0.0116 0. la7 0,530 1.04 ?.28 1. ?1 4,s1 6.17 722 9,,6 0,01?6 0.186 0.%5 I ,03 2.23 3,63 4.38 5,% 1.62 9.33 12.9 1s.7
9s.0 0,0341 0.U6 1.03 1.13 3,22 5.01 6,M 1.93 9.8’? 11,9 ~,m, 0.444 I m 1.71 3,21 4,93 537 7.71 9.61 11.6 15.6 18,6
W.o 0.132 O.ml 1.32 2,22 1,99. S,VI 6.26 0.93 11,0 13,2 0.!32 O,E&s I.% 2,10 3,94 5,82 6,79 0.18 10,8 12.9 17.1 2L,3
15,0 0,359 1.3Q1 2.16 3.10 S,m 1.W 8.6] 109 13,2 1s,5 0,260 1,20 2.16 3,11 5.27 1.!5 8,55 10,6 13,0 15,3 19.9 73,4
S2.0 0.233 2.W 3,21 4,51 7.26 9.X 10,8 13,3 15,8 18,3 0,.%5 2.10 3.34 4,39 7.W 9.s9 10,8 13.3 15,6 10,3 23,3 27,1
23.0 1.7? 3,33 4.04 6.39 9,14 11,9 13,3 16,0 18,6 21,3 1.73 3,31 493 6.39 9,28 !2. ! I 3.5 16.3 19.0 11.1 27.2 31,2
10,0 2,84 4.78 6,52 816 11,1 14,1 15,7 18,6 21,4 24,2 2.82 4,05 6.&5 8,33 11,6 14.7 16.2 19.3 22,2 2..2 30.9 35.7
5.6 3,b2 5.79 7.66 9.48 12.7 1S,8 11.3 20.3 ‘r,2 26,0 3.74 5,93 1,27 9,69 13.1 16.4 18.0 ‘31,2 24,3 27.4 3.4 37.8
I ,0 5,59 8.01 10.1 120 15.6 10,9 m,5 2.16 ?6.6 ‘N.5 5.16 am 10,5 12,6 16.4 m,o 21.8 2S2 m,s 31.B 3.2 42.9
0,25 I ,0 1.5 25 40 x 6,5 x 10 x on Lo 1s 2.5 4.0 ~ 6,, ~ 10 ~ 15 ~
Accembl. Ou.llw Lt. ds(,k$,t. d iwul!..l
“..,,,.-,,,,!.,,,,.,,” -, ,.-. ,.*,,., .-,.!..., ,.b... ,.,..,,. ~! ,..bd “,,.

51
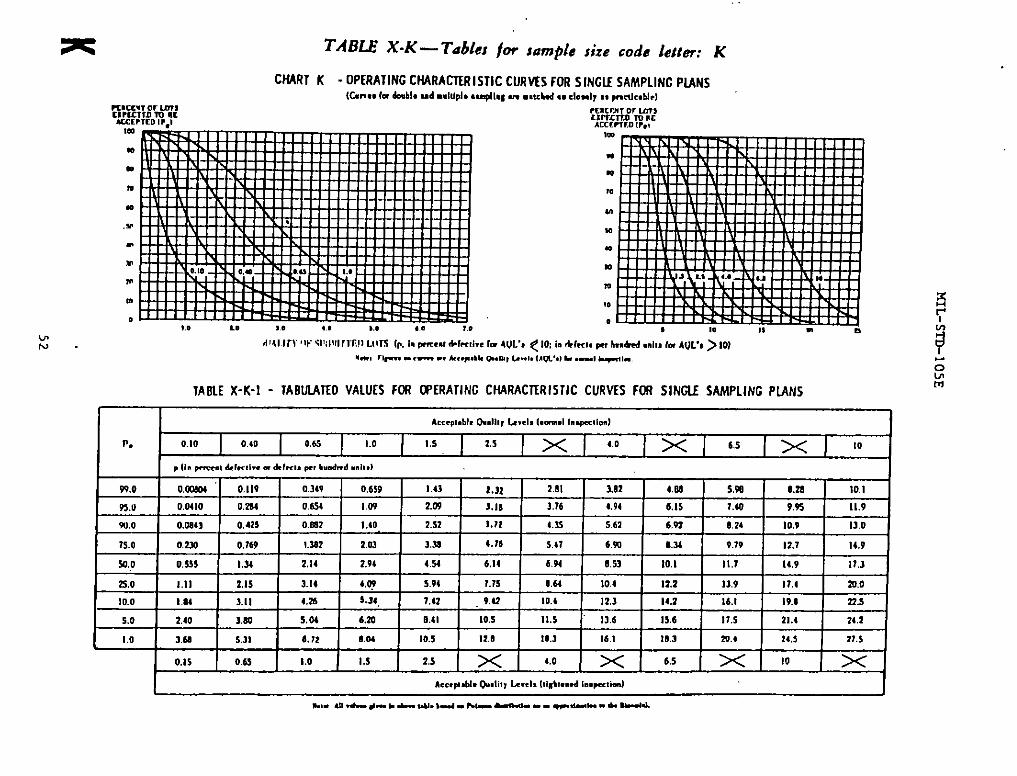
ITABLE X-K— Tables for sample size code letter: K
Ct14RT K - OPERATING CHARACISRISTIC CURIIIS FOR SINGII SAMPLING PIANS
{time, Imdmbl. ud dupl, .npllq - ■uch6 ., clod, . . PMIC064.)~8;c~;;rm~; rc”crm or tars
Uruxrn m “cACCIPTCD1,., ACCC~Ml(h,la Imm .. .m ,.. w.* wm .,W .m .Ill !,o ,.. t. s. *.9 ,,, ,.. ... e s ,0,, mm
dltun *1FWllw rrm LtllS [,. 1. PnW,t *l?cti.e lW w.’, < 10; In dtk,, *, h.+ ,“1,, (m Arjr, > 10)
k., ,Im. “ e...., ., Ac,.p.b, V.,,”, b“,, ,“QLW b —, +,..
TABLE x- K-I - TABWAFID VALU[5 FOR WIRATING CIWRACTERISTIC CURVESzyxwvutsrqponmlkjihgfedcbaZYXWVUTSRQPONMLKJIHGFEDCBAFOR 51NGtf MAIpLINC PLANS
I I A,ce.,.bl,Odor b.,ls (-.1 I..ca,lm) I
I tv. 0.10 I 0,40 I 0,65 1.0I
I .5I
2.5I X1’”jx I
6,SI XJ’”
I
W.o O,ma 0.119 0.3W 0,6S9 1.As 1.32 2,81 3,82 4,8a 5.!6 8.ss 10,1
92.0 0,0610 0,266 0.626 I m 2,09 3.16 3,76 4,94 6,1S 7.60 9.95 11.9
W,o 0.w63 0.423 0,s52 I .10 2.s2 3.11 LS5 S,62 6,92 8,24 10.9 13.0
7s.0 0.220 0,7W 1ss2 2.02 3..32 e.rk S41 6,w 8.36 9.79 12.7 14.9
20.0 0,5s5 1,36 2,14 2,94 4,5s 6,14 6,94 0,53 10.1 !1,7 14,9 11.3
5,0 III !2,1s 3.!6 4,W S.91 1.7s 8,66 106 12,2 11,9 I 1.4 23,0
10.0 I .U S.11 4.3s ~.34. ~,,,7,42 9.62 10.4 12,3 14.2 16.1 19,1 32.s
S.o 2.40 S,m $94 6,20 10.s 11,s 11,6 1s.6 17.s 21.4 24.3
I .0 3,6s S.sl 6.12 0.06 10.s 12,6 !0.3 16.2 1.s.3 29.4 14,s 21.s
0,1s 0,65 1,0 1,5 2,5 x 4.0 x 6,5 x 10 x
0
1%
I A..xp.bl. Cu.lhr L-,1. Wbw.d l..patiad 1
.,,,,*
do
:+..
53

TABLE X-L —Tables for sampIe size code htter: L
~m~o~qClw u L - GW.UATING CK4RACT’ERISTIC CURWS FCM SINGLE SAWLING PIANS
=Ulcn 1, .1 IGw=c (m &U. -d -A@, u=Plhs M ●olch6 ■, d,odr ., ,14A4,)
#m
“
.
m
cc
w
.
m
.
n
,1* “ *.* ,.* u ,., ,. m,, *,* ,., ,,> ,,,, ,,, ,..D [M ~
WMLI1? G? 61FM21ED W72 b. 1. ~n’r.: 4rfml.. k AOL’* ~ I@ h &l-u F? h6A -IU k+ AOL,, > 10) $
,“, n,..,. ---- O_m,,l...b (firm%) 1. d -~
TAELE X-L-1 - TABUT.AIID VAIIIS FIX CWRATINC Ct14RAClER ISTIC CURVIS FOR SINGLE SWLINC PUNSm
IA=NdI. I.JS,I II, LA, (-i IS.FtiI
P. O,*I
0.sI
0,401
0.621
1.0I
1,sJ x I
251 xl 8.0 1X1”
,(l. pmNl 401Ru” .&f-, pm bBD4d .1,.)
W.o Q.*]. I 0,075 I 0,118 I 0.412 IOmz
I1.43
II ,1s 8.29 I 3,s I 3.76 I 5,17 I 6.29
?50 0.024 0.173 S.4W 0,683 l,li I.w 1.33I
3.W J.u 4.6J 6,Jl 7,4s
50.0 0 .Oig 0,3M 0.331 o.nt 1ss $32 ;.n 3.s1 4.Q $.1$ 4.44 m,12
22.0 0.144 0,461 0.666 Ill 6.11 3.!8 1,63 4.31 5,21 6,11 7,9S 9.34
Jao 0.347 O.rw 1,36 1.I!4 2,64 3.66 4,22 5.22 6.33 732 9,32 10,8
5,0 Osw In 1,$6 t.s 3,71 4.63 $.40 6S1 7.61 0,70 10,9 12,5\
10.0 1.15 i.w l.sd 3.34 4.64 $W 6.20 7,70 D.w 10.1 12.4 14,1
S.o l.% 1.37 3.1s 3.66 S,a 6W 1.22 #.u 9,72 10,9 13,3 8s,1
1,0 1.30 J,?l 4,m so’s 6.42 mm km 10.1 11,4 11,7 1s.3 11,2
0.10 0,60 0.65 I ,0 1,s x2,s
~4,0 “x 6.5 x
IABL[ X- L-2 - SAMPLING PLANS FOR SAMPLE SIZE COO[ ~R: L
— —
u-l.5)!
S@k
c.”.
I.#i..
., Ml,
oitt
—
m
—
Is
m
—
w
Im
150
WI
‘2s2
Iol
1-350
—t,. ,*.,
.
c It—
v
—
v
—
v
,,, (b.,0,10
—
0,052
—
k n—
01
—
.
—
0,10
—
0,10
—
,. 11,—
K
x
Accqll,blc 000111, Le.el, (m-l Im.wctbd
x—
, n,
—
u..
me#tlel
N
0,15
0,15—
c R!—
0-
d.4ttc*
M
—
0.8
0,22
—
k lb—
11
02
12
02
, ‘1
02
01
II
11
23
—
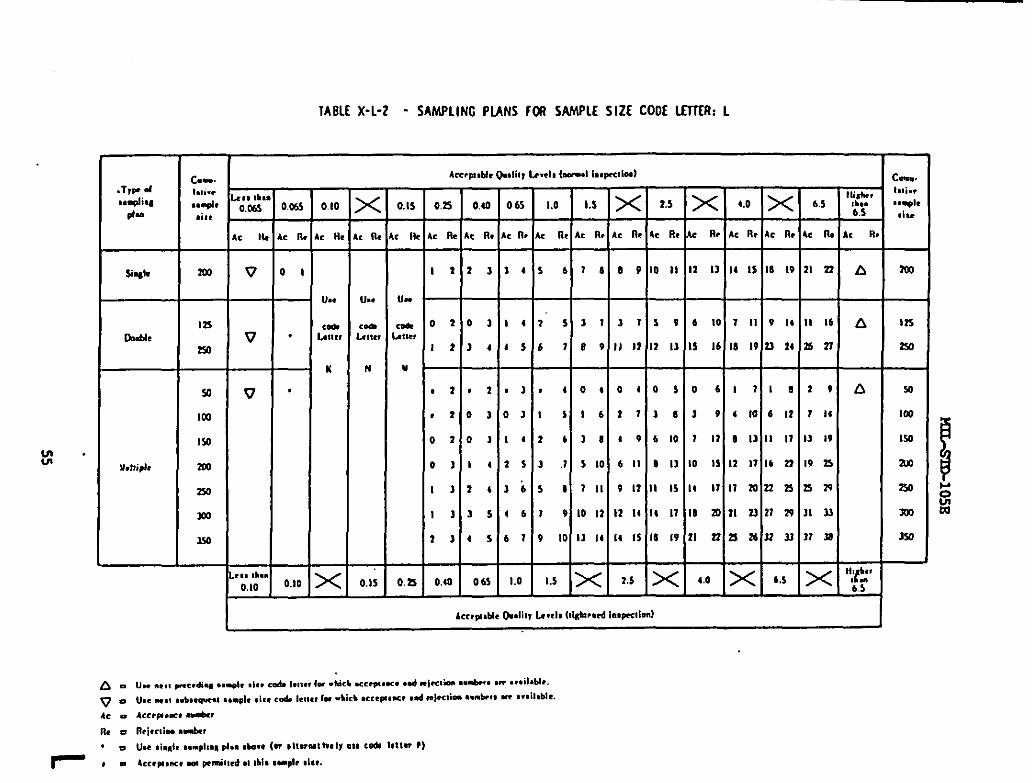
O,ul
040 065 1.0 ,.$ x 2,5
ICR. A. m AC R, A. lb A. n- AC R,
23 34 s 6 18 89 10 I I
B] 14 2 s 31 31 S*
)4 45 6 7 99 I I 12 12 13
02 .3 . 4 04 04 0s
D) OJ t s 16 27 16
D) 14 2 6 38 49 6 10
I 4 2s 3 ,1 s 10 b II o 13
26 3b 5 8 1 II 9 12 I I 15
IS 46 1 9 10 12 12 I t 14 17
6 s 61 9 10 I I 16 14 Is 16 (9
062 1,0 ,., ~ ,,5 ~
1CCC$4M Odl, 1#.clo M66w,d l“*pcclld
x 4,0 x
k Il. AC R, 4, RI
12 13 14 Is 18 19
6 10 7 11 9 la
IS 16 w 19 n 24
0 6 17 18
J v 6 to 6 12
1 12 8 I I 11 17
10 15 12 17 16 22
14 17 II m 22s
10 a 11 23 21 29
[1 n 7226 32 U
4,0 x 6s
I:hb#6,2
6.5
k n, A< U
11 ‘?2 A
II 16 A
lzizl
29 A
r N
1319
19 22
Es
II u
1? J9
x “$
u.. . . . . P..6i..I ..+. d.. cd. l.,!.. lo. .l.ki .c.rwac. .4 +ctkm ..+.. U? . ..ikbl.
u.? w.! -b..-! ..+. 01.. call let,,, 1s4-MA .Ccwl.b- .96 ml-ii- ..fabt* m OW.11.t.le.
AU+4.-* -,
Il+c,k .+,
u., ok”+. 0.!+,.” d., ohm, (w *R*-: $,0Ir 019cdl 1,110?9)
k,p,m, w pttimd ●I tbl. to+ .1[..
Cnn.
I.,; . .
II*
Zw
—
250
—
50
lW
!50
ml
m
m
MO

TABLE X-M — Tables /or sample size code letter: M
CNART M - CPERATINC CHARACTERISTIC CURVES FIX SINGLE SAMPLING PLANSrrmccnl o r WnUrulco 70 *C (Cwre. lot LW4* mad.. IIIPIC c.apllw -c ma!chtd *8 c1o.cI, II pmcdc.hldACcc,,l n (,.,
UIm
TABLE X-M-1 - TABULATED VALUES FOR WERATING CjlARACTERSTIC CURVES FOR SINGLE SAMPLING PLANS
I IAcc.phbl, Omll,, L...l, (.-,1 I.,pr,im)
P. 0.040 0.15 I 0,25 0.40 0.% I 1.0 I x 1,5 I x I2.3 x 4,0
p (i. m-m defrctl.t m i. W-1, w. b.r.imi ..it,l
9,0 0.ml!9 0.C412 0,13s 026! 0,%1 0,921 1,11 1.51 I .94 2.31 3,38 3.W
%.0 0.0161 0,111 0.260 0,414 0.8,0 1,?6 1.49 1,96 2,44 ‘3.94 3,% 4.73
50.0 0,0115 0.169 0,1$4 0,534 I ,m 1,40 1.72 2.23 2.74 3.21 4,34 5.16
7S.0 0.D213 0.325 O.MO O.zm I ,34 1.E9 2,17 2,74 3,31 1.69 5,G5 5,91
30,0 0.220 0.531 0.349 1.17 1ml 2,43 2.75 3,39 4.02 4,ti 5,93 6,m
2s.0 0.440 0.835 1,26 I .62 2,36 3,07 3,43 4.11 4,63 5.s2 6.90 1.92
10.0 0.731 1.27 1,69 2.12 2,94 3.76 4.13 4.89 ,3.64 6.39 1.26 B.%
5.0 0.951 I ,51 lm 2.46 3.34 4.17 4.s S,32 6.17 6,?s n.41 9,m
I .0 1.46 2.11 Z 61 3,!9 4,16 S.08 5,52 6.40 1,14 8.08 9.7 I 10.9
0.063 0.75 0,40 0,6 I ,0 x 1,5 x 2,3 x 1,0 x
Ac..pI.blc @.lltr L..cI. (,i~ht,md Imp.c,im)
““, Au +... . . . . A. .-1. w - P.,- . ..i”h. . . . .n”.titi . * -.
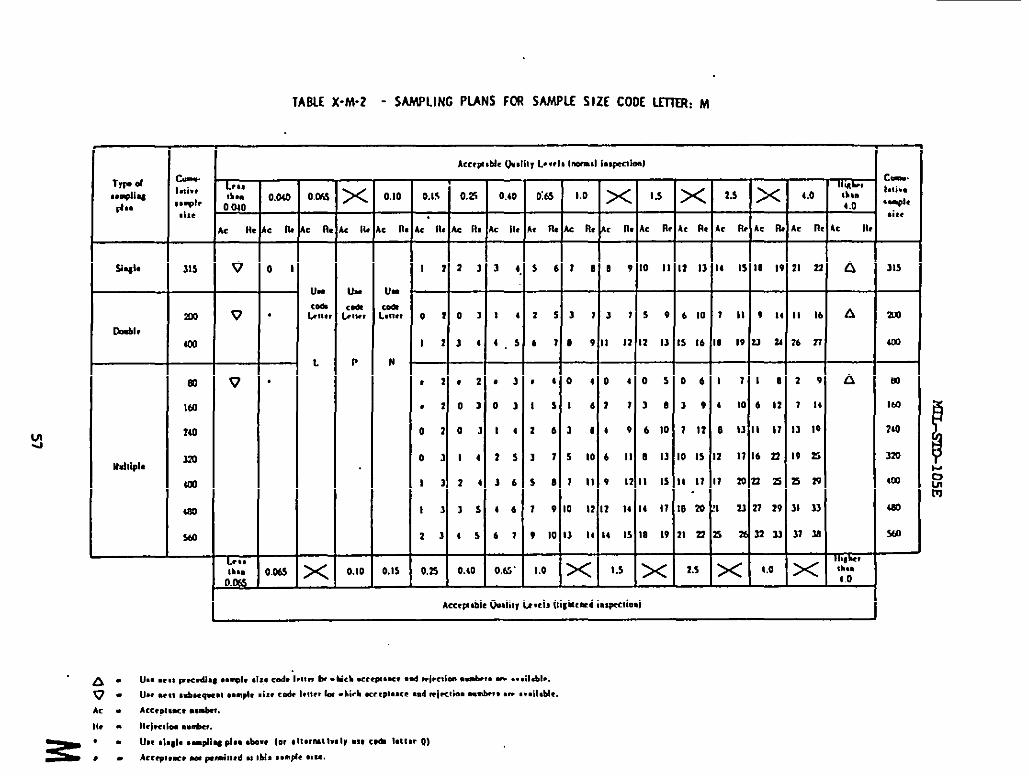
LJJ
Zh#l,
Limb!?
Mdlbb
k..., I...+.,1,,
m
230
Ua
20
Ito
240
X0
Ua
430
WI
TABLf x-M-2 - SAMPLING f’lANs Fm S~U slZE COOE lfIIER: M
v
—v
-G7lb..
MA
—
D,ou—
:n—
I
—
—
—
.W—
—
O,w—
:n—
u“
maL-*
L
2—
—
0,10z—: Iii—
Um
COa.,*,
P
—
0.10
—
u“
ti..,,.!
N
—
0.1$
AcctPstdc lJudity L-d, lnumd I.spxdd
0.1s 0,% 0,40 D:65 ‘“ x IS x 2.5 x 4,0 ‘t:4,0
k n. AC n, Ac 11, At 15ck R* A. n. Ac W k n, AC R. Ac lb A. Ik Ac n
I 1 ’33 3 4, S6 10 09 10 II 11 13 14 Is 18 Iv 21 2’3 A
0 r 03 14 2s 37 J) s 9 6 10 1 It * 14 11 16 A
I 2 34 {,5 61 8 9 11 12 12 83 IS 16 10 19 3334 26 27
* z ● 2 .3 tt 04 04 0 s 06 1? 18 29 A
. 2 01 03 Is lb 21 3 0 39 a 10 6 12 7 14
02 03 14 26 38 4 9 6 10 1 1? 8 $3 11 11 II 10
01 14 25 1 7 s 10 6 II 8 13 10 Is 12 17 !6 22 19 ?5
I 3 24 16 S8 1 11 9 12 II Is la 11 11 22 ?2Z5 =27
1 3 3s 46 7 9 10 12 12 14 16 17 !0 ‘m :1 23 n 29 II 13
23 45 67 * 10 13 14 14 Is la 19 21 n 2s 75 32 21 31 M
0,?5 O,*O 0,6$. ,,0 ~ 1.s ~ 2.5 ~ 4,0 x ‘;;
Acctpb!e Odty Ix.ds (Iitkcnd iwcd.d
A- u.. . . . . Fx.d., $.+. .1...4 1.1!” lx -Mcb UCq..cr .d I. Iwd- .-,. - . .. II.M..
c-.hi...Q#<.iu
315
am
4m
m
#m
210
3m
am
au
YA2
6- U.e w., ..btc~.l ..wI. min. C06. I.tt.. la -Mt6 oc.vl.nc. .d mire! i.. -+.. . . . ..ll.ble.
Ac - Acc,pl,8c* .*dcl.
It. - M,lQc,les ..ACI.
=::
u.. 01.,1. ,-puq PI., ●ta., (0, ,It.rml 1., 1“ “,, C,- 1*11,. 0)
Amq., mc, m ~d,,,d ,, ,Ai, ..@ .,”.

T.4BLE X-N — Tables /or ~amp!e $ize code her: N
IT”cc”,0, mCWR1 N - CWRATINC CNARACTFRISTIC cuRvES FCR SINGLE SAMPLING PLANS
CBrtmto IV 01AccCrl 20#P., IC.rm k bad. . ..4 .m!,lpl. .qll., .m ..tcLd . . cb,.1, . . WIc.bh)
ma
m
m
m
.
.
.
m
m
,.
.. .. , . ,., , 0 ,., , , ,,, , . ,,, ,,0 ,,, ,,, ,,,
,)1° !Ll r> (W Sllli$tl Irl:ll Lrl12 (,, h. pace., .!, If., iv< (.” 412V, c 10, In hk,. w hwndmdml,, (w NV. >101
F.., rip. “ .-., k,.p.,1, O.d,!, L“.1. (, W., ,. .-, +..,-.
TABLE X- N-1 - TABUIATID VALU[S FC# WERAIING CHARACTERISTIC CURVES FM SINGLE SAMPLING PLANS
A.ce~.b!e QtI.litT L...!, (-d l..~c!io.)
l’. 0,025I
0,10I
0.15 0.2.5I
0,40I
0,651, x I
I .0 x I 1.5 I X125
P(in wrctM ~fcr,iw m i. dtfcci. c.r bm.dmdnniid
90.0 O,CWO1 o.ozw 0.l?d72 0,165 0537 0,59I 0.701 0.934 1.22 I .W 2,01 2.31
930 0 Illo> 0.111 0.164 0.211 0523 0,7% 0,939 1.27 1,54 1.95 2.49 2.90
9.30 0,0211 0,105 o.2m 0,349 0620 0.93I Im 1,40 1,73 Z,w 2.73 1.2s
1s.0 0,0513 0.192 0.345 0.507 0,06( 1.19 I 37 1,72 Z.m 2.6 1.10 3.14
W.o O,ln 0,234 0.55s 0,134 I.IJ 1.53 1.1.7 2.13 2.35 2.93 3.13 4.23
m o 0,277 0,S29 0784 I .02 1.48 1.96 2,16 Z.m 3,M 3.43 4.55 4.99
I 0,0 0461 0.778 1,26 I .34 1.85 2.33 2,63 3.09 3.s4 4,03 8.95 5,44
30 D599 0,949 1,?6 1.35 2,10 2.35 2.09 3,57 3.3P 4.28 5,34 6,c5
1,0 0,9’2! 1.33 I .W 2,0! 2,62 ],m 3,48 4,03 +,% .5.0? 6,12 6,01
0040 0.15 02s 0.40 0,65 x 10 x 1,s x ’35 x
[k<w.ble %.!h, L..d. (tl”h!,..d i.,m,lod
I“.. ! m ..,-. ““, b *“ ,.b,, h.-, -,.-,,.,,,.,.. “ --..,-,,.. ,. ,& ,,4.
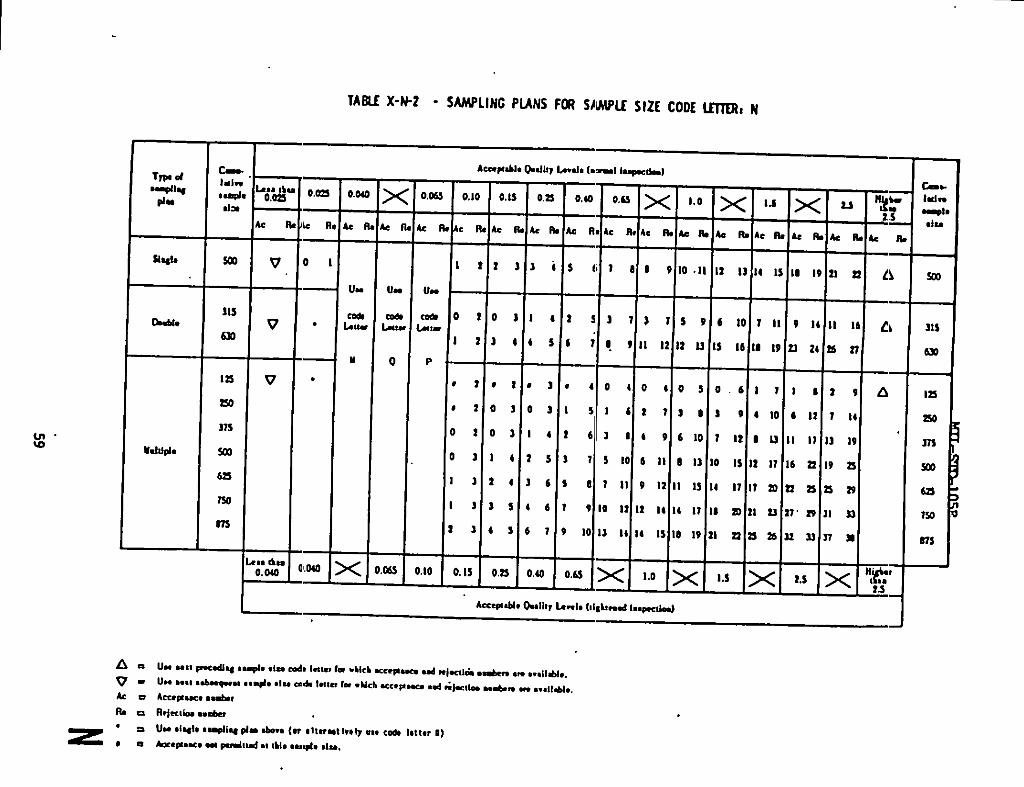
II
II
N59

m0
TABLE X-P — Tables jor s~mple size code letler: P
uIMLITVOFSU1lMITTWLUI’S(v inw~,,&l,dl”k,AQL’,<I&1“dc(me, w. bmdmd ❑-II, f= AOV. > 10)sm., %-.. “ . ----- k.qdi. 0..1!,, L.-Io ,Aw.1 b. —1 I.w!!...
TABLE X-P-1 - TABULAIED VALUES FOR CPERATING cHARACIERISTIC CuRV[s FOR SINGLE SAMPLING PLANS
A=ep, *le (J””Ii,, 1,..,1, (“m,,l l..ph”)
P. 0015 OW.5 0,10 0.15 0.25 0,40 x I0.6
I XI IQIX I1.5
Pli. mm.: ,J.kli.. m drkt. w, hndwd nit.)
9?0 0,00126 0,0186 0.0s45 0.1212 0.223 0,363 MM 0.596 tl$z 0.93s 129 1.s1
95,0 O,ciwl 0.0444 0.102 0.!11 0.3n 0.498 O.W 0.771 0,%1 1,16 I .S4 1.06
$00 0.0132 0,066 0.138 0.218 0,.?ld 0,542 0.679 0,.378 I ,m I.m 1,71 2.03
7S0 O,o.wl O,lm 0,216 0,317 owl 0.745 0.252 I .0s I .30 I .53 1.39 2.34
50,0 O,w 0,210 0.334 0,4s9 0.lQ 0.939 1,m 1.33 t .W I ,m 2.33 2,11
%,0 0.113 0,331 0.493 0.639 0.922 1.21 1.x la 1,$0 2.1? 2.72 3.12
10.0 O,m o,48b 0.365 0.035 1.16 1.47 I ,62 I .93 2.22 2.52 1.0? 3s2
5,0 0,3J4 0.593 O.ml 0,969 1.31 I ,M I ,W 2.12 243 2,74 3.34 3.78
I .0 0.576 0,230 I .03 1,26 1,64 Z.m 2.18 2.52 2.83 3.18 ].m? 4.29
O.ws 0.10 0.15 O.z O.ul x O.&s x 1,0 x 15 x

.,
61

TABLE X-Q — T~bIe~ for stimpie jize code letter: Q
CNART Q - OPERATING CtMRAC&TIC CURVES FDR SINGLE SAMPLING PIANS?19CUI 0, mtxmcrw motUcr?rrn, , . , (G-, IW&W, ,~ ml(lpl. ,-pll,, ,m m,tckb ., do,+ ,. pmc,ldl.)
:m
.
.
m
m
m
.
❑
m
,.
,
mw
0,,,,, .,, ,,. ,., ,., ,., ., ., ,,0 ,., 1,1,,s ,., 1., M ,,, ,,, ,,, ,,, ,., ,, ,,, ,,, ,.,
WJALITY OF SU12WTHl L(T7S {p, 1. ~mrm! belccilm 1- AWL’. <10: i. ‘60recmper h+ ❑l,. k AOU. > 10)
m.., -. ,.—.. “ k.?!.). 0“1,, l..!. ,W.1 k .--1 .-!4
TABLE X-O-1 - TABULATED VALUES FIXE WRATING CHARACTERISTIC CURVES FOR SINGLE SAMPLING PIANS
Aec.p.bk Ch.lity Lvv.lm (s-.1 i.ovlim)
p. 0,010I O,MO 0.(%5 I 0 .10 I 0,2s
I0,25
I x I0.40
x I0,62
I x I1,0
F.(i” rrc,.t *I-I., Cctdtc,, pm hddwnll.
W.o O.atwn 0,0119 0,0249 0.0+29 0.10 0,232 0,281 0342 0.489 0.5W own I .01
95,0 0,20410 0.0204 o.aW 0,10s 0,2W 0,318 0.316 0494 0.61S o.7&2 0.99s 1.19
w, 0 0,2W41 0.M2S 0s822 0.140 O,al o.3n 0,43s 0.262 0.692 0s24 I,w 1.30
1s,0 0,0224 0.076V 0,1?4 0.m3 0.23s 0.176 0.241 0,6W 0.634 0.979 1.27 1.49
so 0.255s 0,124 0.214 0.294 0,(54 0.614 0,694 0,022 1.01 1.17 !,49 1,13
‘2s0 0.111 0,215 0.314 0.409 0.s% 0.77S 0,864 1,M 1,22 1.39 1.14 2.02
10.0 0,5s4 0.111 0.m 0.s54 0.742” 0.942 1.M 1.?7 1.42 1.61 I.% 2,25
5,0 0,2!0 0,290 0,% 0,6?3 0,641 1,02 1.)s I .s5 1.56 1,7s 2.14 2.42
1.0 0.?44 0,221 0,672 0,024 I .s 1.20 1.29 1.61 lm 2.04 2.U 1,75
0.01 s 0065 0.10 0,!5 0,2s x o~ ~ 0,65x
1,0 x
Amdle OdlI, Le..l. lllnhe..d k~, i..))
ht., ,,, ,.l... @... I.&. .* l..,,.%- tl..*, . . ..t...l..t. ”.h s!-,

0!u
Tp dMqsiq
#**
ckJ&4*
udll#*
—
1%9.14”
—
Ino
SW
Ma
—zyxwvutsrqponmlkjihgfedcbaZYXWVUTSRQPONMLKJIHGFEDCBA
m
6s0
963
ma
Ins
Ism
Sms
TABL2 X-O-2 - SAMPLING PIANS FOR SAWLf SIZE COLM IfllIR, Q
x-
s n—
U90
(an.
R
0.010
—
I,O1O—
, R,—
I
—
.
—
.
—
1.013—
u“
L%
P
z
z—P. R*
Acc9pt66* 09dll, b-lo (m-d IqlmkOl
B.033 Oo1o 0.0% 0,10 0,1s 0,a
CR# AC R, k. R* A. R. k Il. AC R?
I t 23 14 s 6 70
lb.
~ o 1 0s 16 1 s 37lmll-
It 34 6s 6 7 9P
II
* ! ● l ● s * 4 04
, 1 03 0s 1 s I 6!
02 01 1 4, 2 6 36
03 14 1s 3 1 s Ioi
1 3 24 36 s 9 1 11
1 3 3s 46 1 9 10 11
21 4s 61 9 10 13 11
1,060 0,06s 0,10 0,1s o.n x
x 0,s0 ~ 0,63 ~ 1,0
h no kafh AC n. A. R, h R, k lb
c~ 10 11 12 13 14 M 16 19 31 a
31 5- 6 10 1 II * 14 11 16
II 12 11 u Is 16 18 19 29 28 3639
04 9s 06 11 1 I 1$
11 S6 39 4 10 6 It 1 16
69 6 10 1 11 6 13 II 11 13 19
6 11 8 13 10 1s 12 1? 16 29 19=’
9 12 II 15 14 11 11 n 3395 3s39
12 la 11 11 In 30 nn 3939 31 33
16 Is 18 19 21 n ‘nZo 333s 393s
0,60 x 06s x 1.0 x
,4
—
c-vId..
—
Em
Isa
—
31$
Ala
96s
nm
tsn
1s90
330s
k = Aarpl-c. -
n. = R.\tctlm -t
= u“ Olwl, ,0+*, d,. .bc.
m: = Acm$4nu - pmlud u IU, *+* aim.
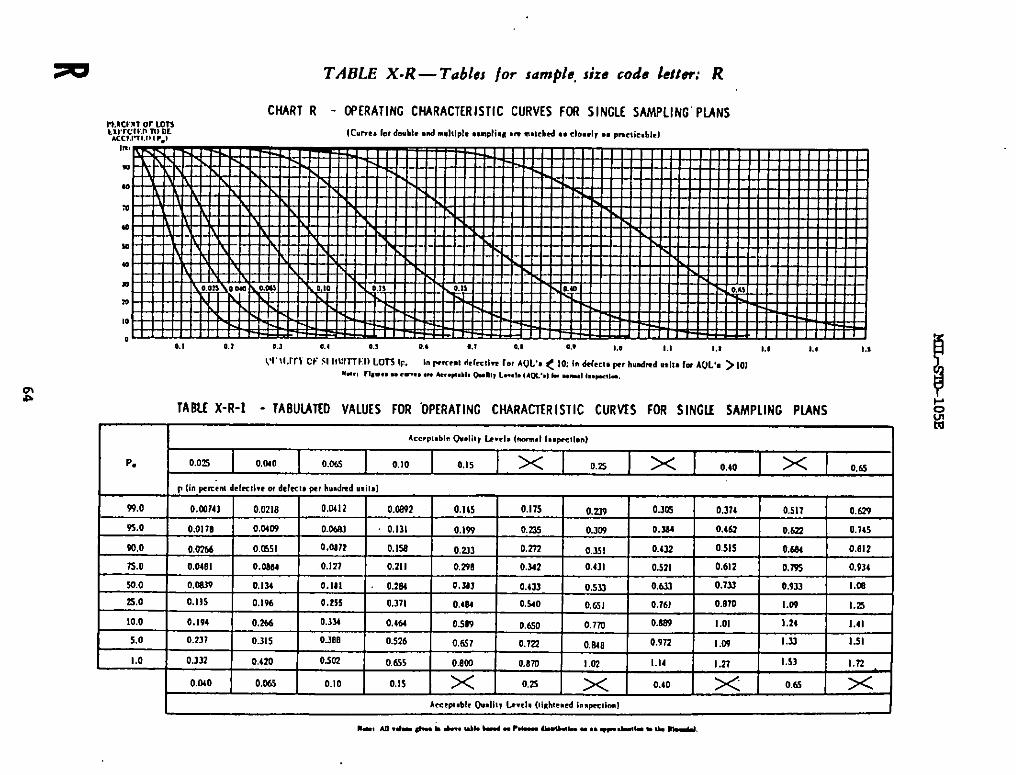
TABLE X.R — Tables /or sample, size code letter: R
CNART R - W’ERATING CMRACmRISTIC CURVES FIX SINGLE SAMPLING” PIANS19.9CIM1or WnLtwcw. m 9L,.,,,,7,,,! ( ,-, lCUr.eS 1., dnublcd m,l,lpl, ,,mpliq .* n.ctrhed,, .!..,1, ., pm<,i,,hld
1“0
.
00
a
w
!0
.
.
.
,,
0,1 0.1 0.1 0.4 0.s 0.6 * ,, 0 ,, 0 ,,, ,,, ,,, ,,, ,,, ,,,
(Q1’11.ICY Cl’ $1IIVIT7K11 L073 IV. 1“ r.rrcnl d,(<,,l.F I., AI)U. ~ 10, 1“ dek,. ~, h“ndmd .“1,. I- AOL’. > 10)w.., n,.,, “ ,..., ,“ k.p,h,, I+, m,L“.,. I Am., l., “ml ,..pd-,
lABII X- R-1 - lABUIATED VALU[S FOR ‘OPERATING CNARACTER ISTIC CURVES FOR SINGLE SAMPLING PLANS
A...pblnln G.11,, ti.,ls (m,m,l 1,. F.c, I.”)
P. 0.025 O,LUO 0.261 0,10 0,15 I x I 0.5 I x 0,40 I x I 0,ti
p (1. Fmrrd dtfec,l.e or defect. pr h..dmd ❑i,.]
W.o o,m74] 0,0218 0,0412 0.C%?2 0,145 0.175 0.279 0.W5 0,311 0,511 O.dw
P5.o 0,0170 0.04w O.c+.m 0,)31 O,lw o.a5 0.3W O.lw 0,4d2 0+.Z2 0.145
W,o O,mm 0,(651 o.mn 0,150 0.731 0.?72 0,35I 0.132 0,51s 0,644 0,.912
no 0,040! 0.mM 0,127 0,211 0,290 0.342 0.411 0.s21 0,612 O,w 0,934
50.0 0,mm 0,124 0.181 0.2E4 O,m 0,133 0s22 0,62.7 0.7U 0.933 I ,m
25,0 0,11s 0,196 O,ms 0,311 0,004 0,540 0,651 0.761 0,070 1.W t.n
!0.0 O.lW 0,264 0.334 0,W 0s09 0,650 0.770 O.ml t .01 1,24 1.41
so 0.231 0.315 O.W 0.S26 0,627 0.172 O,W 0.972 1.W 1.21 1.51
1.0 0.132 0,4m Owl O,dc,s 0..9m 0,8m I .32 1.14 I .27 Is] 1.?2
O.o1o 0,2+.5 0.10 0,1$ x 0,2$ x 0,40 w 0.65 x
L Am,P,bl, Q.I.llt, Lm,l, Oi,h!e,ed i“,pcc, im)I
n., N1.kd... ba”, tltu. u .hl....41u!l.”l..m..-. l.m. .**.

?j
1X
1
.
.*..*
65

TABL.E X-S—Tables /or sample size code letter: S
Ac = Accept.mce mnber
Re = Rejection IIwnbera = Accept- MC pitted m IM* ●9+* dm.
TTPO ofm+ir#
p!u
Shgla
Ml.
Multiple
I
cmu-
3130
‘znCa
Uca
w
16UI
2400
3KI0
40CQ
4S03
m
Aceqmblo @llw bnl(Mrmd inspalkd
x
A. m
1 2
0 2
1 2
# 2
0 2
0 3
1 3
1 3
2 3
0.025

,
Mlvsm-loss
zyxwvu
tsrqp
on
mlkjih
gfed
cbaZ
YX
WV
UT
SR
QP
ON
ML
KJIH
GF
ED
CB
A
6.
6
6.1
Inten&dUse.
endtablesforinsperzionby
attrti~tended
tokeusedintheaquj.sicimofEefensennteria.1.
6.2
subjectTerm(I@?yWord)Listi.nq.
AceptableCuaMty
Level(A(Z)
merage~goirq
Qdality(~)
Defect
Dsfective
LatorBatch
ProcessAversge
S.an@e
SalrplilqPlan
unit
ofPrcduct
6.3ch
ang
esfranP-ous
Issue.
thisrevisiontoicientify&mqes
theextm.siveneasoftherhanges.
Vertkal
linesO
=asterisks
arsnot
ussdin
with
eesperxto
thepwlous
issuedueto
67
Custodians:
Army-m
Navy
-O
SA
irF
or@-
23
Review
Activities:
A=&’-m,
E&
T’LAV,
ER
Navy-As,m,
NC,m,
s,
SH,‘ID,YD
DLA-S.S,GS,SS
OSD-IP,
SO
zyxwvu
tsrqp
on
mlkjih
gfed
cbaZ
YX
WV
UT
SR
QP
ON
ML
KJIH
GF
ED
CB
A
r
mL-SID-105S
c#aJJDINc
FmTzN
AL
User
Activities:
Arm
y-mD
?&l
-E
S,
SS
68
PreparingActivity:
Army-AR
(ProjectC?3C-0085)
lft$~
Uc
m~
s:h
●w
nLia
uiIU
●ffo!t
tod
OU
?c
IarId
mfiA
iOa
daumm
bbetter,
III.D
oDQ
r.xide9LbE
Iform
fo?U
ICin
cnmeau
and~tioca
forim
~m-nta.
AU
W-
0!m
iliwy
aadudu8-.rnttial
tioadocunxnfJ
amiariiad
tow
uride
-tietul%
isform
may
kmdoti.d.
fotdm!
dmu
rholim
oim
d-ti,tvm
ddone
b.Im
m+*
(mIW
TS
TW
V.@
.~
Jkd.In
bkak6.
beu
#pacirIcu
pmibko
●bout
pu’ticubprc.blern
uussuch
S8
wrdiw
-hickrequired
in~wion.
m
mrixid.
==idv*.Ian.
UU
MIIO
UI.
or-u
i=omcukihlc.
Aon
PIvpoad
wordim
ctunc_dtkb
woutd
tidkcthe
~bk=.E
hwinbtak
6uIyrmM
rkJn0tm
titnaapmirm
~xoftidocunm
a:.lfb
toc
k7
nfE
tted
ou
t.a
n
UkmOdwdgeamcltdfbumitodto
you-wlixllodva
kobtyoakmo.
kblyau
COUUnmIbm”wcckuduldm
bckn6
(P*
dON
ahb)
OE
PA
FIT
LIEN
lO
FT
HE
AR
MY
111111m
...‘“
I.iEd
OW
kCtA
L●
IJSN
ES
-uAt.T
vF
om
●n,v
ATs
IJSE
UO
aB
US
INE
SS
RE
PL
YM
AIL
.PIR
67C
LAS
SP
ER
MIT
NO
.m
omw
AS
HIN
GT
ON
OC
,
PO
-AG
EW
ILLB
EP
41OB
VT
HE
DE
PA
RT
ME
NT
OF
TH
EA
RM
Y
Us.
AmrYNu.swmrPISEMcH,D5ElJ3~
FmmxREFmKa??rER
m:
SK
AR
-arlc
-sPICATIWNY~,
NJ
zyxwvu
tsrqp
on
mlkjih
gfed
cbaZ
YX
WV
UT
SR
QP
ON
ML
KJIH
GF
ED
CB
A0
78
06
-50
00

HA
ND
AR
DIZA
TION
DO
CU
MEN
TIM
PR
OV
EM
EN
TP
RO
PO
SA
L(se
eIiu
tnu
limu
.R
+sid
e)
DO
CU
ME
NT
NU
MaE
❑2.
00C
UU
EN
TT
ITLE
MEL-~105E
SAMPUNG~ANDTABLES
FCIRINSP~ICNBY~
MA
ME
OF
c.umutnttm
OnuN
IuTIO
w4.
TY
PE
OP
0RC
AN
IZ4T
ION
(M+
H)
•1V
EN
DO
R
l’-Jm
,.
aoonz”waam
g’C
lw,
am-.
ZIP
C*)
❑u4N
”E=A
rr””E”
❑O
TH
ER
(Stirj,,
●R
OeLllU
AR
EM
.r—
W.au,
dW
mdlv
k—w
c9aikW
.-/nm
lOndo
t.~.,
,?E
MA
FIE
S
NA
ME
OF
SU
BM
ITT
ER
it.-wH
al.M
l)-
Oc.,,m
lti8.
WO
BK
TE
LEP
HO
NE
NU
MB
ER
(l”elud#.4-
Co&
)-
O,ptl.w
..l
h8A1L1N
GA
OD
nE=
lSfm
.1,C
ity,S
Uti,
ZIP
Cdl
-O
othmU
s.O
AT
E06
SU
BM
ISS
ION
fYY
MM
DD
)
fiftF
OR
M4
fihf!
.“..,,-----
.-.-.
.-—
—.—
.—
—-