migration and developing countries 28 november 2007 migration policy institute washington dc jeff...
TRANSCRIPT

Migration and Developing Countries
28 November 2007Migration Policy InstituteWashington DC
Jeff Dayton-JohnsonDenis DrechslerOECD Development Centre

2
International migration and developing
countries
Roadmap to the presentation:1. What do we think we know?2. What do we really know? 3. What can we do?

3
Two main messages
Good news: Migration can contribute to global poverty reduction
Inconvenient news? Neither development in general nor aid in particular will slow or stop migration... for a long, long time

4
International migration and developing
countries
What do we think we know?1
What do we really know? 2
What can we do?3
5
1) What Do We Think We Know?
• International migration is exploding
• Canary Islands, Sonoran desert, boat people: most immigrants to OECD come illegally from poor countries humanitarian crisis
• Brain drain robs poor countries of doctors, nurses and teachers
• Remittances: No need for aid any more
6
International migration and developing
countries
What do we think we know?1
What do we really know? 2
What can we do?3

7
2 ) What do we really know
• Size, trends and composition of migrant flows – intra-OECD migration – skill levels and destination
• Brain drain versus brain gain
• Remittances – substitute or complement to aid
• Development policies – can they stop emigration?

8
International migrants as a share of population
Source: United Nations.
1960 1965 1970 1975 1980 1985 1990 1995 2000 20050123456789
10
World Less developed regionsMore developed regions

9
Where do migrants to the OECD come from?
Latin America (25.0 per cent)Mexico: 11.2Puerto Rico: 1.7Cuba: 1.2El Salvador: 1.1Jamaica: 1.0Colombia: 1.0Dom. Republic: 0.9Brazil: 0.8Ecuador: 0.7Guatemala: 0.6Haiti: 0.6Peru: 0.5Argentina: 0.4Guyana: 0.4
OECD
Africa (8.5 per cent)Morocco: 1.9 Kenya: 0.3Algeria: 1.6 Angola: 0.3 Tunisia: 0.5 Ghana: 0.2South Africa: 0.5 Somalia: 0.2Egypt: 0.4 Ethiopia: 0.2Nigeria: 0.4 Senegal: 0.2
Wider Europe (13.5 per cent)Turkey: 2.6 Russia: 0.8Serbia and Montenegro: 1.5 Bosnia-Herz: 0.7Ukraine: 1.0 Croatia: 0.6Romania: 0.9 FYROM: 0.2Albania: 0.8 Belarus: 0.2Bulgaria: 0.8 Lithuania: 0.2
Asia (16.8 per cent)India: 2.5Philippines: 2.5China: 2.5Vietnam: 1.9Pakistan: 0.9Hong Kong: 0.8Sri Lanka: 0.4Indonesia: 0.4Thailand: 0.4Bangladesh: 0.4
Source: OECD Database on Expatriates and Immigrants, 2004/2005
Intra-OECD migration: (36 per cent;
50 per cent incl. Mexico and Turkey)
10
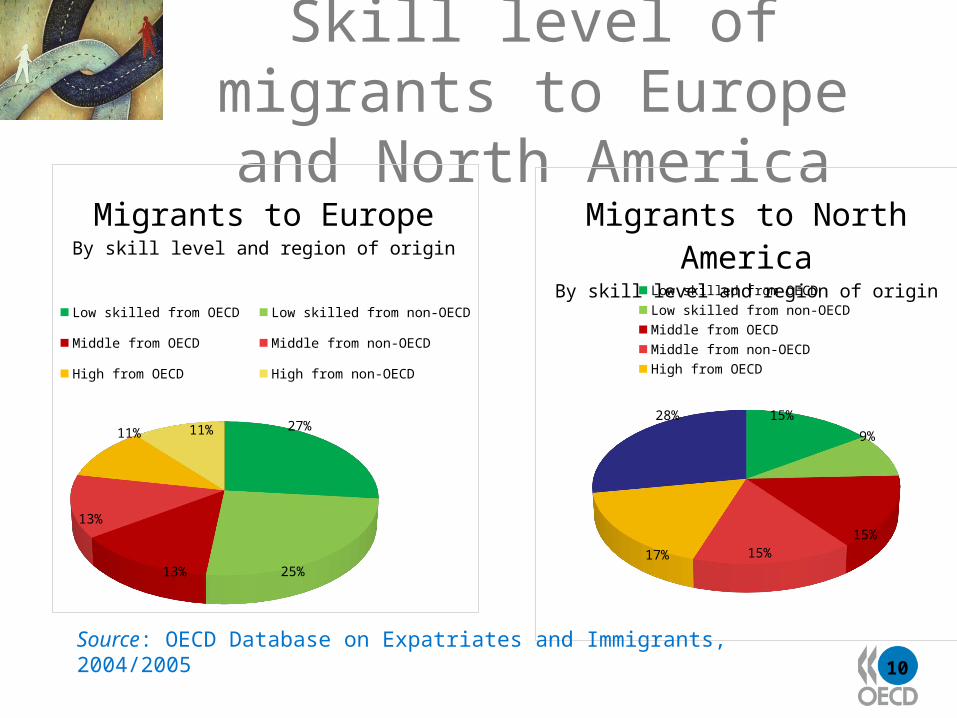
Skill level of migrants to Europe and North
America
15%
9%
15%
15%17%
28%
Low skilled from OECD Low skilled from non-OECD
Middle from OECD Middle from non-OECD
High from OECD High from non-OECD
Migrants to North Amer-ica
By skill level and region of origin
Source: OECD Database on Expatriates and Immigrants, 2004/2005
27%
25%13%
13%
11% 11%
Low skilled from OECD Low skilled from non-OECD
Middle from OECD Middle from non-OECD
High from OECD High from non-OECD
Migrants to EuropeBy skill level and region of origin

11
Where do low-skilled migrants in the OECD come from?
Source: OECD Database on Expatriates and Immigrants, 2004/2005
East Asia and Pacific9%
Eastern Europe and Central Asia14%
Latin America and Caribbean35%
Middle East/North Africa8%
South Asia4%
Sub-Saharan Africa3%
Western Europe24%
USA, Canada, Australia and New Zealand2%
Low Education Adult Foreign Born in OECD, by region of origin

12
What about illegal immigration?
• Estimates of illegal immigrants for selected countries:– United States: 10.5-12 million (3.5-4% population)– Netherlands 125 000-230 000 (0.8-1.4 % population)– Switzerland 80 000-100 000 (1.1-1.5 % population)– Greece 370 000 (3.4% population)
• Overstaying often more common than fraudulent entry or sea landings– Italy, 2005 estimates: 60% “overstayers”, 25%
entered with false documents, and 14% entered by sea landings in southern Italy
Source: OECD International Migration Outlook 2006, 2007

13
Estimates of the Irregular Migrant Stock
thousands % of pop. Year (years since
regularisation)
Japan 210 0.2 2005
United States 10 300 3.6 2004 (18)
Netherlands 125-230 0.8-1.4 2004
Spain* 690 1.6 2005 (4)
Italy 700 1.2 2002 (4)
Greece* 370 3.4 2001 (3)
Portugal 185 1.8 2001 (6)
Source: OECD International Migration Outlook 2005.
* = Subsequent regularisations not accounted for in these
estimates.

14
The Migration Cycle
Source: OECD (2007)
• Migration affects development in three ways (+/-):– Changes in labour supply– Receipt of remittances– Changes in productivity
• The relative importance of each effect varies over the migration cycle

15
Low skill migrants and poverty reduction
• Low-skilled mobility raises wages or reduces unemployment/underemployment
• The low-skilled remit more– Circular mobility– Unaccompanied by family members– Shorter stays – Closer to home
• Remittances by the low-skilled have a larger poverty-reduction impact

16
Brain drain: gains and losses
Source: OECD (2007)
• Brain gain for some countries– Incentive to acquire more training and
skills– Poor prospects for working in qualified
jobs – Returning “brains”
• Brain drain hits the poorest developing countries hardest!
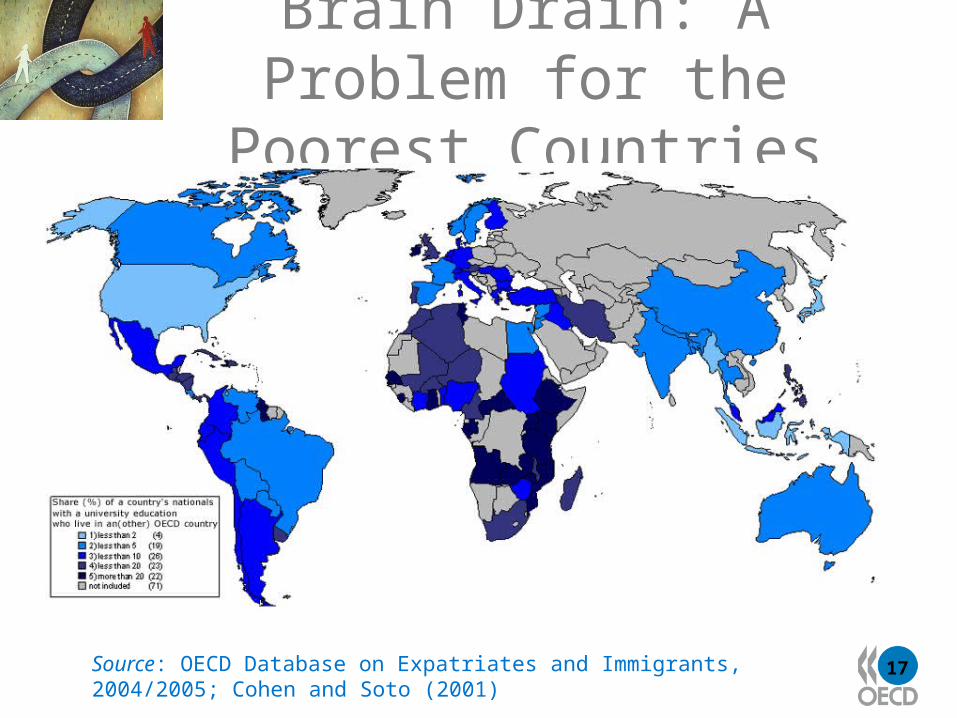
17
Brain Drain: A Problem for the Poorest
Countries
Source: OECD Database on Expatriates and Immigrants, 2004/2005; Cohen and Soto (2001)

18
Remittances matter….
Source: IMF Balance of Payments Statistics; UN Trends in Migrant Stock, 2000.
Money sent home annually, US $ per migrant (2000)
EU US Other OECD E Asia NICs Developing Reg. GCC0.0
500.0
1000.0
1500.0
2000.0
2500.0
3000.0
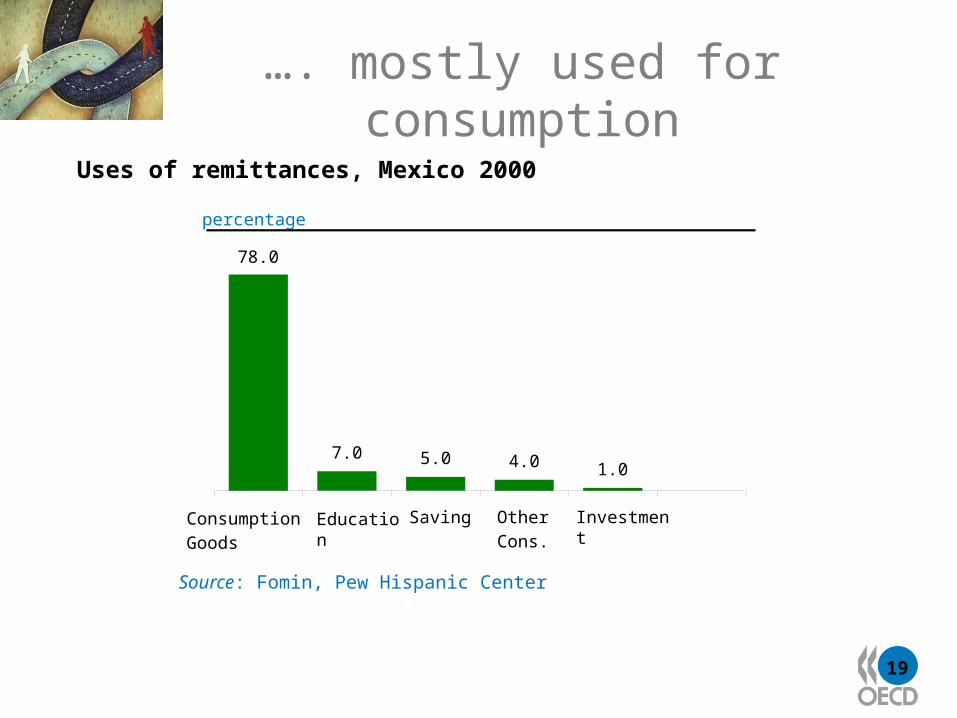
19
percentage
Source: Fomin, Pew Hispanic Center
78.0
7.0 5.0 4.0 1.0
Consumption
GoodsEducation Saving Other
Cons.
Investment
…. mostly used for consumption
Uses of remittances, Mexico 2000
20
Remittances and aid: complements, not
substitutes
• Remittances tend to finance consumption: often productive (consumer durables, house improvement, education, health)
• Incipient schemes for community investment of remittances (e.g. Tres por uno, Zacatecas, México)

21
Will development slow migration?
How it works:• Poor countries specialize in
production of goods that use labor intensively
• New jobs created in export sector, absorbing would-be migrants
• Outsourcing

22
Probably not
• Adjustment is a long-term process
• Demographic factors will slow it further
• “Migration hump” hypothesis; with prosperity, more emigration
• Pitfalls of using aid to influence migration

23
International migration and developing
countries
What do we think we know?1
What do we really know? 2
What can we do?3

24
3) What Can We Do?
More coherent policies for more effective mobility management1. Look at migration policies through
a development lens2. Look at development policies
through a migration lens

25
Migration policies througha development lens
More flexible options for migrants and employers, including• Smart labor-market access policies to
allow legal circular mobility• Creating paths to
naturalization/citizenship for longer-term migrants
• Reducing remittance costs and increasing access to the financial system
• Co-développement: engaging diasporas

26
Development policiesthrough a migration lens For sending countries, integrate migration
into national development strategies. • Macroeconomic policies (tax revenues,
exchange rates…)• Human resources and higher education
policy• Infrastructure investment (transport,
communications)• Dealing with the informal sector
27
Concluding remarks
• Migration an integral part of
globalization
• Creating more awareness of the development – migration nexus
• Striving for coherent policies
• Not raising false hopes, promoting realistic solutions

28
For more info: www.oecd.org/dev/migration