midlife and wellbeing, charles waldegrave
TRANSCRIPT

© The Family Centre Social Policy Research Unitwww.familycentre.org.nz
The Impact of Poverty on Wellbeing during Midlife
Charles Waldegrave, The Family Centre Social Policy Research Unit, Lower Hutt, Wellington
Michael P Cameron, Populations Study Centre and Department of Economics, University of Waikato
Presentation to New Zealand Psychological Society Annual Conference 2010, Rydges
Hotel, Rotorua, Tuesday 20 July 2010
© The Family Centre Social Policy Research Unitwww.familycentre.org.nz
Charles Waldegrave & Peggy Koopman-Boyden (Eds)
Authors: Ben Amey, Michael Cameron, Peter King, Peggy Koopman-Boyden, Ian Pool, Suzan van der Pas
and Charles Waldegrave
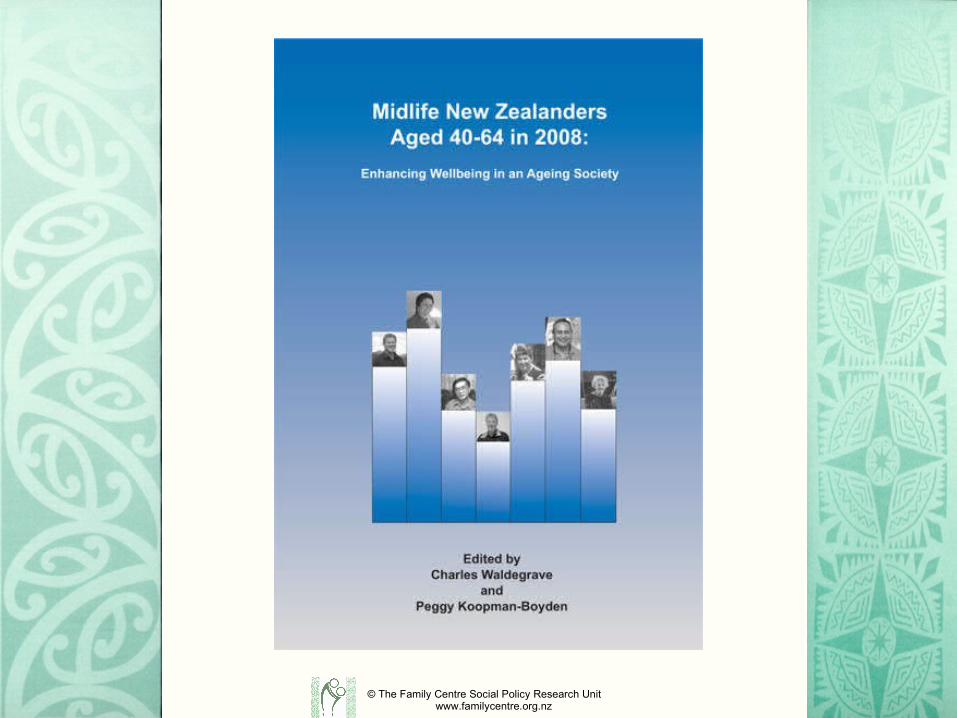
Midlife New Zealanders Aged 40-64 in 2008: Enhancing Wellbeing in an Ageing Society
© The Family Centre Social Policy Research Unit www.familycentre.org.nz
Population Studies CentreUniversity of Waikato
Enhancing Wellbeing in an Ageing Society (EWAS) Research Programme Directors: Richard Bedford and Charles Waldegrave
The Family Centre Social Policy Research Unit, Lower Hutt, Wellington and the Population Studies Centre, University of Waikato, Hamilton
Funded by the Foundation for Research, Science and Technology
Official Launch hosted by the Families Commission 14 August 2010

© The Family Centre Social Policy Research Unitwww.familycentre.org.nz
The research programme included two large scale national random sample surveys of independent and semi-independent New Zealanders between the ages of 65 and 84 years, and between 40 and 64 years.
Enhancing Wellbeing in an Ageing Society (Koopman-Boyden & Waldegrave (Eds), 2009) has already documented the initial results from the survey of the 65-84 year-old New Zealanders.
This publication presents the first results of the 40-64 year-old survey. The study provides the first comprehensive set of results of a national random sample of midlife New Zealanders.
A fuller understanding of the baby-boomer and Gen X generations who are about to become superannuitants.
© The Family Centre Social Policy Research Unitwww.familycentre.org.nz
The aim of the research was to
“provide the understanding that is essential for policy formulation and the delivery of services for enhancing wellbeing in an ageing New Zealand society”.
© The Family Centre Social Policy Research Unitwww.familycentre.org.nz
The theoretical background and conceptualisation of wellbeing combines a subjective sense of satisfaction with Amartya Sen’s notion of the capability to access resources and to do something with them.
Wellbeing in this research involves people both experiencing a sense of satisfaction with life, and acquiring appropriate capabilities to achieve a good quality of life.
This conceptualisation is consistent with current developments across disciplines and with the views of stakeholder groups questioned at the beginning of the research programme.
This broad conceptualisation of wellbeing is necessary to take into account the social context in which wellbeing is achieved.

© The Family Centre Social Policy Research Unitwww.familycentre.org.nz
A national random sample of 1,958 people aged 40-64 years in 2008
• 1,000 females (51.1 percent), • 958 males (48.9 percent)
Weighted for age and gender according to proportions in the 2006 census
A Computerised Assisted Telephone Interviewing (CATI) method of data collection undertaken by the University of Waikato’s Department of Societies and Cultures during late January to June 2008.

© The Family Centre Social Policy Research Unitwww.familycentre.org.nz
The ten broad domains of the Ministry’s annual Social Reports have been used to structure this monograph under the following domain areas.
These ten domains provide a broad coverage of the capabilities, needs and subjective areas of satisfaction that is consistent with the theoretical approach adopted in this research
• Culture and Religion.• Rights and Entitlements
• Social Connectedness • Economic Standard of Living
• Safety• Work and Retirement
• Living Arrangements • Education
• Leisure and Recreation • Health

© The Family Centre Social Policy Research Unitwww.familycentre.org.nz
Subjective Wellbeing was associated with the following Social Indicators
• Good health• A higher personal income• A higher level of asset wealth• Home ownership• An expectation of rights and entitlements that include financial
security, family support and access to health and residential care• Living with a partner• Current or most recent employment status• Not having long periods outside the workforce during their working
lives – for men• A higher level of educational qualifications• More likely to be older when finished schooling • Participation in leisure and recreational activities• Participation in community organisations• Easy access to amenities like shops and public transport• Not going without essential items and services• Experiencing safety around the home and the neighbourhood • Seeing the neighbourhood as safe at night• Considering religious faith to be important
© The Family Centre Social Policy Research Unitwww.familycentre.org.nz
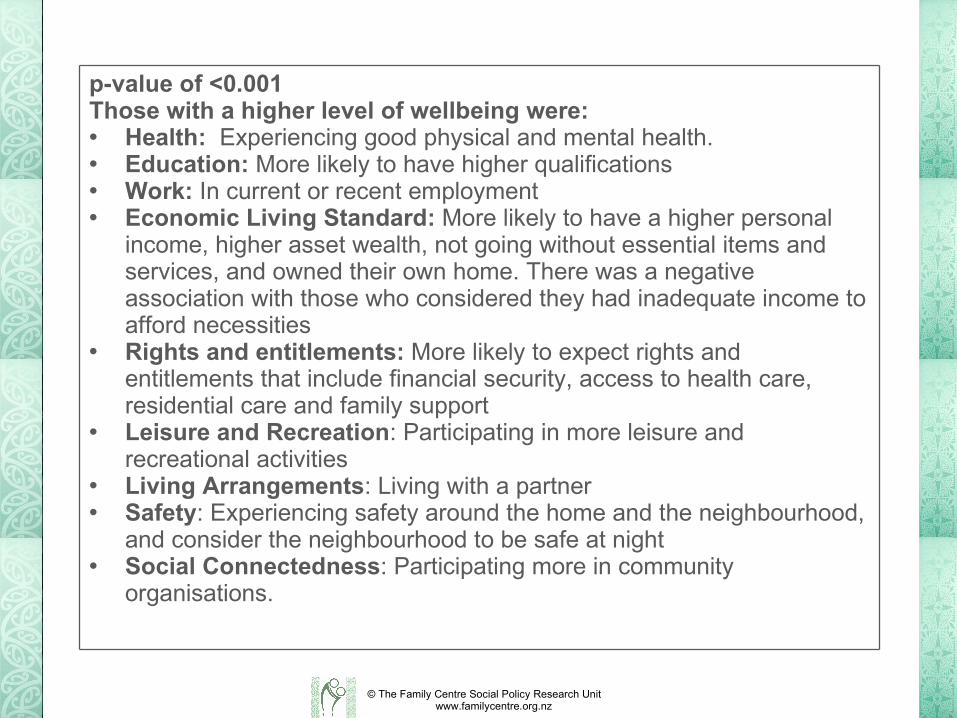
p-value of <0.001Those with a higher level of wellbeing were:• Health: Experiencing good physical and mental health. • Education: More likely to have higher qualifications• Work: In current or recent employment• Economic Living Standard: More likely to have a higher personal
income, higher asset wealth, not going without essential items and services, and owned their own home. There was a negative association with those who considered they had inadequate income to afford necessities
• Rights and entitlements: More likely to expect rights and entitlements that include financial security, access to health care, residential care and family support
• Leisure and Recreation: Participating in more leisure and recreational activities
• Living Arrangements: Living with a partner • Safety: Experiencing safety around the home and the neighbourhood,
and consider the neighbourhood to be safe at night• Social Connectedness: Participating more in community
organisations.
© The Family Centre Social Policy Research Unitwww.familycentre.org.nz
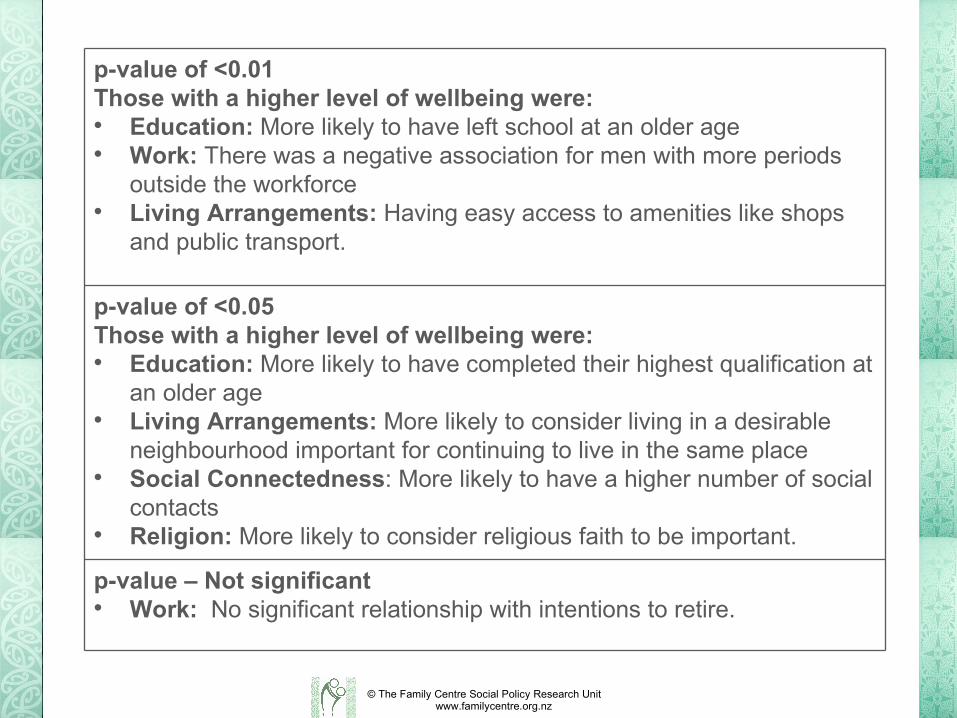
p-value – Not significant• Work: No significant relationship with intentions to retire.
p-value of <0.05Those with a higher level of wellbeing were:• Education: More likely to have completed their highest qualification at
an older age• Living Arrangements: More likely to consider living in a desirable
neighbourhood important for continuing to live in the same place• Social Connectedness: More likely to have a higher number of social
contacts • Religion: More likely to consider religious faith to be important.
p-value of <0.01Those with a higher level of wellbeing were:• Education: More likely to have left school at an older age• Work: There was a negative association for men with more periods
outside the workforce• Living Arrangements: Having easy access to amenities like shops
and public transport.

© The Family Centre Social Policy Research Unitwww.familycentre.org.nz
Distribution of Total Personal Income before Tax (%)
0
2
4
6
8
10
12
14
No inco
me$0-$5
$5-$10
$10-$15
$15-$20
$20-$30
$30-$40
$40-$50
$50-$60
$60-$70
$70-$80
$80-$100
$100-$120
$120-$160
$160-$200
$200-$250
Over $
250
Total Personal Income before Tax (000s)
Resp
onde
nts
(%)

© The Family Centre Social Policy Research Unitwww.familycentre.org.nz
Average Total Personal Income, by Gender, Age and Marital Status
60,86240,000Divorced
53,02545,000Widowed
66,23045,000Married/Partnered
60,20440,103Single
Marital Status
68,03835,00060-64
68,63545,00055-59
62,06745,00050-54
64,14248,51145-49
65,37045,00040-44
Age Cohort
49,50731,137Female
79,29256,912Male
Mean Income$
Median Income$Gender
© The Family Centre Social Policy Research Unitwww.familycentre.org.nz
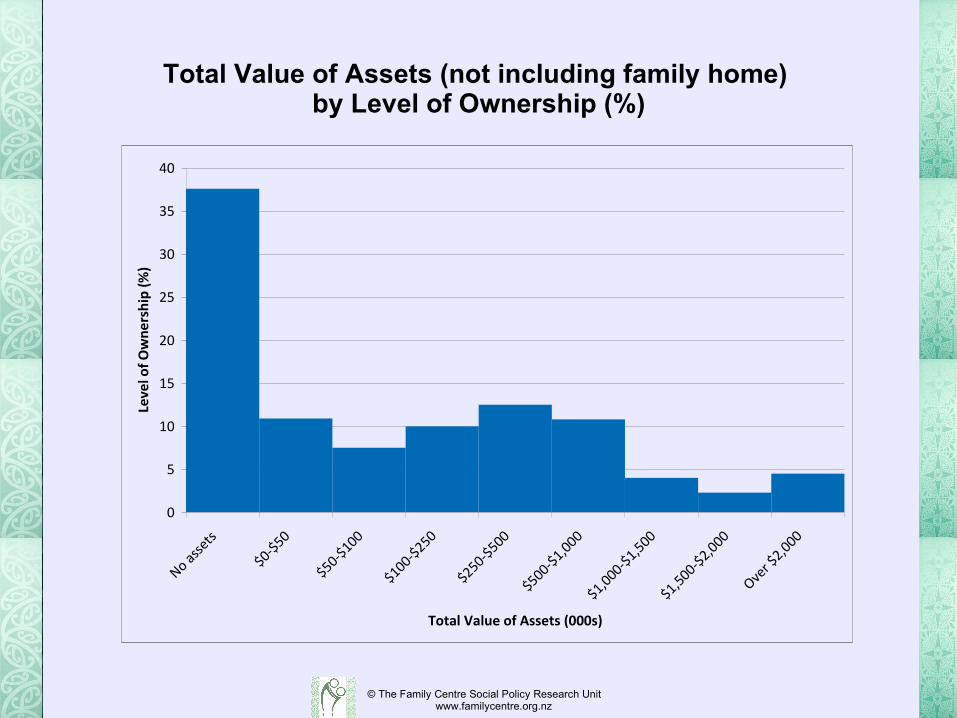
Total Value of Assets (not including family home) by Level of Ownership (%)
0
5
10
15
20
25
30
35
40
No assets
$0-$50
$50-$100
$100-$250
$250-$500
$500-$1,000
$1,000-$1,500
$1,500-$2,000
Over $
2,000
Total Value of Assets (000s)
Leve
l of O
wne
rshi
p (%
)

© The Family Centre Social Policy Research Unitwww.familycentre.org.nz
Subjective Assessment of Adequacy of Money by Personal Income (%)
0
10
20
30
40
50
60
70
80
90
100
up to $20 $20-$40 $40-$60 $60-$80 over $80
Total Personal Income (000s)
Subj
ecti
ve A
sses
smen
t of A
dequ
acy
of M
oney
(%)
Not enough money
Just enough money
Enough money
More than enough money
© The Family Centre Social Policy Research Unitwww.familycentre.org.nz
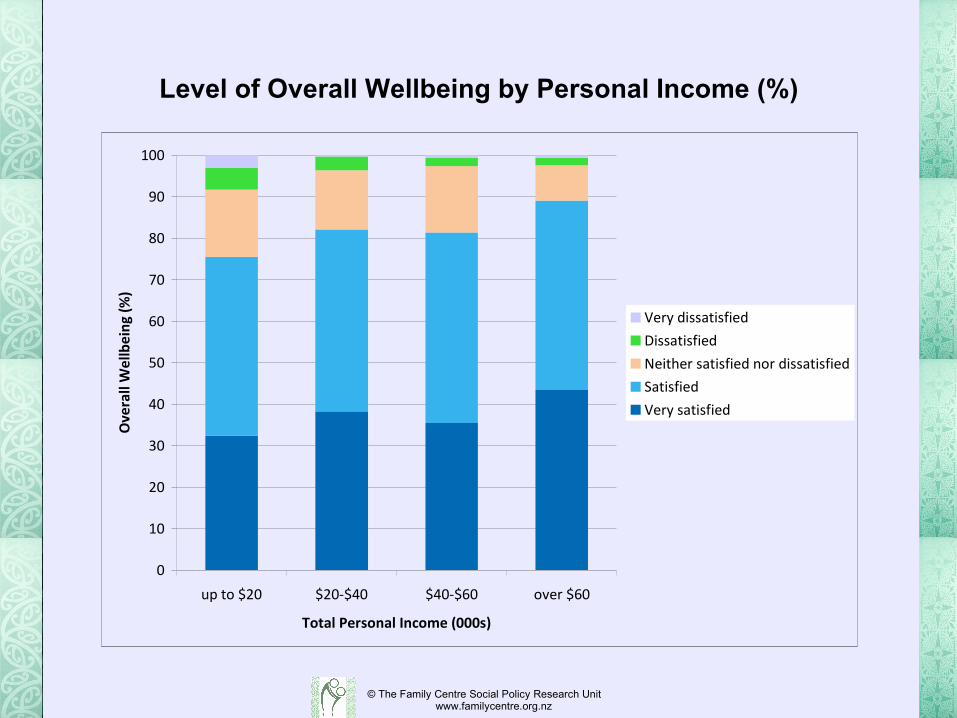
Level of Overall Wellbeing by Personal Income (%)
0
10
20
30
40
50
60
70
80
90
100
up to $20 $20-$40 $40-$60 over $60
Total Personal Income (000s)
Ove
rall
Wel
lbei
ng (%
)
Very dissatisfied
Dissatisfied
Neither satisfied nor dissatisfied
Satisfied
Very satisfied
© The Family Centre Social Policy Research Unitwww.familycentre.org.nz
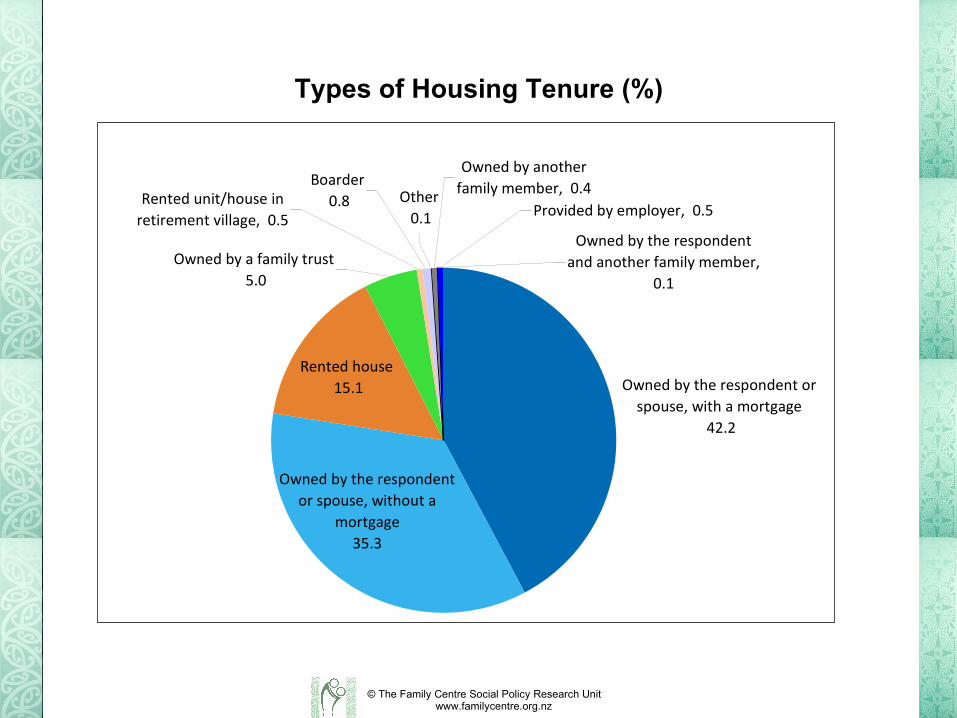
Types of Housing Tenure (%)
Other 0.1
Boarder 0.8
Rented house 15.1
Owned by another family member, 0.4
Provided by employer, 0.5
Owned by the respondent and another family member,
0.1
Owned by a family trust 5.0
Rented unit/house in retirement village, 0.5
Owned by the respondent or spouse, with a mortgage
42.2
Owned by the respondent or spouse, without a
mortgage35.3

© The Family Centre Social Policy Research Unitwww.familycentre.org.nz
Overall Wellbeing by Housing Tenure (%)
0
10
20
30
40
50
60
70
80
90
100
Owners Renters Others
Housing Tenure
Ove
rall
Wel
lbei
ng (%
)
Very dissatisfied
Dissatisfied
Neither satisfied nor dissatisfied
Satisfied
Very satisfied

© The Family Centre Social Policy Research Unitwww.familycentre.org.nz
Types of Housing Tenure 65 to 84 years (%)
Owned by respondent or spouse, without a
mortgage69.3%
Owned by respondent or spouse, with a mortgage
7.1%
Owned by a family trust10.5%
Owned by another family member
1.5%
Owned by the respondent AND another family
member0.4%
Rented unit/house in retirement
village3.2%
Rented house7.6%
Boarder0.3%
Other0.2%
© The Family Centre Social Policy Research Unitwww.familycentre.org.nz
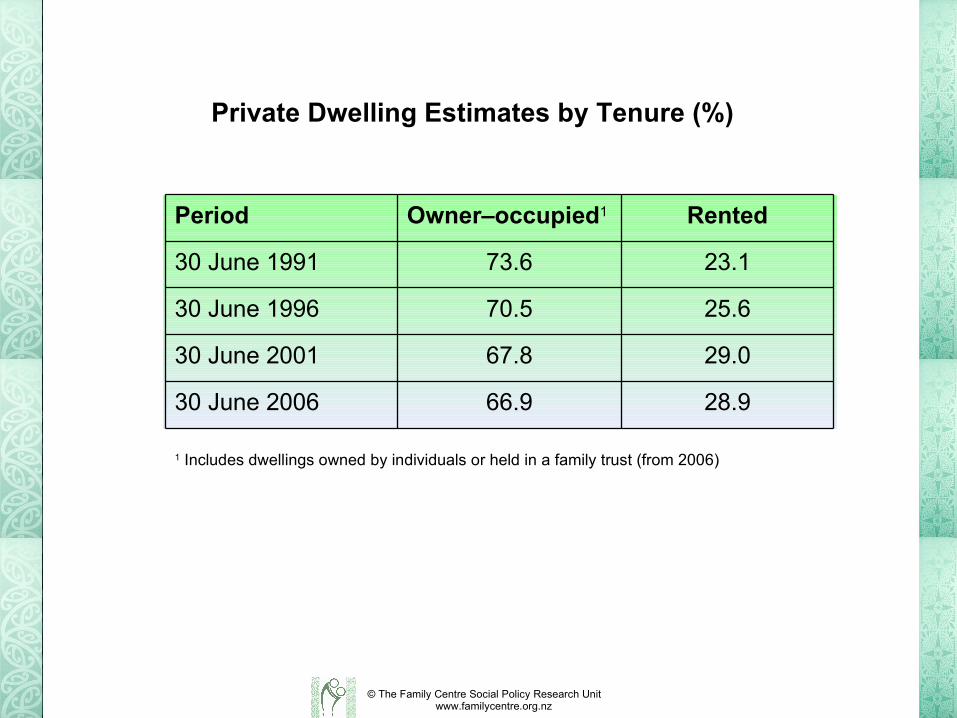
Private Dwelling Estimates by Tenure (%)
28.966.930 June 2006
29.067.830 June 2001
25.670.530 June 1996
23.173.630 June 1991
RentedOwner–occupied1Period
1 Includes dwellings owned by individuals or held in a family trust (from 2006)

© The Family Centre Social Policy Research Unitwww.familycentre.org.nz
Numbers below Poverty Thresholds from the EWAS and MSD Studies (%)
11 (ages 45-64)10.860% constant value used in
Social Report
18 (whole population)
12.660% of median
10 (whole population)
8.950% of median
MSD: peopleEWAS: people
aged 40-64Poverty Threshold

© The Family Centre Social Policy Research Unitwww.familycentre.org.nz
Multivariate Logit Model of Poverty, using the 50% of Median Income Poverty Line
0.007***0.4470Home Owner (1 = yes)
<0.001***10.8394Divorced or Separated
<0.001***19.3618Widowed
<0.001***16.2139Single‡
0.8450.8668Non-Home Assets $1 million-$1.5
million
0.032*0.0924Non-Home Assets $500,000-$1 million
0.084*0.4054Non-Home Assets $250,000-$500,000
0.079*0.3455Non-Home Assets $100,000-$250,000
0.5930.7866Non-Home Assets $50,000-$100,000
0.1470.5170Non-Home Assets $0-$50,000†
0.8911.0399Gender (1 = male)
0.010**1.0582Age
p-valueOdds RatioVariable
* significant at 10% level; ** significant at 5% level, ** significant at 1% level, † comparator group is those with no assets, no respondents with more than $1.5 million in assets were poor with this poverty line, ‡ comparator group is married or partnered people.
© The Family Centre Social Policy Research Unitwww.familycentre.org.nz
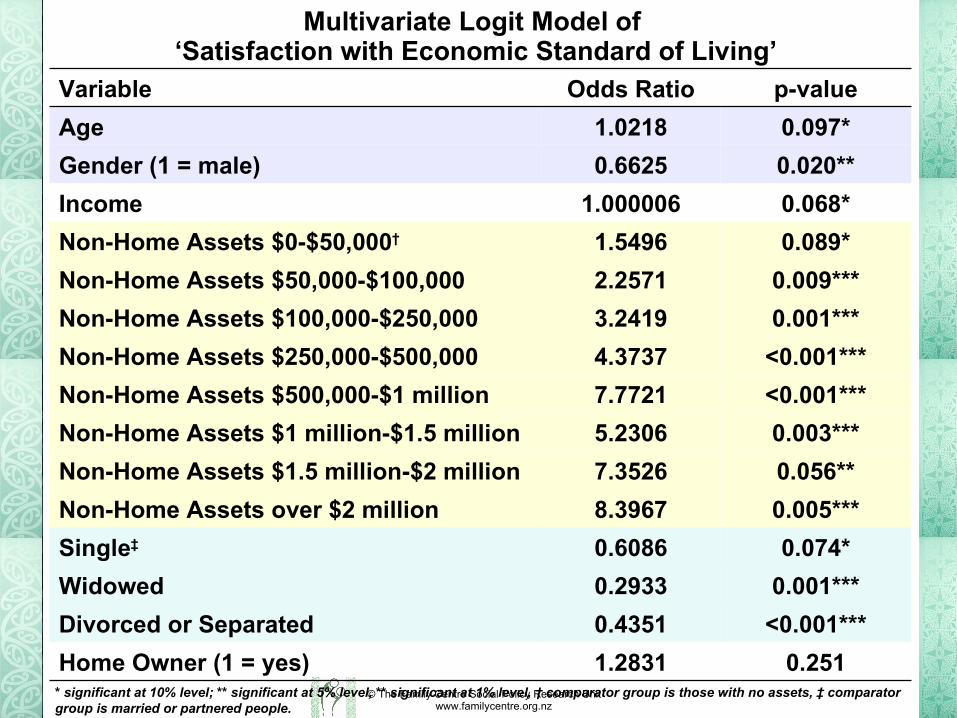
Multivariate Logit Model of ‘Satisfaction with Economic Standard of Living’
0.2511.2831Home Owner (1 = yes)
<0.001***0.4351Divorced or Separated
0.001***0.2933Widowed
0.074*0.6086Single‡
0.005***8.3967Non-Home Assets over $2 million
0.056**7.3526Non-Home Assets $1.5 million-$2 million
0.003***5.2306Non-Home Assets $1 million-$1.5 million
<0.001***7.7721Non-Home Assets $500,000-$1 million
<0.001***4.3737Non-Home Assets $250,000-$500,000
0.001***3.2419Non-Home Assets $100,000-$250,000
0.009***2.2571Non-Home Assets $50,000-$100,000
0.089*1.5496Non-Home Assets $0-$50,000†
0.068*1.000006Income
0.020**0.6625Gender (1 = male)
0.097*1.0218Age
p-valueOdds RatioVariable
* significant at 10% level; ** significant at 5% level, ** significant at 1% level, † comparator group is those with no assets, ‡ comparator group is married or partnered people.

© The Family Centre Social Policy Research Unitwww.familycentre.org.nz
Multivariate Ordered Logit Model of Overall Wellbeing
0.3220.1679Home Owner (1 = yes)
<0.001***-0.9535Divorced or Separated
0.001***-1.1001Widowed
<0.001***-1.2670Single‡
0.091*0.5799Non-Home Assets over $2 million
0.9240.0350Non-Home Assets $1.5 million-$2 million
0.038**0.5814Non-Home Assets $1 million-$1.5 million
0.1150.3099Non-Home Assets $500,000-$1 million
<0.001***0.7677Non-Home Assets $250,000-$500,000
0.004***0.6079Non-Home Assets $100,000-$250,000
0.023**0.4894Non-Home Assets $50,000-$100,000
0.016**0.4902Non-Home Assets $0-$50,000†
0.049**0.0000019Income
0.001***-0.4081Gender (1 = male)
0.008***0.2317Age
p-valueCoefficientVariable
* significant at 10% level; ** significant at 5% level, ** significant at 1% level, † comparator group is those with no assets, ‡ comparator group is married or partnered people.
© The Family Centre Social Policy Research Unitwww.familycentre.org.nz
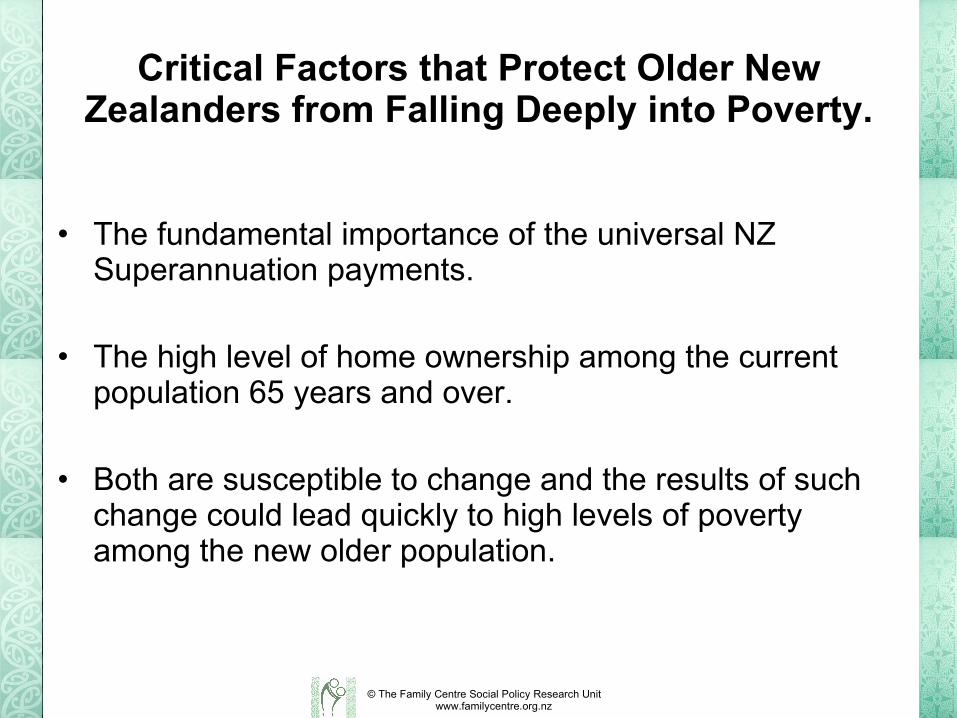
Critical Factors that Protect Older New Zealanders from Falling Deeply into Poverty.
• The fundamental importance of the universal NZ Superannuation payments.
• The high level of home ownership among the current population 65 years and over.
• Both are susceptible to change and the results of such change could lead quickly to high levels of poverty among the new older population.

© The Family Centre Social Policy Research Unitwww.familycentre.org.nz
Threats and Challenges for the ‘Baby-boomers’ as they Become Old
• NZS depends upon political will for its sustainability. • Debate continues about the level of payments, the age
of eligibility and current contributions into the New Zealand Superannuation Fund.
• The increasing trend of falling home ownership could present serious poverty problems if it continues.
• Mortgage free homes have been critical to preventing many older New Zealanders from dipping below the poverty threshold when they cluster so close to the internationally set poverty lines.
© The Family Centre Social Policy Research Unitwww.familycentre.org.nz
http://www.ewas.net.nz/Publications/filesEWAS/EWAS_M2.pdf
http://www.familycentre.org.nz/