midlatitude cyclones and thunderstorms - dorian j. … cyclones and thunderstorms before lab: ......
TRANSCRIPT

1
ESCI 1010 Lab 6 Midlatitude Cyclones and Thunderstorms Before Lab: Review pages 244-324 in your Weather and Climate textbook. Pay special attention to the sections entitled “Fronts”, “Life Cyclone of a Midlatitude Cyclone”, “An Example of a Midlatitude Cyclone”, and “Tornadoes”. Summary: This lab concentrates on identifying fronts, air masses, understanding the structure of midlatitude cyclones, and the basics on tornadoes and the typical weather ingredients necessary for large outbreaks of tornadoes. LAB EXERCISE 1. In the figure below, label the warm front, cold front, and dryline. Circle the general area where you would expect to find both warm temperatures and high dew points.
2
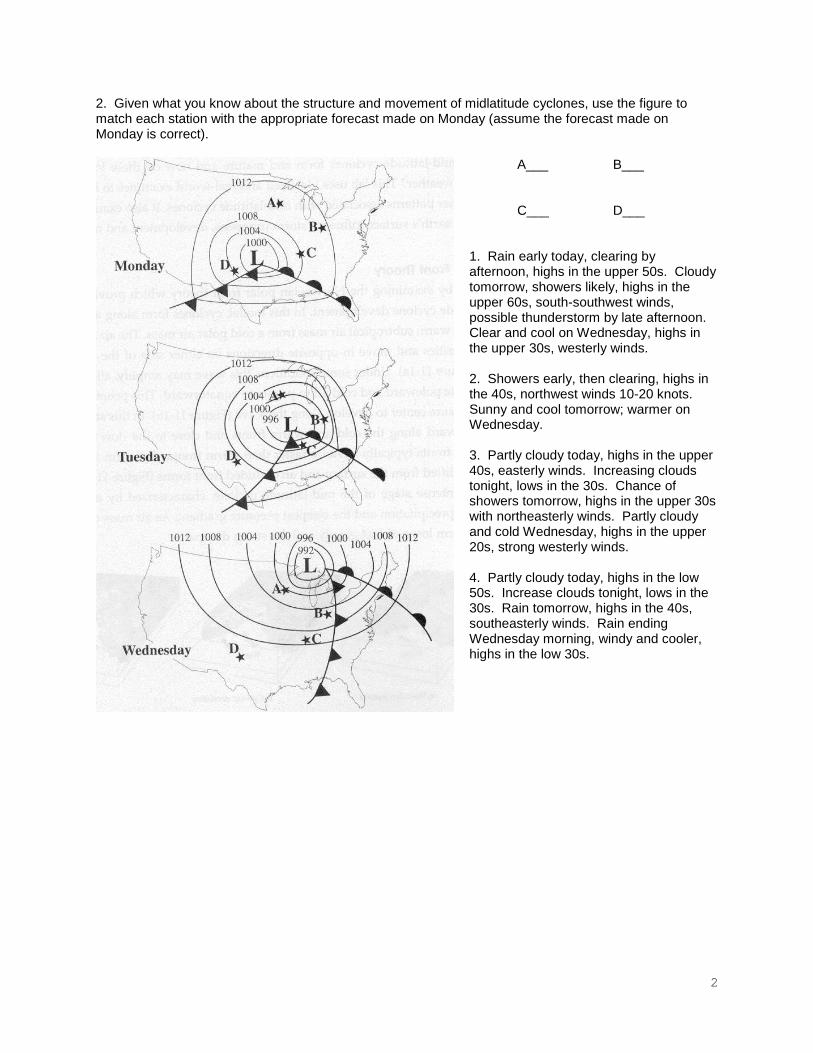
2. Given what you know about the structure and movement of midlatitude cyclones, use the figure to match each station with the appropriate forecast made on Monday (assume the forecast made on Monday is correct).
A___ B___ C___ D___
1. Rain early today, clearing by afternoon, highs in the upper 50s. Cloudy tomorrow, showers likely, highs in the upper 60s, south-southwest winds, possible thunderstorm by late afternoon. Clear and cool on Wednesday, highs in the upper 30s, westerly winds.
2. Showers early, then clearing, highs in the 40s, northwest winds 10-20 knots. Sunny and cool tomorrow; warmer on Wednesday.
3. Partly cloudy today, highs in the upper 40s, easterly winds. Increasing clouds tonight, lows in the 30s. Chance of showers tomorrow, highs in the upper 30s with northeasterly winds. Partly cloudy and cold Wednesday, highs in the upper 20s, strong westerly winds.
4. Partly cloudy today, highs in the low 50s. Increase clouds tonight, lows in the 30s. Rain tomorrow, highs in the 40s, southeasterly winds. Rain ending Wednesday morning, windy and cooler, highs in the low 30s.

3
3. The figures below are surface weather maps from Superstorm 1993, which produced blizzard conditions across much of the eastern U.S. Hurricane-force winds were also reported along with scattered tornadoes. Overall, the storm system killed 318 people. The weather maps have isobars (labeled in millibars), low pressure, high pressure, cold fronts, warm fronts, stationary fronts, and precipitation intensity (the darker the shaded area, the more intense the precipitation) all plotted for you. Use this information to answer the following questions:
6 p.m. CST, 12 March 1993
6 a.m. CST, 13 March 1993
6 p.m. CST, 13 March 1993
a. What happened to the intensity of the storm as it moved from the Gulf of Mexico north-northeast across the eastern United States? b. Note the path of Superstorm 1993 from the top to bottom in the figures on the left. This storm produced a copious amount of rain and snow across the eastern U.S. How could the path of the storm have an influence on the amount of precipitation that fell (hint: think about the sources for moisture)?

4
4. A tornado moved by a weather station at El Reno, OK on 24 May 2011. The wind and pressure data from the station is below. What happens to the wind speed, direction, and pressure as the tornado moves by? How is this relevant to the physical workings of a tornado?
5. On 27 April 2011, a major tornado outbreak occurred in the southeastern U.S. Note the wind barbs in the plot of the 7 p.m. CDT weather balloon data at Birmingham, Alabama below. What is happening to the wind direction and speed as you move upward? There is a meteorological name for this, what is it?
5
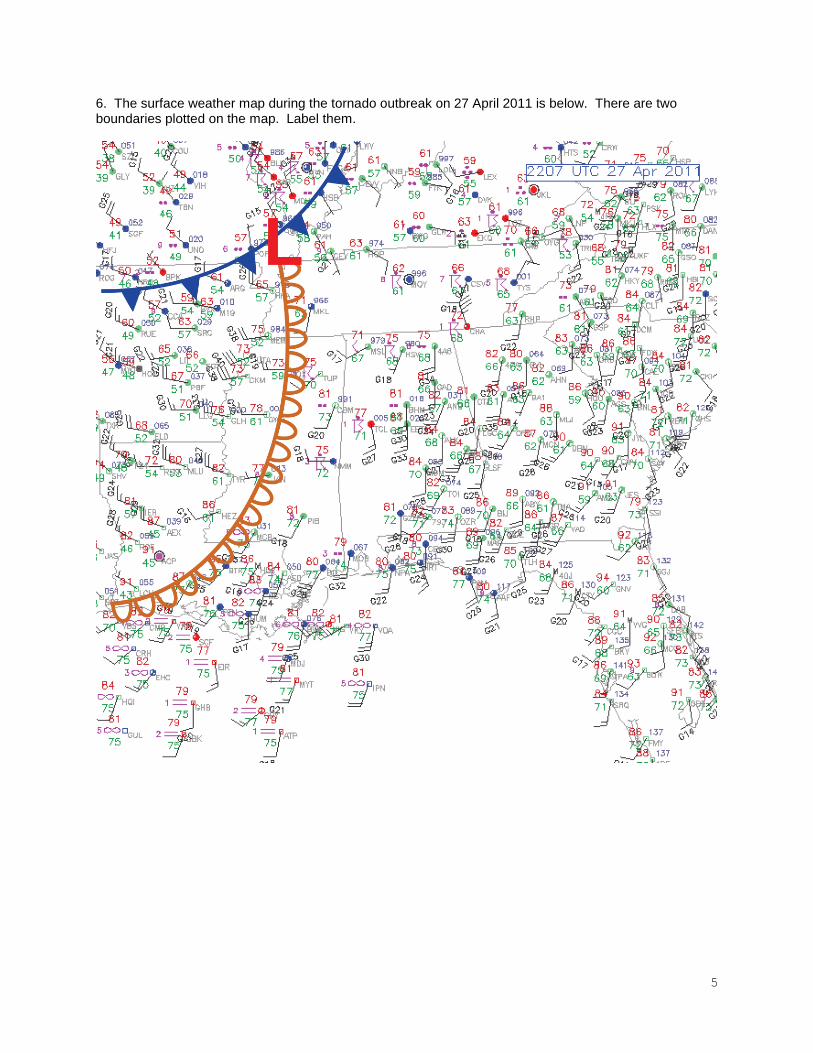
6. The surface weather map during the tornado outbreak on 27 April 2011 is below. There are two boundaries plotted on the map. Label them.

6
7. The 500 mb weather map from 7 p.m. CDT on 27 April 2011 is below. Label the trough of low pressure.
8. Referring back to the figure in question 7 above, where are the fastest winds in the jet stream located? 9. Referring to the figures in questions 5, 6, and 7 above, how did the surface and upper atmospheric conditions contribute to the day’s tornadoes (hint: remember the conditions needed for tornado formation)?