middle atmosphere density data and comparison with models
TRANSCRIPT

Adv. Space Res. Vol. 10. No. 6, pp. (6)17—(6)26. 1990 0273—1177/90 $0.00 + .50Printedin GreatBritain. 1989 COSPAR
MIDDLE ATMOSPHERE DENSITY DATAAND COMPARISON WITH MODELS
K. S. W. ChampionAir Force GeophysicsLaboratory, 1-lanscomAFB, MA 01731—5000,U.S.A.
ABSTRACT
Density data derived from measurements of the drag on twelve reentering Shuttlevehicles within the altitude range 40 to 97km have been compared with several models.There are no significant differences between the values of the several models, but theShuttle data for a number of flights are significantly different from the models.Possible reasons for this are discussed. The variation of density with latitude is, ingeneral, well represented by the models, but the seasonal dependence in the empiricalmodels needs to be improved. Some flights show marked departures from the models at thehigher altitudes (generally above 70km). Some possible causes of these departures,including convective activity and gravity waves, are discussed.
SHUTTLEREENTRYDENSITY DATA
Density data obtained from on—board accelerometers during the reentry of a number ofShuttle flights /1/ are presented and compared with several models. All these vehicleswere launched from the Kennedy Space Center, Florida. They all landed at Edwards AirForce Base, California, except for STS—3 which landed at White Sands Missile Range andSTS—ll which landed at the Kennedy Space Center. The flight numbers and landing times aregiven in the Table.
TABLE. STS FLIGHTS, LANDING LOCATIONS AND TINES
FLIGHT LANDING LOCATION DATE AND TINE
1 EE1~1ARDSAFB APR 14, 81, 1020 PST
2 EAFB NOV14, 81, 1325 PST
3 WHITE SANDSi~m MAR 30, 82, 0905 MST
4 EAFB JUL 04, 82, 0810 PST
5 EAFB NOV 16, 82, 0630 PST
6 EAFB APR 09, 83, 1055 PST
7 EAFB JUN 24, 83, 0600 PST
8 EAFB SEP 04, 83, 2340 PST
9 EAFB DEC 08, 83, 1545 PST
11 KENNEDYSPACE CENTER FEB 11, 84, 0715 EST
13 EAFB APR 13, 84, 0540 PST
14 EAFB - SEP 05, 84, 0540 PST
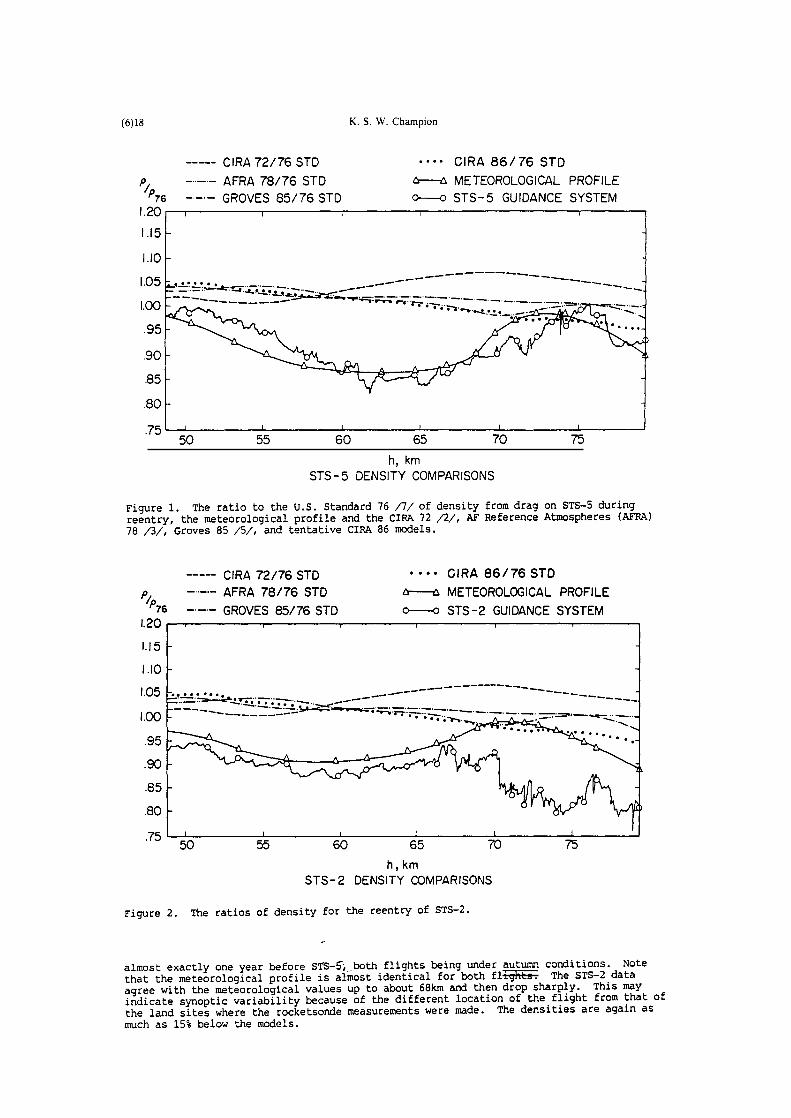
The data are not presented in chro~o1ó~ical order but in an order which demonstratesvariability and possible systematic variations with season and latitude. Figure 1 showsdata from STS—5. These data agree well with the meteorological profile developed fromradiosonde and rocketsonde data. The values are markedly lower than the models (up to 15%lower) between altitudes of 55km and 68km. Figure 2 shows data from STS—2 which reentered
(6)17
(6)18 K. S. W. Champion
CIRA72/76STD CIRA 86/76 SIDp,~ AFRA 78/76 STD a—~ METEOROLOGICAL PROFILE
GROVES 85/76 STD o—o STS—5 GUIDANCE SYSTEM1.20 I F
1.15
1.10.05 ~ —.~.
100 ~
~
h, kmSTS-5 DENSITY COMPARISONS
Figure 1. The ratio to the U.S. Standard 76 /7/ of density from drag on STS—5 duringreentry, the meteorological profile and the CIRA 72 /2/, AF Reference Atmospheres (AFRA)78 /3/, Groves 85 /5/, and tentative CIRA 86 models.
CIRA 72/76 STD ~“ CIRA 86/76 STDp1 ——-- AFRA 78/76 STD A—A METEOROLOGICAL PROFILE
GROVES 85/76 STD o—o STS-2 GUIDANCE SYSTEM
1.15
1.10
1.05 . —
(00 ~---- — -~
h, kmSTS-2 DENSITY ~0MPARISONS
Figure 2. The ratios of density for the reentry of STS—2.
almost exactly one year before s’i’S—S~both flights being under autumn conditions. Notethat the meteorological profile is almost identical for both flights. The STS—2 dataagree with the meteorological values up to about 68km and then drop sharply. This mayindicate synoptic variability because of the different location of the flight from that ofthe land sites where the rocketsonde measurements were made. The densities are again asmuch as 15% below the models.

Middle Atmosphere Density Data (6)19
STS—l reentered in April (spring) and the data are shown over an extended altituderange in Figure 3. The data agree well with the meteorological profile up to 85km. Abovethat altitude they follow the meteorological profile but up to 15% lower. The data agreewith the models near 50km and 95km, but at intermediate altitudes are lower—up to 25%lower at 86km. STS—l3 also reentered in April and the results are shown in Figure 4. Thedata are almost identical with those from STS—l arid again are lower than the models atmost altitudes, up to 30% at 86km. Another flight that reentered in April was STS—6. Theresults are similar to those from the other flights and show a low density at 86km. Abovethat altitude the data show rapid large scale fluctuations and it is not clear whetherthey are due to gravity waves or turbulence or to instrumental noise.
CIRA 72/76 STDAFRA 78/76 STD A—~METEOROLOGICAL PROFILE
CIRA 86/76 STD o—o STS—I GUIDANCE SYSTEM
1.40
1.30
(.20
~T6
h, km
STS-l DENSITY COMPARISONS (APRIL)
Figure 3. The ratios of density for the reentry of STS—l.
STS—3 reentered on March 30 at White Sands. It had a very low latitude trajectorywhich steadily increased from ll°N at 95km altitude to 33°Nat 46 km altitude. Theresults are shown in Figure 5. For comparison CIRA 72 /2/ models for 10°, 20°, and 30°latitude were used for the appropriate portions of the trajectory, AFRA 78 /3/ models for15° and 30° and tentative CIRA 86 models for 0°, 20°, and 30°. The data are again verysimilar to those of the other two spring flights, but the dip in relative density valuesis narrower in altitude range. It occurs at higher altitudes with a peak at 90km. Thismay demonstrate an effect due to latitude.
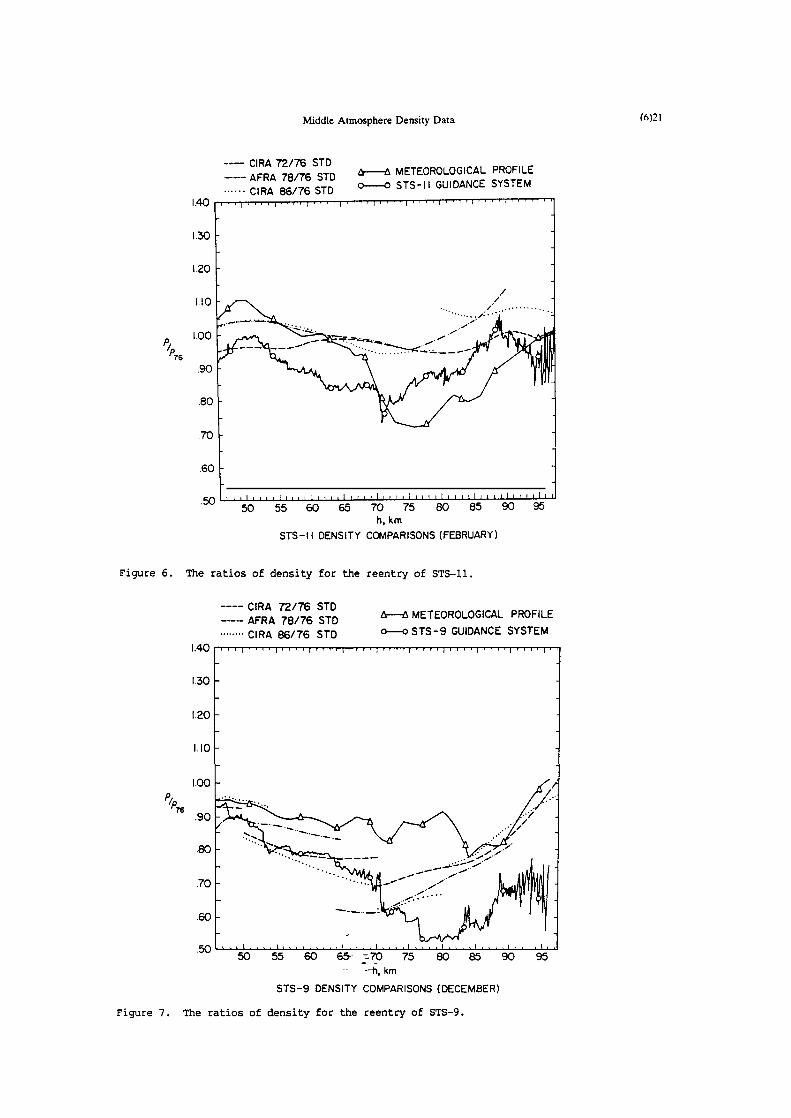
Figure 6 contains data from STS—ll. This was a winter flight with a low latitudereentry (20° to 25°N) culminating in a landing at Kehiiid~ Space Center. Themeteorological profile agrees with the vehicle data within about 10%. The models, ~ngeneral, follow the vehicle data, but show less of a dip between 60 to 75km, although theydo show an increasing density above 75km.
STS—9 results are given in Figure J. This vehicle reentered on December 8 (earlywinter) and constitutes one of the most interesting sets of data. The reason is thatreentry occurred at high latitudes ovet the northern pacific Ocean. During reentry, thevehicle passed through latitudes ranging-from 57°Nat 85km to 28°Nat 40km. Themeteorological profile matches the 40° latitude models at low altitudes and the 60° modelsat high altitudes. At intermediate altitudes, the meteorological profile is too high. Itlooks as if it may have been determined from 40° latitude data for this altitude region.The 5TS—9 data match the 40° models at low altitudes, the 50° models at intermediatealtitudes and the 60°models near 70km. In this altitude region it cart be seen that the

(6)20 K. S. W. Champion
CIRA 72/76 STD CIRA 86/76 STD— —-- AFRA 78/76 SID o—o STS-13 GUIDANCE SYSTEM
I.40
1.30
I.20
100
50 55 60 65 70 75 80 85 90 95h, km
STS-I3 DENSITY COMPARISONS (APRIL)
Figure 4. The ratios of density for the reentry of STS—l3.
CIRA 72/76 STDAFRA 78/76 STD A—~METEOROLOGICALPROFILECIRA 86/76 STD 0—c STS-3 GUIDANCE SYSTEM
1.40
1.30
1.20
~ 100
h,kmSTS-3 DENSITY COMPARISONS (MARCH)
Figure 5. The ratios of density for the reentry of STS—3.
Middle Atmosphere Density Data (6)21
CIRA 72/76 STD
AFRA 78/76 STD A—A METEOROLOGICAL PROFILECIRA 86/76 STD 0—O STS-II GUIDANCE SYSTEM
I.40
.30
.20
P76 I~0~:~ ...
5() 11111111 IllIllIllIlI 1111,1111 11111,11111 III!! III
50 55 60 65 70 75 80 85 90 95
h, kmSTS-I I DENSITY COMPARISONS (FEBRUARY)
Figure 6. The ratios of density for the reentry of STS—ll.
CIRA 72/76 STDAFRA 78/76 STO A—A METEOROLOGICAL PROFILECIRA 86/76 STD o—0STS-9 GUIDANCE SYSTEM
1.1.0
.30
1.20
1.10
P/PTh 100
—h,km
STS-9 DENSITY COMPARISONS (DECEMBER)
Figure 7. The ratios of density for the reentry of STS—9.

(6)22 K. S. W. Champion
A~A78/76STD A—A METEOROLOGICAL PROFILECIRA 86/76 STD o—o STS-7 GUIDANCE SYSTEM
1.40 I~I~’ I
1.30
1.20
~76 110
h, km
STS—7 DENSITY COMPAR SCNS (JUNE)
Figure 8. The ratios of density for the reentry of STS—7.
change in density ratio with altitude is primarily due to the change in density withlatitude. Above 75km (near Alaska) the data are 12 to 24% below the models. The reasonsfor this could be that the data show the effects of high latitude particle precipitation,auroral activity or a high latitude low atmosphere storm.
Results from STS—7, which reentered through mid—latitudes on June 24 (summer flight)are given in Figure 8. Up to 90km the vehicle data agree with the meteorological profileand the models to within 10%. Above 90km there is a sharp drop in the vehicle data and at94km they are about 25% below the models and meteorological profile. Figure 9 containsresults from STS—8 which reentered through mid—latitudes on September 4. The data agreereasonably well with the models and meteorological profile at all altitudes. The biggestdeparture is between 78 and 84km where the data are about 10% low. Results from STS—l4,which reentered through mid—latitudes art September 5, are given in Figure 10. The dataare generally close to the meteorological profile but near 90km there is a small (inaltitude) dip which is about 20% below the models.
Qualititatively the density departures observed in all these flights are similar tothose in Figure 11, which is from the U.S. Standard Atmosphere Supplements 1966 /8/, butthere are significant differences. It is now possible to develop different curves forspring and autumn, including at low.- and mid—latitudes. At these latitudes, thedepartures are larger for autumn and winter and much larger for spring than in the 1966curves. At high latitudes in winter, the negative departures are about the same magnitudebut occur at higher altitudes. This phenomenon may be due to joule heating or particleprecipitation. All the summer flights reentered near 30°Nlatitude. The density valuesare close to the Standard at altitudes up to about 83 to 87km, depending on the flight andexcept for flight 4. Flights 7, 14, and 4 had maximum negative departures of 20 to 25%within the altitude region 87—94km. Flight 8 had a maximum negative departure of 13% at84km. These negative values occur at lower altitudes than in Figure 11.
- CONVECTIVE EFFECTS
The data for STS—4 are considered separately because they exhibit unusual properties.This spacecraft reentered at low latftudes over the central Pacific Ocean on July 4, 1982.The data for this flight are given iñFigure 12. They exhibit large scale fluctuationsfrom the highest altitude of the data (97km) down to 70km. This is unique among the datasets considered. At altitudes between 48 and 69km, the data are within about +5% of themodels. Between 70 and 80km they exhibit marked fluctuations in the range +4% to —16%.Above 80km the fluctuations increase to +6% to —20%.

Middle Atmosphere Density Data (6)23
CIRA 72/76 STD— - - AFRA 78/76 STD A—A METEOROLOGICAL PROFILE
CIRA 86/76 STD O—O STS-8 GUIDANCE SYSTEM1.40
1.30
1.20
h,kmSTS-8 DENSITY COMPARISONS (SEPTEMEER)
Figure 9. The ratios of density for the reentry of STS—8.
CIRA 72/76 STD
AFRA 78/76 STD A—A METEOROLOGICAL PROFILECIRA 86/76 STD o—o STS-14 GUIDANCE SYSTEM
1.40
1.30
.20
1.10 ........~.
~76 100
..., .h,kmSTS-I4 DENSIT’(COMPARISONS(SEPTEMBER)
Figure 10. The ratios of density for the reentry of STS—l4.

(6)24 K. S. W. Champion
U.S. STANDARD ATMOSPHERE SUPPLEMENTS, 1966
I2O~ ~ 3O~N “R,j~, ~——A—-—~-5~~:.\LII ~5~,,Ae, oo~N ~
i’±’~~~__ __•/ S S
80 — ~ —/-- — _(~•Z Cold Meo r,v,_____
A,n~oI Jon o~yJ~Iy J0n40,y J41y .~ Jonoory JolyE70~_\~ -~-~-_ _—__
~6O~1_ ~L
—+— —-~--.--i---40 ~ —*~— ~
30——— _2~L~_ _~/~L_ —
I ~1~
‘S. 2/I’20 — -s.-~ - ~j~t-._ .j ~1- ‘~
10/ 4~ ~
—20 0 20 —20 ‘0 2040 — 40~O ~,20~0 60 —40 200 20 4O~O
Figure 11. Departures of Supplementary Atmosphere densities from the Standard.
CIRA 72/76 STD ~IRA 86/76 STD—. —- AFRA 78/76 STD o—~METEOROLOGICAL PROFILE
— GROVES 85/76 570 0—c STS -4 GUIDANCE SYSTEM1.20
5, kmSTS-4 DENSITY COMPARISONS
Figure 12. The ratios of density for the reentry of STS—4.
To investigate a possible convective activity origin of the major fluctuations in drag(and presumably density) on STS—4 as it reentered over the Pacific Ocean sets of cloudphotographs and humidity data were obtained for the appropriate time, and also a verticalprofile of density based on satellite remote sounding temperature data and models wasobtained. The data were obtained from NQAAand ETAC. The cloud photographs (Figure 13)show extensive heavy cumulus to the south and north of the region of interest and alsounderneath the trajectory between 160° and 165°E and 18° to 20°N, both the day before andthe day after the vehicle passage—at-about 0240 LT, July 5 (1540 G!IT, July 4). Thehemispheric cloud photographs do notihave enough resolution to show individual localizedstorms, but a more detailed record shows eight/eighths coverage at middle altitudes(6,500—20,000 ft) of, presumably, alto cumulus at 169 to l70°W and latitude 28°Nat 1500GMT, which was under the trajectory, which had an altitude of 2SOkft (76.2km) at thattime. The humidity data show that the atmosphere was saturated near the cloud tops(20kft) and the relative humidity at the surface was 93%. The atmosphere contained large
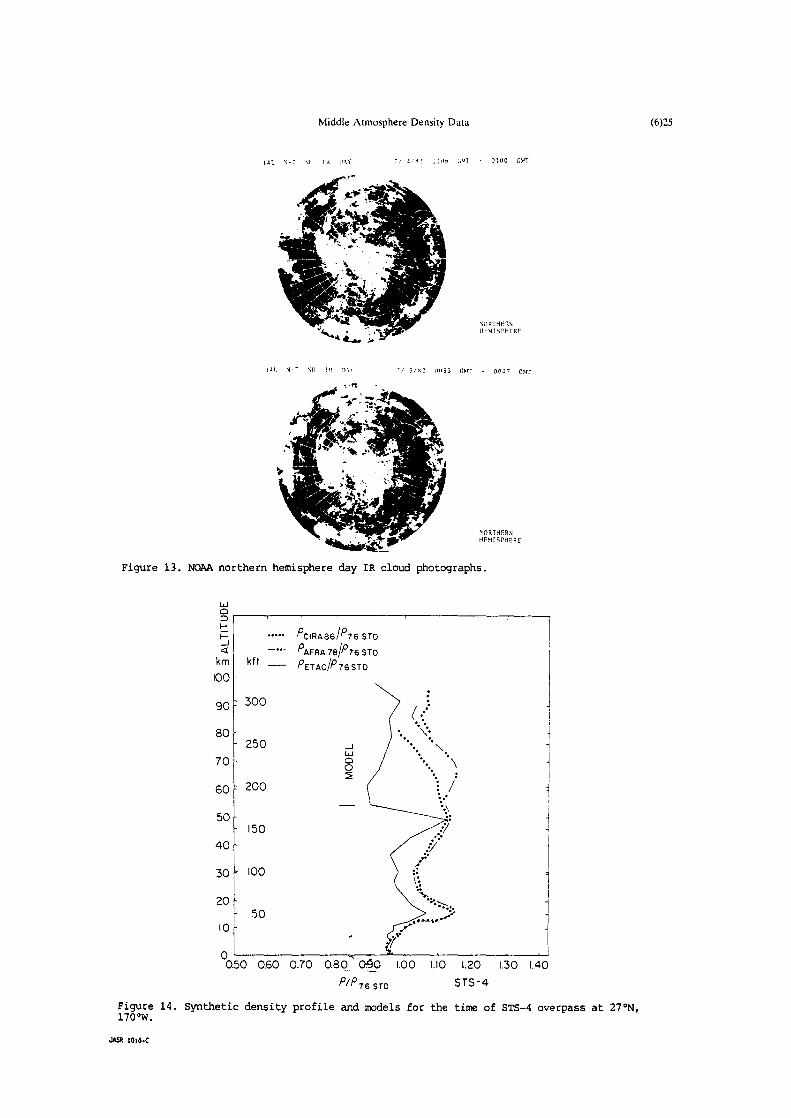
Middle Atmosphere Density Data (6)25
1~L ~ ‘rh IR ~\R 4 s: I ly Jr.4~ . 0100 GRIT
~~RE
III. \.~ ‘IL ILL 44.1 4. ‘~ (1454. GRIT . 0047 GRIT
4.0STIlE RN
HF 111 S GRE S
Figure 13. NOAA northern hemisphere day IR cloud photographs.
LoJ0 _____________________________________
—
I—IRA 86 I~’76 STD
_J~~AFRA78/P76STD
km kit — PETAC/P76STD
100
90 300
80 \.. ~:250 ~ /•.~
70
60 200 ~../f
50 -,_
ISO
3Q 100
20 ~
50 ~
-
0.50 0.60 0.70 O.8Q0~0 1.00 1.10 .20 1.30 1.40
~‘~76STD STS-4
Figure 14. Synthetic density profile and models for the time of STS—4overpass at 27°N,
170°w..1626 10:6-C

(6)26 K. S. W. Champion
amounts of precipitable water from the surface to 5,000 ft. Thus extensive tropical stormactivity under arid near the shuttle reentry path may have been a cause of high altitudegravity waves and turbulence.
The vertical density profile in Figure 14 is for 27°N, 170°Wat 1500 GMT, July 4. Upto l00kft it is based on analysis fields, from that altitude to l8okft it is based onsatellite remote sounding temperature data and above that altitude on a modified modelfrom the U.S. Standard Atmosphere Supplements 1966. Obviously from the sources of theinput there is considerable smoothing of the profile, but it does show a large amplitudeoscillation between 120 and l80kft, which is the upper limit of the data. Themeteorological profile provided for this flight shows marked (but obviously smoothed)oscillations above 24Okft (73km). These waves and associated turbulence are probablycaused by convective storm activity.
CONCLUSIONS
Density data derived from measurements of the drag on twelve reentering Shuttlevehicles within the altitude range 46 to 97km have been compared with several models. Ingeneral the values are lower or about the same as the models. If these data arerepresentative, either the drag coefficient should be changed or the models. Thevariation of density with latitude is, in general, well represented by the models. Thedata show that the seasonal dependence in empirical models can be improved. Some flightsshow density changes or fluctuations at altitudes about 70km. These variations are moremarked above 85km. Some fluctuations:
Suggest model changes.Correlate with convective storms or high latitude heating.Due to gravity waves or turbulence.Due to atmosphericsynoptic or temporal variability.
REFERENCES1. K.S.W. Champion, Middle AtmosphereModels and Comparison With Shuttle Reentry DensityData, Mv. Space Res.7, %lO, 77 (1987)
2. COSPARInternational Reference Atmosphere (CIRA) 1972, Akademie Verlag, Berlin, GDR(1972)
3. A.E. Cole and A.J. Kantor, Air Force ReferenceAtmospheres,AFGL—TR—78—0051, ADA058505 (1978)
4. J.J. Barnett and M. Corney, A Middle Atmosphere Temperature Reference Model fromSatellite Measurements, Adv. Space Res. 5, *7, 125 (1985)
5. G.V. Groves, A Global Reference Atmosphere from 18 to 80km, AFGL—TR—85—0l29,ADA162499 (1985)
6. G.V. Groves, Modeling of Atmospheric Structure, 70—130km, AFGL—TR—87—0226,Air ForceGeophysicsLaboratory, HanscomAFB, M~,USA (1987)
7. COESA, U.S. Standard Atmosphere 1976, U.S. Government Printing Office, Washington, DC(1976)
8. COESA, U.S. Standard Atmosphere Supplements 1966, U.S. GovernmentPrinting Office,Washington, DC (1966)