mid san joaquin river regional flood management plan
TRANSCRIPT

R E G I O N A L F L O O D M A N A G E M E N T P L A Nf o r t h e M i d S a n J o a q u i n R i v e r R e g i o n
N o v e m b e r 2 0 1 4
P r e p a r e d f o r :R e c l a m a t i o n D i s t r i c t 2 0 9 2 a n d S t a n i s l a u s C o u n t y


R E G I O N A L F L O O D M A N A G E M E N T P L A Nf o r t h e M i d S a n J o a q u i n R i v e r R e g i o n
N o v e m b e r 2 0 1 4
P r e p a r e d f o r :R e c l a m a t i o n D i s t r i c t 2 0 9 2 a n d S t a n i s l a u s C o u n t y


Acknowledgements
F u n d e d b y t h e C a l i f o r n i a
D e p a r t m e n t o f W a t e r R e s o u r c e s
S t a k e h o l d e r s
Jeff Adney, Stanislaus County OESMiguel Alvarez, City of ModestoJim Alves, City of ModestoChester Anderson, East and West Stanislaus RCDJoel Andrews, City of PattersonLaura Anhalt, City of Modesto/RD 2091John Ayres, GEISue Baldwin, RD 2063 (Crows Landing)Mike Barkley, Candidate for Congress California District 10, StanislausDan Bernaciak, Stanislaus CountyTodd Bernardy, DWR CVFPOJames Bogetti, Mapes RanchMichael Brinton, City of CeresBrigid Briskin, USACEDale Butler, Latino Emergency CouncilRobert Caetano, RD2091 Unit #2 (Gomes Lake)Malvern CanellJohn Carlon, River PartnersChuck Carlson, CaltransAshley Casey, GEIIsabelle Chhit, City of ModestoJohn Clerici, URSJames Coddington, RD 2101 (Blewett)Ron CornellJoe Countryman, Central Valley Flood Protection BoardTim Crummett, USACEMatthew Danielczyk, AUDUBON CALIFORNIA

John Davids, Modesto Irrigation DistrictJerry Dion, River PartnersVince Dykzeul, Central San Joaquin Flood ControlBill Edgar, DWR CVFPBMaria Encinas, City of PattersonBob EndeleyS. Greg Farley, DWRKim Forrest, U.S. Fish and Wildlife ServiceCindy Fosi, RD 2091David Funk, City of TurlockTerri Gaines, DWRLarry Gilley, City of TurlockMonica Gutierrez, US Fish and WildlifeKristin Guy, USDA NRCSMasis Hagobian, Congressman Denham’s OfficeMeredith Harvan, DWRTou B. Her, Turlock Irrigation DistrictJames Herota, Central Valley Flood Protection BoardJeff Holt, River PartnersKen Irwin, City of PattersonKoosun Kim, City of NewmanBrad Koehn, Turlock Irrigation District (TID)Patrick Koepele, Tuolumne River TrustDan Lamb, RD 2091 (Chase)Ryan Larson, USACEDavid Leamon, Stanislaus CountyAbimael (Abi) Leon, CDFW Region 4Carrie Loschke, WSID/PIDBill Loudermilk, Resource Conservation SolutionsWilliam Lyons, Jr, RD 2031 (Elliot)Matt Machado, Stanislaus CountyDan Madden, City of TurlockDaron McDaniel, Congressman Denham’s officeJanis Mein, DERRon Melcer, DWRAlbert Mendes, RD 2063 (Crows Landing)Perfecto Millan, City of NewmanDoug Miller, Senator Tom Berryhill's OfficeMike Mirmazaheri, GEI ConsultantsChristopher Neudeck, Kjeldsen, Sinnock & Neudeck, Inc., RDsKyle Noderer, California Office of Emergency ServicesGreg Nunes

Milton O'Haire, Stanislaus Agricultural CommissionerTom Orvis, Stanislaus County Farm BureauBob Ott, RD 2092Kevin Padway, Congressman Denham's OfficeTim Payne, TIDTim Pelican, Stanislaus County Agriculture DepartmentLance Perry, Newman Waste Water PlantDavid Pesavento, DWRMary Pitto, Rural County Representatives of CaliforniaJulie Rentner, Reclamation District 2092 (Dos Rios)Martin Reyes, RD 2031 and RD2092Garner Reynolds, City of NewmanPeter Rietkerk, Patterson Irrigation DistrictCameron Ripley, URSDan Roberts, RD 1602 (Del Puerto)Larry Rodriguez, GEI ConsultantsPaul Romero, DWRJoe Sallaberry, RD 2063 (Crows Landing)Emily Sheldon, Oakdale Irrigation DistrictJohn Shelton, CDFWStephen Sheppard, RD 2092Ran Singh, DWRBrian Smith, DWRDebra Thrasher, Stanislaus OESVictorio Tostado, Patterson Waste Water PlantEric Tsai, DWRRob Tull, CH2MHillIngrid Verastegui, City of ModestoMike Villines, Central Valley Flood Protection BoardDoug Weinrich, Sacramento Fish and Wildlife OfficeToby Wells, City of CeresMonique Wilbur, DWRMike Willett, City of PattersonMike Wright, Central Valley Flood Protection Board

P r o j e c t T e a m
Julie Rentner, Secretary, Reclamation District 2092David Leamon, Deputy Director Development Services and Traffic Engineering, Stanislaus CountyPaul Romero, P.E., Supervising Engineer, DWRS. Greg Farley, P.E., Senior Engineer, DWR
Consultant Team Betty Andrews, P.E., Project Director, ESAHarriet Lai Ross, Project Manager, ESAMinta Schaefer, Deputy Project Manager, ESAPam Jones, Senior Associate, Kearns &WestKathryn Cox, Associate, Kearns &WestChester Anderson, East andWest Stanislaus Resource Conservation DistrictDave Peterson, P.E., Peterson Brustad, Inc.Charles Hilliard II, EIT, formerly with Peterson Brustad, Inc.Loren Bottorff, P.E., Peterson Brustad, Inc.Jesse Patchett, P.E., CFM, formerly with Peterson Brustad, Inc.Ron Baldwin, formerly with Peterson Brustad, Inc.

Contents i
Contents List of Acronyms
Executive Summary
1. Introduction 1-1 1.1 Purpose 1-2 1.2 Process 1-2
1.3 Stakeholder Engagement 1-2 1.4 Document Overview 1-4
2. Regional Setting 2-1 2.1 Introduction 2-1
2.2 Regional Overview 2-2 2.3 Flood Management 2-10 2.4 Ecologically Sensitive Areas, Existing Habitat, and Recreation 2-17
2.5 Protected Populations and Assets 2-25 2.6 Emergency Response/Public Safety 2-34 2.7 Agricultural Land Management and Water Quality 2-34
2.8 Integrated Regional Water Management Planning 2-35
3. Flooding and Flood Hazards 3-1 3.1 Introduction 3-1 3.2 Flood History of the San Joaquin River Basin 3-2
3.3 Entities with a Role in Flood Management 3-18 3.4 Emergency Response/Public Safety 3-23 3.5 Delineated Floodplain Boundaries 3-24
3.6 Channel Conveyance Capacity and Flood Forecast Monitoring Network 3-31 3.7 Levee Conditions 3-33 3.8 Identified Flooding and Flood Hazards 3-39
3.9 Flood Management Improvement and Integration Opportunities 3-49

Mid San Joaquin River RFMP
ii Contents
4. Emergency Response 4-1 4.1 Introduction 4-1
4.2 Background 4-1
4.3 Flood Response 4-2
4.4 Response Issues 4-12
4.5 Opportunities 4-13
4.6 General Findings 4-15
4.7 Specific Recommended Projects 4-16
5. Operations & Maintenance 5-1 5.1 Introduction 5-1
5.2 Background 5-1
5.3 General Findings 5-2
5.4 General Recommendations for Improving O&M 5-3
6. Land Use and Environmental Enhancements 6-1 6.1 Introduction 6-1
6.2 Past, Present, and Future Land Use 6-2
6.3 Potential Environmental Enhancements 6-15
6.4 Flood Management and Environmental and Recreational Enhancement Linkages 6-17
7. Proposed Regional Improvements 7-1 7.1 Introduction 7-1
7.2 Project Descriptions 7-1
7.3 Project Concepts 7-7
8. Regional Priorities 8-1 8.1 Introduction 8-1
8.2 Prioritization Criteria 8-2
8.3 Application of Prioritization Criteria 8-4
8.4 Summary of Screening and Ranking Outcomes 8-4
9. Regional Financial Plan 9-1 9.1 Introduction 9-1
9.2 Methodology and Assumptions 9-1
9.3 Financial Challenges 9-3
9.4 Available Funding Sources 9-4
9.5 Project Cost Share 9-8
9.6 Findings 9-8
9.7 Recommendations for Future Bond Funding 9-11
10. Outlook for the Future 10-1 10.1 Planning Area in 2014 10-1
10.2 Planning Area in 2014+ 10-2
11. References 11-1
Appendices
A Mid San Joaquin River Region Regional Flood Atlas - Draft B Charter C Engagement Record D Flood Emergency Response Assessment Technical Memorandum E Operations and Maintenance Assessment Technical Memorandum F Project Descriptions and Evaluations G Project Concept Descriptions H Financial Plan Technical Memorandum

Mid San Joaquin River RFMP
Contents iii
List of Figures
2-1 Mid San Joaquin River Region Boundaries 2-3 2-2 Historic Channels of the San Joaquin River Corridor 2-7 2-3 Cal-Adapt Data for Stanislaus County 2-9
2-4 Water and Irrigation Districts in Stanislaus County 2-11 2-5 SPFC and Local Flood Control Facilities 2-16 2-6 Managed Environmental Lands and Riparian Vegetation 2-20
2-7 Potential Floodplain Restoration Areas 2-23 2-8 Mid SJR Region Population 2-27 2-9 Expected Annual Damages from Flooding in the Mid SJR Region 2-29
2-10 Major Water Diversion Facilities 2-30 2-11 Mid SJR Region Protected Assets 2-32 3-1 Major Flood Control Infrastructure within the San Joaquin River Basin 3-5
3-2 Detailed View of Flooding Extent 1983 3-7 3-3 Detailed View of Flooding Extent 1986 3-10 3-4 Detailed View of Flooding Extent 1995 3-12
3-5 Detailed View of Flooding Extent 1997 3-15 3-6 100- and 500-year FEMA Floodplain within Planning Area 3-25 3-7 San Joaquin River Basin Floodplain Delineations 3-28
3-8 Central Valley Floodplain Evaluation and Delineation Program Boundaries 3-29 3-9 Designated Floodways 3-30 3-10 NULE Levee Segments within the Mid SJR Region 3-35
3-11 Locations of Other Past Levee Performance Problems 3-38 3-12 General Plan Land Uses within the 100- and 500-year FEMA Floodplain 3-41 3-13 2010 Stanislaus County – Dam Inundation Hazard 3-51
6-1 General Plan Designations and 100- and 200-year Floodplains 6-9 6-2 Zoning Designations and 100- and 200-year Floodplains 6-10 6-3 Williamson Act Lands 6-11
7-1 Project Locations 7-2 8-1 Prioritization Process 8-2
List of Tables
2-1 Rivers and Creeks in Planning Area 2-5
2-2 Discharge-Frequency Relationships for Rivers and Creeks Within Planning Area 2-13 2-3 San Joaquin River Basin Flood Management Dams and Reservoirs 2-14 2-4 Conservation Plans Relevant to Planning Area 2-24
2-5 Mid San Joaquin River Region Population 2-26 2-6 Population of Cities and Communities in Planning Area 2-26 2-7 Population and Assets within 100- and 500-year Floodplains in Stanislaus County 2-26
2-8 Mid San Joaquin River Region Land Use 2-28 2-9 Orestimba Creek 500-year Floodplain Structure Inventory and Property Values 2-33 3-1 San Joaquin River Basin Flood Control Infrastructure 3-3
3-2 1983 Flood Damages Sustained and Prevented 3-8 3-3 1986 Flood Damages Sustained and Prevented 3-9 3-4 1995 Flood Damages Sustained and Prevented 3-13
3-5 1997 Levee Breaches, Seepage, Boils, and Erosion in Mid SJR Region 3-14 3-6 1997 Flood Damages Sustained and Prevented 3-17 3-7 Rehabilitation Assistance under PL 84-99 After 1997 Flood 3-18
3-8 Facilities Maintained by Mid SJR Region LMAs 3-20 3-9 Stanislaus County Flood Management 3-21 3-10 Flood Emergency Responders, Mid SJR Region 3-24
3-11 Flood Stage Categories along the San Joaquin, Merced, Tuolumne, and Stanislaus Rivers 3-32

Mid San Joaquin River RFMP
iv Contents
List of Tables (continued)
3-12 NULE Hazard Categories Assigned to Levees within Mid SJR Region 3-34 3-13 Other Past Levee Performance Problems 3-37 3-14 Area Covered by Land Use Types within 100-year Floodplain in Mid SJR Region 3-43
3-15 Population and Assets within 100- and 500-year Floodplains in Stanislaus County 3-43 3-16 Stanislaus County Flood Hazard Exposure 3-44 4-1 Mid SJR Region Reclamation Districts 4-3
4-2 Indicators of Flood Flight Readiness 4-8 4-3 Level of Public Safety Operations Readiness 4-10 5-1 LMA Expenditures and Funding Sources 5-3
6-1 Mid San Joaquin River Region Land Use 6-3 6-2 Land Use in Planning Area 6-3 6-3 California Almond Production by County 6-5
7-1 Summary of Proposed Regional Improvements 7-3 7-2 Project Concepts 7-7 8-1 Screening and Ranking Scores 8-5
9-1 LMA Expenditures and Funding Sources 9-3 9-2 Assessment Analysis 9-6

List of Acronyms v
List of Acronyms 2000 Census United States 2000 Census of Population and HousingAB156 Assembly Bill 156Atlas Mid San Joaquin River Regional Flood AtlasBFE base flood elevation (associated with 1% or 100 year flood event)BMP Best Management PracticeBWFS Basin wide Feasibility StudiesCal OES Governor’s Office of Emergency ServicesCCID Central California Irrigation DistrictCCR California Code of RegulationsCDC California Department of ConservationCDF California Department of FinanceCDFW California Department of Fish and Wildlifecfs cubic feet per secondCNDDB California Natural Diversity DatabaseCNRR California Northern RailroadComprehensive Study Sacramento and San Joaquin River Basins Comprehensive StudyCVBJ Central Valley Business JournalCVFPB Central Valley Flood Protection BoardCVFMP Program Central Valley Flood Management Planning ProgramCVFPP Central Valley Flood Protection PlanCVHE Central Valley Habitat ExchangeCVHS Central Valley Hydrology StudyCVRWQCB Central Valley Regional Water Quality Control BoardCV SALTS Central Valley Salinity Alternatives for Long Term SustainabilityCWC California Water Code

Mid San Joaquin River RFMP
vi List of Acronyms
DOI United States Department of the InteriorDPR California Department of Parks and RecreationDWR California Department of Water ResourcesEOP Emergency Operations PlanEPA Environmental Protection AgencyESA Endangered Species ActETL Engineering Technical LetterF BO Forecast Based OperationsF CO Forecast Coordinated OperationsFCSSR Flood Control System Status ReportFEAT Flood Emergency Action TeamFEMA Federal Emergency Management AgencyFIRM Flood Insurance Rate MapFIS Flood Insurance StudyFSRP Flood System Repair ProjectGAR Geotechnical Assessment ReportGLPP Gomes Lake Pumping PlantGrasslands WMA Grasslands Wildlife Management AreaI 5 Interstate 5ICS Incident Command SystemID Irrigation DistrictIRWM Integrated Regional Water ManagementIWRIS Integrated Water Resources Information SystemJPA Joint Powers AgreementLAT Levee Assessment ToolLCM Life Cycle ManagementLD Lacking Sufficient DataLFPZ Levee Flood Protection ZoneLHMP Local Hazard Mitigation PlanLiDAR Light Detection and RangingLMA Local Maintaining AgencyMerced ID Merced Irrigation DistrictMerced NWR Merced National Wildlife RefugeMID Modesto Irrigation DistrictMid SJR Region Mid San Joaquin River Regionmsl mean sea levelNA Named AreaNFIP National Flood Insurance ProgramNIMS National Incident Management SystemNRCS Natural Resources Conservation ServiceNSA Non Structural AlternativeNULE Non Urban Levee Evaluation

Mid San Joaquin River RFMP
List of Acronyms vii
NWS National Weather ServiceO&M Operations and MaintenanceOCFCD Orestimba Creek Flood Control DistrictOES Office of Emergency ServicesPBI Peterson Brustad, Inc.PIER Public Interest Energy ResearchPlanning Area Mid San Joaquin River RegionPOI Point of InterestPSP Proposal Solicitation PackageRAMP Regional Advance Mitigation MonitoringRD Reclamation DistrictRefuge Complex San Luis National Wildlife Refuge ComplexRFMP Regional Flood Management PlanSB5 Senate Bill 5SEMS Standardized Emergency Management SystemSFHA Special Flood Hazard AreaSPFC State Plan of Flood ControlSJRNWR San Joaquin River National Wildlife Refuge ComplexSPRR Southern Pacific RailroadSRA State Regional AreaSTANCOG Stanislaus Council of GovernmentsTDS total dissolved solidsTID Turlock Irrigation DistrictTNC The Nature ConservancyTRRP Tuolumne River Regional ParkWSE water surface elevationWIWRP Westside Integrated Water Resources PlanWWTP Wastewater Treatment PlantULOP Urban Level of Flood ProtectionUSACE United States Army Corps of EngineersUSBR United States Bureau of ReclamationUSFWS United States Fish and Wildlife ServiceUS Census Bureau United States Census Bureau

Mid San Joaquin River RFMP
viii List of Acronyms
This page intentionally left blank

Where is the Mid San Joaquin River? The Regional Flood Management Plan (RFMP) for the Mid San Joaquin River (Mid SJR) Region planning area includes the floodplain corridor extending along the mainstem San Joaquin River from its confluence with the Merced River to its confluence with the Stanislaus River, the lower reaches of each of the major tributaries (the Merced, the Tuolumne, and the Stanislaus Rivers) that are protected by facilities within the State Plan of Flood Control (SPFC), and additional floodplain areas that have a nexus to the SPFC, as shown on Figure 1 below.
What is the purpose? The purpose of the RFMP is to develop and articulate a flood-safe vision for the Mid SJR Region that is both practical and ambitious in reshaping the status quo with regards to flood management.
What are the goals of the RFMP? The goals of the RFMP are consistent with the Central Valley Flood Protection Plan goals of improving flood risk management, improving operations and maintenance, promoting ecosystem functions, improving institutional support, and promoting multi-benefit projects.

How was the RFMP developed? Development of the RFMP process was co-led by Reclamation District (RD) 2092 and Stanislaus County. An 18-month public stakeholder engagement process was held from April 2013 to September 2014 where stakeholders were invited to participate in plan development. A total of eight public workshops were held to solicit input on all aspects of plan development. In addition, several briefings of local governments and special interest groups were made to inform various agencies and groups of the process and to gather input.
Who was involved? In addition to RD 2092 and Stanislaus County, a host of stakeholders from the region, including agricultural representatives and agricultural landowners, non-agricultural landowners and developers, public agencies, elected officials, environmental and conservation organizations, community groups (particularly those involved in emergency services), educational institutions, and representatives of low-income and/or at-risk populations, particularly those that may be impacted by flooding, contributed to the content of this plan through their participation.
Who has flood management responsibilities in the planning area? Federal and State agencies such as the Central Valley Flood Protection Board, US Army Corps of Engineers, State Department of Water Resources and US Bureau of Reclamation; irrigation districts that include Merced, Turlock and Modesto; nine Local Maintaining Agencies (Reclamation Districts 1602, 2031, 2063, 2091, 2092, 2099, 2100, 2102, and 2101), as shown on Figure 1, located on the previous page; Stanislaus, Merced, and San Joaquin Counties; and the Cities of Patterson, Newman, and Modesto.
Why prepare a RFMP? As shown in Figure 1 on the previous page, a large portion of the planning area contains 100- and 500-year floodplains that are concentrated along the San Joaquin River and its tributaries. Stanislaus County, together with the portions of the Mid SJR Region within Merced and San Joaquin Counties, is estimated to include nearly 78,000 acres within the 100-year floodplain. Most of these lands are in agricultural production, with some habitat land and open space areas. A total of 11,063 people reside within these floodplain lands, with 2,129 people residing within floodplain lands included in the Mid SJR Region’s Local Maintaining Agencies (LMAs).
What are the characteristics of the flood management system at present? The current flood management system relies primarily on two key components: 1) a system of aging levees that are able
to convey a 25- to 50-year flood event and are subject to significant seepage hazards; and 2) an emergency response system that has strengths, but lacks integration amongst the various groups that respond to emergencies Additionally, many of the LMAs lack Boards; most are struggling to meet operations and maintenance standards and are inactive under PL 84-99; and at least two do not appear to be financially sustainable. Four of the LMAs in the region are currently working towards having their levees removed from the SPFC as integrated ecosystem enhancement and flood management efforts.
How will we make our region flood-safe? Through the stakeholder process, 37 projects were identified as having the potential to reduce flood hazards and provide other benefits to the planning area. A range of project types were identified that include small dam removal, sediment load reduction, floodplain rehabilitation, a levee vegetation management program, studies to better understand flooding hazards, emergency response planning and training, flood education programs, compliance with Senate Bill 5 requirements, and storm drainage enhancements. The locations of projects with a specific project site are shown in Figure 2 located on the following page. These projects were evaluated, ranked, and categorized into three tiers (Highest Priority, High Priority, and Medium Priority) in accordance with criteria developed for this RFMP. Project locations are shown on the next page with location numbers following the project titles.

Highest Priority City of Newman/Bureau of Reclamation Flood Levee
Rehabilitation (2) Consolidation of O&M (A) Dennett Dam Removal (3) Dry Creek Watershed Detention Reconnaissance Study
(B)* Emergency Response Plan – Local Planning and
Training (D) Flood Risk Education (E) Modesto WWTP - Reduce Flood Risk (9) (10) Orestimba Creek Flood Risk Management Project (11) Regional Maintenance Technical Support (H) SB5 Compliance – City of Modesto (19)* SB5 Compliance – City of Newman (20)* SB5 Compliance – City of Patterson (21)* Tuolumne River Flood Management Feasibility Study
(J)* Tuolumne River Regional Park – Carpenter Road/West
Modesto Flood Management and Park Development (25)
High Priority Dos Rios Ranch Floodplain Expansion and Ecosystem
Restoration Project and Hidden Valley Ranch Mitigation Project (4)
Emergency Response Plan – Debris Management (C) Integrated Levee Vegetation Management – Flood
Maintenance and Habitat (F) La Grange Floodplain Restoration and Spawning Gravel
Augmentation (7)
RD 2031 Resilience (14) RD 2063 Resilience (15) RD 2091 Resilience (16) Three Amigos (also known as the Non-structural
Alternative at the San Joaquin River National Wildlife Refuge) (24)
WSID Fish Screen and Change in Point of Diversion Project (26)
Westside Creeks On-Farm Multi-Benefit Program (L) Medium Priority Black Gulch Storm Drainage Study (1)* Gomes Lake / Harding Drain Improvements (5) Hydraulic and Channel Migration Studies (6)* Little Salado Creek (8) Patterson WWTP – Reduce Flood Risks (12)* RD 1602 Resilience (13) RD 2101 Resilience (17) Reducing Sediment Loading into the San Joaquin River
from Westside Agricultural Lands (G) Riverfront Park Project (22) Salado Creek Flood Management Project (18) Sediment Management Investigation (I)* Storm Drainage Enhancements along Salado Creek (23) Tuolumne River Regional Park (K) Note: Project locations are shown above with location numbers following the project titles. Projects that don’t involve a specific site are represented by letters after the project title, and projects with a * following the title indicates that it is primarily or entirely a study.

Who are the key partners? The agencies that would lead and support the development and implementation of the 37 projects that have been identified in the Mid SJR Region are the key partners for the RFMP. Key partners include Stanislaus County; the Cities of Modesto, Patterson, and Newman; all nine reclamation districts; River Partners; Tuolumne River Trust; Gomes Lake Joint Powers Authority; West Stanislaus RCD; San Joaquin River National Wildlife Refuge; Tuolumne River Regional Park Joint Powers Authority; Audubon California; and West Stanislaus Irrigation District.
How will we pay for our regional improvements? The total cost for the flood-safe vision is on the order of $340 million. Local interests within the Mid SJR Region have limited capacity to raise funds to meet the local cost share. Even with investment from the State and federal funding, which is competitive, there is little hope to find the local cost share to fix the flood management system currently in place. Instead, the stakeholders will continue working to develop fund-able flood improvement projects. The state has made a strong case for Multi-Benefit projects, and the Mid SJR Region has ample opportunities to identify and implement integrated ecosystem and flood management improvements.
How would actions envisioned in the RFMP change our flood future (year 2040+)? A few of the projects included in the RFMP were planned or underway even before the RFMP was drafted, but most were not. Without the RFMP, the level of flood literacy in the Mid SJR Planning Area would be dramatically lower. Flood risks would be greater, driven by population growth, floodplain development, and less investment in flood management, including emergency response. With the RFMP, significant flood management challenges will remain due to limited local funding capacity, but projects will be more successful in finding outside funding due to RFMP guidance on funding programs, drawing attention to regional issues and opportunities, and highlighting of key flood management gaps and opportunities for high-return, modest investment projects.

1. Introduction 1 1
1. Introduction A cornerstone of the FloodSAFE California initiative, the Central Valley FloodManagement Planning(CVFMP) Program provided the structure for the successful development and adoption of the 2012Central Valley Flood Protection Plan (CVFPP). The CVFMP Program was launched in 2008 to guide,manage and implement integrated floodmanagement actions for the Sacramento and San Joaquinvalleys as required by passage of legislation in 2007. CVFMP is now assisting in the planning andcoordination of major implementation actions of the 2012 CVFPP, including State led Basin wideFeasibility Studies (BWFS), locally led Regional FloodManagement Planning, and the Central ValleyFlood SystemConservation Strategy. Each of these planning effortswill be incorporated into the nextupdate of the CVFPP, which is scheduled for 2017. Implementation of CVFPP actions have alreadybegun andwill be expanded after the 2017 Plan is updated. (Fromhttp://www.water.ca.gov/cvfmp/,accessed July 1, 2013.)
This document is a Regional FloodManagement Plan (RFMP) for theMid San Joaquin River (Mid SJR) Regionplanning area, an area generally described as the floodplain corridor extending along the mainstem SanJoaquin River from its confluencewith theMerced River to its confluencewith the Stanislaus River, the lowerreaches of each of the major tributaries (the Merced, the Tuolumne, and the Stanislaus Rivers) that areprotected by facilities within the State Plan of Flood Control (SPFC), and additional floodplain areas that havea nexus to the SPFC. As will be further described below, it has been developed through a broad stakeholderprocess during 2013 2014.
The Mid SJR RFMP is one of six regional Central Valley flood management plans developed as part of thisprocess. The six regional flood management plans include the Mid Sacramento River, Feather River, LowerSacramento River/Delta North, Lower San Joaquin River/Delta South,Mid San Joaquin River, andUpper SanJoaquin River. Assets within each flood planning region are protected by the SPFC facilities. Map 1, RegionalOverview, of the Mid San Joaquin River Regional Flood Atlas (Atlas) shows the location of each of the nineflood planning regions (in Appendix A, Mid San Joaquin River Region Regional Flood Atlas Draft). Theboundaries of each region were defined based onmapped Central Valley Levee Flood Protection Zones thatwere delineated in the CVFPP. These zones were based on the floodplain management activities completedthrough partnerships between the California Department ofWater Resources (DWR), theUnited States Army

Mid San Joaquin River RFMP
1 2 1. Introduction
Corps of Engineers (USACE), and local agencies from 2007 through 2011 in response to the passage ofPropositions 1E and 84 in November 2006 (DWR, 2012).
1 .1 Purpose The purpose of the RFMP is to develop and articulate a flood safe vision for the Mid SJR Region that is bothpractical and ambitious in reshaping the status quowith regards to floodmanagement. The plan is founded inan understanding of the broader statewide floodmanagement systemand enhancement needs as articulatedin the 2012 CVFPP and ongoing State led efforts, such as the BWFS for the San Joaquin Basin and the CentralValley Flood System Conservation Strategy. But most importantly, the plan is an expression of the interestsand priorities of the stakeholders of the Mid SJR Region, developed for the particular landscape andconsiderations of the region and moderated by the realities of financing requirements and local capacities.
1 .2 Process The process used to develop this RFMP for theMid SJR Region planning area has been co led by ReclamationDistrict (RD) 2092 (Dos Rios) and Stanislaus County. Through early outreach in 2012, a list of key cooperatorswas developed, including:
Oakdale Irrigation DistrictWest Stanislaus Irrigation DistrictDel Puerto Irrigation District
Patterson Irrigation DistrictEl Solyo Irrigation DistrictCity of Turlock
City of ModestoReclamation District 2063
City of PattersonMapes RanchTuolumne River Trust
Sierra Club – Yokuts ChapterModesto Irrigation DistrictEast Stanislaus Regional Water Management Partnership
Stanislaus County Public WorksU.S. Fish and Wildlife Service
A technical consultant team was solicited and selected through a competitive bidding process, and asuccessful grant application was submitted to DWR, and subsequently awarded in Spring 2013. Two initialplanning meetings were held in the spring and early summer of 2013 which were broadly publicized toencourage stakeholder involvement. A charter for the process was drawn up, circulated and adopted; it isprovided as Appendix B of this Plan. A website was developed for communication among stakeholders, theother regions, and DWR. A series of public workshops was initiated in July 2013 and continued through July2014. Briefings were held for key players within the region. Coordination with adjacent and other regionsoccurred through a variety of means throughout the development of the RFMP.
1.3 S takeho lder Engagement A concerted effort was made to create an inclusive process that would provide multiple opportunities forregional stakeholders to participate in the development of the plan. A Stakeholder Engagement Plan wasdeveloped early in the processwith input from regional stakeholders andDWR. Part of the engagement planincluded the development of a website to provide stakeholders and interested parties a single, easilyaccessible source of information about the regional plan process and products.

Mid San Joaquin River RFMP
1. Introduction 1 3
1.3.1 Regional Stakeholders
As described above, Stanislaus County and RD 2092 co led the development of this plan. Within StanislausCounty, the Department of PublicWorks held the lead rolewith additional involvement from theDepartmentof Environmental Resources, Department of Agriculture, Office of Emergency Services, Chief ExecutiveOffice,and the Department of Planning and Community Development. Regional stakeholders contributed to thepreparation of the plan. Potential stakeholderswithin theMid SJR Region included all individuals and entitieswith an interest in the region, including resource agencies, local governments, local maintaining agencies(LMAs), flood emergency responders, property owners, community organizations and environmentalstewardship groups.
1.3.2 Stakeholder Outreach
The Regional Partners implemented a 16 month public stakeholder engagement process from April 2013 toJuly 2014 where stakeholders were invited to participate in the development of this plan. A total of eightpublic workshops were held to facilitate discussions between stakeholders and the Regional Partnersregarding all aspects of plan development. The scope of each chapter of the RFMP was first introduced at apublic workshop and feedback fromattendeeswas solicited. Afterward, a draft chapterwas prepared, postedon the RFMP website in advance of the following workshop where the draft was presented and feedbacksolicited. The draft chapter was then revised, posted online in advance of and presented at the nextworkshop. This format was followed for all of the chapters in this document. In addition, several briefings oflocal governments and special interest groupsweremadeduring this 16 month timeperiod to informvariousagencies and groups of the process and to gather input.
A host of stakeholders, including agricultural representatives and agricultural landowners, non agriculturallandowners and developers, public agencies, elected officials, environmental and conservation organizations,community groups (particularly those involved in emergency services), educational institutions, andrepresentatives of low income and/or at risk populations, particularly those that may be impacted byflooding, contributed to the content of this plan through their participation. A record of participants in plandevelopment is included in this document in Appendix C, Engagement Record.
Additionally, extensive effort was made to gather input from the Native American tribes. Regularcorrespondence with representatives of the Inter Tribal Council, Table Mountain Rancheria, North ForkRancheria of Mono Indians, Tule River Tribe of CA, TuolumneWe Wuk Indians Tribal Council, and CAMiwokTribe occurred over the last 16 months. No input from the tribes was received.
Another component of stakeholder outreach includes the Central Valley Flood Protection Board (CVFPB)convening the Regional Planning/System Wide Coordination Committee (Coordinating Committee)monthlystarting in January 2013. The Coordinating Committeemeetings are informal, follow adiscussion format, andare open to all stakeholders interested in regional flood management planning and systemwide feasibilitystudies. Themeetings have been very effective in facilitating stakeholder coordination and are scheduled tocontinue for at least two years. Some coordination among RFMP regions has begun and will continue as theimplementation of the CVFPP progresses.

Mid San Joaquin River RFMP
1 4 1. Introduction
1.4 Document Overv iew This RFMP contains ten chapters that cover the following items.
Chapter 1, Introduction includes a discussion of what the purpose of the RFMP is, the process by which thisdocument was prepared, and how the stakeholders were engaged.
Chapter 2, Regional Setting describes the setting of theMid San Joaquin River Region, providing context andbackground for the chapters that follow.
Chapter 3, Flooding and Flood Hazards describes flood conditions and known flood hazards within the MidSan Joaquin Region planning area.
Chapter 4, Emergency Response provides a description of the current status of flood emergency response totheMid San Joaquin Region and an assessment of the relative state of flood response readiness of responsibleagencies.
Chapter 5,Operations&Maintenanceprovides an assessmentof theOperation andMaintenancepractices inthe Mid San Joaquin Region.
Chapter 6, LandUse and Environmental Enhancements provides information on the current and anticipatedfuture relationships between land use within the floodplain and flood risks, identifies desirable ecosystemenhancements, and provides linkages between potential flood management actions and ecosystemenhancement.
Chapter 7, ProposedRegional Improvementsdescribes theproposed regional improvements, or projects, andthe project concepts thatwere identified through the stakeholder engagement process that address the floodissues identified in the previous chapters.
Chapter 8, Regional Priorities explains the criteria used to evaluate and prioritize the projects and conceptsdescribed in Chapter 7.
Chapter 9, Regional Financial Plan provides a high level overview of the capacity of the Mid San JoaquinRegion to fund the projects identified in the RFMP and to identify any deficiencies in funding.
Chapter 10, Outlook for the Future provides a discussion of the Region’s future with respect to floodmanagement.

2. Regional Setting 2 1
2. Regional Setting
2 .1 In t roduct ion As described in Chapter 1, Introduction, one of the initial steps in the regional flood managementplanning process was to collect pertinent information on the Mid San Joaquin River regional floodmanagement planning region (Mid SJR Region) and surrounding areas, followed by obtaining valuableinput from stakeholders to complete the picture of existing flood management in this portion of the CentralValley. The purpose of this chapter is to describe the setting of the Mid SJR Region, providing contextand background for the chapters that follow. Topics covered are those that are relevant to floodmanagement within the Mid SJR Region and surrounding areas that have a nexus with State Plan of FloodControl (SPFC) facilities. This chapter is intended to provide an accurate characterization of the regionto support the development of integrated multi benefit solutions to flood management problems in theMid SJR Region. The content of this chapter includes information on the following:
location of the Mid SJR Region;
the geography of the Mid SJR Region;
San Joaquin, Merced, Tuolumne, and Stanislaus rivers, as well as the Westside Tributaries (e.g.,Orestimba, Salado, Del Puerto, and Dry creeks);
land use, ecologically sensitive areas, existing habitats, assets, and population within the regionand surrounding areas;
a brief description of the Mid SJR Region river related recreational resources, needs, and planningprocesses;
an introduction to flooding issues and flood management infrastructure within the San JoaquinRiver Basin and Mid SJR Region;
an introduction to operations and maintenance (O&M) of relevant flood managementinfrastructure;
an introduction to emergency response in the region and surrounding areas; and
a brief description of additional relevant planning processes.

Mid San Joaquin River RFMP
2 2 2. Regional Setting
Sources for the information provided in this chapter include reports prepared by USACE, DWR, FederalEmergency Management Agency (FEMA), California Department of Finance (CDF), Stanislaus County,San Joaquin County, City of Modesto, Peterson Brustad Engineers, Inc. (PBI), City of Modesto, City ofCeres, and Stanislaus County Joint Powers Authority; web content published by the City of Patterson,Stanislaus County, Central Valley Salinity Coalition, United States Environmental Protection Agency (EPA),and the United States Census Bureau (US Census Bureau); and data from DWR and the CaliforniaDepartment of Fish and Wildlife (CDFW).
2.2 Reg iona l Overv iew The Mid SJR Region is made up of six non contiguous areas within Stanislaus, Merced, and San Joaquincounties as shown in Figure 2 1, Mid San Joaquin River Region Boundaries and Map 1, RegionalOverview, of the Atlas (Appendix A). These boundaries are consistent with those included in the 2012CVFPP. The size of each of the non contiguous areas is labeled on Figure 2 1. Each non contiguous area isalso labeled with the letters A through F, and will be referred to as Subregions A through F in theremainder of this document.
For the purpose of this regional flood management planning process, the Mid SJR Region planning area(planning area) extends along the San Joaquin River from the confluence of the Stanislaus River to theconfluence with the Merced River, as shown in Figure 2 1. Because the Mid SJR Region of the SPFC isnon contiguous along the San Joaquin River, and because the flood concerns of the region related to theSan Joaquin River and its tributaries extend beyond the specific area of the SPFC, any area thatexperiences flood issues within the vicinity of the Mid SJR Region of the SPFC and has a nexus with theSPFC facilities is included within the Mid SJR Region and this plan. The planning area includes nineReclamation Districts: 1602 (Del Puerto), 2031 (Elliot), 2063 (Crows Landing), 2091 (Chase), 2092(Dos Rios Ranch), 2100 (White Lake Ranch), 2101 (Blewitt), 2099 (El Solyo Ranch), and 2102 (Lara Ranch);Named Area 65 (Gomes Lake); the cities of Modesto, Ceres, Turlock, Patterson, Newman, Oakdale,Riverbank, Waterford, and Hughson; the communities of Grayson, Westley, and Crows Landing; thePatterson, West Stanislaus, El Solyo, Del Puerto, Modesto, Turlock, Twin Oaks, and Oakdale IrrigationDistricts; and the Newman Drainage District. Subregion A includes RD 2031; Subregion B includes RD2101; Subregion C includes RDs 2099, 2100, and 2102; Subregion D includes RD 2092; Subregion Eincludes RDs 2063 and 2091 and NA 65; Subregion F includes RD 1602.
The majority of the SPFC Area in the MidSJR Region is located within StanislausCounty (27,980 acres) with approximately760 and 25 acres within Merced and SanJoaquin counties, respectively. The City ofModesto, which is located approximatelynine miles east of the San Joaquin River,has jurisdiction over two small areas withinSubregion E. The majority of the planningarea is rural and agricultural. Approximately75% of the SPFC Area and 42% of StanislausCounty is in agricultural production, with 50% of the SPFC Area identified as having soils classified asPrime Farmland and Farmland of Statewide Importance.

Stanislaus R iver
Tuol
umne
River
Merced River
Sa n JoaquinRiver
CaliforniaA
queduct
Delta-Mendota
Canal
120120
99
219
108
132132
33
5
165
140
33
99
5
140
108
Orestim
baC
reek
Del
Puerto Cre ek
Little Sa lado Creek
Dry C reek
M e r c e dM e r c e dC o u n t yC o u n t y
S a n J o a q u i nS a n J o a q u i nC o u n t yC o u n t y
S t a n i s l a u sS t a n i s l a u sC o u n t yC o u n t y
Sa lado Creek
Modesto Waterford
Ceres
CrowsLanding
Delhi
Del Rio
Denair
Empire
Escalon
Grayson
Hilmar
Hughson
Keyes
Manteca
Newman
Oakdale
Patterson
Ripon
RiverbankSalida
Stevinson
Turlock
Westley
CD
E
A
B
F
Mid San Joaquin River Regional Flood Management Plan . 120802Figure 2-1
Mid San Joaquin River Region Boundaries
SOURCE: USDA, 2012; ESRI, 2012; DWR, 2013; ESA, 2013
Mid San Joaquin River Region
0 4
Miles
Mid San Joaquin River Region
Mainstem San Joaquin Regional Limits
State Plan of Flood Control Levee
Mid-San Joaquin Region ofState Plan of Flood Control Area
Other Region
100 Year Flood Zones
A-F Subregion Identifier

Mid San Joaquin River RFMP
2 4 2. Regional Setting
2.2.1 Geography and Land Use
The planning area is located within the northern San Joaquin Valley. The San Joaquin Valley is bordered onthe west by the Diablo Range, part of the California Coast Ranges, on the north by the Sacramento SanJoaquin Delta, and on the east by the Sierra Nevada. Two basins are contained within the San JoaquinValley—the San Joaquin River Basin in the north and the Tulare Lake Basin in the south. The valley itself islow in elevation and has generally gentle topographic relief. The topography of the San Joaquin Rivercorridor in the Mid SJR Region is typical of the San Joaquin Valley and generally flat, with elevations rangingfrom approximately 25 to 70 feet above mean sea level.
The land uses within the planning area are predominantly agricultural, including a mix of dairies, livestockpasture and range, livestock feed crops, and orchards. Total agricultural gross income in Stanislaus Countytotaled $3.07 billion in 2011, an 18% increase over 2010 agricultural values. Relative to other parts of theSan Joaquin Valley, the planning area has a high concentration of dairy cows, particularly in the southernend and concentrated around the San Joaquin River corridor (EPA, 2013). According to the 1997 Census ofAgriculture, the three counties included in the planning area are among the top 10 dairy producingcounties in the nation. According to the 2012 Census of Agriculture, these three counties continue toplace within the top seven milk producing counties in California, the largest milk producing state in thenation. Milk is the top agricultural commodity in the region, but almond production has significantlyincreased in recent years.
2.2.2 Waterways
Four large Central Valley rivers are relevantto the planning area – the San Joaquin,Merced, Tuolumne, and Stanislaus rivers(Figure 2 1). All four rivers originate in thewestern Sierra Nevada, flowing westwardtoward the valley floor. The San JoaquinRiver is 330 miles long from its headwatersto its confluence with the SacramentoRiver, including 37 miles within the Mid SJRRegion. The watershed area of the SanJoaquin River upstream of the Mid SJR Region (upstream of the Merced River) is approximately10,000 square miles. By the time the San Joaquin River flows out of the region, it is draining a total ofapproximately 14,000 square miles, having received the flow of the Merced, Tuolumne, and Stanislausrivers, as well as the inflow from the smaller drainages on the west side of the valley. The San JoaquinRiver originates high in the Sierra Nevada Mountains and is dominated by snowmelt, draining elevationsas high as 14,000 feet above mean sea level (msl). The average slope of the San Joaquin River within theMid SJR Region is very low, falling approximately 1 foot/mile as the valley floor drops from about 65 feetto 25 feet msl at the downstream limit. The length, headwaters elevation, and watershed area of the SanJoaquin, Merced, Tuolumne, and Merced rivers along with creeks within the planning area are included inTable 2 1, Rivers and Creeks in Planning Area. These major tributary watersheds make up approximately83% of the contributing area augmenting the flow of the San Joaquin River within the region. Dry Creek,tributary to the Tuolumne River, is another significant waterway with respect to flood management withinthe planning area. The confluence of Dry Creek and the Tuolumne River is near the center of the City ofModesto.

Mid San Joaquin River RFMP
2. Regional Setting 2 5
Table 2 1Rivers and Creeks in Planning Area
River orStream
Length(miles)
Headwaters Elevation(above mean sea level)
Watershed Area(square miles)
San Joaquin River 330 14,000 14,0001
Merced River 145 13,000 1,300
Tuolumne River 149 13,000 1,900
Stanislaus River 96 11,000 1,200
Dry Creek 76 480 196
Orestimba Creek 41 3,600 134
Salado Creek 20 2,600 25
Del Puerto Creek 29 3,600 731 From headwaters to Stanislaus River confluence
SOURCE: USACE, 2012; Atlas geodatabase; USGS, 2012; USGS, 2013
Each of the major rivers tributary to the San Joaquin River is controlled by upstream dams, each of which isoperated for multiple purposes that include flood storage. The San Joaquin River is controlled in itsheadwaters, upstream of the Mid SJR Region, by Friant Dam and is further influenced by multiple control,diversion structures, and parallel flood bypass systems before it reaches the region. Each of the rivers isexpected to convey a particular level of flood flow or discharge, by design or circumstance (see Section 3.6,Channel Conveyance Capacity and Flood Forecast Monitoring Network, for more information on conveyancecapacity in the region). To help manage the lands needed to convey flood flows, the CVFPB has designated afloodway along each of these rivers below the flood management dams and regulates these lands to limitencroachments that would hamper their function in conveying floods. A description of the floodmanagement infrastructure along each waterway is provided later in the flood management section of thischapter. Three notable tributaries to the San Joaquin River flow from the west out of the Diablo Range, partof the California Coast Range include Orestimba, Salado, and Del Puerto creeks. Orestimba Creek meets theSan Joaquin River near the City of Newman. The confluence of Del Puerto Creek and the San Joaquin River isnorth of Patterson. Salado Creek ends in Patterson near the Southern Pacific Railroad (SPRR) tracks.
Within the planning area, the low gradient San Joaquin River meanders through a complex topographythat is in part the product of a long history of river driven processes: abandoned slough channels, oxbowlakes, floodplain wetlands. Digitization of historic maps, shown in Figure 2 2, Historic Channels of theSan Joaquin River Corridor, provides a long term perspective on the dynamics of river processes over arelatively short history since European settlement.
2.2.3 Climate and Hydrology
The climate of the San Joaquin Valley is semiarid with hot, dry summers and mild winters. The majority ofrainfall occurs from November through April as rain in lower regions and snow at higher elevations. Theaverage annual precipitation in the planning area is between 10 and 11 inches (FEMA, 2008). Flows in theSan Joaquin, Merced, Tuolumne, and Stanislaus rivers are dominated by a combination of rain fromNovember through April and snowmelt in the spring. Historically, spring snowmelt would result inlocalized long duration flooding for the lower reaches of the major rivers from March through June, andoccasional winter storms would result in localized and short duration flooding in December throughFebruary. Occasionally, warm winter storms (commonly referred to as “pineapple express”) precipitate

Mid San Joaquin River RFMP
2 6 2. Regional Setting
rain on previously accumulated snow in the upper watershed which produces rapid runoff that canoverwhelm the flood storage capacity of the region (as was seen in the winter storms of 1997). The runoffpattern of the annual hydrographs of these major rivers has been dramatically altered by floodmanagement and water supply operations of the reservoirs upstream. Large flood flows into thereservoirs are detained in storage, and are either released slowly during and after the flood, or retainedtoward the end of the specified flood management season to provide water supply. Tributaries enteringthe system downstream of the reservoirs can contribute significant inflows during flood events.
Several indications of climate change have been observed in California. In the last century, sea levelsalong the coast has increased by seven inches, the average early spring Sierra Nevada snowpack hasdecreased by approximately 10 percent, and the temperature has risen 1° F on average with higherincreases at higher elevations. Some of the implications of these changes have also been observed. Theloss in average early spring snowpack represents a loss of 1.5 million acre feet of water supply storage.Natural peak flows have increased in many rivers, potentially increasing flood risk. In the last decade,many cities in Southern California have seen the lowest annual precipitation levels on record. A changingclimate will continue to increase uncertainty for management of water supply, water quality, floodmanagement, and environmental stewardship (DWR, 2008).
Climate change data for the planning area are available through the Public Interest Energy Research (PIER)Cal Adapt website. See Figure 2 3, Cal Adapt Data for Stanislaus County, for a graphic representation of thedata for Stanislaus County. The historical average temperature in Stanislaus County is 60.6 °F. Future averagetemperatures under high and low emissions scenarios are projected to be 67.2 and 64.6 °F, respectively.Implications of climate change for the Central Valley were identified in the California Adaptation PlanningGuide, Understanding Regional Characteristics document (CEMA et al., 2012). The mountainous areas of thestate, including the Sierra Nevada, are projected to have less precipitation as snow, more precipitation asrain, and be subject to rapid snowmelt events. This will result in extreme, high flow events and flooding inthe Central Valley. Shorter rainfall events and more rapid snowmelt will reduce water supply because it willbe more difficult to capture water in reservoirs or for groundwater recharge. Lower water levels areexpected to impact the recreation and tourism industries as well. Agriculture will be impacted by climatechange as a result of changes in water availability and stress to livestock and crops under alteredtemperature regimes. For example, cows may experience heat stress with increases in daily hightemperatures, and the projected increase in daily low temperatures will decrease nighttime cooling for nuttrees, which is expected to decrease the productivity of the trees. With all of the projected implications, theeconomically disadvantaged will be disproportionately impacted (CEMA et al., 2012).
A series of regional and statewide adaptation strategies for state and local water managers wererecommended by the DWR in Managing an Uncertain Future: Climate Change Adaptation Strategies forCalifornia’s Water (DWR, 2008). The recommendations are also useful in adapting to a growingpopulation, ecosystem rehabilitation, and flood protection. Regional strategies outlined in the planinclude 1) Provide sustainable funding for statewide and integrated regional water management; 2) Fullydevelop the potential of integrated regional water management; and 3) Aggressively increase water useefficiency. Statewide strategies include 1) Practice and promote integrated flood management;2) Enhance and sustain ecosystems; 3) Expand water storage and conjunctive management of surface andgroundwater resources; 4) Fix Delta water supply, quality, and ecosystem conditions; 4) Preserve,upgrade, and increase monitoring, data analysis, and management; 5) Plan for and adapt to sea level rise;and 6) Identify and fund focused climate change impacts and adaptation research and analysis. Specificactions were identified under each of the regional and statewide strategies (DWR, 2008).

5
Tuolumne River
Stanislaus River
San Joaquin River
Grayson
Westley
SOURCE: USDA, 2012; ESRI, 2012; DWR, 2013; ESA, 2013
0 1
Miles
Mid San Joaquin River Region
Mainstem San Joaquin Regional Limits
State Plan of Flood Control Levee
Mid-San Joaquin Region ofState Plan of Flood Control Area
Approximate Channel Meander Zone
Channel: 1859-1861
Channel: 1908-1915
Channel: 1913-1915
Channel: 1937
Mid San Joaquin River Regional Flood Management Plan . 120802Figure 2-2
Historic Channels of San Joaquin River Corridor
132
33

Mid San Joaquin River RFMP
2 8 2. Regional Setting
This page intentionally left blank

Mid San Joaquin River RFMP
2. Regional Setting 2 9
Figure 2-3 Cal-Adapt Data for Stanislaus County
2.2.4 Groundwater
The planning area is located within the San Joaquin River groundwater basin, with two groundwatersubbasins identified on the east side of the San Joaquin River between the Merced and the Stanislausrivers, divided by the Tuolumne River, the Turlock and Modesto subbasins, and one on the west side, theDelta Mendota Subbasin. The region is heavily groundwater dependent. Marine sediments in the DiabloRange on the west side contribute to high total dissolved solids (TDS) levels in the streamflow rechargingthe groundwater on the west side, including nitrates, boron, chloride, and organic compounds. West sidesoils tend to be less permeable, and depth to groundwater is greater than on the east side of theSan Joaquin River. The west side includes areas of shallow saline groundwater within about 10 feet ofthe ground surface over a large portion of the subbasin. There are also localized areas of high iron,fluoride, nitrate, and boron. On the east side, agricultural pesticides and herbicides are more prevalent inthe groundwater. There are areas of hard groundwater and localized areas of high chloride, boron,dibromochloropropane, nitrate, iron, and manganese in the east side subbasins. Groundwater generallycontributes to flow in the San Joaquin River and the middle to lower reaches of the Stanislaus and Tuolumnerivers (DWR, 2003; IWRIS, 2013). Groundwater overdraft has been identified as a major problem for theagricultural industry in the planning area, and Stanislaus County recently adopted a groundwater miningordinance to manage the issue (Stanislaus County, 2013). Integrated water management projects thatpromote groundwater recharge would help to alleviate this regional issue. The Stanislaus County WaterAdvisory Committee was formed in December 2013 to advise the Stanislaus County Board of Supervisorson groundwater matters and provide a needs assessment, prioritize issues, and develop draftpolicies/directives (Stanislaus County, 2013). A 5 year action plan prepared by the committee wasaccepted by the Stanislaus County Board of Supervisors in June 2014 (Modesto Bee, 2014a).

Mid San Joaquin River RFMP
2 10 2. Regional Setting
2.2.5 Water Supply and Transportation Corridors
Major linear infrastructure within the planning area includes roadways, a railway, and water transportcanals. The Delta Mendota Canal (part of the federal Central Valley Project) and California Aqueduct (partof the State Water Project) run generally north south to the east of Patterson and Newman near the baseof the Diablo Range and parallel to Interstate 5 and Highway 33 on the west side of the San Joaquin Rivercorridor. Numerous local water supply canals also parallel these generally north south features on thewest side; on the east side, these canals tend to run generally east west. Two water delivery canals on thewest side also run east west, the West Stanislaus Irrigation District West Stanislaus Canal and thePatterson Irrigation District Main Canal, delivering water supply from the San Joaquin River to local canals.Figure 2 4,Water and Irrigation Districts in Stanislaus County, shows the jurisdictional boundaries of thewater and irrigation districts that cover the majority of the planning area. The California Northern Railroadline runs along Highway 33. The east side of the Mid SJR Region includes another important north southtransportation route in Highway 99, while Highway 132 crosses the San Joaquin River corridor in an eastwest alignment near the northern limit of the Mid SJR Region. Additional east west crossings of theSan Joaquin River corridor moving north to south include West Grayson Road, East Las PalmasAvenue/West Main Avenue, Crows Landing Road, and Hills Ferry Road.
2.2.6 Pipelines
At least two major underground pipelines cross the San Joaquin River within the planning area. TheHetch Hetchy pipeline is a major water supply artery for the City of San Francisco that crossesReclamation District (RD) 2031 (Elliott) and RD 2099 (El Solyo Ranch), where it reaches its lowest elevationin the entire state as it crosses under the San Joaquin River. Pacific Gas & Electric has a natural gaspipeline that also passes under RD 2031 (PBI, 2013).
2 .3 F lood Management Flood management includes aspects related to prevention, response, and recovery. The prevention offloods includes flood management infrastructure, O&M of that infrastructure, non structural approachesincluding flood proofing, planning, legislation, regulation, enforcement, and land use decisions that do notplace assets in areas with a high probability of flooding. Flood response includes planning, warnings,evacuation, rescue, flood fighting, and monitoring. Recovery involves providing relief centers, temporaryhousing, counseling, financial assistance, community programs, and rebuilding. This section provides adescription of the flood management infrastructure and O&M aspects of flood management in the region.The preparation of this plan is a part of flood prevention planning. Other aspects of flood management areaddressed in relevant chapters of this plan, which explore opportunities for flood managementenhancement. O&M is discussed in Chapter 5, Operations and Maintenance. Legislation, regulation, andenforcement are discussed in Chapter 7, Proposed Regional Improvements. Land use is addressed inChapter 6, Land Use and Environmental Enhancements. Response and recovery are discussed in Chapter 4,Emergency Response.
Flood hazards within the planning area are understood at different levels in different locations. Moreurbanized areas typically have been studied in greater depth. Along the San Joaquin River, for example,detailed floodplain analysis has not been conducted by FEMA, though approximate floodplain mappinghas been completed. In the City of Modesto, detailed floodplain analysis has been conducted to map the

PATTERSONW
.D.
OAK FLAT W.D.
DEL ESTE WATER COMPANY
TURLOCK I.D.
CIT
YO
FC
ER
ESW
. S. A
.
RO
CK
CREEK
W.D.
OAKDALE I.D.
MODESTO I.D.
EASTSIDE
W.D.
W
EST STANISLAUSI.D.
DEL PUERTOW
ATERDISTRICT
WATER DISTRICTS .35,000 0 35,00017,500 Feet
LegendWater Districtswdname
CENTRAL CALIFORNIA I.D.
DEL PUERTO WATER DISTRICT
EASTSIDE W.D.
MODESTO I.D.
OAKDALE I.D.
PATTERSON W.D.
TURLOCK I.D.
WEST STANISLAUS I.D.
Parcels
County Boundary
Mid San Joaquin River Regional Flood Management Plan . 120802
Figure 2-4Water and Irrigation Districts in Stanislaus County
SOURCE: Stanislaus County, 2009

Mid San Joaquin River RFMP
2 12 2. Regional Setting
This page intentionally left blank

Mid San Joaquin River RFMP
2. Regional Setting 2 13
100 year floodplain. The 100 year floodplain is shown in Map 16 of the Atlas (Appendix A). Flood risks inless urban areas are significant in terms of dollars, but the population at risk is relatively small. Accordingto the Stanislaus County Multi Jurisdictional Hazard Mitigation Plan (2010), approximately 2,400 peoplelive within the 100 year floodplain of the San Joaquin River within Stanislaus County. The same documentestimates total property value, including private property, within the 100 year floodplain of the SanJoaquin River of $149,520,110, including structures worth $52,849,542 and land worth $87,044,008. Thisincludes 208 miles of canals that provide irrigation to approximately 60,000 acres for the GreaterModesto area by the Modesto Irrigation District (MID, 2014), as well as approximately 250 miles of canalsto 150,000 acres of farmland provided by the Turlock Irrigation District (TID, 2014).
The Central Valley Hydrology Study (CVHS) is a current undertaking by the Sacramento District of theUSACE in support of an effort by DWR to update hydrologic data and complete floodplain mapping alongand behind the federal state levees in the Central Valley. The CVHS includes development of regulatedand unregulated flow frequency curves for more than 200 locations along the Sacramento and SanJoaquin rivers for multiple return periods. Unregulated flow is the maximum flow that would be possibleat a given point in a river system in the absence of existing reservoirs and other flood managementinfrastructure. The models used to create the curves will be made available to flood managers.
2.3.1 Flood Management Infrastructure
The flood management system within the San Joaquin Valley includes reservoirs to regulate snowmeltfrom elevations above 5,000 feet and provide water supply storage, bypasses at lower elevations, andlevees that line major rivers. Snowmelt floods are more frequent in the San Joaquin Valley, though rainfloods do occur and generally have higher peak flows than snowmelt floods. Table 2 2, DischargeFrequency Relationships for Rivers and Creeks Within Planning Area presents the discharge frequencyrelationships for each of the rivers and creeks within the planning area as described by FEMA. (Asdescribed above, an updated version of Central Valley flood hydrology is currently under development.)
Table 2 2Discharge Frequency Relationships for Rivers and Creeks Within Planning Area
LocationDrainage Area(square miles)
Peak Discharges (cubic feet per second)10 %annualchance(10 year)
2 % annualchance(50 year)
1 % annualchance
(100 year)
0.2 %annualchance
(500 year)San Joaquin River at Vernalis 14,010 28,000 52,000 79,000 370,000
Orestimba Creek at Interstate 5 134.0 15,590
Del Puerto Creek at Interstate 5 72.6 7,960
Salado Creek at Interstate 5 25.3 2,820
Salado Creek below Delta Mendota Canal 25.3 710
Tuolumne River at Modesto 1,884 10,500 32,000 70,000 154,000
Tuolumne River at Waterford 1,640 9,000 10,000 42,000 225,000
Stanislaus River at Oakdale 1,020 7,600 8,000 8,000 41,300
Dry Creek at Modesto 192.3 4,730 9,300 11,800 18,100
Merced River at Crocker Huffman Dam 1,045 6,640 12,200 14,900SOURCE: FEMA 2008 and 2009;, URS and Stillwater Sciences, 2004

Mid San Joaquin River RFMP
2 14 2. Regional Setting
Flood management storage space in San Joaquin Valley reservoirs fills quickly during intense rains (USACE,1999). Flood management infrastructure upstream of the Mid SJR Region includes large dams and otherfacilities along the San Joaquin, Merced, Tuolumne, and Stanislaus rivers. Table 2 3, San Joaquin RiverBasin Dams and Reservoirs, includes information on each of the dams and reservoirs in the San JoaquinRiver Basin. Most major reservoirs in the Central Valley have been designed and built to meet multiplepurposes, including water supply, recreation, and flood management. These multipurpose reservoirs havedefined water conservation space for capturing winter and spring runoff for water supply purposes, anddesignated flood management space to capture, manage floodflows to reduce flood releasesdownstream. Water elevation in a reservoir is managed through the release of water according to a rulecurve, which is a graph that describes the elevation and associated storage (y axis) over the year (x axis)to accommodate defined water uses. There are rule curves that apply to normal, drought, and floodconditions, and all are reservoir specific.
Table 2 3San Joaquin River Basin Flood Management Dams and Reservoirs
Project River/StreamStorage(TAF)1
Maximum FloodManagement Space
(TAF)Owner/Operator Year
Friant Dam (Millerton Lake) San Joaquin River 521 170 USBR2 1949
Los Banos Detention Dam Los Banos Creek 35 14 USBR 1965
Hidden Dam(Hensley Lake)
Fresno River 90 65 USACE 1975
Buchanan Dam(Eastman Lake)
Chowchilla River 150 45 USACE 1975
New Exchequer Dam(Lake McClure)
Merced River 1,025 350 Merced ID3 1967
McSwain Dam (Lake McSwain) Merced River 97 0 Merced ID 1967
New Don Pedro Dam(Don Pedro Lake)
Tuolumne River 2,030 340 TID/MID4 1970
New Melones Dam(New Melones Lake)
Stanislaus River 2,420 450 USBR 1978
1 TAF = thousand acre feet, rounded to the nearest 1,000 acre foot2 USBR = United States Bureau of Reclamation3 Merced ID = Merced Irrigation District4 TID = Turlock Irrigation District; MID = Modesto Irrigation District
SOURCE: USACE, 1999
Consistent with this concept, DWR’s Forecast Coordinated Operations (F CO) and Forecast BasedOperations (F BO) programs are a component of the FloodSAFE Flood Emergency Response Program andinclude a focus on the San Joaquin Watershed. The F CO Program seeks to coordinate flood releases fromthe reservoirs located in various tributaries of major rivers to optimize the use of downstream channelcapacity, the use of total available flood storage space in the system, and eventually to reduce overallpeak floodflows downstream from these reservoirs. The first phase of the program is currently underwayand has included a preliminary inventory and assessment of hydrologic gaging networks, evaluation ofhistorical data used to support real time flood forecasting and emergency operations, use of a decisionsupport system for real time analysis of data and reservoir scheduling, evaluation of hydrologicconstraints and opportunities for improved gaging, forecasting, and operations of major reservoirs and

Mid San Joaquin River RFMP
2. Regional Setting 2 15
flood facilities. DWR’s F BO Program anticipates the use of improved long term runoff forecasting andoperating within the parameters of an existing flood management diagram.
Flood management infrastructure within the Mid SJR Region consists of SPFC levees or “project levees,”non project levees, the RD 2091/Named Area 65 Gomes Lake Pumping Plant, and the RD 2063 PumpingPlant and Nelson Drain. Figure 2 5 and Map 9, SPFC and Local Flood Management Facilities, of this planand the Atlas (Appendix A), respectively, include the locations of this infrastructure.
The Gomes Lake Pumping Plant (GLPP) is located approximately just east of the San Joaquin River and justwest of Carpenter Road, north of Crows Landing Road. Levees that were constructed in the 1950s and1960s along the San Joaquin River were preventing stormwater, irrigation tailwater, and water from othersources from draining into the San Joaquin River. The GLPP was constructed so that backed up watercould be pumped over the levees and discharged into the San Joaquin River (Stanislaus County, 2011). TheNelson Drain directs runoff from below Mitchell Road during the flood and irrigation seasons, and the RD2063 Pumping Plant pumps it over the levee and into the San Joaquin River.
2.3.2 Operations and Maintenance Practices
Levees operated and maintained by Reclamation District Nos. 1602 (Del Puerto), 2031 (Elliot), 2063(Crows Landing), 2091 (Chase), 2092 (Dos Rios Ranch), 2100 (White Lake Ranch), 2101 (Blewitt), 2099(El Solyo Ranch), and 2102 (Lara Ranch) are a part of the SPFC facilities, as is Gomes Lake, Named Area(NA) 65. Federal flood protection facilities must be inspected at least four times per year according to theFederal Flood Control Regulations (Title 33, Code of Federal Regulations, Section 208.10). Inspections occurimmediately before the flood season, immediately following every major high water period, and atintervals not exceeding 90 days. The primary objective of the inspections is to confirm that projectfacilities maintenance is being carried out effectively, rather than to identify problems with projectfacilities (DWR, 2013a).
LMAs are responsible for operating and maintaining levees and associated drainage systems andstructures, participating in inspections, flood fighting, and filing annual reports. Maintenance typically includessuch items as management of vegetation, rodent burrows, seepage, and erosion.
Few of the SPFC levees in the Mid SJR Region are both inspected by DWR and in a condition that DWR deems“Acceptable.” Of the nine RDs in the planning area, only five have submitted complete documentation in2012 as required of LMA’s by California Water Code Section 9141 since 2008: RD 1602 (Del Puerto), RD 2063(Crows Landing), RD 2091 (Chase), RD 2092 (Dos Rios), and RD 2101 (Blewitt). The balance of the LMA’s isinactive, with the exception of NA 65, Gomes Lake. NA 65, Gomes Lake is also an LMA required to file annualreports; however, no report was filed in 2012 and the DWR Levee Inspection Report noted that levees in NA65 are not inspected by DWR. DWR did inspect the pumping plant at Gomes Lake and found it “Acceptable.”Of the four non reporting RDs (RD 2099, El Solyo; RD 2100, White Lake Ranch; RD 2102, Lara Ranch; and RD2031, Elliott), three are made up of lands owned by the United States Fish and Wildlife Service (USFWS) andare part of the San Joaquin River National Wildlife Refuge (SJRNWR): RD 2099, RD 2100, and RD 2102. In thewake of levee breaches caused by the floods of 1997, the USACE initiated an effort to remove the leveesfrom the project as part of a “Non Structural Alternative” or NSA under PL 84 99. While the lands werepurchased for this purpose and several required acquisitions and improvements have been made, theprocess to remove the project levees bounding Subregion C from the SPFC is still underway. Based oncommunication submitted by the Refuge Manager to DWR (for example, the letter dated September 1, 2010

[Ú
[Ú
Tuolu
mne
River
Sa n JoaquinRiver
CaliforniaAque
duct
D
elta-Men
dota Canal
ÄÅ219
ÄÅ108
ÄÅ132
ÄÅ33
§̈¦5
ÄÅ33
ÄÅ99
Orestim
baC
reek
Del
PuertoCr eek
Little Salad o Creek
MITC
HE
LLRD
M e r c e dM e r c e dC o u n t yC o u n t y
S t a n i s l a u sS t a n i s l a u sC o u n t yC o u n t y
Reclamation District No. 2063Pumping Plant
Gomes Lake Pumping Plant
MITC
HE
LLRD
Ceres
CrowsLanding
Empire
Grayson Keyes
Patterson
RiverbankSalida
Westley
Modesto
Salado Creek
Mid San Joaquin River Regional Flood Management Plan . 120802Figure 2-5
SPFC and Local Flood Control Facilities
SOURCE: USDA, 2012; ESRI, 2012; DWR, 2013; ESA, 2013
0 4
Miles
Mid San Joaquin River Region
Mainstem San Joaquin Regional Limits
State Plan of Flood Control Levee
Mid-San Joaquin Region ofState Plan of Flood Control Area
Non-project Levee
[Ú Pump Station

Mid San Joaquin River RFMP
2. Regional Setting 2 17
included in the 2012 LMA Annual Report), the SJRNWR expressed intent to both not maintain the levees ofthese three RDs and to breach them in the future to restore river floodplain connectivity, consistent with theNSA. RD 2031, the remaining non reporting RD, appears to be inactive, though the two property ownerswithin the District (Faith Ranch and Mapes Ranch) continue to perform levee maintenance and engage inflood fights at the levees adjacent to their lands (PBI, 2013). In 2012, the levees in RD 2031 were rated“Minimally Acceptable” by DWR and two river erosion sites were identified. Currently, RD 2031 is working toreorganize.
Of the five reporting RDs, RD 2063 reports challenges in recruiting leadership and generating sufficientrevenue to meet District obligations (PBI, 2013). The 2012 DWR Levee Inspection Report indicates that ofthese five RDs, only RD 2091 and RD 2092 had levees with an overall “Acceptable” rating. The remainderhad levees with an overall rating of “Unacceptable.” Only one of these Districts had a structure that wasinspected, RD 2063: the pumping plant serving the Nelson Drain, which was rated “Unacceptable.”
In 2012, DWR found erosion sites at RD 2031 and RD 2101 (two and one, respectively).
2 .4 Eco log ica l l y Sens i t i ve
Areas , Ex is t ing Hab i ta t , and
Recrea t ion As the Central Valley was transformed from a natural landscape to a vast agricultural region with areas ofurban and rural development, the majority of the aquatic and terrestrial habitat in the planning area waslost. Wetlands and riparian habitat were converted to farms and urban areas. Flood management projectsintroduced levees that constrict natural channel morphology and migration and prevent the seasonalinundation of floodplains, a key requirement of anadromous fish at the juvenile life stage. Dams restrictanadromous fish migration and natural sediment transport, which is critical to the formation of spawninghabitat in river channels, and result in hydrology that is significantly different than that to which aquaticspecies are highly adapted. Habitat that remains in the planning area is stressed further by the presenceof revetment; unscreened diversions; pollutants; and invasive plant, aquatic, and terrestrial species.
While much diminished from its pre European settlement condition, the planning area contains a richarray of river related ecologically sensitive areas. These include lands specifically acquired and managedfor habitat values, public lands such as parks, private lands with conservation easements, and privatelands without easements, but containing valuable natural habitat.
Worldwide, river corridors and floodplain lands are some of the most ecologically valuable areas in thelandscape. In an arid region like California, they are also areas with the greatest diversity of wildlife. Thecombination of complex topography, hydrologically driven disturbance, gradient of habitat conditions,and flood driven generation of habitat and food sources for aquatic species make them a tremendousresource for native species, which have adapted to thrive in these conditions. Because these landshave also been tremendously desirable for other uses, such as agriculture and urban development, and few“living” floodplains remain, conservation and restoration of floodplain lands have become a major focus formany resource management agencies. Rivers and floodplains are vitally important to native fish species,including anadromous species like salmon and steelhead, a central focus of the San Joaquin RiverRestoration Program being implemented upstream of the Mid SJR Region. The San Joaquin Valley and its

Mid San Joaquin River RFMP
2 18 2. Regional Setting
wetlands and river corridors also provide vitally important wintering areas for migratory birds on thePacific Flyway. In addition, vegetated expanses within view of a waterway, and perhaps with access forfishing, swimming, or boating, are natural attractants for people – highly appealing for public access andrecreation.
2.4.1 Public Access and Recreation
As population grows in the Mid SJR Region, the need for recreational opportunities on or near waterwaysalso increases. Compared to other California regions, the Central Valley lacks parks for residents andvisitors. Major trends that include significant population growth and increasingly sedentary lifestylescontribute to the need for more parks and recreational facilities. With additional recreationalopportunities, an economic benefit to the local economy could occur with supporting uses such asmarinas, boat rentals, and restaurants.
An array of parks currently occupies lands along the major waterways of the Mid SJR Region withadditional improvements and recreational areas proposed. The Stanislaus River Parks (“string of pearls”)managed by the USACE include 11 riverside parks between Knights Ferry and the confluence with the SanJoaquin River. These parks provide camping, fishing and boating access to the Stanislaus River. The RiponRiver Crossing Park is one of these parks. Some of these sites have been fully developed, while others areawaiting further investment.
The Stanislaus River at Highway 99 and downstream includes Caswell Memorial State Park (camping andriver access) as well as smaller parks, such as Oak Grove Park in Modesto and the Mohler Tract of the SanJoaquin River National Wildlife Refuge (hiking and river access). The USFWS manages a 4 mile walking trailincluding river access for passive recreation at the terminus of Dairy Road just south of Hwy 132 (PelicanNature Trail). Most bridge crossings are heavily used by fishermen, although access is largelyuncontrolled.
Near Highway 99 and the cities of Modesto and Ceres is the Tuolumne River Regional Park (TRRP), a parkbeing developed jointly by the two Cities and Stanislaus County. This park is being developed on 500 acresof public land along seven miles of the Tuolumne River in a series of separate parks. When completed, itwill include 150 acres of developed park lands, pedestrian/biking trails, and over 350 acres of landdesignated for riparian habitat conservation and restoration. Five of its component parks have been fullyor partially developed so far, and one more remains to be initiated. One of the partially developed parks,Gateway Park, is located at the confluence of Dry Creek and the Tuolumne River in Modesto (EDAW,2001). Additional river oriented County parks are also located along the Tuolumne River, such asRiverdale Park and the Shiloh Road river access (closed). Near the town of Grayson, Stanislaus Countymaintains Laird Park and, near the town of Patterson, the Las Palmas Boat Launch (closed), both locatedon the San Joaquin River. The George J. Hatfield State Recreation Area is located along the lower MercedRiver; further upstream is a county facility, Hagaman Park. There is also a County Park at Orestimba Creeknear the City of Newman.
In addition to the existing parks and park plans, riverside land in the planning area figures large in therecreational vision of many. The Stanislaus County General Plan (1987) indicates a host of additionalcounty and state parks, both existing and proposed, along the waterways of the planning area, some withdirect river access. The Tuolumne River Trust has an active Lower Tuolumne River Parkway initiative,working with a larger coalition of interests to accomplish an array of goals. The Parkway is described as a

Mid San Joaquin River RFMP
2. Regional Setting 2 19
series of non continuous habitat restoration and public access projects in the river and river corridor fromLa Grange Dam to the San Joaquin River. A river oriented public access point has been proposed by City ofTurlock for lands they own on the San Joaquin River at the outlet of the Harding Drain.
A large scale recreational plan applicable to the Mid SJR Region is the Central Valley VisionImplementation Plan, a strategic plan for State Parks expansion in the Central Valley, developed by theCalifornia State Parks in 2009. The Implementation Plan is a catalog of proposed initiatives, to beimplemented over the next twenty years, to improve recreation and resource protection in the CentralValley. Many of these initiatives are located within the Mid SJR Region, and include improving the CaswellMemorial State Park, Turlock Lake State Recreational Area (SRA), McConnell SRA (along the MercedRiver), George J. and Hatfield SRA, and developing Dos Rios Ranch as a public use area.
Other recreational plans for the region include the San Joaquin River Blueway sponsored by the SanJoaquin River Partnership, which outlines a vision for the future by proposing a variety of parks, wildliferefuges, and other publicly accessible places that provide the public an opportunity to explore and enjoythe San Joaquin River. If realized, this vision is anticipated to not only improve recreational opportunitiesin the region, but the air quality, water quality, and health of its users, while providing additionaleconomic benefits in, and flood protection to, the region. The San Joaquin River was one of two rivers inCalifornia nominated to become a National Blueway under the Department of Interior “America’s GreatOutdoors Initiative” in 2010. Recently, however, the United States Department of the Interior (DOI) hasreduced its funding of the San Joaquin River Blueway effort and is no longer pursuing implementation ofthis project.
2.4.2 Ecologically Sensitive Areas and Habitat
There are two wildlife areas, two wildlife refuges, and several large areas of conservation land within andnear the Mid SJR Region of the SPFC. Atlas Map 18, Managed Environmental Lands (Appendix A), includesthe locations of land managed by the USFWS, CDFW, The Nature Conservancy (TNC), River Partners,Tuolumne River Trust, and others. Figure 2 6, Managed Environmental Lands and Riparian Vegetation,shows these areas along with privately held lands with conservation easements, including those held bythe Natural Resources Conservation Service (NRCS). Many of these riverside lands were specificallyacquired to restore or preserve floodplain habitat.
The SJRNWR covers nearly 8,000 acres and is part of the San Luis National Wildlife Refuge Complex(Refuge Complex). The refuge includes a contiguous 3,356 acre area that covers nearly all of Subregion Cand part of the area between Subregions A and C as shown in Figure 2 1. Six non contiguous areas cover1,635 acres of land between Subregion A and C and another small 35 acre parcel is located approximatelyone mile northeast of the northeast boundary of Subregion A. Three non contiguous areas withinSubregion A and an area with a portion extending outside its northwest boundary total 2,046 acres. Thetotal area of SJRNWR land that is included within the Mid SJR Region is 4,090 acres. Approximately threequarters of these lands were specifically acquired to allow floodwater to temporarily move out onto thefloodplain, now in flood compatible land use, thereby lowering flood risks and stages in the river. TheSJRNWR includes woodland, wetland, and grassland habitats that are important for wintering Aleutiancackling geese as well as songbirds, water birds, and multiple special status species including riparianbrush rabbit (State and federal endangered), riparian woodrat (federal endangered) and Swainson’s hawk(State threatened). In 2005, it also became the site of the first known nesting pair of endangered leastBell’s vireos in the Central Valley in more than 50 years.

*
*
*)*
*
*
**
*
**
*
*
**
*
*
*
**
*
)
)
*
*
)
*
*
*
*
*
)
*
))
*
*
)))
)
*
*
*
*
*
*
*
*
**
*
**
*
*
)
)
* **
***
*
*
*
*
*
* *
*
*
*
**
**
*
*
*
*
)
**
*
**
*
*
*
*
*
*****
*
*
*
*
*
*
*
*
*
*
*
*
*
*
* *
*
*
*
*
*
Stanislaus R iver
Tuol
umne
River
Merced River
Sa n JoaquinRiver
CaliforniaA
queduct
Delta-Mendota
Canal
ÄÅ120ÄÅ120
ÄÅ99
ÄÅ219
ÄÅ108
ÄÅ132ÄÅ132
ÄÅ33
§̈¦5
ÄÅ165
ÄÅ140
ÄÅ33
ÄÅ99
§̈¦5
§̈¦
ÄÅ140
ÄÅ108
Orestim
baC
reek
Del
Puerto Cre ek
Little Sa lado Creek
Dry C reek
M e r c e dM e r c e dC o u n t yC o u n t y
S a n J o a q u i nS a n J o a q u i nC o u n t yC o u n t y
S t a n i s l a u sS t a n i s l a u sC o u n t yC o u n t y
Sa lado Creek
Modesto Waterford
Ceres
CrowsLanding
Delhi
Del Rio
Denair
Empire
Escalon
Grayson
Hilmar
Hughson
Keyes
Manteca
Newman
Oakdale
Patterson
Ripon
RiverbankSalida
Stevinson
Turlock
Westley
Mid San Joaquin River Regional Flood Management Plan . 120802Figure 2-6
Managed Environmental Lands and Riparian Vegetation
SOURCE: USDA, 2012; ESRI, 2012; DWR, 2013; ESA, 2013
0 4
Miles
Mid San Joaquin River Region
Mainstem San Joaquin Regional Limits
State Plan of Flood Control Levee
Mid-San Joaquin Region ofState Plan of Flood Control Area
Valley Foothill Riparian
Note: This analysis includes lands within a 1 mile distanceof the centerline of the San Joaquin River and its tributaries.
CNDDB
)Approximate Plant Occurance (Endangeredor Threatened)
*Approximate Animal Occurance(Endangered or Threatened)
USFWS Critical HabitatColusa grass
Conservancy fairy shrimp
Delta smelt
Greene's tuctoria
Hoover's spurge
Longhorn fairy shrimp
Vernal pool fairy shrimp
Vernal pool tadpole shrimp

Mid San Joaquin River RFMP
2. Regional Setting 2 21
Dos Rios Ranch is a 1,600 acre area managed by the Tuolumne River Trust and River Partners located atthe confluence of the Tuolumne and the San Joaquin rivers, between the SJRNWR and TRRP. This parcelincludes six miles of river frontage and will be managed for habitat and attenuation of flood flows.
In 2013, River Partners acquired the 497 acre Hidden Valley Ranch, adjacent to Dos Rios Ranch, usingfunding from the DWR and the Wildlife Conservation Board. In addition to expanding the floodattenuation and wildlife habitat objectives of the Dos Rios Ranch project, Hidden Valley Ranch will alsohost 191 acres of mitigation for future impacts associated with the SPFC.
In addition to the SJRNWR, the USFWS manages the San Luis National Wildlife Refuge (San Luis NWR),located outside of the Mid SJR Region along the San Joaquin River upstream of the confluence with theMerced River and adjacent to California State Route 140. The San Luis NWR and SJRNWR are both part ofthe Refuge Complex, which also includes the Merced National Wildlife Refuge (Merced NWR), and theGrasslands Wildlife Management Area (Grasslands WMA), and is managed out of the Refuge Complexheadquarters in Los Banos. Two wildlife areas managed by CDFW are located near the Mid SJR Region ofthe SPFC: the West Hilmar Wildlife Area and North Grasslands Wildlife Area. The West Hilmar WildlifeArea is adjacent to Subregion E within Merced and Stanislaus counties and includes 340 acres of woodland,riparian, and grassland habitat. The North Grasslands Wildlife Area covers just over 7,000 acres adjacent tothe San Luis NWR to the north and is located in both Merced and Stanislaus counties. The NorthGrasslands Wildlife Area includes wetland, riparian, and upland habitats. Romero Ranch and SimonNewman Ranch were purchased by TNC in 1998 and provide 61,000 acres of habitat along and in betweenOrestimba and Garzas creeks.
Map 19, Riparian Vegetation, Critical Habitat, and Endangered and Threatened Species, of the Atlas(Appendix A) identifies areas within the Mid SJR Region and vicinity that are dominated by riparianvegetation; the channels that are critical habitat for steelhead trout (Oncorhynchus mykiss); and theapproximate locations of occurrences of plant and animal species that are listed as endangered and/orthreatened under the California or United States Endangered Species Acts. Extensive riparian vegetation ispresent within the SJRNWR and there are small swaths of riparian vegetation along the San Joaquin Riverfrom the confluence with theMerced River to the confluence with the Stanislaus River. Riparian vegetationthat lines the Merced, Tuolumne, and Stanislaus rivers is shown in Figure 2 6. As shown in Atlas Map 19(Appendix A), the San Joaquin, Merced, Tuolumne, and Stanislaus are characterized as Critical Habitatfor steelhead trout. Critical Habitats are those that are designated by the USFWS as areas essential tothe survival of listed species. Other Critical Habitats located within the Mid SJR Region include those forthe vernal pool tadpole shrimp (Lepidurus packardi) and vernal pool fairy shrimp (Branchinecta lynchi)within Subregion A. The California Natural Diversity Database (CNDDB) is the source of occurrences ofendangered plant and animal species shown in Atlas Map 19.
Within Subregion A of the Mid SJR Region of the SPFC, there is an area that is designated as CriticalHabitat for the Conservancy fairy shrimp (Branchinecta conservation). In east Stanislaus County, there arelarge areas of Critical Habitat for Colusa grass (Neostapfia colusana), California tiger salamander(Ambystoma californiense), and vernal pool fairy shrimp (Lepidurus packardi). The entire length of theMerced, Tuolumne, Stanislaus, and San Joaquin Rivers in the planning area are designated as CriticalHabitat for steelhead trout (Oncorhynchus mykiss). The San Joaquin River just downstream of theplanning area is designated as Critical Habitat for green sturgeon (Acipenser medirostris).

Mid San Joaquin River RFMP
2 22 2. Regional Setting
Riparian and wetland associated sensitive species documented within the San Joaquin River corridor andthe lower reaches of the Merced, Tuolumne, and Stanislaus rivers include Delta button celery, valleyelderberry longhorn beetle, riparian woodrat (Neotoma fuscipes riparia), riparian brush rabbit (Sylvilagusbachmani riparius), least Bell’s vireo (Vireo belli pusillus), colonies of tricolored blackbirds, Swainson’shawk, pallid bat, and western red bat. This area also provides wading bird rookeries; habitat forSacramento splittail; and migrating, holding, and rearing habitat for steelhead and fall run Chinooksalmon (DWR, 2012). Since 1998, a captive breeding and reintroduction program has been underway torecover the riparian brush rabbit from the brink of extinction. A viable population of this flood threatenedmammal has been re established in restored forests at the SJRNWR, and may be delisted with theestablishment of two additional viable populations. This species resides wholly within the Mid San JoaquinRiver and Lower San Joaquin River/Delta South planning regions, and its preferred habitat is brushyvegetation along levee slopes and riverbanks. Past efforts to clear levee vegetation within this speciesrange have resulted in regulatory conflict.
The banks of the major rivers in the planning area are inconsistently reinforced with rock rip rap, wasteconcrete and other rock debris. No engineered rock revetment was included as part of the original SPFC inthe region; nonetheless, rock revetment is present and is currently being mapped in the region by DWR.Past efforts to use revetment to stabilize river banks and levees from erosion in this region have resultedin regulatory conflict.
Analyses conducted for the CVFPP (DWR, 2012a) identified 7,760 acres of floodplain lands along rivercorridors within the planning area that could potentially be hydrologically reconnected to the San Joaquin,Merced, Tuolumne, and Stanislaus rivers for frequent inundation so as to benefit ecological processes.These areas are identified in Figure 2 7 Potential Floodplain Restoration Areas.
The CVFPP identified conservation plans that were relevant to the CVFPP planning area in Table 1 1 ofAttachment 9E to the CVFPP. The subset of the information in that table that applies to the Mid SJR RFMPplanning area is provided below in Table 2 4, Conservation Plans Relevant to the Planning Area.

Tuolu
mne
Ri
ver
Sa n JoaquinRiver
CaliforniaAque
duct
D
elta-Men
dota Canal
ÄÅ219
ÄÅ108
ÄÅ132
ÄÅ33
§̈¦5
ÄÅ33
ÄÅ99
Orestim
baC
reek
Del
PuertoCr eek
Little Salad o Creek
Creek
M e r c e dM e r c e dC o u n t yC o u n t y
S t a n i s l a u sS t a n i s l a u sC o u n t yC o u n t y
Ceres
CrowsLanding
Empire
Grayson Keyes
Patterson
RiverbankSalida
Westley
Modesto
Salado
Mid San Joaquin River Regional Flood Management Plan . 120802Figure 2-6
Potential Floodplain Restoration Area
SOURCE: USDA, 2012; ESRI, 2012; DWR, 2012.
0 2
Miles
Mid San Joaquin River Region
Mainstem San Joaquin Regional Limits
Levee Hazard CategorizationsHigh Concern
Medium Concern
Low Concern
Non Project Levees
ConnectedNatural-Riparian-Wetland
Natural - Upland
Agriculture
Potential but Currently DisconnectedNatural-Riparian-Wetland
Natural - Upland
Agriculture
Note: This analysis includes lands within a 1 mile distance of the centerline of the San Joaquin River and its tributaries
Mid San Joaquin River Regional Flood Management Plan . 120802
Figure 2-7Potential Floodplain Restoration Area
SOURCE: USDA, 2012; ESRI, 2012; DWR, 2013

Mid San Joaquin River RFMP
2 24 2. Regional Setting
Table 2 4Conservation Plans Relevant to Planning Area
Plan Name
Selected Habitat Targets from RelevantConservation Plans
Selected Species Targets fromRelevant Conservation Plans
Riparian/SRA WetlandSeasonalFloodplain
RiverineAquatic
DeltaButtonCelery Salmonids
GiantGarterSnake VELB
YellowBilledCuckoo
BankSwallow
Swainson’sHawk
LeastBell’sVireo
RiparianBrushRabbit
RiparianWoodrat
San Joaquin County Multi SpeciesHCP and Open Space Plan
+ + + + + + + + + +
PG&E O&M HCP + + + + + + + + + + +
San Joaquin River RestorationProgram
+ + ++ ++
Central Valley Project StateWater Project OCAP andAssociated BOs
+ + ++ ++
CALFED Multi SpeciesConservation Strategy
++ ++ ++ ++ ++ ++ ++ ++ ++ ++ ++ ++ ++ ++
Central Valley Improvement ActPrograms
++ + ++ ++ + + + + + + + +
Central Valley Joint Venture ++ ++ ++ ++ ++ ++
Bay Delta Conservation Plan ++ ++ ++ ++ ++ ++ ++ + ++ + ++ + + +
Draft Recovery Plan for the GiantGarter Snake
++ +
California Red legged FrogRecovery Plan
+ + + +
Recovery Plan for Upland Speciesof the San Joaquin Valley,California
+ ++ ++
California Water Plan + + + +
State Water Resources ControlBoard Plans
+
+ A probable or potential relationship exists. The Conservation Strategy is not likely to significantly contribute to the other conservation plan’s conservation objectives, or the conservation target is a secondary focus of the conservation plan. Forgeographic overlap, there is a minor spatial overlap between the conservation plan area and one of the CVFPP planning boundaries.
++ A significant relationship exists. The Conservation Strategy could significantly contribute to the other conservation plan’s conservation objectives. For geographic overlap, there is a large spatial overlap between the conservation plan and one ofthe CVFPP planning boundaries.
SOURCE: Table 1 1, Summary of CVFPP Relationships to Conservation Objectives from Other Conservation Plans, of Attachment 9E the 2012 CVFPP.

Mid San Joaquin River RFMP
2. Regional Setting 2 25
2.5 Pro tec ted Popu la t ions and
Assets Because the vast majority of the lands within the planning area are within Stanislaus County, some of thedata presented in this section references Stanislaus County alone.
2.5.1 Protected Populations
Based on data collected during the United States 2010 Census of Population and Housing (US CensusBureau, 2010), the population within the Mid SJR Region boundary is 2,129 (Table 2 5, Mid San JoaquinRiver Region Population). According to the 2010 Census, the total population of Stanislaus County is514,453. The population of each major city and community is included in Table 2 6, Population of Citiesand Communities in Planning Area. Table 2 7, Population and Assets within 100 and 500 yearfloodplains in Stanislaus County, includes the population within the 100 and 500 year floodplainsassociated with each major river and creek in the planning area. Population and asset data are presentedin Figure 2 8,Mid SJR Region Population, of this plan as well as Maps 2 and 16 of the Atlas (Appendix A).The majority of land within the region is agricultural and as a result, population density is low relative tourban and suburban areas with an average density of less than 1 person per 10 acres. Private residencesand other property are included within the assets of the Mid SJR Region at risk from flooding.
Table 2 8, Mid San Joaquin River Region Land Use, includes a summary of land use within the Mid SJRRegion of the SPFC by acres and percent of region. Land use within the Mid SJR Region of the SPFC andsurrounding areas is also shown on Map 6 of the Atlas (Appendix A). Farmland makes up 75 percent of theMid SJR Region of the SPFC, with urban areas accounting for only four percent. Modesto is the closestlarge urban area to the Mid SJR Region of the SPFC, approximately 10 miles east, and according to the2010 Census, has a population of approximately 201,165 (US Census Bureau, 2013a). The small areaswithin the Mid SJR Region of the SPFC that are under the jurisdiction of the City of Modesto are entirelyurban and developed land. The City of Patterson is located approximately 1.2 miles west of Subregion Eand has a population of 20,413. Newman is located approximately six miles southwest of Subregion F andhas a population of 10,224. The communities of Grayson and Westley have populations of 952 and 603,respectively, and are located approximately 1.8 and 3.8 miles southwest of Subregion D, respectively.Ceres is a city within Stanislaus County, adjacent to Modesto to the south, with a population of 45,417 (USCensus Bureau, 2013b). Salida is located northwest of Modesto and has a population of 13,722. CrowsLanding is a small community of 355 located between Patterson and Newman along Highway 33. Othercities in Stanislaus County include Oakdale and Riverbank along the Stanislaus River, Hughson andWaterford along the Tuolumne River, and Turlock, which is located many miles from the rivers in theplanning area.

Mid San Joaquin River RFMP
2 26 2. Regional Setting
Table 2 5Mid San Joaquin RiverRegion Population
Table 2 6Population of Cities and Communities inPlanning Area
Subregion Population City/Community PopulationA 849 Ceres 45,417
B 77 Crows Landing 355
C 20 Grayson 952
D 101 Hughson 6,640
E 1,037 Modesto 201,165
F 45 Newman 10,224
Total 2,129 Oakdale 20,675
SOURCE: 2010 Census Patterson 20,413Riverbank 22,678Salida 13,722Turlock 68,549Waterford 8,456Westley 603SOURCE: 2010 Census
Table 2 7Population and Assets within 100 and 500 year Floodplains in Stanislaus County
River Population Households Number of Parcels Total Value
100-year Floodplain Del Puerto Creek 248 71 139 $49,686,842
Dry Creek 747 273 146 $143,550,227
Orestimba Creek 588 223 189 $48,685,552
Salado Creek 38 10 31 $8,795,382
San Joaquin River 2,354 676 630 $149,520,110
Stanislaus River 2,322 892 268 $117,176,939
Tuolumne River 4,766 1,566 974 $187,806,940
500-year Floodplain
Del Puerto Creek 375 112 194 $62,664,305
Dry Creek 747 273 149 $149,644,108
Orestimba Creek 927 338 300 $77,913,338
Salado Creek 221 70 67 $16,659,356
San Joaquin River 2,408 694 668 $166,250,814
Stanislaus River 2,460 943 465 $200,322,760
Tuolumne River 11,177 3,555 2,162 $578,719,622SOURCE: Stanislaus County, 2010
Floodplains in the planning area that are in Merced County are not covered above. According to Attachment 8F of the 2012 CVFPP, the generalfloodplain area along the San Joaquin River at the confluence with the Merced River includes 522 residential units with a total value of $26,196.

Tuolu
mne
Ri
ver
Sa n JoaquinRiver
CaliforniaAque
duct
D
elta-Men
dota Canal
219
108
132
33
5
33
99
Orestim
baC
reek
Del
PuertoCr eek
M e r c e dM e r c e dC o u n t yC o u n t y
S t a n i s l a u sS t a n i s l a u sC o u n t yC o u n t y
Modesto
Ceres
CrowsLanding
Empire
Grayson Keyes
Patterson
RiverbankSalida
Westley
CD
E
A
B
F
Mid San Joaquin River Regional Flood Management Plan . 120802Figure 2-8
Mid SJR Region Population
SOURCE: USDA, 2012; ESRI, 2012; DWR, 2013; ESA, 2013
0 4
Miles
Mid San Joaquin River Region
Mainstem San Joaquin Regional Limits
State Plan of Flood Control Levee
Mid-San Joaquin Region ofState Plan of Flood Control Area
2000 Population Data
1 Dot = 1000
1 Dot = 100
A-F Subregion Identifier

Mid San Joaquin River RFMP
2 28 2. Regional Setting
Table 2 8Mid San Joaquin River Region Land Use
Land Use Category Acres of Land Type % of SPFC Area
Urban and Developed Land 1,260 4%
Native Vegetation and Grazing Land 5,160 18%
Local and Unique Farmland 7,260 25%
Prime and Statewide Importance Farmland 14,290 50%
Confined Animal Agricultural Land 620 2%
Rural and Semi Agricultural Land 160 1%
Total 28,750 100%SOURCE: Mid San Joaquin River Region Flood Atlas (Appendix A)
Urban and Developed Land. Urban and developed land is
occupied by structures with a building density of at least 1 unit
to 1.5 acres, or approximately 6 structures to a 10 acre parcel.
Common examples include residential, industrial, commercial,
institutional facilities, cemeteries, airports, golf courses,
sanitary landfills, sewage treatment, and water control
structures.
Native Vegetation and Grazing Land. Land on which the
existing vegetation is suited to the grazing of livestock. This
category is used only in California and was developed in
cooperation with the California Cattlemen’s Association,
University of California Cooperative Extension, and other
groups interested in the extent of grazing activities. Land
which consists of open field areas that do not qualify for an
agricultural category, mineral and oil extraction areas, and
rural freeway interchanges.
Local and Unique Farmland. Farmland of Local Importance
All farmable lands that do not meet the definitions of Prime,
Statewide, or Unique. This includes land that is or has been
used for irrigated pasture, dryland farming, confined livestock
and dairy, poultry facilities, aquaculture and grazing land.
Unique Farmland Lesser quality soils used for the production
of the leading agricultural crops in the state. This land is
usually irrigated, but may include non irrigated orchards or
vineyards as found in some climatic zones in California. Land
must have been cropped at some time during the four years
prior to the mapping date.
Prime and Statewide Importance Farmland. Prime Farmland
Irrigated land with the best combination of physical and
chemical features able to sustain long term production of
agricultural crops. This land has the soil quality, growing
season, and moisture supply needed to produce sustained
high yields. Land must have been used for production of
irrigated crops at some time during the four years prior to the
mapping date. Farmland of Statewide Importance Irrigated
land similar to Prime Farmland that has a good combination of
physical and chemical characteristics for the production of
agricultural crops. This land has minor shortcomings, such as
greater slopes or less ability to store soil moisture than Prime
Farmland. Land must have been used for production of
irrigated crops at some time during the four years prior to the
mapping date.
Confined Animal Agricultural Land. This includes aquaculture,
dairies, feedlots, and poultry facilities. Confined Animal
Agriculture qualifies for Farmland of Local Importance in some
counties.
Rural and Semi Agricultural Land. This includes residential
areas of one to five structures per ten acres. This includes
semi agricultural lands such as farmsteads, agricultural storage
and packing sheds, unpaved parking areas, composting
facilities, equine facilities, firewood lots, and campgrounds.

Mid San Joaquin River RFMP
2. Regional Setting 2 29
It is estimated that a population of approximately 2,400 is located in unincorporated areas within the 100year (1% annual chance of occurrence) floodplain of the San Joaquin River alone. (See Chapter 3, Floodingand Flood Hazards, of this plan for a map of the 100 year floodplain boundary.) Stanislaus County isestimated to have a population of 14,544 that is exposed to flood hazards during a 100 year event.Additionally, a population of approximately 3,300 is located within all 100 year floodplains in the City ofModesto, 1,600 within all 100 year floodplains in the City of Newman, and 1,500 within all 100 yearfloodplains in the City of Patterson (Stanislaus County, 2010). The CVFPP estimated potential loss of 50 livesin the Mid SJR Region because of flooding over the next 100 years. The Expected Annual Damages fromflooding within the Mid SJR Region is more than $3 million to crops; structures and contents; and businesslosses (Figure 2 8) (DWR, 2012a). The probability of flood damages shown in Figure 2 9, Expected AnnualDamages from Flooding, takes into account several sources of uncertainty related to levee performance,including the anticipated probability of levee failure based on geotechnical considerations.
Figure 2-9 Expected Annual Damages from Flooding in the Mid SJR Region
2.5.2 Protected Assets – Critical Public Infrastructure
Types of assets that are protected by the SPFC facilities include state, federal, local, and county facilities;health and public safety facilities; public schools; and other critical public infrastructure. Protectedfederal, state, and local facilities include canals and pipelines. Local and county facilities include roadways,bridges, water and wastewater facilities and local, non SPFC levees. Hospitals and emergency operationscenters would be considered health and public safety facilities, respectively. Power facilities andsubstations as well as potential hazardous material (hazmat) storage areas are examples of other criticalpublic infrastructure.
Map 8 of the Atlas, Existing Critical Facilities and Economic Assets, includes the locations of protectedassets within the Mid SJR Region and surrounding areas (Appendix A). Assets within the Mid SJR Region ofthe SPFC shown in Map 8 of the Atlas include SPFC levees along the San Joaquin River, State Highway 132,and the Crows Landing Bridge. Figure 2 10,Major Water Diversion Facilities, shows the locations of majorwater diversion facilities within the Mid SJR Region and surrounding areas. Assets within the SPFC Areasurrounding communities include police stations in Modesto, Salida, Ripon, Crows Landing, and near theSan Joaquin River approximately four miles east of Westley; fire stations in Modesto, Salida, Ripon, Patterson,approximately eight miles east of Patterson and approximately nine miles east of Westley; hospitals inModesto and Patterson; the Modesto City County Airport, Patterson Airport, and the Crows Landing Naval

!>
!>!>
!>!>!> !>!>!>
!>
!>
!>
!>
!>
!>
!>
!>!>!>
!>!>
!>
!>
!>
!>!>
!> !>!>
!>!> !> !>
!>!>
!>!>!>
!>
!>!>!>
!>
!>!>!>
!>!>
!>!> !>!>
!>
!>
!>
!>
!>
!>
!>!>!>!>!>
!>
!>!>
!>
!>
!>
!>
!>
!>
!>!>!>
!>
!>!>
!> !> !>
!>
!>!>!>
!>
!>
!>
!>!>!>!>
!>
!>
!>!>
!>
!>!>!>!>!>
!>
!>!>
!>
!> !>
!>
!>
!>
!>
!>!>
!>
!> !>
!> !>
!>!>
!>
!>
!>
!>
!>
!>!>
!>!>
!>
!>
!>
!> !> !>!>
!>!> !>!>!>!>!>!>!>!>!>
!>!> !>
!>
!>!>!>!>
!>!>!>!> !>!>
!>
!>!>
!>
!>
!>!>!>!>!>
!>!> !>
!>!>!>
!>
!>
!>
!>
!>
!>
!>
!>!>
!>
!> !>
!>
!>
!>!>
!>!>!>
!>
!> !>
!>
!> !>
!>
!>
!>
!>!>
!>
!>
!>!>
!> !>
!>
!>
!>
!>
!>
!>
!>!>
!>!>
!>
!>
!>
!>
!>
!>
!>
!>
!>!>
!>
!>!>
!>
!>!>!>!>
!>
!>!>
!>
!>
!>
!>
!>
!>!> !>!> !> !>
!>
!>
!> !>!>
!>
!>!> !>!>
!> !> !>!>!>
!>
!>
!>
!>!>
!>
!>
!>
!>
!>
!>
!>
!>
!>
!>
!>
!>
!>
!>
!>
!>
!>
!>
!>
!>
!>
!>
!>
!>
!>!>
!>
!>
!>
!>
!>
!>!>!>
!>
!>
!>
!>
!>
!>
!>
!>
!>
!>!>!>!>
!>
!>
!>
!>
!>!>!>
!>
!>
!>
!>
!>
!>
!>
!>
!>
!>
S tanislaus Ri ver
Merced River
ÄÅ120
ÄÅ219
ÄÅ132
ÄÅ165
ÄÅ140
ÄÅ33
ÄÅ99
§̈¦5
ÄÅ108
Orest
imba
Creek
Del Puerto Creek
Salda Creek
Salda Creeklittle
CaliforniaAqueduct
Dry Creek
Tuolumne River
Delta-Mendota Canal
SanJoaquin
River
West Stanislaus Main
T u o l u m n eT u o l u m n eC o u n t yC o u n t y
M e r c e dM e r c e dC o u n t yC o u n t y
S a n J o a q u i nS a n J o a q u i nC o u n t yC o u n t y
S t a n i s l a u sS t a n i s l a u sC o u n t yC o u n t y
PWD Main
Manteca
Patterson
Riverbank
Turlock
Modesto
Mid San Joaquin River Regional Flood Management Plan . 120802Figure 2-10
Water Diversion Facilities
SOURCE: USDA, 2012; ESRI, 2012;DWR, 2013; ESA, 2013; CSWRCB, 2014
0 10
Miles
Mid San Joaquin River Region
!> Point of Diversion
Mainstem San Joaquin Regional Limits
State Plan of Flood Control Levee
Major Water Diversion*
County Boundary
Mid-San Joaquin Region ofState Plan of Flood Control Area
*Likely incomplete data

Mid San Joaquin River RFMP
2. Regional Setting 2 31
Air Station (not operational but being redeveloped as a general aviation airport); public schools in Modesto,Ripon, Salida, Westley, Patterson, Crows Landing, and three east of the San Joaquin River outside of thesecommunities; a boat launch in Modesto; the Shiloh Bridge over the Tuolumne River in Stanislaus County;Union Pacific and California Northern railroads; State Highways 33, 99, 108, 219, and Interstate 5 (I 5);and the Modesto, Patterson, and Newman Wastewater Treatment Plants (WWTPs). Figure 2 11, Mid SJRRegion Protected Assets, of this plan and Map 2 of the Atlas (Appendix A) depict assets within the regionbased on ranges of value. As shown, assets within the Mid SJR Region of the SPFC are valued within therange of $0 to $100,000/acre. The Stanislaus County Multi Jurisdictional Hazard Mitigation Plan includedthe value of several assets within the 100 and 500 year flood zones, including Honor Farm, a prisonfacility in Grayson ($2.36 million), Fox Grove Regional Park along the Tuolumne River near Hughson($60,000), the Newman Library ($1.03 million), Patterson Library ($1.99 million), and animal servicesfacilities in Modesto near the Tuolumne River upstream of the confluence with Dry Creek ($1.36 million)(Stanislaus County, 2010).
Damage to bridge facilities in the event of a flood could cost tens of millions of dollars to repair. TheHighway 132 (Maze Blvd.) bridge, which is a major commuter route between the Modesto vicinity to theBay Area, would have severe economic impacts on commerce if damages were incurred as a result offlood damage. Highway 99 and the main route of the Union Pacific Railroad (UP) cross the Tuolumne Riverat Modesto. In a major flood event in which Don Pedro Reservoir overtops the dam, both of thesefacilities could be at risk. The repair or replacement cost for a mainline railroad bridge capable of carryingheavy freight traffic such as that found on the UP line would be expected to cost tens of millions ofdollars. Additional costs would be incurred by the necessity to reroute rail traffic around the damagedbridge and secure alternative transportation measures. Lastly, major public assets located within the MidSJR region include the Hetch Hetchy electrical transmission lines and domestic water lines, which servicemillions of San Francisco Bay Area residents; these are adjacent to the Highway 132 bridge, and are injeopardy during flood events. The Crows Landing and Las Palmas Avenue bridges that cross the SanJoaquin River are a vital transportation link from areas west of the San Joaquin River to east of the river(PBI, 2013). The Crows Landing Bridge is valued at $6.86 million, and the value of the Las Palmas AvenueBridge is $7.45 million (Stanislaus County, 2010). Both roadways are within the 100 year floodplain.
The cities of Patterson and Newman have WWTPs that are located along the San Joaquin River, butoutside of the SPFC Area boundaries. The City of Modesto WWTP includes two facilities located along theTuolumne and San Joaquin rivers, one within and one outside of the SPFC Area. These facilities areincluded in the scope of this plan because they are susceptible to flood hazards, which are described inmore detail in Chapter 3. The City of Patterson WWTP is located on the left bank of the San Joaquin Riverjust north of the East Las Palmas Avenue/West Main Street river crossing. The City of Newman WWTP islocated near the left bank of the San Joaquin River on Hills Ferry Road near the City of Newman. TheModesto WWTPs include the Sutter Avenue Primary Treatment Plant along the right bank of theTuolumne River adjacent to Bellenita Park and the Jennings Road Secondary Treatment Plant on the rightbank of the San Joaquin River within the SPFC Area.
Thus, the critical infrastructure and property either within or adjacent to areas protected by SPFC on theSan Joaquin River include roads, important underground pipelines, and the WWTPs described above.

!(
!(!(
!(
!(
!(
!(!(
!(
!(
!(
!(
!(
!(
!(
!(
!(
!(
!(
!(!(
!(
!(
!(!(
!(
!(!(
!(
!(!(
!(
!(
!(
!(
!(
!(
!(!(
!(
!(
!(
!(
!(
!(
!(
!(
!(!(
!(
!(
!(
!(!(
!(
!(!(
!(
!(
!(
!(
!(
!(!(
!(
!(
!(
!(
!(
!(
!(
!(
!(!(
!(!(
!(!(
!(
!(!(
!(
!(
!(
!(
!(
!(
!(
!(
!(!(
!(
!(!(
!( !(
!(
!(
!(
!(!(!(
!(!(!(
!(
!(
!(
!(
!(
!(
!(
!(
!(
!(
!(
!(!(
!(
!(
!(!( !(
!(
!(
!(
!(
!(
Tuolu
mne
Ri
ver
Sa n JoaquinR
iver
CaliforniaAque
duct
D
elta-Mendota Canal
ÄÅ219
ÄÅ108
ÄÅ132
ÄÅ33
§̈¦5
ÄÅ33
ÄÅ99
Orestim
baC
reek
Del
PuertoCr eek
Little Salda do Creek
Creek
M e r c e dM e r c e dC o u n t yC o u n t y
S t a n i s l a u sS t a n i s l a u sC o u n t yC o u n t y
Ceres
CrowsLanding
Empire
Grayson Keyes
Patterson
RiverbankSalida
Westley
Modesto
Salado
Mid San Joaquin River Regional Flood Management Plan . 120802Figure 2-
Protected Assets
SOURCE: USDA, 2012; ESRI, 2012; DWR, 2013; ESA, 2013
0 4
Miles
Mid San Joaquin River Region
Mainstem San Joaquin Regional Limits
State Plan of Flood Control Levee
Mid-San Joaquin Region ofState Plan of Flood Control Area
Protected Asset ($1,000/acre)0 -100
100 - 200
200 - 300
2000 Population Data
!(!( 1 Dot = 1000
!(!( 1 Dot = 100
_̂
_̂
_̂
_̂ Population data forthcoming
Mid San Joaquin River Regional Flood Manage Plan . 120802
Figure 2-11Mid SJR Region Protected Assets
SOURCE: USDA, 2012; ESRI, 2012; DWR, 2013; ESA, 2013

Mid San Joaquin River RFMP
2. Regional Setting 2 33
Assets within the 500 year floodplain (0.2% annual chance of occurrence) floodplain of Orestimba Creekwere evaluated in the Orestimba Creek Draft Interim Feasibility Study (USACE, 2012). Table 2 9,Orestimba Creek 500 year Floodplain Structure Inventory and Property Values, includes the results ofthat evaluation as reported in the feasibility study. Assets within the 500 year floodplain includeresidential, commercial, industrial, and public property valued at a total of just over $300 million. TheEastin Road, Bell Road, and Jorgensen Road low water crossings are also assets within the 500 yearfloodplain. Over two thirds of those assets, or approximately $211 million, are residential properties. SeeChapter 3, Flooding and Flood Hazards, of this plan for a map of the 500 year floodplain boundary.
Table 2 9Orestimba Creek 500 year Floodplain Structure Inventory and Property Values
Land Use
Number of Structures Structural Value ($1,000) Content Value ($1,000) Total Valueby LandUse Type($1,000)Rural Urban Rural Urban Rural Urban
Residential 158 1,122 17,706 123,204 8,853 61,602 $211,365
Commercial 0 62 0 23,732 0 25,030 $48,763
Industrial 0 16 0 13,593 0 20,014 $33,607
Public 0 7 0 4,541 0 2,123 $6,664
Total 158 1,207 $17,706 $165,070 $8,853 $108,769 $300,398SOURCE: USACE 2012
2.5.3 Protected Assets – Agriculture and Associated
Infrastructure
Other assets protected by SPFC facilities include agricultural lands and associated infrastructure, whichmay be privately owned or owned by irrigation districts, such as the Modesto or Turlock IrrigationDistricts. Agricultural land and the crops that it contains, along with supporting water delivery and stormdrainage infrastructure, are important assets protected by SPFC facilities.
According to the 2011 Stanislaus County Crop Report, milk is the top agricultural commodity in theplanning area (Stanislaus County, 2011). In total, dairy products in Stanislaus County comprised$766 million of gross farm income, approximately one quarter of all agricultural income in the County. Notall dairy production occurs in the floodplains, however; recent spikes in conversion to almond orchards (60%increase in gross income in Stanislaus County from 2010 to 2011) has relegated much annual agriculture toflood prone or other lands less suited to conversion to permanent crops. The major drought in much ofthe Mid western United States in 2012 drove dairy feed prices very high, which negatively impacted manydairies in the San Joaquin Valley. According to a recent news story, over 100 dairies across the San JoaquinValley closed in 2012 and more were expected to close in 2013 (CVBJ, 2013). Continued conversion of rowcrops and silage production land uses to nut production is anticipated in coming years, and this trend mayhave an impact on flood management across the region. Flood damages to orchard crops may result inhigher dollar costs than flood damages to annual forage crops, depending on the timing and duration offlooding.
Spring floods pose particular hazards for some crops, most notably orchards. For example, almond trees,which are common in the region, bloom from late February through the end of March. This coincides with

Mid San Joaquin River RFMP
2 34 2. Regional Setting
the flooding period for the San Joaquin River. An almond orchard that has saturated soils cannot besprayed effectively for brown rot, a common fungus that attacks the flower. Orchard trees that have theirroots in standing water for prolonged periods during the growing season undergo significant physiologicalstress. Therefore, with a combination of these factors, if an extended duration flood occurs during bloomtime or the early growing season, devastating effects on yields and agricultural income would occur. Ingeneral, orchards are generally not considered flood compatible.
The dairy sector is also highly susceptible toincome loss because of flooding – particularly inthe early spring. In the spring and early summer,milk production peaks. Dairy cows are extremelystress sensitive, and milk yields can be expectedto fall precipitously when cows are subjected toenvironmental stresses such as flood events,moving herds out of the floodway, or otheractivities that disrupt daily routines. According torecent data from the EPA, approximately 21dairies are located within the 100 year floodplainin the Mid San Joaquin River Region (EPA, 2013).
2.6 Emergency Response/
Pub l ic Sa fe ty Two key components of emergency response during flood events include flood fight operations andgeneral public safety operations. Flood fight operations include emergency activities aimed at preventingfailure of a levee during a flood or in the event of a levee breach, as well as a maintenance activitiesprovided by the reclamation districts with possible assistance from DWR and USACE. Another componentof flood response includes public warning, evacuation rescue, care and shelter, and recovery functionsprovided by local counties, cities, and special purpose “fire districts.”
Local fire and law enforcement agencies have jurisdiction within the floodplain for protecting people andproperty, while reclamation districts have jurisdiction for flood fight. In large flood events, the geographicscale at which these different groups of agencies establish command and control or organize theirresponse varies because of differences in agency jurisdictional boundaries and internal protocols (PBI,2013). See Chapter 4, Emergency Response, for a more detailed discussion on this topic.
2.7 Agr icu l tu ra l Land
Management and Wate r
Qua l i t y Water quality is an important component of agricultural land management in the Central Valley. Runofffrom agricultural lands must be managed for a variety of pollutants including pesticides, herbicides, salts,

Mid San Joaquin River RFMP
2. Regional Setting 2 35
fertilizers, sediment, and pathogens. Commercial growers and confined animal facility operators mustcomply with the Central Valley Regional Water Quality Control Board (CVRWQCB) Irrigated LandsRegulatory Program and Confined Animal Facility Program requirements, respectively. Water QualityCoalitions have been formed among growers to address regulatory requirements collectively. The variouscoalitions benefit the growers and regulatory agencies because compliance is handled by a group, ratherthan on a grower by grower basis. The Westside San Joaquin River Watershed Coalition and East SanJoaquin Water Quality Coalition are active within the planning area. These coalitions are focused onaddressing water quality issues related agricultural operations, including the potential to use managedwetlands to accomplish pollutant removal from drainage. Under the Irrigated Lands Regulatory Program,specific Waste Discharge Requirements are currently being developed for several types of agriculturallands. Elevated salinity and nitrate levels in surface water and groundwater are a problem within theplanning area and Central Valley. In 2006, a joint effort began among the Central Valley Regional WaterQuality Control Board, State Water Resources Control Board, and local stakeholders to address salinityand nitrate issues within the Central Valley and to adopt long term solutions. The collaborative effort iscalled Central Valley Salinity Alternatives for Long Term Sustainability (CV SALTS). The Lower San JoaquinRiver Committee is a subcommittee of the CV SALTS Executive Committee, was established in 2010, andincludes a variety of stakeholders including municipalities, irrigated agriculture, food processors, irrigationdistricts, and state and federal agencies. The primary goal of the Lower San Joaquin River Committee is todevelop water quality objectives that support the beneficial uses on the Lower San Joaquin River,including the Mid SJR Region (CV SALTS, 2013). The committee is currently working with the CVRWQCB,United States Bureau of Reclamation (USBR), and others to implement a real time management system tomanage salt in the Lower San Joaquin River watershed. One water quality and wildlife managementstrategy that could be used to reduce salts is exemplified by the wetlands created by Mickey Saso alongthe San Joaquin River in which agricultural drainage is used to provide wildlife habitat and removesediment, pesticides, herbicides, and other contaminants. The wetlands could be used to store irrigationwater that is higher in salts, and the water could be discharged into the San Joaquin River during higherriver flows when salt concentrations are lower. Funding is available for projects aimed at improving waterquality in agricultural areas. For example, the NRCS, which is part of the United States Department ofAgriculture, provides funding through its Bay Delta initiative for small, high impact projects that protectwater quality in the tributaries to the Sacramento San Joaquin Delta.
2.8 In tegra ted Reg iona l Wate r
Management P lann ing The Integrated Regional Water Management (IRWM) planning process, fostered by recent legislation andbond measures and administered by DWR, adopts a strategy for regional water management solutions thatincorporates physical, environmental, societal, economic, legal, and jurisdictional aspects and use of anextensive stakeholder engagement process. The IRWM planning process is intended to be more effectivethan traditional methods by incorporating all of the relevant aspects of water management planningrather than addressing each aspect through a separate process. Flood management strategies identified inthis plan should be incorporated into the IRWM Plans that have overlapping planning area boundaries. Map 5,DWR Integrated Regional Water Management Planning Areas, of the Atlas, includes the boundaries of thetwo IRWM planning areas with boundaries that overlap with the Mid SJR Region, which include the EastStanislaus and Westside San Joaquin IRWM Regions.

Mid San Joaquin River RFMP
2 36 2. Regional Setting
The East Stanislaus IRWM Plan identifies projects and measures to be implemented to meet the goals setfor the region, one of which is flood protection. This regional flood management plan and the EastStanislaus IRWM Plan are being developed cooperatively to ensure consistency and integration betweenthe two plans. The East Stanislaus IRWM Plan identifies 28 potential projects, some of which are relatedto flood management. Flood management related projects include the La Grange Floodplain Restorationand Spawning Gravel Augmentation, Dos Rios Floodplain and Riparian Habitat Restoration, and theIntegrated Stormwater Resource Management and Groundwater Augmentation Plan. Because ofeconomic challenges in the East Stanislaus IRWM Region, funding to implement these projects has notyet been secured. Remaining IRWMP funding is limited and additional funds may or may not beforthcoming. One more round of Proposition 84 implementation funding is expected, with submittals duein December 2014/January 2015 timeframe to potentially fund identified projects in 2015. The EastStanislaus Region expects to pursue grant funding through Round 3. Prior to release of the DWR ProposalSolicitation Package (PSP), the East Stanislaus Regional Water Management Partnership, the RegionalWater Management Group for the region, and the Steering Committee will meet to determine next steps.No future funding for the Proposition 1E Stormwater and Flood Management grant program has yet beenauthorized.
The Westside Integrated Water Resources Plan (WIWRP) was adopted in 2006 to address the integratedregional water management needs and opportunities of the Trans San Joaquin Tulare/Kern area. Part ofthe Mid San Joaquin Region is located within this area, but the WIWRP was not specific with respect tothat region. Therefore, a process is now underway to update the WIWRP in accordance with the latestDWR IRWP guidelines and requirements and to provide a Westside San Joaquin region specific IRWMP bySummer 2014.
The Governor and Legislature have directed DWR to expedite the solicitation and award of $200 million inIRWM funding to support projects and programs that provide immediate regional drought preparedness,increase local water supply reliability and the delivery of safe drinking water, assist water suppliers andregions to implement conservation programs and measures that are not locally cost effective, and/orreduce water quality conflicts or ecosystem conflicts created by the drought. DWR received 39 grantapplications requesting a total of $339 million in IRWM grant funds for projects totaling in excess of $970million for the 2014 IRWM Drought Grant Solicitation. Grants have been awarded, and a tablesummarizing the grant applicants, IRWM region, requested grant amounts, and total project costs isavailable online (DWR, 2014a).

3. Flooding and Flood Hazards 3 1
3. Flooding and Flood
Hazards
3.1 In t roduct ion The purpose of this chapter is to describe flood conditions and known flood hazards within the planningarea for the Mid San Joaquin River Region (planning area). Topics covered are those that are relevant toflood management within the planning area. The content of this chapter includes information on thefollowing:
flood history within the San Joaquin River Basin, including flood system performance during the1983, 1986, 1995, and 1997, 2006, and 2011 flood events;
flood management infrastructure within the San Joaquin River Basin and Mid SJR Region;
roles of agencies with flood management responsibilities within the Mid SJR Region;
organizations in the region with a flood management focus;
the 100 , 200 , and 500 year floodplain boundaries;
calculated design channel capacities;
information on the Flood Forecast Monitoring Network;
condition of levees throughout the Mid SJR Region;
detail on known flood hazards;
a synopsis of system deficiencies within the Mid SJR Region; and
an introduction to opportunities for flood management improvements and opportunities forintegration with additional purposes.

Mid San Joaquin River RFMP
3 2 3. Flooding and Flood Hazards
Sources for the information provided in this chapter include reports prepared by the CaliforniaDepartment of Water Resources (DWR), the Federal Emergency Management Agency (FEMA), the UnitedStates Army Corps of Engineers (USACE), City of Modesto, Stanislaus County, California Department ofFinance (CDF), United States Fish and Wildlife Service (USFWS), and McBain and Trush; web contentpublished by the National Weather Service (NWS), Stanislaus, Merced, and San Joaquin Counties, and theCities of Modesto, Patterson, and Newman; and the United States Code.
Flood hazards within the planning area occur as a result of the combination of the naturally flood pronecharacter of the San Joaquin Valley, levees that are in poor condition, assets that are located along majorrivers, and a range of flood preparedness levels among communities and the LMAs. Within the Mid SJRRegion planning area, the cities of Modesto, Newman, Patterson and communities of Westley andGrayson are exposed to flood risk during large runoff events as are large agricultural areas along the SanJoaquin, Merced, Tuolumne, and Stanislaus rivers. In Modesto, flooding occurs at the confluence of theTuolumne River and Dry Creek during intense rains, especially when releases from Don Pedro Reservoirare high. Within the Westside tributary watersheds to the San Joaquin River, intense rainfall results inextensive, low depth flooding. Each of these hazards is described in this chapter along with briefintroductions to identified opportunities to improve flood management in the planning area, which arepresented in detail in Chapter 7, Proposed Regional Improvements, of this plan.
3.2 F lood H is to ry o f the
San Joaqu in R ive r Bas in There is a long history of catastrophic flooding within the Central Valley that dates back to the early 1800s(USACE, 1999). In the 30 years since 1983, a federal disaster has been declared four times in the Mid SJRRegion (DWR, 2012a). A brief history of flooding within the Central Valley was provided in Section 1.2 of the2012 Central Valley Flood Protection Plan (CVFPP) (DWR, 2012a). The Sacramento and San JoaquinRiver Basins, California Post Flood Assessment (Post Flood Assessment) prepared by the United StatesArmy Corps of Engineers (USACE) provides a detailed history of flooding and flood management withinthe Central Valley (USACE, 1999). Prior to European settlement and reclamation of lands within theCentral Valley, the vast floodplains of the Sacramento and San Joaquin rivers would become inundatedduring seasonal flood events, often forlong periods. Within the San JoaquinValley alone, snowmelt floods peaking inMay or June each year would createseveral hundred thousand acres ofperennial tule marshes and seasonallyflooded wetlands (USACE, 1999).
These extensive floods have promptedresponse from those who settled in theCentral Valley that continues to thepresent day. Reclamation districts (RDs)in the Central Valley were formed asearly as 1868 to reclaim frequentlyinundated lands for agriculture. Levees,

Mid San Joaquin River RFMP
3. Flooding and Flood Hazards 3 3
small dams, and other diversion infrastructure were constructed by federal, state, and local agencies andturned over to RDs for operation and maintenance (CDF, 1997). Larger flood management projectsbegan to be constructed in the San Joaquin Valley by the Federal Government and local agencies in themid 1900s. Because of their influence on river flows and river stage, facilities both upstream anddownstream of the planning area interact with flood hazards and flood management facilities andactivities within the planning area. Table 3 1, San Joaquin River Basin Flood Control Infrastructure,includes the chronology of large scale flood management projects within the San Joaquin River Basin.Figure 3 1, Major Flood Control Infrastructure within the San Joaquin River Basin, includes the locationsof these projects and an overview of the flood management infrastructure within the San Joaquin RiverBasin. As shown in Figure 3 1, levees within the planning area include State Plan of Flood Control (SPFC),or “project,” levees and non project levees. Project levees line the San Joaquin and Stanislaus riverscovering a distance of 72.0 miles. Non project levees within the planning area are largely non engineeredagricultural levees or material that has been piled along ditches that have been cleared and consist of 0.9miles along the Merced, 12.0 miles along the Tuolumne, 27.9 miles along the Stanislaus, and 18.9 milesalong the San Joaquin River, and 28.0 miles of other levees within the 100 year floodplain. Documentedlevee failure in the system includes 29 breeches, 3 overtoppings, and seepage in many locations (DWR,2011c).
Table 3 1San Joaquin River Basin Flood Control Infrastructure
Project River/StreamStorage(TAF)1
MaximumFlood ControlSpace (TAF)
Owner/Operator Year
Lower San Joaquin River andTributaries Project levees
San Joaquin River2 n/a n/a Multiple entities 1944
Friant Dam (Millerton Lake) San Joaquin River 521 170 USBR 1949
Los Banos Detention Dam Los Banos Creek 35 14 USBR 1965
Hidden Dam (Hensley Lake) Fresno River 90 65 USACE 1975
Buchanan Dam (Eastman Lake) Chowchilla River 150 45 USACE 1975
New Exchequer Dam (Lake McClure) Merced River 1,025 350 Merced ID 1967
Don Pedro Dam (Don Pedro Lake) Tuolumne River 2,030 340 TID/MID 1970
NewMelones Dam (NewMelones Lake) Stanislaus River 2,420 450 USBR 1978
USBR = United States Bureau of Reclamation; Merced ID =Merced Irrigation District; TID = Turlock Irrigation District; MID =Modesto Irrigation District1 TAF = thousand acre feet, rounded to the nearest 1,000 acre foot2 Levees were constructed downstream of the Merced River, Stanislaus River, Old River, Paradise Cut, and Camp Slough.
SOURCE: USACE, 1999
New Melones Dam and Reservoir, completed in 1978, was the last major flood management facilitiesconstruction project within the Central Valley (USACE, 1999). Six major floods have occurred since—in1983, 1986, 1995, 1997, 2006, and 2010. The most significant of the six major floods occurred in January1997. Flooded area maps were developed to delineate the extent of the 1983, 1986, 1995, and 1997floods. The maps were developed using aerial photographs, primarily from the DWR PhotogrammetryDepartment. The initial flood boundary delineations only included the flood extent shown in aerialphotographs, and any flooded areas not captured in the photographs were excluded from the initialdelineated boundary. Areas of known inundation not captured in the photographs, those that wereinundated during other flood events, and/or areas included within FEMA GIS data were then added to the

Mid San Joaquin River RFMP
3 4 3. Flooding and Flood Hazards
delineation maps by inference. Finally, levee failure locations, including breaks and overtopping, wereadded to the flooded area maps (USACE, 1999). A description of the flooding extent and levee breaksshown on each map as well as information on reservoir levels and damages sustained and prevented areprovided in the discussions below. [Note: the historic flooding maps included below exclude depictions offlooding from the Westside tributaries, though reporting of floods in these areas, when it occurred, isincluded in the text.]
3.2.1 Flood Control System Performance – 1983 Flood
Numerous storms from November 1982 to March 1983 caused flooding in Northern and CentralCalifornia. These storms were a result of the El Niño Southern Oscillation, which is characterized byunusually warm ocean temperatures in the Equatorial Pacific and results in increased rainfall in Peru andthe southern tier of the United States, including California. Statewide, precipitation in California was 190percent of normal on average, and in some areas rainfall was more than 220 percent of normal. Snowwater content in the Sierra Nevada in 1983 exceeded 230 percent of normal. Snowmelt runoff movingthrough Central Valley rivers in 1983 was approximately four times the average volume. The combinationof storms in the first half of the 1983 water year and one of the wettest Septembers on record in1982 resulted in all major reservoirs operating within their flood management reservation pools by theend of March. During peak snowmelt runoff in June and July, all reservoirs reached or nearly reacheddesign capacity (USACE, 1999). The estimated exceedance interval for the 1983 event at the San JoaquinRiver at Newman and the Tuolumne River at Don Pedro Dam is 25 50 and 15 25 years, respectively(USACE, 1999).
The extent of flooding within the Mid SJR Region in 1983 as delineated in the Post Flood Assessment isshown in Figure 3 2, 1983 Detailed View of Flooding Extent. Refer to the Post Flood Assessment for mapsof the 1983 flooding extent for other portions of the Central Valley (USACE, 1999). One of the four leveebreaks that occurred within the San Joaquin River Basin was located in the Mid SJR Region and anotherwas in the vicinity, just downstream of the confluence of the San Joaquin and Stanislaus rivers. The leveebreak within the Mid SJR Region occurred on March 5th on a SPFC levee along the left bank (lookingdownstream) of the San Joaquin River just downstream of the confluence with the Tuolumne River andalong the San Joaquin River National Wildlife Refuge (SJRNWR), or the former RD 2100. This breakresulted in the inundation of 500 acres. The specific cause of this levee break is undocumented (DWR,2011a; USACE, 1968a). The levee break just downstream of the Mid SJR Region and the San Joaquin Riverand Stanislaus River confluence also occurred along a SPFC levee, but was along the right bank of theSan Joaquin River. The break occurred on March 29th and resulted in the flooding of 6,000 acres withinand just outside of the boundaries of RD 2064. The specific cause of this levee break is also unknown(DWR, 2011a; USACE, 1968b). Note that the flooding extent associated with the levee break downstreamof the San Joaquin River and Stanislaus River confluence was inferred rather than based on aerialphotography.

99
5
99
5
4
108
120
4
4988
88
108
49
5
49
41
99
41
33
180
33
99
152San LuisReservoir
Los BanosDetention Dam Friant Dam
Buchanan Dam
Hidden Dam
New Exchequer Dam
Don Pedro Dam
New Melones Dam
McSwain Dam
A l p i n eA l p i n eC o u n t yC o u n t y
A m a d o rA m a d o rC o u n t yC o u n t y
C a l a v e r a sC a l a v e r a sC o u n t yC o u n t y
F r e s n oF r e s n oC o u n t yC o u n t y
M a d e r aM a d e r aC o u n t yC o u n t y
M a r i p o s aM a r i p o s aC o u n t yC o u n t y
M e r c e dM e r c e dC o u n t yC o u n t y
S a c r a m e n t oS a c r a m e n t oC o u n t yC o u n t y
S a nS a nB e n i t oB e n i t oC o u n t yC o u n t y
S a n J o a q u i nS a n J o a q u i nC o u n t yC o u n t y
S t a n i s l a u sS t a n i s l a u sC o u n t yC o u n t y
T u o l u m n eT u o l u m n eC o u n t yC o u n t y
Fresno
Modesto
Stockton
Clovis
LosBanos
Madera
Selma
Atwater
Ceres
Galt
Livingston
Lodi
Manteca
Merced
Oakdale
RiverbankSalida
Turlock
Vineyard
PardeeReservoir
CamancheReservoir
New HoganReservoir New
MelonesLake
HetchHetchyReservoir
Farmington FloodControl Basin
TullochReservoir
Don PedroReservoir
LakeMcclure
BearReservoir
MariposaReservoir
EastmanLake
HensleyLake
Mid-San Joaquin River Regional Flood Managment Plan . 120802Figure 3-1
Major Flood Control Infrastructure within the San Joaquin River Basin
SOURCE: USDA, 2012; ESRI, 2012; DWR, 2013; ESA, 2013
Major Flood Control Infrastructure
State Plan of Flood Control Levee(Mid-San Joaquin River Region)
Non-project Levee
Mainstem San JoaquinRegional Limits
Bypass
Mid-San Joaquin Region ofState Plan of Flood Control Area
0 10
Miles
Chowchilla Bypass
Eastside Bypass
Mariposa Bypass

Mid San Joaquin River RFMP
3 6 3. Flooding and Flood Hazards
This page intentionally left blank

Mid San Joaquin River Regional Flood Management Plan . 120802
Figure 3-2Detailed View of Flooding Extent
1983
SOURCE: U.S. Army Corps of Engineers, Sacramento District, 1999
Flooded Area
Inferred Flooded Area
Area of Ponded Water
Levee Failure
Project Levees
Wildlife Refuge
Legal Delta
Urban Areas
Water Body
River
Canals
Hydrography
U.S. Highway
Interstate Highway
Major Highway
Transportation

Mid San Joaquin River RFMP
3 8 3. Flooding and Flood Hazards
Flooding in 1983 within Stanislaus, Merced, and San Joaquin counties resulted in more than $136 millionin damages. Table 3 2, 1983 Flood Damages Sustained and Prevented, includes damages sustained toprivate, public, and agricultural assets as well as roads, and estimates of damages prevented by floodmanagement projects within the San Joaquin River Basin. The majority of the damage in Stanislaus Countywas to agricultural lands, with $12 million in losses. Merced and San Joaquin counties sustained damagesvalued at $614,000 and approximately $123 million, respectively. Total damages prevented by the floodmanagement infrastructure within the San Joaquin River Basin were estimated at nearly $86.6 million.Prevented damages were calculated by USACE by subtracting residual damage, or the damage that didoccur even with existing flood management infrastructure in place, from estimated damages that wouldhave occurred without the existing flood management infrastructure in place. No lives were lost as aresult of flooding in the Central Valley in 1983.
Table 3 21983 Flood Damages Sustained and Prevented
Damages Sustained ($1,000)1
County Private Public Agricultural Road Total
Stanislaus $111 $541 $12,200 $35 $12,887
Merced $200 $414 $0 $0 $614
San Joaquin no data $25,204 $97,533 $35 $122,722
Total Damages Sustained $136,223
Damages Prevented
Project Damages Prevented ($1,000)1
Lower San Joaquin River Levees $6,600
Friant Dam $23,690
Hidden Dam $2,900
Buchanan Dam $3,400
Merced County Streams $10,200
New Exchequer Dam $14,400
Don Pedro Dam $12,700
New Melones Dam $12,700
Total Damages Prevented $86,590
1 Damages are in 1983 dollars. Prevented damages were calculated by USACE by subtracting residual damage, or the damage that did occur evenwith existing flood management infrastructure in place, from estimated damages that would have occurred without the existing floodmanagement infrastructure in place.
SOURCE: USACE, 1999
3.2.2 Flood Control System Performance – 1986 Flood
The floods of 1986 were caused by a series of four storms from February 11th through 19th. A 300 mile wideband of heavy precipitation was positioned along San Francisco to Sacramento to Lake Tahoe. Precipitationwithin this area in the nine day period of February 11th through 19th ranged from 100 to 200 percent ofnormal for the entire month of February. Several precipitation records were set during these storms,including the greatest precipitation in February in the State at the Four Trees station in the Feather River

Mid San Joaquin River RFMP
3. Flooding and Flood Hazards 3 9
Basin. The estimated exceedance interval for the 1986 event at the San Joaquin River at Newman and theTuolumne River at Don Pedro Dam is 10 20 and 30 40 years, respectively (USACE, 1999).
The San Joaquin River Basin was relatively unaffected when compared to the Sacramento River Basin in the1986 floods. The extent of flooding within the Mid SJR Region in 1986 as delineated in the Post FloodAssessment is shown in Figure 3 3, 1986 Detailed View of Flooding Extent. As shown, portions offloodplains where levees do not line the San Joaquin River were inundated, but not to a great extent. Withthe exception of Millerton Lake, all major San Joaquin River Basin reservoirs remained with more than 90percent of flood management reservation capacity available. Millerton Lake was operating with only 16percent of flood management capacity available. The San Joaquin River at Vernalis reached a peak of 29.86feet (gage datum), which is 0.86 feet above flood stage.
No damages were sustained in Stanislaus County during the 1986 event. San Joaquin County and MercedCounty sustained damages totaling over $13.7 million and $70,000, respectively. Table 3 3, 1986 FloodDamages Sustained and Prevented, includes damages sustained to private and public assets, andestimates of damages prevented by flood management projects within the San Joaquin River Basin. Floodmanagement infrastructure within the San Joaquin Valley was estimated to have prevented almost $218million in potential damages. One life was lost during the 1986 floods in Placer County in the SacramentoRiver Basin (USACE, 1999).
Table 3 31986 Flood Damages Sustained and Prevented
Damages Sustained ($1,000)1
County Private Public Total
Stanislaus $0 $0 $0
Merced $70 $0 $70
San Joaquin $6,500 $7,238 $13,738
Total Damages Sustained $13,808
Damages Prevented
Project Damages Prevented ($1,000)1
Lower San Joaquin River Levees $17,300
Friant Dam $33,190
Hidden Dam $1,900
Buchanan Dam $6,000
Merced County Streams $8,000
New Exchequer Dam $23,300
Don Pedro Dam $25,600
New Melones Dam $102,500
Total Damages Prevented $217,7901 Damages are in 1986 dollars. Prevented damages were calculated by USACE by subtracting residual damage, or the damage that did occur even
with existing flood management infrastructure in place, from estimated damages that would have occurred without the existing floodmanagement infrastructure in place.
SOURCE: USACE, 1999

Mid San Joaquin River Regional Flood Management Plan . 120802
Figure 3-3Detailed View of Flooding Extent
1986
SOURCE: U.S. Army Corps of Engineers, Sacramento District, 1999
Flooded Area
Inferred Flooded Area
Area of Ponded Water
Levee Failure
Project Levees
Wildlife Refuge
Legal Delta
Urban Areas
Water Body
River
Canals
Hydrography
U.S. Highway
Interstate Highway
Major Highway
Transportation

Mid San Joaquin River RFMP
3. Flooding and Flood Hazards 3 11
3.2.3 Flood Control System Performance – 1995 Flood
In January and March of 1995, the El Niño Southern Oscillation caused large rain storms in northern andsouthern California. The Sacramento River Basin was most affected by the storms in January, and theMarch rain storms primarily affected the coast and southern California. Snowpack water content wasmore than 150 percent of normal in the Sierra Nevada and a significant portion of the Sacramento RiverBasin. At the beginning of January, all of the major Sacramento and San Joaquin River reservoirs had morethan 100 percent of the flood management reservation pool available. After the January storm, floodmanagement reservation pool capacity varied greatly between reservoirs within both the Sacramentoand San Joaquin River Basins. This was also the case during the March storm, with Millerton Lake operatingwith four percent of flood management storage remaining and New Melones Lake, a very large reservoir,having 315 percent of flood storage available. All of the major reservoirs in the Sacramento or San JoaquinRiver Basins operated during the January 1995 floods with the majority of their flood management poolsavailable. Flooding that occurred in January was a result of the failure of storm drainage systems and localflooding along small streams (USACE, 1999). The estimated exceedance interval for the 1995 event at theSan Joaquin River at Newman and the Tuolumne River at Don Pedro Dam is 5 10 and 5 15 years,respectively (USACE, 1999).
Similar to the 1986 floods, the SanJoaquin River Basin was affected to amuch lesser extent than the SacramentoRiver Basin in the 1995 floods (USACE,1999). However, in March 1995, floodingfrom Orestimba Creek caused anestimated $5.6 million in damages in andaround the City of Newman. The March1995 storm was the largest on record(1932 – 2010) at Orestimba Creek. Flowsin Orestimba Creek reached 12,000 cubicfeet per second (cfs). Overland flow fromOrestimba Creek flooded agricultural
fields and inundated the City of Newman (USACE, 2012). The extent of flooding within the Mid SJR Region in1995 as delineated in the Post Flood Assessment is shown in Figure 3 4, 1995 Detailed View of FloodingExtent (USACE, 1999). As shown, small areas along the Tuolumne River just upstream of and at theconfluence with the San Joaquin River were inundated. Otherwise, flow remained in the river channelswithin and near the Mid SJR Region with the exception of flooding that occurred in the Orestimba Creekfloodplain (USACE, 2012). [Note that flooding from Orestimba Creek is not shown on Figure 3 4.] Therewas a levee breach along the left bank of the San Joaquin River near the southern boundary of theSJRNWR. The cause of the breach is undocumented (DWR, 2011a; USACE, 1968a). It does not appear thatflooding resulted from this levee breach (USACE, 1999).

Mid San Joaquin River Regional Flood Management Plan . 120802
Figure 3-4Detailed View of Flooding Extent
1995
SOURCE: U.S. Army Corps of Engineers, Sacramento District, 1999
Flooded Area
Inferred Flooded Area
Area of Ponded Water
Levee Failure
Project Levees
Wildlife Refuge
Legal Delta
Urban Areas
Water Body
River
Canals
Hydrography
U.S. Highway
Interstate Highway
Major Highway
Transportation

Mid San Joaquin River RFMP
3. Flooding and Flood Hazards 3 13
Damages in Stanislaus, Merced, and San Joaquin counties totaled $95.8 million and all losses wereagricultural assets. Table 3 4, 1995 Flood Damages Sustained and Prevented, includes damagessustained to private, public, and agricultural assets, and estimates of damages prevented by floodmanagement projects within the San Joaquin River Basin. Over $108.5 million in damages were estimatedto have been prevented by the flood management system within the San Joaquin River Basin (USACE,1999). No lives were lost as a result of flooding in the Central Valley in 1995.
Table 3 41995 Flood Damages Sustained and Prevented
Damages Sustained ($1,000)1
County Private Public Agricultural Total
Stanislaus $0 $0 $52,447 $52,447
Merced $0 $0 $38,854 $38,854
San Joaquin $0 $0 $4,499 $4,499
Total Damages Sustained $95,800 Damages Prevented
Project Damages Prevented ($1,000)1
Lower San Joaquin River Levees2 $583
Friant Dam $54,310
Hidden Dam $2,200
Buchanan Dam $1,800
Merced County Streams2 $2,400
New Exchequer Dam $25,700
Don Pedro Dam $19,500
New Melones Dam $2,100
Total Damages Prevented $108,593
1 Damages are in 1995 dollars. Prevented damages were calculated by USACE by subtracting residual damage, or the damage that did occur evenwith existing flood management infrastructure in place, from estimated damages that would have occurred without the existing floodmanagement infrastructure in place.
SOURCE: USACE, 1999
3.2.4 Flood Control System Performance – 1997 Flood
Severe flooding was caused in 1997 by the combination of the second wettest December on record in theSierra Nevada and three tropical storms that hit northern California on December 29, 30, and 31, 1996.Within three days, more than 30 inches of rain fell in the upper watersheds of the Sierra Nevada. Recordflows were a result in both the Sacramento and San Joaquin River Basins. In mid December, a cold stormbrought snow to the Sierra Nevada foothills, which was then melted by the three warm storms at the endof December. Snowmelt was estimated to account for approximately 15 percent of the total runoffvolume (USACE, 1999).
During the month of December 1996, the flood management reservation space in most of the majorreservoirs in the Sacramento and San Joaquin River Basins was needed to accommodate heavy rainfallprior to the three tropical storms at the end of the month. During the series of three storms at the end of

Mid San Joaquin River RFMP
3 14 3. Flooding and Flood Hazards
December, the flood management system in the San Joaquin River Basin was unable to contain thevolume of runoff coming from the Sierra Nevada. Millerton Lake and Don Pedro Reservoir both exceededtheir design capacity. Peak hourly inflow and outflow at Millerton Lake was 95,000 cfs and 63,000 cfs,respectively. At Don Pedro Reservoir, peak hourly inflow and outflow was 121,000 cfs and 59,000 cfs,respectively (USACE, 1999). The banks of the Tuolumne River overtopped in Modesto, Waterford, LaGrange, and Roberts Ferry because of high flows from Don Pedro Reservoir. The estimated exceedanceinterval for the December 1996 1997 flood event at the San Joaquin River at Newman and the TuolumneRiver at Don Pedro Dam is 90 110 and 80 110 years, respectively (USACE, 1999).
Numerous levee breaks occurred in the San Joaquin River Basin during the 1997 floods. The extent offlooding within the Mid SJR Region and the locations of levee breaks in 1997 as documented in the PostFlood Assessment are shown in Figure 3 5, 1997 Detailed View of Flooding Extent. As shown in Figure 3 5,levee breaks occurred along the Tuolumne and San Joaquin rivers within and near the Mid SJR Region. Atotal of 13 levee breaks occurred within Stanislaus County during the 1997 event. As stated in Table 3 5,the cause of each levee breach is unknown. Flooding occurred along the Merced River, Tuolumne River,and San Joaquin River, particularly within and near the SJRNWR. Areas within Modesto, Ripon, Waterford,La Grange, and Roberts Ferry were inundated.
Table 3 51997 Levee Breaches, Seepage, Boils, and Erosion in Mid SJR Region
Reclamation DistrictChannelCapacity (cfs) Description of Levee Damage
2031 (Elliot) 46,000 5 breaches, including one 350 feet long. Breach causes are unknown, but squirrelactivity was noted in the vicinity of 3 of the breaches and seepage was notedalong 2 breach repair sites during the 1998 high water event. It is suspected byproperty owners that one of the breaks occurred because of prolongedsaturation and pressure from flood waters. Wavewash damage at each of the 5breach locations along the landside toe and mid slope. Unknown if repairs havebeen made for wavewash damage.
2091 (Chase) 45,000 Severe seepage, sloughing of landside berm because of seepage, and extensiveboils
n/a 15,000 2 levee breaks, cause unknown
2099 (El Solyo Ranch) 46,000 One 200 foot wide breach, cause unknown; major wavewash damage along bothslopes and landside wavewash damage, evidence that erosion damage may nothave been repaired 2009 Kleinfelder reconnaissance noted 3 to 4 foot verticalface along waterside slope about 2 to 3 feet below the crest, linear extent maybe greater, but was obscured by dense vegetation.
2100 (White Lake Ranch) 46,000 3 breaches, cause unknown, seepage noted at 2 of the 3 repair sites after theevent; massive wavewash damage along the landside slope and shoulder withvertical faces of 6 to 7 feet, sometimes extending into the crown. It's unknown ifthe wavewash damage was repaired
2101 (Blewitt) 46,000 Cause of breach unknown, but heavy seepage and multiple boils were noted atthe breach repair site during the 1998 high water event; 1 to 2 inch widelongitudinal cracking noted along landside toe during 1997 event and wasattributed to a pump pit. During the 1997 event, the levee sustained wavewashdamage along the landside slope. A 3 to 4 foot vertical face in the landside slopewas repaired after the event.
SOURCE: DWR, 2011a; PBI, 2013; USACE, 1961; USACE, 1968a, 1968b, 1968c, and 1968d.

Mid San Joaquin River Regional Flood Management Plan . 120802
Figure 3-5Detailed View of Flooding Extent
1997
SOURCE: U.S. Army Corps of Engineers, Sacramento District, 1999
Flooded Area
Inferred Flooded Area
Area of Ponded Water
Levee Failure
Project Levees
Wildlife Refuge
Legal Delta
Urban Areas
Water Body
River
Canals
Hydrography
U.S. Highway
Interstate Highway
Major Highway
Transportation

Mid San Joaquin River RFMP
3 16 3. Flooding and Flood Hazards
A levee failure at Finnegan Cut and two levee breaches on the San Joaquin River resulted in floodingwithin RD 2031 boundaries (USACE, 1999). The RD 2031 levee was breached approximately 1/8 mile northof Highway 132. Anecdotal information suggests that the levee probably breached after prolongedsaturation and pressure from flood waters. The ground to the south of the District levee system is lowerand only a portion is protected by a private levee. Additionally, in 1997, river flood flows inundated anarea south of the District levee system, and reached the top of the District’s southern levee sectionmaintained by Mapes Ranch. This levee section also subsequently breached.
Water rose to within one foot of the crown of the RD 2091 project levee, and numerous boils north ofGomes Lake at an extreme bend in the levee and additional boils in other locations were noted. While theproject levee did not fail, the Gomes Lake Dike did subsequently fail. A section of the levee back slopeadjacent to the Gomes Lake Bypass Channel failed as well (PBI, 2013).
Four levee failures on the west levee along the San Joaquin River and levee failures in two locations alongthe east levee flooded the RDs 2099, 2100, 2101, and 2102 (USACE, 1999). RD 2101 has ongoing erosionproblems on the riverbank in front of levee during high flow events. In one area this riverbank erosion hasreached the toe of the levee. The USACE repair of the 1997 breach was not effective, and extensive seepageoccurs at that location in high water events. An attempt by the USACE to address this problem was made bybuilding up the river bank in front of levee, but was not completely successful (PBI, 2013). Another majorissue in the 1997 flood was entry of flood waters into RD 2101 from the south over Highway 132. Privatelevees along the river south of RD 2101 were breached by the heavy flows flooding the area to the southof Highway 132. Flood waters up to 2 3 feet deep subsequently flowed over Highway 132 into RD 2101(PBI, 2013). Downstream of the Mid SJR Region, water from the four breaches along the RD 2094 leveealong the San Joaquin River flooded RD 2096. At the confluence of the San Joaquin and Stanislaus rivers,the levee along the right bank of the San Joaquin River along the RD 2064 boundary failed in two places.The levee along the right bank of the San Joaquin River failed in three places near the boundaries of RD2075 (USACE, 1999).
In the 1997 flood, RD 1602 did not suffer a levee break. There was a significant boil and seepage on thelevee section next to Westside Properties, a small group of residences within the district boundary. At therequest of RD 1602, the USACE had previously placed a seepage berm behind the levee to prevent leveefailure because of seepage. However, seepage continued beyond the berm and standing water did impactthe Westside Properties structures. Flood waters impacted Las Palmas Avenue and nearby residencesabout one half mile to the north of RD 1602, but did not approach its northern levee extension. Floodwaters over Crows Landing Road entered RD 1602. When overbank flow from Salado Creek floodedportions of Patterson and surrounding areas, water was routed to RD 1602 through the local drainagenetwork and resulted in flooding within RD 1602 lands.
Flood waters nearly reached the crown of the levee that runs along the south end of RD 2063, but thelevees held. However extensive seepage and high flows in the slough that leads to the Victoria PumpingStation necessitated a pump installation while flooding was in progress.
A rural area of approximately 1,500 acres is located between the north boundary of RD 2092 and thesouth bank of the Tuolumne River. Several farms and structures and a mobile home park are locatedwithin this area. Privately constructed levees are present along the south bank of the Tuolumne River. Theentire area is unincorporated without a reclamation district. In the 1997 flood, this area flooded whenprivate levees failed on its upstream end. Structures were damaged and evacuation operations werenecessary. At least one death was associated with this flooding (PBI, 2013).

Mid San Joaquin River RFMP
3. Flooding and Flood Hazards 3 17
The Newman and Patterson wastewater treatment plants (WWTPs) were affected by the 1997 flood. Inthe 1997 flood, water elevations to the east of the Newman WWTP plant reached within two feet of thecrown of the City levee protecting the oxidation pond. Wave wash was a serious problem in that event,and the City has been slowly placing rip rap on the oxidation pond levee since, a project that is not yetcomplete. The Patterson WWTP did not flood in 1997, but after the event the City of Patterson placed fillto restore a significant erosion site on the bank of the San Joaquin River (Ignacio Lopez, personalcommunication, July 11, 2013; PBI, 2013).
Significant damages were sustained in Stanislaus, Merced, and San Joaquin Counties during the 1997floods, totaling almost $166 million. Table 3 6, 1995 Flood Damages Sustained and Prevented, includesdamages to individual, public, business, road and bridge, and agricultural assets. Significant damages werealso prevented in the San Joaquin River Basin. More than an estimated $331 million in damages wereavoided because of the flood management infrastructure that is in place. New Melones Dam alone isestimated to have prevented nearly $176 million. The USACE reported that no lives were lost as a result offlooding in the Central Valley in 1997 (USACE, 1999), though local sources reported one death (PBI, 2013).Highway 132, a vital transportation link, was closed as a result of flooding in 1997, flooding that occurredbecause of a levee breach in RD 2031. After the 1997 event, it was also recognized by Stanislaus Countythat the Crows Landing and Las Palmas Avenue Bridges that cross the San Joaquin River are also vitaltransportation links from areas west of the San Joaquin River to hospitals and other services east of theriver (PBI, 2013).
Table 3 61997 Flood Damages Sustained and Prevented
Damages Sustained ($1,000)1
County Individual Public Business Road Agricultural Total
Stanislaus $20,680 $23,200 $3,650 $0 $30,832 $78,362
Merced $0 $570 $0 n/a $7,610 $8,180
San Joaquin $46,500 $9,500 $10,000 n/a $13,455 $79,455
Total Damages Sustained $165,997
Damages Prevented
Project Damages Prevented ($1,000)1
Lower San Joaquin River Levees
Friant Dam $3,320
Hidden Dam $5,670
Buchanan Dam $2,180
Merced County Streams $27,500
New Exchequer Dam $86,210
Don Pedro Dam $30,690
New Melones Dam $175,770
Total Damages Prevented $331,3401 Damages are in 1997 dollars. Prevented damages were calculated by USACE by subtracting residual damage, or the damage that did occur even
with existing flood management infrastructure in place, from estimated damages that would have occurred without the existing floodmanagement infrastructure in place.
SOURCE: USACE, 1999

Mid San Joaquin River RFMP
3 18 3. Flooding and Flood Hazards
3.2.5 Levee Repair Investments
The USACE has emergency management authority under PL 84 99, Flood Control and Coastal Emergencies(33 U.S.C. 701n) (69 Stat. 186). Under PL 84 99, the USACE may undertake disaster preparedness,emergency response, and rehabilitation, activities. Table 3 7 includes a description of the rehabilitationassistance that the USACE provided after the 1997 flood. Rehabilitation assistance may have beenprovided after other flood events in the region or to other entities after the 1997 flood, but no recordswere obtained that described such assistance.
Table 3 7Rehabilitation Assistance under PL 84 99 After 1997 Flood
ReclamationDistrict Year Description of Repair Cost
1602 1997 Restored west levee along SJR with compacted fill in 2 locations– Levee Mile 0.89 at Lake Ramona and Levee Mile 5.47 to LeveeMile 5.71.
$449,200
2063 1997 Restored east levee from Levee Mile 1.81 to Levee Mile 2.27 byfilling wavewash damaged areas with fill and resloping to 3:1.Sand boils were also remediated from Levee Mile 5.52 to LeveeMile 5.64 by constructing a gravel berm on the landside of thelevee.
$1,060,000
2091 1997 Restored east levee along SJR after a breach from Levee Mile0.00 to Levee Mile 0.05. Clay fill topped with aggregate coursewas used to repair the breach and the waterside and landslideslopes were reset at 3:1 and 2:1, respectively.
unknown
2092 1997 Repaired damage from Levee Mile 0.09 to Levee Mile 1.25 withfill material over filter fabric on the waterside and 1 foot ofaggregate base course on the road shoulder.
$151,200
2100 and 2102 1997 Repair of 3 levee breaches Phase I – unknownPhase II – $1,200,000Phase III $968,450
Note: Rehabilitation assistance may have been provided after other flood events in the region or to other entities after the 1997 flood, but no recordswere obtained that described such assistance.
SOURCE: USACE, 1997a b, 2001 a d, 2006, 2007, and undated
3.3 Ent i t i es w i th a Ro le in
F lood Management In the Mid SJR Region, most flood management activities occur at the local level with an overlay of broaderplanning and oversight occurring at the state and federal levels. At the local level, there are many agencieswith discrete responsibilities and limited investment has been made to date in coordinating these foreffectiveness and efficiency.

Mid San Joaquin River RFMP
3. Flooding and Flood Hazards 3 19
3.3.1 State and Federal Agencies
The oversight agency for flood management in the Central Valley is the Central Valley Flood ProtectionBoard (CVFPB). The CVFPB mission is threefold, including to control flooding along the Sacramento and SanJoaquin rivers and their tributaries in cooperation with the USACE; cooperate with various federal, state, andlocal agencies in establishing, planning, constructing, operating, and maintaining flood management works;and maintain the integrity of the existing flood management system and designated floodways throughregulatory authority by issuing permits for encroachments. The USACE, United States Bureau of Reclamation(USBR), Merced Irrigation District (Merced ID), Turlock Irrigation District (TID), and Modesto IrrigationDistrict (MID) own and operate reservoirs within the San Joaquin River Basin (Table 3 1). These agencies,particularly the USACE, have been involved in the study, design, and construction of flood managementprojects, which are often part of multiple purpose facilities (e.g., reservoirs also used for water supply).
The role of DWR is described in Chapter 1 of the CVFPP. Per California Water Code (CWC) Sections 85328533, the State has a responsibility to build and maintain flood management facilities along the Sacramentoand San Joaquin rivers and tributaries to preserve the welfare of the residents and landowners within thereclaimed overflow basins in the Central Valley. Additionally, the State is responsible for responding toemergencies and public threats, and, therefore, has an interest in avoiding and mitigating known flood risks.
3.3.2 Local Maintaining Agencies
LMAs are any city, county, district, or other political subdivision of the State that is authorized to operateand maintain levees. Map 7, Local Maintaining Agencies, of the Atlas (Appendix A) includes thejurisdictional boundaries of all of the LMAs associated with the Mid SJR Region. Mid SJR Region LMAsinclude RDs 1602 (Del Puerto), 2031 (Elliot), 2063 (Crows Landing), 2091 (Chase), 2092 (Dos Rios Ranch),2099 (El Solyo Ranch), 2100 (White Lake Ranch), 2101 (Blewitt), 2102 (Lara Ranch), and the TID. TIDprovides water for the irrigation of land within Merced and Stanislaus counties between the Tuolumne andMerced rivers and east of the San Joaquin River; it is one of the responsible entities for the levee anddrainage facilities at Gomes Lake. Lands within Reclamation District Nos. 2099, 2100, and 2102 werepurchased by the federal government and are now owned by the USFWS and managed as a part of theSJRNWR. Under the requirements of CWC Section 9140, DWR prepares the LMA Annual Report forsubmittal to the CVFPB each year by December 31. Per CWC Section 9140, each LMA must provide DWRwith information regarding the levees that they operate and maintain by September 30 of each year.Refer to Appendix A for a description of the information that LMAs must submit annually to DWR.Table 3 8, Facilities Maintained by Mid SJR Region LMAs, includes a list of the levees that are maintainedby LMAs with jurisdictional boundaries that overlap with the Mid SJR Region of the SPFC.
In addition to the LMAs described above, Stanislaus, Merced, and San Joaquin Counties and the Cities ofPatterson, Newman, and Modesto have flood management responsibilities within the Mid SJR Regionplanning area. The General Plan for each of these cities and counties complies with Section 65300 of theCalifornia Government Code and identifies areas that are subject to flooding within the land use element;each addresses flooding in the safety and conservation elements. Each jurisdiction’s regulations and floodmanagement activities are briefly described below.

Mid San Joaquin River RFMP
3 20 3. Flooding and Flood Hazards
Table 3 8Facilities Maintained by Mid SJR Region LMAs
Sub region Area (acres) LMA
Facilities Maintained
LeveesTotal levees(miles) 2012 levee rating Structures
2012 structurerating
A 8,851 RD 2031 (Elliot) 7.15 miles of levee, left bank of the Stanislaus River; 6.04 miles oflevee, right bank of the San Joaquin River
13.19 MinimallyAcceptable
N/A N/A
B 685 RD 2101 (Blewitt) 3.20 miles of levee, left bank of the San Joaquin River; 0.31 milesof levee, right bank of the San Joaquin River
3.51 Unacceptable N/A N/A
C RD 2099 (El Solyo Ranch) 2.40 miles of levee, left bank of the San Joaquin River 2.4 N/A N/A N/A
2,410 RD 2100 (White Lake Ranch) 2.70 miles of levee, left bank of the San Joaquin River 2.7 N/A N/A N/A
RD 2102 (Lara Ranch) 1.80 miles of levee, left bank of the San Joaquin River 1.8 N/A N/A N/A
D 1,003 RD 2092 (Dos Rios Ranch) 3.76 miles of levee, right bank of the San Joaquin River 3.76 Acceptable N/A N/A
E RD 2063 (Crows Landing) 10.63 mile of levee, right bank of the San Joaquin River 10.63 Unacceptable PP (Nelson Drain) Unacceptable
12,850 RD 2091 (Chase) 7.59 miles of levee, right bank of the San Joaquin River; 0.33miles of levee, San Joaquin River, bank n/a1
7.92 Acceptable N/A N/A
NA 65 Turlock IrrigationDistrict (TID)
0.30 mile Gomes Lake Spur Levee1 0 (counted as RD2091)
N/A PP (Gomes Lake) Acceptable
F 2,968 RD 1602 (Del Puerto) 6.29 miles of levee, left bank of the San Joaquin River 6.29 Unacceptable N/A N/A
TOTAL 52.21 DWR, 2012c indicates that this levee is associated with RD, 2091, not NA 65.
SOURCE: Mid San Joaquin River Regional Flood Atlas (Appendix A); DWR, 2012c (LMA Annual Monitoring Report).

Mid San Joaquin River RFMP
3. Flooding and Flood Hazards 3 21
3.3.3 Counties, Cities, and Flood Control Districts
Stanislaus County manages flooding through land use planning and regulations; provision of emergencyresponse services and data used in flood risk analysis; and coordination with other agencies. SupervisorialDistricts 2, 3, and 5 are relevant to the Mid SJR Region planning area (Stanislaus County, 2013a). Chapter16.50, Flood Damage Prevention, of the Stanislaus County Code includes standards for construction,utilities, subdivisions, manufactured homes, recreational vehicles, and activities within floodways tominimize public and private losses because of flooding within special flood hazard areas within theunincorporated areas of the county. The Stanislaus County Office of Emergency Services; Chief ExecutiveOffice; Department of Public Works, Departments of Planning and Community Development and PublicWorks; and the Assessor’s Office each play a role in managing flood risk and flood hazards withinStanislaus County. Table 3 9, Stanislaus County Flood Management includes a description of theresponsibilities of each of the relevant parts of the Stanislaus County government.
Table 3 9Stanislaus County Flood Management
Role Department
Authority on mitigation planning, hazard response, and community issues;maintains historical data of past events; understands Emergency Operations Plansfor the County and nine cities; coordinates and provides emergency services
Office of Emergency Services
Prepares and updates the Multi Jurisdictional Hazard Mitigation Plan; providesinventory of current and future County facilities for hazard mapping, includinginsured value of each County owned facility; provides information to the publicregarding flood hazards
Chief Executive Office
Prepares and updates Safety and Housing Elements of the General Plan and MultiJurisdictional Hazard Mitigation Plan; establishes land use policy and regulation;develops mitigation goals and strategy
Planning and Community Development
Maintains inventory and valuation of public infrastructure including roads, trafficsignals, drainage facilities, lighting facilities, bridges, and airports; GIS mapcreation, research, data collection, data verification, and hazard analysis
Public Works
Determines property values; shares database and resources for risk assessmentanalyses
Assessor’s Office
Authority over land use decisions and land use planning Board of Supervisors
Authority over land use decisions and land use planning Planning Commission
SOURCE: Stanislaus County Multi Jurisdictional Hazard Mitigation Plan, Updated 2010.
Merced County manages flooding through land use planning and regulations; emergency responseplanning and preparation; provision of information regarding flood risk, including Base Flood ElevationCertificates for specific parcels; and coordination with other agencies. Chapter 18.34, Special Flood HazardAreas, of the Merced County Code includes floodplain management regulations. Provisions for floodhazard reduction are outlined in Section 18.34.050 and include standards for construction, utilities,subdivisions, manufactured homes, recreational vehicles, and activities within floodways. The Departmentof Code Enforcement, Development Services, Economic Development, Engineering, Planning, and PublicWorks are responsible for various aspects of flood management within Merced County. The Countyemploys an emergency preparedness coordinator and convenes meetings of the Emergency PreparednessCommittee each quarter. The Merced Streams Group and Merced Irrigation District collaborate with the

Mid San Joaquin River RFMP
3 22
Merced County Public Works Department in operating and maintaining the flood management systems inMerced County (Merced County, 2013). The San Joaquin County Flood Control and Water ConservationDistrict offers flood management services including providing floodplain map determination services toresidents, realtors, lenders, and insurance agents; copies of FEMA elevation certificates; site visits toreview flood and drainage issues and the Flood Zone Viewer, which is an online tool accessible from theCounty website that provides the designated flood zone for any address or Assessor’s Parcel Number inSan Joaquin County. The San Joaquin County website also includes flood emergency information, aninformational video, FEMA contact information, historical flood area map, general flood protectioninformation, and guidance on building within a floodplain.
The City of Patterson Public Works Department’s flood management responsibilities include providingrestrictions and regulations that govern use of floodplains; providing information on how property ownerscan protect themselves from flood damage; and providing information on the National Flood InsuranceProgram (NFIP) (Patterson, 2013). The City of Patterson Water Operations Division does not maintainlevees and, therefore, does not report to DWR as part of the annual LMA report process. The PattersonMunicipal Code includes regulations on flooding in Title 17, Flood Hazard Areas. Chapter 4.11, FloodplainManagement, of the Patterson City Code includes regulations intended to reduce flood losses. The CityManager is the designated Floodplain Administrator and is responsible for development permit review;review, use, and development of base flood data; notification of other agencies regarding alteration orrelocation of a watercourse; documentation of floodplain development; map determinations if conflicts inmapped boundaries arise; and remedial action for any violations of the regulations in Chapter 4.11.Departments that support the Floodplain Administrator in these duties include Building, CommunityDevelopment, and Public Works.
The Orestimba Creek Flood Control District (OCFCD) has jurisdiction over a 17,652 acre area north of theCity of Newman that includes a portion of the right bank of the San Joaquin River at the confluence withOrestimba Creek. The OCFCD was established in 1984 and has the responsibility for maintaining existingflood management facilities within its sphere of influence. Five directors are elected by local landownersto run the OCFCD and must hold title to land within the district boundaries (Stanislaus County, 2013b).
The City of Newman manages floods through land use planning, including serving as local sponsor in theOrestimba Creek Draft Interim Feasibility Study; land use regulations; a partnership with the StanislausCounty Office of Emergency Services; and coordination with local agencies such as the OCFCD. Chapter4.11, Floodplain Management, of the Newman City Code includes local regulations on land uses withinflood hazard areas as delineated by the Federal Insurance Administration or FEMA. Standards forconstruction, utilities, residential developments, recreational vehicles, building permits, and activitieswithin designated floodways are outlined in Chapter 4.11 of the Newman City Code.
The City of Modesto manages flooding through land use planning and regulations; provision of emergencyresponse services, data used in flood risk analysis, and annual flood fight training; and coordination withother agencies. The City of Modesto Municipal Code addresses the management of floods within Modestojurisdictional boundaries in Chapter 4, Floodplain Management of Title 9, Building Regulations. Article 5,Provisions for Flood Hazard Reduction, outlines standards for construction, utilities, land development,placement of manufactured homes, recreational vehicles, and activities within floodways. Methods ofreducing flood losses are listed in Section 9 4.104 and include restricting or prohibiting land uses whichare dangerous to health, safety, and property because of water or erosion hazards, or which result indamaging increases in erosion or flood heights or velocities; requiring that land uses vulnerable to floods,including facilities which serve those uses, are protected against flood damage at the time of initial

Mid San Joaquin River RFMP
3. Flooding and Flood Hazards 3 23
construction; controlling the alteration of natural floodplains, stream channels, and natural protectivebarriers, which help accommodate or channel floodwaters; control of filling, grading, dredging, and otherdevelopment which may increase flood damage; and prevention or regulation of the construction of floodbarriers that unnaturally divert floodwaters or increase flood hazards in other areas. A representativefrom the City of Modesto sits as one of three individuals on the RD 2091 Board of Trustees. Modesto iscontracted with RD 2091 to provide levee maintenance and limited emergency response (PBI, 2013).Departments involved in floodplain management include Community and Economic Development, PublicWorks, and Utility Planning & Projects.
3.3.4 Flood Management NGOs
Within the Mid SJR Region, there are several informal organizations with a flood management focus. TheSan Joaquin River Flood Control Association has the following stated purpose: “to improve the hydrauliccapacity of the channels of the San Joaquin River in order to minimize the risk of damage to adjacentlands.” At present, this ad hoc organization meets twice annually and includes participants from the entirelength of the San Joaquin River. The Lower Tuolumne Farmers are another informal organization ofapproximately 30 families and landowners who are working with the Modesto and Turlock IDs to makesure that their needs are considered in Don Pedro’s operational decision making, including floodoperations. Additionally, public private partnerships have developed among the USFWS, Tuolumne RiverTrust, River Partners, and DWR to develop floodplain expansion and floodwater attenuation concepts inthe region.
3.4 Emergency Response/
Pub l ic Sa fe ty In an event of a flood, there are several layers of emergency response that are employed, as shown belowin Table 3 10 Flood Emergency Responders, which depends on the location and type of flood emergency.There are two key separate components of flood response; levee flood fight operations and general publicsafety operations. Levee flood fight operations include emergency activities aimed at preventing failure ofa levee during a flood or containing flood waters in the event of a levee does fail. Reclamation districts,where they exist, have jurisdiction for performing levee flood fight operations. Among local jurisdictions inthe Mid San Joaquin River planning area, only the City of Modesto and some fire agencies are known tohave participated in some way in levee flood fight operations. In regard to the other responsecomponent, public safety operations, fire agencies provide fire suppression and rescue and law agenciesprovide traffic control and security functions. Public warning and evacuation activities may be shared bymultiple agencies depending on a jurisdiction’s response plans. Overall, public safety operations within anarea protected by a levee are performed by the local county or city agency, special purpose district (e.g., firedistrict), or community based organization that has jurisdiction within that area. Other entities, as shown belowin Table 3 8, also provide assistance during a flood emergency when requested. These various entities can helprespond to a flood emergency by providing coordination between agencies, as well as personnel andequipment for flood fighting.

Mid San Joaquin River RFMP
3 24
Table 3 10Flood Emergency Responders, Mid SJR Region
Responder Level Comment
Person(s) or organization(s) on the site 0 Any emergencyEmergency services units of the cities in the region 1 Any emergencyReclamation Districts 1602, 2099, 2100, 2101, 2102 1 Levees on the west bank of the San Joaquin RiverReclamation Districts 2031, 2063, 2091, 2092 1 Levees on the east bank of the San Joaquin RiverEmergency services units of the counties in the region 1 or 2 Any emergency, and by request from Level 1 respondersDepartment of Water Resources 2 Flood Operations Center, flood fight and Corps liaisonCalifornia Emergency Management Agency, Inland Region 3 Any emergency, by request of county (operational area)US Army Corps of Engineers 3 Specified water related emergencies, by request of DWRCalifornia Conservation Corps 3 Personnel and equipment for flood fightDepartment of Forestry and Fire Protection 3 Personnel and equipment for flood fightCalifornia Emergency Management Agency Headquarters 4 All emergencies, entire planning area, by request of Cal
EMA Region
SOURCE: DWR, 2009.
3.5 De l inea ted F loodp la in
Boundar ies The 100 year floodplain is defined by FEMA as the area with a one percent annual chance of flooding, equal toa 26 percent chance of flooding at least once over the life of a 30 year mortgage. The FEMA 100 yearfloodplain within and surrounding the Mid SJR Region is shown in Figure 3 6, 100 and 500 year FEMAFloodplain within the Planning Area and Map 16, FEMA 100 Year Floodplain, of the Atlas (Appendix A). Theprimary areas that have a one percent annual chance of flooding are identified by FEMA as Zone A or AE.As shown in Figure 3 6, the majority of the area along the San Joaquin River is designated Zone A. The ZoneA designation is applied to areas where detailed analyses were not performed in delineating the 100 yearfloodplain boundary and, therefore, base flood elevations (BFEs) are not available for those areas. Zone Aflood extents are typically estimated using observed flood extents or other simple methods. The 100 yearfloodplains along the Merced, Tuolumne, and Stanislaus rivers are classified as Zone AE, and this designationapplies to the 100 year floodplain where detailed analyses were completed and BFEs are available. Someparts of the AE Zone may be identified as “Floodway,” used to indicate the primary flow zone, where morestringent regulatory constraints apply. The identifier Zone AH is applied to ponded areas within the 100 yearfloodplain where average flood depths are between one and three feet and velocities are low. Zone AO appliesto shallow flow areas within the 100 year floodplain where average flood depths are between one and threefeet, but are subject to higher flow velocities. As shown in Figure 3 6, Subregions B, C, D, and E are locatedentirely within the 100 year floodplain boundary. Portions of sub regions A and F, or 7,524 and 1,475acres, respectively, are within the 100 year floodplain boundary. Portions of the Cities of Modesto,Patterson, Newman, and a 1,550 acre area along the Delta Mendota Canal between Patterson andNewman are located within the 100 year floodplain boundary. Subregions A through D are within a portionof the 100 year floodplain boundary that ranges from approximately 8.5 miles wide at the confluence of theSan Joaquin and Stanislaus rivers along the northern extent of Subregion A, to about 0.9 miles wide nearGrayson, downstream of Subregion D. Along Orestimba Creek, the 100 year floodplain extendsapproximately one mile to the north and south. The 100 year floodplains of the Stanislaus and Tuolumnerivers and Dry Creek extend into the City of Modesto by up to 0.5 miles in places.

Stanislaus River
Tuolu
mne
Riv
er
San Joaquin River
CaliforniaAqueduct
D
elta-Mendota
Canal
ÄÅ99
ÄÅ219
ÄÅ108
ÄÅ132
ÄÅ33
§̈¦5
ÄÅ33
ÄÅ99
§̈¦5
ÄÅ140
Oresti
mbaCr
eek
Del P
uertoCreek
Little Salado Cr eek
C reek
M e r c e dM e r c e dC o u n t yC o u n t y
S a n J o a q u i nS a n J o a q u i nC o u n t yC o u n t y
S t a n i s l a u sS t a n i s l a u sC o u n t yC o u n t y
Ceres
CrowsLanding
Empire
Grayson Keyes
Patterson
RiverbankSalida
Westley
Modesto
Newman
Salado
CD
E
A
B
F
Mid San Joaquin River Regional Flood Management Plan . 120802Figure 3-6
100- and 500-year FEMA Floodplain within the Planning Area
SOURCE: USDA, 2012; ESRI, 2012; DWR, 2013; ESA, 2013.
0 2
Miles
Mid San Joaquin River Region
Mainstem San Joaquin Regional Limits
State Plan of Flood Control Levee
Mid-San Joaquin Region ofState Plan of Flood Control Area
100 Year FEMA Floodplain
Zone A
Zone AE
Zone AH
Zone AO
500 Year FEMA Floodplain *
*It is anticipated that the 500 year floodplaincontinues east to the San Joaquin River inthe vicinity of the City of Patterson and inbetween Crows Landing and City of Newman,but it is not currently mapped.

Mid San Joaquin River RFMP
3 26 3. Flooding and Flood Hazards
This page intentionally left blank

Mid San Joaquin River RFMP
3. Flooding and Flood Hazards 3 27
The City of Patterson is located within the 100 year floodplain of Del Puerto Creek, which flows north ofthe City of Patterson but breaks out to the south during very large flood events, as well as beinginfluenced by breakout flows from the Hirschfield lateral entering the City from the south, which alsogenerates flooding in Patterson during 100 year flood events. The community of Grayson is located alongthe left bank of the San Joaquin River and is not located within the 100 year floodplain. The City ofNewman is within the 100 year floodplain of an irrigation canal that meets Orestimba Creekapproximately 3.5 miles north of the City of Newman. The 100 year floodplain of the San Joaquin Riveralso extends to the southwest edge of the City Newman. Portions of Modesto lie within the 100 yearfloodplain of the Stanislaus and Tuolumne rivers. Westley, Crows Landing, Turlock, Hilmar, Delhi, andRipon are outside of any 100 year floodplain.
The 200 and 500 year (0.5% and 0.2% annual chance of occurrence, respectively) floodplains weredelineated as a part of the Sacramento and San Joaquin River Basins Comprehensive Study(Comprehensive Study) prepared by the USACE (USACE, 2002). The 200 and 500 year floodplainboundaries as delineated in the Comprehensive Study are shown in Figure 3 7. The 500 year floodplainboundary is also delineated by FEMA and is provided in Figure 3 6. As shown in both figures, the500 year boundary extends beyond the 100 year floodplain to many noncontiguous areas along theSan Joaquin, Merced, Tuolumne, and Stanislaus rivers. Updated delineations of the 200 yearfloodplain boundaries within four defined regions of Central Valley have been completed as part ofthe DWR Central Valley Floodplain Evaluation and Delineation Program, as shown in Figure 3 8.
An updated Flood Insurance Study (FIS) that reexamines the extent of the 100 , 200 , and 500 yearfloodplains of the Tuolumne River and Dry Creek within, upstream of, and downstream of, the City ofModesto was recently completed. The floodplain boundaries delineated in the FIS will be used by FEMA todevelop Preliminary Flood Insurance Rate Maps (FIRMs), which will undergo a 90 day public review. ThePreliminary FIRMs will become Effective FIRMs after the FEMA mapping process is complete.
3.5.1 Designated Floodways (CVFPB)
In addition to the regulatory floodplains and floodways designated by FEMA, California has its own systemof Designated Floodways in the Central Valley. In this system, a Designated Floodway is the channel andthe portion of the adjoining floodplain that is required for the passage of a design flood, which is the floodthat the system is designed to adequately convey. It is also the floodway between existing levees asadopted by the CVFPB or the California Legislature. Projects within a Designated Floodway require anencroachment permit from the CVFPB. Figure 3 9, Designated Floodways, includes Designated Floodwayswithin the planning area. As shown, in many areas, especially along the San Joaquin River, the extent ofthe Designated Floodways within the floodplains of the planning area is less than the effective 100 yearfloodplain as delineated by FEMA. This is the case because the levees in these areas provide varying levelsof protection below that which would be required to convey 100 year flood flows. Maintenance ofchannel capacity in a Designated Floodway is the responsibility of the applicable RD.

Note: Composite floodplains shown do not includeoperational effects of headwaters reservoirs(storage facilities upstream of the major floodcontrol reservoirs).
Mid San Joaquin River Regional Flood Management Plan . 120802
Figure 3-7San Joaquin River BasinFloodplain Delineations
SOURCE: U.S. Army Corps of Engineers, 2001
5 0 5 Miles
10-Year Floodplain
50-Year Floodplain
100-Year Floodplain
200-Year Floodplain
500-Year Floodplain

Legend
N
200 10 40
Miles
Upper Sacramento River Study Area
Lower Sacramento River Study Area
Lower San Joaquin River Study Area
Upper San Joaquin River Study Area
Data Capture Area
Data Capture Area
Data Capture Area
Data Capture Area
County Boundary
Mid San Joaquin River Regional Flood Management Plan . 120802
Figure 3-8Central Valley Floodplain Evaluation and
Delineation Program Boundaries
SOURCE: DWR, 2013


Mid San Joaquin River RFMP
3. Flooding and Flood Hazards 3 31
3.6 Channel Conveyance
Capacity and Flood Forecast
Monitor ing Network The conveyance capacity of a channel is the maximum rate of flowing water that can be conveyed by ariver, canal, or bypass without exceeding a threshold value. As part of the Central Valley FloodManagement Planning (CVFMP) Program, channel capacities were calculated along portions of the SanJoaquin and Stanislaus rivers within the Mid SJR Region using a very limited hydrologic record from actualflood events without the consideration of temporal and spatial flow and depth variations. Thesecapacities are shown on Map 17, Channel Capacities and Flood Forecast Monitoring Network, of the Atlas(Appendix A). It is important to note that the calculated capacities do not reflect vegetation changes,channel sedimentation/erosion, or flood system degradation (e.g., because of encroachments,settlement, subsidence) or improvements implemented after the occurrence of the historical floods usedin the design capacity calculations (DWR, 2013a).
This analysis found that within the Mid SJR Region, 43 of 45 miles of river channel potentially cannot passdesign flows, predominantly on the San Joaquin River (DWR, 2011c). The San Joaquin River upstream ofthe Tuolumne River to the Merced River confluence has a design capacity of 45,000 cfs, but an estimatedcurrent capacity of only 22,000 – 35,000 cfs. Downstream of the Tuolumne River to the Stanislaus River,the design capacity is 46,000 cfs, while the estimated current capacity is only 25,000 cfs. The lowestreaches of the Stanislaus River (11.9 miles) have a design capacity of 12,000 cfs, though the estimatedconveyance capacity is far greater: 23,000 cfs. The lowest 0.6 miles of the Tuolumne River has a designcapacity of 15,000 cfs. (Current conveyance capacity for the Tuolumne was not estimated; however,riverside landowners along the lower Tuolumne River report flood damages when flows exceed 8,200 cfs.)Where levees contain these flows, capacities are based on an overall engineering estimate of leveeeffectiveness, not levee overtopping alone (DWR, 2011b).
The levee and diversion systems along the San Joaquin River are not designed to contain the objectiverelease from each of the upstream reservoirs simultaneously (USACE, 1999). An objective release is themaximum dam outflow allowed as specified in the USACE Water Control Plan. Objective flows aredefined for a specific river reach based on local conditions, collaboratively with local entities, and intendedto result in no damage to the system. Considerations in establishing objective flows may include leveestability, levee seepage, riparian habitat, and adjacent land uses (USACE, 1999).
Flood flow travel time is a key factor in flood management and unique in each system. Over time,sediment has accumulated within the northern portion of the San Joaquin River, which has decreased channelcapacity and increased travel time. Water released from Friant Dam on the San Joaquin River takes morethan five days to reach the confluence of the San Joaquin and Merced rivers and another two days to reachVernalis. The travel time for water released fromNew Exchequer Dam on the Merced River is 42 hours to theconfluence with the San Joaquin River. Releases from Don Pedro Dam on the Tuolumne River to Vernalistake approximately two days to travel to Vernalis. Discharges from New Melones Dam on the StanislausRiver take a little more than one day to pass through Vernalis (USACE, 1999). Rainstorms centered overthe Merced, Tuolumne, and/or Stanislaus rivers take between one and two days to arrive at the SanJoaquin River.

Mid San Joaquin River RFMP
3 32 3. Flooding and Flood Hazards
The DWR River Forecasting Section collaborates with the NWS California Nevada River Forecast Center(CNRFC) in providing daily reservoir inflow, river flow, and water level forecasts throughout California andportions of Nevada. The DWR Flood Operations Branch and the NWS use these forecasts in determiningthe appropriate level of Federal State flood response activation and operations. Table 3 11 includes theflood stage categories at key river gages along the San Joaquin, Merced, Tuolumne, and Stanislaus rivers. Atthe San Joaquin River at Vernalis gage, which is downstream of the Mid SJR Region, seepage begins to occurwhen flows reach a stage of 21 feet1; seepage becomes severe at 26 feet; and at 37.3 feet, the leveesovertop (NWS, 2013a). At the Newman gage of the San Joaquin River, seepage begins near the NewmanWWTP at a stage of 62 feet; at 63 feet levee patrols are required; Sand Slough begins to flow when stagereaches 63.6 feet; the Fisherman’s Bend Trailer Park north of Hills Ferry Road begins to flood at 65 feet;project flood stage is reached at 69.4 feet; the top of the levee that surrounds the Newman WWTP isreached at 70 feet; and at 71.7 feet, water reaches the top of the right bank levee (NWS, 2013b). Floodstage is reached at 71 feet on the Merced River at Stevinson (NWS, 2013c). On the Tuolumne River atModesto, extensive flooding occurs when the river reaches a stage of 67 feet. Extensive damage could becaused to residential, industrial, and commercial properties within the City of Modesto at flows greaterthan 40,000 cfs (NWS, 2013d). At the Orange Blossom Road gage along the Stanislaus River, inundation ofcamp sites at Caswell State Park occurs when the river reaches a height of 10.5 feet; at 11 feet, theOrange Blossom Park begins to flood; and at 11.5 feet, access roads and park areas at Caswell State Parkare flooded along with the lower areas within Orange Blossom Park (NWS, 2013e).
Table 3 11Flood Stage Categories along the San Joaquin, Merced, Tuolumne,and Stanislaus Rivers
River Gage
MajorFloodStage(feet)1
Discharge(cfs)
ModerateFloodStage(feet)1
Discharge(cfs)
FloodStage(feet)1
Discharge(cfs)
ActionStage(feet)1
Discharge(cfs)
San Joaquin Riverat Vernalis
37.3 80,800 32 50,000 29 34,000 24.5 22,400
San Joaquin Riverat Newman
71.7 >25,8002 70.7 >258002 69.4 >25,8002 63 13,200
Merced River atStevinson
75 10,029 73.8 9,080 71 6,865 67 3,090
Tuolumne Riverat Modesto
67 39,400 66 35,300 55 11,200 50.5 7,340
Stanislaus Riverat OrangeBlossom Bridge
22 >7,2383 21 >7,2383 16 >7,2383 13 >7,2383
1 Gage datum2 Stage Discharge records for San Joaquin River at Newman do not extend above 66.5 feet.3 Stage Discharge records for Stanislaus River at Orange Blossom Bridge do not extend above 12.4 feet.
SOURCE: NWS, 2013a e; CDEC, 2014a e
1 In this and each subsequent instance in this paragraph, river stage is presented relative to the gage datum.

Mid San Joaquin River RFMP
3. Flooding and Flood Hazards 3 33
3.7 Levee Cond i t ions Project levees, which are part of the State Federal Flood Protection System, and non project (local) leveesare both key flood management features within the planning area.
Protection provided by SPFC levees is defined by levee flood protection zones (LFPZ) per the requirementsof Assembly Bill 156 (AB156). An LFPZ is defined as the area that receives protection from a levee that is partof the SPFC facilities. There are generally three groups of LFPZs – areas that are subject to flooding fromponding of less than three feet deep, areas that are subject to flooding from ponding greater than three feetdeep, and areas subject to flooding from channels or overland flow where the depth is unknown. Maps thatdefine the boundaries of each type LFPZ were required under AB156. Map 3, Levee Flood Protection Zones,of the Atlas shows the LFPZ boundaries within the Mid SJR Region (Appendix A). The LFPZs associated withdepths of more or less than three feet generally apply to areas surrounded by levees where the lateralextent of flooding can be easily identified. The boundary of the unknown depth LFPZ should not beconsidered precise because these areas are not surrounded completely by levees or other hydrauliccontrols, and, therefore, require more information to delineate. The Estimated Depth Less Than 3’ LFPZdesignation applies to 514,895 acres within the Mid SJR Region. The Estimated Depth Greater Than 3’LFPZ designation covers 788,158 acres. A large portion of the subarea of Mid SJR Region that extends intoMerced County, or 343,636 acres, is characterized by the Depth Unknown LFPZ designation.
San Joaquin River flows that are less than the design flow may still result in levee damage and may seepthrough the levees and damage adjacent areas (USACE, 1999). The DWR Non Urban Levee Evaluations(NULE) project included the evaluation of over 560 miles of project and non project, non urban leveeswithin the San Joaquin River Basin, including those within the Mid SJR Region. The evaluation was the firstphase of a project to characterize the condition of the levees generally within the Sacramento and SanJoaquin River Basins, referred to as the North and South NULE study areas, respectively. The primarypurpose of the NULE project was to evaluate SPFC levees and appurtenant non SPFC levees to determinewhether they met geotechnical criteria and identify measures to meet those criteria, if necessary. Thefirst phase included non intrusive studies followed by field explorations, testing, and more detailedgeotechnical analyses on selected levees. The studies in Phase 1 of the South NULE project includedcomprehensive data collection efforts; the development of a database that included extensive recordsdescribing levee construction and performance during high flow events; field reconnaissance surveysalong 560 miles of non urban levee; geomorphic studies involving aerial photographs, vintage topographicmaps, regional geologic maps, soil survey maps, and existing topographic data; development of the LeveeAssessment Tool (LAT), which was used to assign hazard indicator scores that could be compared to pastperformance; coordination with local agencies, including interviews with over 40 LMAs; and developmentof conceptual remediation costs. The following four hazard categories were defined during LATdevelopment:
Hazard Level A – When water reaches the assessment water surface elevation (WSE), there is a lowlikelihood of either levee failure or the need to flood fight to prevent levee failure.
Hazard Level B – When water reaches the assessment WSE, there is a moderate likelihood of eitherlevee failure or the need to flood fight to prevent levee failure.
Hazard Level C – When water reaches the assessment WSE, there is a high likelihood of eitherlevee failure or the need to flood fight to prevent levee failure.

Mid San Joaquin River RFMP
3 34 3. Flooding and Flood Hazards
Lacking Sufficient Data (Category LD) – The segment is currently lacking sufficient data about pastperformance or hazard indicators to assign a hazard level, or there is poor correlation betweenpast performance and hazard indicator scores.
Levees within the South NULE study area were divided into 114 segments, and each segment wasevaluated according to four potential geotechnical failure modes – underseepage, slope stability, throughseepage, and erosion. Hazard scores for each of the four failure modes were used to generate an overallhazard category designation for each levee segment. Each segment was also reviewed in terms of leveegeometry, freeboard, and the history of overtopping (DWR, 2011a).
The hazard categories that were assigned to each of the 14 levee segments within the Mid SJR Region areprovided in Table 3 12. Figure 3 10 includes the location of each levee segment on a map. Most levees inthe Mid SJR Region were identified as having a high likelihood of failure, or the need for flood fighting toprevent failure. Underseepage and through seepage are the dominant issue; the Hazard Category C isassigned to 11 and 10 of the 14 segments for each of these issues, respectively. Additionally, fivesegments were given the Hazard Category C for documented erosion. Levee Segment 5002 was given ahazard category of LD because while erosion sites were not observed during site reconnaissance, oversteepened waterside slopes are shown in Light Detection and Ranging (LiDAR) data. However, crestwidths in the over steepened areas are 20 to 90 feet generally, and review of topographic maps do notsuggest a Hazard Level C for erosion hazard is appropriate along this levee segment. Detail is provided onthe basis for each of the assigned hazard categories in Volume 3, Appendix C of the GeotechnicalAssessment Report, South NULE Study Area (DWR, 2011a).
Table 3 12NULE Hazard Categories Assigned to Levees within Mid SJR Region
Potential Failure Mode
Underseepage Stability1 Through Seepage Erosion
Levee Segment Hazard Category190 C A C A
191 C A B A
194 C A C A
199 C A C A
200 B A B C
204 C B C A
205 C B C A
206 C A C C
207 B B B A
340 Not Assessed Not Assessed Not Assessed A
341 C A C C
5001 (non project) C A C C
5002 (non project) C A C LD (A/B)
5003 (non project) C A C C1 Stability was assessed independently of through seepage and underseepage. Seepage might cause instability not accounted for in the stability
assessment.
SOURCE: DWR, 2011a

Tuolu
mne
River
Sa n JoaquinRiver
CaliforniaAque
duct
D
elta-Men
dota Canal
ÄÅ219
ÄÅ108
ÄÅ132
ÄÅ33
§̈¦5
ÄÅ33
ÄÅ99
Orestim
baC
reek
Del
PuertoCr eek
Little Salad o Creek
M e r c e dM e r c e dC o u n t yC o u n t y
S t a n i s l a u sS t a n i s l a u sC o u n t yC o u n t y
Salado Creek
Modesto
Ceres
CrowsLanding
Empire
Grayson Keyes
Patterson
RiverbankSalida
Westley
Mid San Joaquin River Regional Flood Management Plan . 120802Figure 3-10
NULE Levee Segments within the Mid SJR Region
SOURCE: USDA, 2012; ESRI, 2012; DWR, 2013; ESA, 2013
0 4
Miles
Mid San Joaquin River Region
Mainstem San Joaquin Regional Limits
Mid-San Joaquin Region ofState Plan of Flood Control Area
Project Levees
Segment Endpoints
194
190
199
200207
205
204
341206
340
191

Mid San Joaquin River RFMP
3 36 3. Flooding and Flood Hazards
Map 11, Overall Levee Conditions, of the Atlas (Appendix A) includes a simplified representation of thecondition of project levees within the Mid SJR Region as evaluated under the South NULE effort andsupplemented with DWR annual inspection data and data from other sources, as presented in theDecember 2011 Flood Control System Status Report (FCSSR) (DWR, 2011c). The FCSSR included thefollowing Levee Status Factors in the evaluation of the status of SPFC levees: inadequate levee geometry;seepage; structural instability; erosion; settlement; penetrations; levee vegetation; rodent damage; andencroachments. Four categories are included in Map 11: levees with lower, medium, or higher concernand those lacking sufficient data for a designation.
With few exceptions, the project levees within the Mid SJR Region shown in Map 11 are designated as beingof higher concern. Levees along the entire river side of Subregions A, B, D, E, and F are designated as beingof higher concern. Along the river side of Subregion C, 9,476 feet of levee are designated of mediumconcern and the remaining length of the levee (26,583 feet) is considered of higher concern. In addition tolevees that form portions of the subregion boundaries, levees along the Tuolumne River upstream ofSubregion D are labeled as being of higher concern. A spur levee (1,580 ft) at the northeastern corner ofSubregion B and a 1,556 foot length of levee along the right bank of the Stanislaus River across from andjust upstream of Subregion A are characterized as being of lower concern. Levees directly across themajority of Subregion A, along with those downstream of the Mid SJR Region, are shown in Map 11 andcharacterized as being of higher concern, with the exception of two short levees in that area that arelabeled as being of lower concern.
The locations of project levees having known issues with seepage, slope instability, and erosion are shownin Maps 12, 13, and 14, of the Atlas, respectively (Appendix A). As shown in Map 12, seepage issues occuralong levees within Subregions A, B, E, and F. Levee seepage is not currently an issue within Subregions Cand D. Problems with slope instability are noted at one location within Subregion A, four locations withinSubregion D, three locations, one of which is a 7,000 foot levee segment, within Subregion E, and twolocations along Subregion F. Erosion is an issue within Subregions A (5 instances), B (3 instances),E (2 instances), and F (6 instances).
Map 15, Other Past Performance Problems, of the Atlas (Appendix A) includes the locations ofdocumented performance problems with project levees that are not associated with seepage, slopeinstability, and erosion. Table 3 13 includes brief descriptions of the performance problems shown inMap 15 and Figure 3 11, the latter of which includes labels to identify the location of each performanceproblem. As described in Table 3 11, these past levee performance problems relate to animal burrows,historic breaches, installed berms, pipe penetration, damage because of farming activities, and availablefreeboard.

Mid San Joaquin River RFMP
3. Flooding and Flood Hazards 3 37
Table 3 13Other1 Past Levee Performance Problems
SubregionFlood System Repair Project (FSRP)Point of Interest (POI) No. Performance Problem
191 5 1969 observation of squirrel burrows in landward slope. No significant damage to the levee from animal burrowing was observed in this area during the2012 site reconnaissance.
A 191 101 Site of 1969 levee breach. According to the RD 2031 representative, no seepage or boils have been observed in this area since 1978. No indications ofslope instability were observed during 2012 site reconnaissance.
191 107 Site of 1969 breach. According to the RD 2031 representative, no seepage or boils have been observed in this area since 1978. No indications of slopeinstability were observed during 2012 site reconnaissance.
341 104 Three breaches occurred in this area in 1997 and were repaired by the USACE. According to the RD 2031 representative, there has been no flood fightsubsequent to the breach repair. A few medium to large burrows were observed on landside and waterside slopes.
B 206 106 Site of 1969 levee break. According to the RD 2101 representative, the site was repaired by USACE. Seepage was observed in the area in 1997.
C n/a n/a
D 200 101 Berm placed on waterside shoulder in 1997 to prevent overtopping. Portions of a berm on the waterside shoulder were visible during 2012 sitereconnaissance. A 12 inch diameter irrigation pipe penetrating near the top of the levee and light poles on the slope were also noted.
E 194 104 Levee toe is cut about 12 inches, apparently by farming activities.
199 2 A 6 inch diameter vertical hole was noted in the middle of the levee crown in 2009. No damage was observed in this area during 2012 sitereconnaissance.
199 102 Per 1997 flood damage assessment inspection report, the spur levee broke and the repair was completed in 1997.
DWR_RD2063_01_s _ 2012_116 Minor cut by the farmer at the toe, about 24 inches, access roads on landside and waterside, erosion on the waterside is minor.
DWR_RD2063_01_s _ 2012_122 The landside toe is cut by farming activities, encroaching into the levee prism about 5 feet high and 150 feet long. The cut is in an area where the leveeextends away from the river towards high ground.
F 190 2 About 4 to 5 feet of freeboard at this location during the 1997 flood event. The RD 1602 representative indicated this location is just where the 1997observation was made and that in 1997 there was about 4 5 feet of freeboard along most of the levee. No additional field data were obtained during2012 site reconnaissance. This POI should be considered for removal from the FSRP POI list.
190 6 Animal burrows throughout waterside slope in 1997. Animal burrows were observed throughout this area and in the remaining portions of the leveesegment. This area appears to be a little lower elevation than upstream and downstream areas. This area experiences very little hydraulic head (about 1foot) at the Geotechnical Assessment Report (GAR) assessment water surface elevation. POI 190 6 is within the extent of POI 102 which also documentsextensive animal burrowing. POI 190 6 should be considered for removal from the FSRP POI list.
190 7 Sandbags placed in rodent holes on waterside slope in 1997. Major rodent activity was noted in the area. No evidence of sandbags or excessive burrowingwere observed at this location during 2012 site reconnaissance. Burrowing was noted as a problem throughout the levee segment, but appears to be alocal maintenance issue. The extent of POI 190 7 is within the extent of POI 102 which also documents extensive animal burrowing. POI 190 7 should beconsidered for removal from the FSRP POI list.
190 102 Burrows were evident throughout levee segment during 2012 site reconnaissance and appear to be a local maintenance issue.1 “Other” refers to performance problems with project levees that are not associated with seepage, slope instability, and erosion.
SOURCE: DWR, 2012b

")")
")
")
Tuolu
mne
River
Sa n JoaquinRiver
CaliforniaAque
duct
D
elta-Men
dota Canal
ÄÅ219
ÄÅ108
ÄÅ132
ÄÅ33
§̈¦5
ÄÅ33
ÄÅ99
Orestim
baC
reek
Del
PuertoCr eek
Little Salad o Creek
DWR_RD2063_01_s _ 2012_116
M e r c e dM e r c e dC o u n t yC o u n t y
S t a n i s l a u sS t a n i s l a u sC o u n t yC o u n t y
199-102
191-101
341-104
191-5
191-107
200-101
194-104
206-106
190-102
190-2
190-7
190-6
DWR_RD2063_01_s_ 2012_122
Salado Creek
CD
E
A
B
F
Modesto
Ceres
CrowsLanding
Empire
Grayson Keyes
Patterson
RiverbankSalida
Westley
Mid San Joaquin River Regional Flood Management Plan . 120802Figure 3-11
Locations of Other Past Levee Performance Problems
SOURCE: USDA, 2012; ESRI, 2012; DWR, 2013; ESA, 2013
0 2
Miles
Mid San Joaquin River Region
Mainstem San Joaquin Regional Limits
Mid-San Joaquin Region ofState Plan of Flood Control Area
Project Levees
Performance Problems (FSRP)

Mid San Joaquin River RFMP
3. Flooding and Flood Hazards 3 39
3.8 Ident i f i ed F lood ing and
F lood Hazards Identified flood hazards within the Mid SJR Region are located within the Cities of Modesto, Patterson,and Newman; agricultural lands that surround those cities; flooding also occurs on lands managed topreserve habitat along the San Joaquin, Tuolumne and Stanislaus rivers. This section includes adescription of known flood hazards. Some flood hazards are the result of cloudburst storms on smallwatersheds in populated areas; others are because of high river flows resulting from large storm systemsinteracting with flood management reservoirs and deficient levee systems. The most devastating floodswithin the Central Valley are caused by warm Pacific storms that sweep in from the west or southwest,picking up moisture over thousands of miles of ocean, causing torrential rains when intercepted by themountains surrounding the Central Valley (DWR, 2012a).
As shown in Figure 3 12, land uses within the 500 and 100 year floodplain include urban; rural and semirural agricultural; native vegetation and grazing land; farmland of prime and Statewide importance; localand unique farmland; and confined animal agriculture. Table 3 14 includes the area in acres associatedwith each of these land uses within the 100 year floodplain boundary. During the 100 year event, somedegree of damage to a significant portion of the assets within the 100 year floodplain lands could occur.Table 3 15 includes the population, households, number of parcels, and total value of assets within the100 and 500 year floodplains in Stanislaus County. Table 3 16 includes a summary of flood hazardexposure information for Stanislaus County.
3.8.1 City of Modesto
Flood risk within the City of Modesto is a result of proximity to the Tuolumne and Stanislaus rivers andDry Creek as well as the operations of large reservoirs on the rivers. The Tuolumne River represents thegreatest flood threat to Modesto, particularly when flows are high in the Tuolumne River and rain is heavyin the Dry Creek watershed (FEMA, 2008). During large winter rainstorms, Dry Creek contributessignificant but short duration flood flows to the Tuolumne River (McBain and Trush, 2000). Flooding alongthe Tuolumne River occurs as a result of rainstorms from November through March and snowmelt fromApril through May. Snowmelt floods along the Tuolumne River have lower peaks that those generated byrain, but are longer in duration with a greater volume of water.
The 2010 – 2015 City of Modesto Local Hazard Mitigation Plan (LHMP) identifies the Modesto City Countyairport, schools, utility infrastructure, emergency services, agriculture, sanitation facilities, and residentialdevelopment as potentially affected by flooding within the city. On one or more occasion each winter,flood water backs up on Morton Boulevard, a minor street, from underneath the La Loma Bridge at theconfluence of the Tuolumne River and Dry Creek and exposes a number of houses along Dry Creek topotential flooding. In addition to flooding because of structural failure or levee overtopping, the failure ofNew Melones, Don Pedro or LaGrange Dams would cause severe flooding within Modesto that would beexpected to result in injuries, loss of life, limited transportation routes, and utility services. The ModestoLHMP includes a series of policies that form a mitigation strategy to manage flood risk in the City(Modesto, 2011). Specific flood management projects that have been identified within the City ofModesto are provided in Chapter 7, Proposed Regional Improvements, of this plan. These include theNortheast Storm Drainage Interceptor Project and improvements to the City of Modesto wastewatertreatment facilities.

Mid San Joaquin River RFMP
3 40 3. Flooding and Flood Hazards
This page intentionally left blank

Stanislaus River
Tuolu
mne
Riv
er
San Joaquin River
CaliforniaAqueduct
D
elta-Mendota
Canal
ÄÅ99
ÄÅ219
ÄÅ108
ÄÅ132
ÄÅ33
§̈¦5
ÄÅ33
ÄÅ99
§̈¦5
ÄÅ140
Oresti
mbaCr
eek
Del
PuertoCreek
Little Salado Cr eek
C reek
M e r c e dM e r c e dC o u n t yC o u n t y
S a n J o a q u i nS a n J o a q u i nC o u n t yC o u n t y
S t a n i s l a u sS t a n i s l a u sC o u n t yC o u n t y
Ceres
CrowsLanding
Empire
Grayson Keyes
Patterson
RiverbankSalida
Westley
Modesto
Newman
Salado
Mid San Joaquin River Regional Flood Management Plan . 120802Figure 3-12
General Plan Land Uses within 100- and 500-year FEMA Floodplains
SOURCE: USDA, 2012; ESRI, 2012; DWR, 2013; ESA, 2013
0 2
Miles
Mid San Joaquin River Region
Mainstem San Joaquin Regional Limits
State Plan of Flood Control Levee
Mid-San Joaquin Region ofState Plan of Flood Control Area
San Joaquin General PlanAgriculture/General
City
Open Space/Resource Conservation
Public
Merced General PlanAgricultural
Industrial
Stanislaus General PlanAgriculture
Commercial
Highway Commercial / Planned Development
Industrial
Planned Development
Planned Industrial
Residential - Low Density
Residential - Medium Density
Residential - Medium/High Density
Salida Community Plan
Urban Transition

Mid San Joaquin River RFMP
3 42 3. Flooding and Flood Hazards
This page intentionally left blank

Mid San Joaquin River RFMP
3. Flooding and Flood Hazards 3 43
Table 3 14Area Covered by Land Use Types within 100 year Floodplain in Mid SJR Region
Land Use Category1 Acres of Land Type % of Total Area
Urban and Developed Land 1,264 5%
Native Vegetation and Grazing Land 4,955 19%
Local and Unique Farmland 6,831 26%
Prime and Statewide Importance Farmland 12,134 47%
Confined Animal Agricultural Land 561 2%
Rural and Semi Agricultural Land 193 1%
Total 25,936 100%1 See Appendix A for descriptions of how land use categories were defined.
SOURCE: Mid San Joaquin River Region Flood Atlas (Appendix A)
Table 3 15Population and Assets within 100 and 500 year Floodplains in Stanislaus County
River Population Households Number of Parcels Total Value
100 year Floodplain
Del Puerto Creek 248 71 139 $49,686,842
Dry Creek 747 273 146 $143,550,227
Orestimba Creek 588 223 189 $48,685,552
Salado Creek 38 10 31 $8,795,382
San Joaquin River 2,354 676 630 $149,520,110
Stanislaus River 2,322 892 268 $117,176,939
Tuolumne River 4,766 1,566 974 $187,806,940
500 year Floodplain
Del Puerto Creek 375 112 194 $62,664,305
Dry Creek 747 273 149 $149,644,108
Orestimba Creek 927 338 300 $77,913,338
Salado Creek 221 70 67 $16,659,356
San Joaquin River 2,408 694 668 $166,250,814
Stanislaus River 2,460 943 465 $200,322,760
Tuolumne River 11,177 3,555 2,162 $578,719,622
SOURCE: 2010 Multi Jurisdictional Hazard Mitigation Plan

Mid San Joaquin River RFMP
3 44 3. Flooding and Flood Hazards
Table 3 16Stanislaus County Flood Hazard Exposure
County Statistics
Total Acreage 970,172
Total Population 447,034
Total Structures 151,500
Total Value of Structures and Contents $38.8 billion
Total Agricultural Acreage 376,858
Total Value of Crops $857.3 million
Summary of Exposure to Flood Hazard
100 year event 500 year event
Exposed Area (acres) 61,984 81,320
Percent of Area Exposed 6 8
Population Exposed 14,544 36,621
Percent of Population Exposed 3 8
Structures Exposed 3,879 10,434
Total Depreciated Replacement Valueof Exposed Structures and Contents
$802.2 million $2.2 billion
Exposed Crops (acres) 40,331 54,493
Value of Exposed Crops $54.4 million $91.8 million
Department of Defense FacilitiesExposed
0 0
Essential Facilities Exposed 6 23
High Potential Loss Facilities Exposed 1 1
Lifeline Utilities Exposed 1 1
Transportation Facilities Exposed 37 51
Transportation Segments Exposed(miles)
29 40
Native American Tribal Land Exposed(acres)
0 0
Total Sensitive Plant Species Exposed 19 19
Total Sensitive Animal Species Exposed 34 34
SOURCE: Figure D 99 Summary of Available Flood Types, Flood History, and Flood Hazard Exposure, Stanislaus County
The City of Modesto treats wastewater at two facilities, the Sutter Avenue Primary Treatment Plant alongthe right bank of the Tuolumne River adjacent to Bellenita Park and the Jennings Road SecondaryTreatment Plant on the right bank of the San Joaquin River. These facilities are at a relatively high risk offlooding because they are located along the Tuolumne and San Joaquin rivers. As part of one alternativeto plant upgrades in the 2007 Wastewater Treatment Master Plan Update, a concrete wall constructionlevee was proposed that would be built along the river side of the Sutter Avenue Primary Treatment Plantto an elevation of 70 feet and provide approximately two feet of freeboard over the 100 year floodplainelevation. A berm levee was described for the north, east, and west boundaries of the facility. Thepotential for the concrete wall levee to result in flooding upstream was acknowledged, and an alternative

Mid San Joaquin River RFMP
3. Flooding and Flood Hazards 3 45
was also considered in the form of fill placement to protect primary treatment facilities from the 100 yearevent as well as reduction in the size of the sludge drying beds (Modesto, 2007). A supplement to the2007 Wastewater Treatment Master Plan was released in 2008, and noted the need for improvements toexisting flood management levees at the Sutter Avenue plant because of seepage from the TuolumneRiver that impacts irrigation fields during high flows. It was also acknowledged that seepage may be athreat to the foundation of the chlorine building, and that levee stability improvements are warrantedwhere sand boils have occurred, as well as improvements to control subsidence at the building and a newretaining wall (Modesto, 2008). A feasibility study is currently underway to evaluate potential solutions toflood hazards at the Sutter Avenue and Jennings Road treatment plants. Initial analysis under the ongoingfeasibility study indicates that providing 200 year protection at the Sutter plant may be economicallyfeasible, and the City is considering the option of attaining a 200 year level of protection instead of the100 year level of protection that has been considered previously. The City is also considering a concretewall construction levee at the Jennings Road Secondary Treatment Plant similar to what is describedabove for the Sutter Avenue plant (Laura Anhalt, personal communication, September 26, 2013).Information on potential flood management improvements that the City of Modesto is in the process ofexploring is provided in Chapter 7, Proposed Regional Improvements, of this plan.
3.8.2 Westside Tributaries; Cities of Patterson and Newman
Flooding within Patterson and Newman can occur as a result of rainstorms originating over the PacificOcean generally from October through April. These rainstorms can deliver precipitation to one or more ofthe Westside tributary drainages of the San Joaquin River Orestimba, Salado, and Del Puerto creeks. Ininstances of heavy precipitation in one or more of the Westside tributary watersheds, floodingcharacterized by high peaks, moderate duration, and a large runoff volume can occur. Downstream of theDiablo Range foothills, the carrying capacity of Orestimba, Salado, and Del Puerto creeks is reducedbecause of siltation and vegetation (FEMA, 2008). Flooding is primarily in the form of sheetflow that isgenerally less than two feet in depth with an unpredictable flowpath. Cloudburst storms in this area arerare and generally result in minor flooding. Streamflow records for Orestimba and Del Puerto creeks arerelatively short (1932 and 1959 to present day, respectively), and Salado Creek does not have astreamflow gage.
Historic and contemporary accounts of flooding within Patterson and Newman are relatively few. Thelargest flood on record was in April 1958, with a peak flow of 10,200 cfs at the Orestimba Creek atNewman gage. That event resulted in damage to agricultural facilities in the Orestimba Creek Basin as wellas public, commercial, and residential assets within the Salado Creek Basin. Evacuation of residents andflood fighting with sandbags was required in both basins. The most costly flood within the Westsidetributary area prior to the costly 1995 flood event (see Section 3.2.3 for a description) was in February1980, resulting in nearly $340,000 in damage within the Orestimba Creek Basin and $1 million within theCounty’s Westside region. A flood in December 1955 caused significant damage to agricultural,residential, and commercial properties; roads and culverts; and SPRR ballast (railbed) and ties as well asbreaks in the Delta Mendota Canal.
In February 1959, Patterson received more than two inches of rain within 24 hours. Flooding fromOrestimba Creek eroded the west Anderson Road Bridge embankment, resulting in cracks in the bridge. Inthat event, floodwater from Del Puerto Creek felled several telephone poles and lines and washed out acanyon bridge east of Interstate 5. Within Patterson, pumping was required to remove flood waters fromlocal streets.

Mid San Joaquin River RFMP
3 46 3. Flooding and Flood Hazards
Approximately six inches of rain within the Orestimba Creek Basin in early February 1963 inundated2,000 acres of farmland four to five miles north of Newman, which caused erosion and silt and debrisdeposition. Additionally, erosion occurred at the Delta Mendota Canal siphon and the approaches to bothroad and railroad bridges. In January 1969, three to five inches of rainfall caused erosion, sedimentdeposition, and impacted walnut orchards. A Salado Creek embankment south of Patterson failed inMarch 1983, and State Highway 33 was inundated north of town. The evacuation of some Pattersonresidents was carried out during that event.
Orestimba, Salado, and Del Puerto creeks are each constricted at the Delta Mendota Canal, andfloodwaters pond to the west of the canal as a result. The overchute that allows Salado Creek flows topass over the Delta Mendota Canal, located approximately three miles upstream of Patterson, has acapacity of 710 cfs, or approximately the 50 year event (two percent annual change of occurrence)(FEMA, 2008). The overchute constricts Salado Creek flood flows when it is active. Ponding at SaladoCreek is diverted to the southeast for a few miles where flood flows reenter the creek, but addsignificantly to flood flows near the Naval Auxiliary Landing Field northwest of Crows Landing. The channelcapacity of Salado Creek downstream of the overchute is 300 cfs, and high flows exceed the banks atseveral locations southwest and west of Patterson. Flood flows do not return to Salado Creek because thefloodplain slopes away from the channel and small levees would block the return. Sheetflow from SaladoCreek enters Patterson from the west, and generally flows from southwest to northeast. Ponding occurswithin Patterson along the SPRR embankment because it is three feet higher than the land surface andexisting drainage structures are not effective. When all three Westside tributaries are generating overlandflow, the severity of flooding in Patterson in these areas is intensified, and substantial ponding offloodwaters occurs where channel, culvert, and bridge capacities are insufficient, particularly alonglevees, County road embankments, and the SPRR. In these instances, floodwater ponding is generallydeeper than overland flow, and either overtops the obstruction, is directed along the obstruction, ordissipates by seepage and evaporation.
The City of Patterson WWTPis located on the left bank ofthe San Joaquin River justnorth of the East Las PalmasAvenue/West Main Streetriver crossing and across theriver from RD 2091. TheWWTP is located on a lowbench 2 3 feet above a lowersection of river bank thatextends approximately 300yards to the river channel.Past high flows on the SanJoaquin River have flooded the lower riverbank area on the east side of the plant. In the modest 2011high flow event, flood waters are reported to have reached the base of a fence that surrounds the plant.After the 1997 flood, the City placed fill to restore a significant site of riverbank erosion. Continuederosion of the riverbank could result in greater flood risk at the WWTP. High flow events result in a spikein inflows to the WWTP, probably through interconnections with the stormwater system in DowntownPatterson. The problem is greatest when rain in the Coast Range cause Salado Creek to overflow. In 1997,these greatly increased inflows into the plant caused continuing problems with the maintenance of

Mid San Joaquin River RFMP
3. Flooding and Flood Hazards 3 47
biological treatment processes. During heavy rains December 2012, the inflow into the plant reached thecapacity of 2.25 million gallons per day. The plant currently does not have the capability to bypassexcessive flows in its sewage lines into larger existing storage ponds. In an excessive inflow situation, theplant operator may have to sacrifice one or more treatment processes to try to contain the water. Thepotential exists for discharge of inadequately treated waste into the river and extended failure oftreatment capability. The plant manager estimates that after surges in inflow, it could take up to 30 daysto restore the biological communities used in secondary treatment of wastewater at the plant. The City iscurrently developing a master plan that will guide future development of the facility and this municipalfunction (PBI, 2013).
Orestimba Creek, one of the Westside tributary drainages cited above, is a primary source of flooding inNewman. The problem is sufficiently severe to have led to a recent USACE investigation of possible fixes.The following three problems were identified in the Orestimba Creek Draft Interim Feasibility Study(USACE, 2012):
1. There is a high probability of flooding which threatens public health and safety in the City ofNewman and surrounding rural areas.
2. The City of Newman and surrounding agricultural land have incurred damages from past flooding.The March 1995 event resulted in approximately $7.8 million in damages (2011 dollars) toagricultural land and crops, residential and commercial properties, the Delta Mendota Canal, theCentral California Irrigation District (CCID), bridges, and road crossings.
3. The Orestimba Creek channel has been altered by human activity (sand and gravel extraction andfarms encroaching on banks). The capacity of the channel has been increased between the DeltaMendota Canal and Jorgensen Road, and the channel slope reduced between Jorgensen and MorrisRoads. There is significant transport capacity and reduced sediment load downstream of JorgensenRoad, which may be why the local channel geometry has changed in the recent past.
During events between the 3 and 10 year (33% and 10% annual chance of occurrence, respectively),flows begin to exceed channel capacity downstream of Jorgensen Road and inundate adjacent agriculturalland. Floods greater than the 10 year event are diverted 2.5 miles from the channel into Newman.Overland flow collects along the CCID Main Canal on its west side and the California Northern Railroad(CNRR) embankments. Water is then conveyed south along Highway 33 and the CNRR berm to Newman.Flows continue over the highway and railroad berm, over fields and farm roads, and finally to the SanJoaquin River. Local topography and the shallow, unconfined nature of flooding in this area cause theexact course of floodwater to be unpredictable (USACE, 2012).
San Joaquin River flows also pose a flood hazard to the Newman WWTP, which is located one milenortheast of Newman along the left bank of the San Joaquin River on Hills Ferry Road. When stage in theSan Joaquin River reaches 62 feet above msl, landside seepage begins near the Newman WWTP. At 70feet above msl, the river reaches to the top of the levee that surrounds the Newman WWTP (NWS,2013b). A description of potential flood management improvements that the City of Newman is exploringfor the Newman WWTP is provided in Chapter 7, Proposed Regional Improvements, of this plan.
Landowners along Del Puerto Creek have concerns regarding flood risk and potential property damage.They recognize the need for a coordinated effort to improve flood management along Del Puerto Creek,but lack sufficient resources. The West Stanislaus Resource Conservation District notes similar issuesalong Orestimba Creek (Matthew Danielczyk, personal communication, 2013). Stakeholders suggest thatthere is potential for an organized group of landowners, resource conservation districts, and other
Mid San Joaquin River RFMP
3 48 3. Flooding and Flood Hazards
stakeholders, including organizations such as Audubon California, to form and begin to address floodhazards within the Del Puerto Creek, Orestimba Creek, and Solado Creek watersheds. A description of apotential regional improvement addressing this opportunity is provided in Chapter 7, Proposed RegionalImprovements, of this plan.
3.8.3 Managed Environmental Lands
Many environmental lands along waterways in the Mid San Joaquin River corridor are intended to flood,including lands within the SJRNWR and at Dos Rios Ranch at the confluence of the Tuolumne and SanJoaquin rivers. As previously described, floodplain inundation can be enormously beneficial to nativespecies and riparian habitat. For these lands, flooding is a positive event.
Lands within RDs 2099, 2100, and 2102, referred to collectively as “The Three Amigos,” were purchased bythe federal government for flood relief after the 1997 flood as a “Non Structural Alternative (NSA)” under PL84 99. The intent was to remove the levees from the SPFC and allow flood inundation to occur on these lands.These lands are now owned by the USFWS and managed as a part of the SJRNWR. The Three Amigos cover anarea of approximately 3,200 acres. During the 1997 flood event, four failures occurred on the west or leftbank levee along the San Joaquin River flooded RDs 2099, 2100, 2101, and 2102. These levees weresubsequently repaired even as steps were being taken to implement the NSA. Since that time, however, theSJRNWR has continued to experience flooding, most recently in late December 2010, early January 2011,and late March 2011. This flooding occurs as high river flows back up the West Stanislaus Irrigation Districtintake canal, which cuts across the SJRNWR between RD 2100 (Hagemann Tract) and RD 2102 (LaraTract). The canal was at one time protected at its mouth by a levee penetrated by a dual box culvertconnection to the canal which was damaged and removed some years ago. The canal is bordered byberms that are prone to overtopping and breaching in high water. At the end of December 2010, floodwater flowed through such a breach and flooded a portion of the Lara tract. Flooding in late March 2011resulted in extensive flooding at the SJRNWR, including both the Lara tract and the Hagemann tract.Drainage of floodwaters from behind breached levees often requires active pumping. Following flooding inthe spring of 2006, pumps were inaccessible and lands on the dry side of the RD 2100 levee (Hagemanntract) were inundated for months after the river levels had receded. Such long duration flooding hasnegative impacts to natural areas, as was documented by River Partners (2008).
Dos Rios Ranch, or Reclamation District 2092, is a 1,600 acre area managed by the Tuolumne River Trustand River Partners located between the SJRNWR and the Tuolumne River Regional Park. The 497 acreHidden Valley Ranch, adjacent to Dos Rios Ranch, provides all of the lands that are flood protected by thelevee in RD 2092 (approximately 1,000 acres total). Like Three Amigos, the management of Dos RiosRanch will seek to retain or enhance its function as active floodplain to provide ecological benefits. As ademonstration of its accessibility to flooding even under current conditions, floodplain fields within theDos Rios Ranch property were flooded on March 27, 2011 when the 3 to 5 foot berms that run along thefields were overtopped by flood flows.
3.8.4 Agricultural Lands Not Protected by Project Levees
Many floodplain lands are farmed in the Mid SJR Region. In general, these lands are protected from smallfloods by berms (often described as private levees, yet not engineered) and active flood fighting. Landsprotected by such berms are prone to frequent flooding, much as the Dos Rios Ranch example citedabove.

Mid San Joaquin River RFMP
3. Flooding and Flood Hazards 3 49
3.8.5 Dam Inundation Hazard
Dam failure is the breakdown, collapse or other failure of a dam structure characterized by theuncontrolled release of impounded water that results in downstream flooding. The 2010 StanislausCounty Multi Jurisdictional Hazard Mitigation Plan includes a map with the extent of the dam inundationhazard area associated with Don Pedro, Exchequer, New Melones, San Luis, Pine Flat, and TullochReservoirs. This map is provided as Figure 3 13, 2010 Stanislaus County – Dam Inundation Hazard. Asshown in Figure 3 13, large areas would be inundated if any of these dams were to fail, including a portionof Modesto, Ceres, and Newman. The 2010 Stanislaus County Multi Jurisdictional Hazard Mitigation Planalso includes a detailed risk analysis for each dam. While the damages that would be caused by a damfailure would be extremely large, the probability of such an occurrence is small.
3 .9 F lood Management
Improvement and
In tegra t ion Oppor tun i t i es Many opportunities for the improvement and integration of flood management within the planning areawith other regional and statewide goals have been identified through the regional flood planning process, asdescribed below. Detailed descriptions of each of those opportunities are provided in Chapter 7, ProposedRegional Improvements, of this plan. A brief introduction to several previously proposed flood risk reductionmulti benefit projects is provided in this section as well.
3.9.1 Flood Management Approach
Not all flooding creates hazards. Modern society is coming to recognize that flooding that occurs in areaswith flood compatible land uses can be at worst a nuisance, and at best a vital reinvigorating force for thecreation and maintenance of beneficial habitat, both in channel and on the floodplain. At the same time itcan support such benefits as water quality enhancement and groundwater recharge. Yet the humanpropensity for siting homes and development along waterways has given us a legacy of land use that putssignificant investments and lives at risk during flood events. With the adoption of the 2012 CVFPP and thereadiness of the state to invest significantly in reshaping the approach to flood management in the CentralValley, there is a tremendous opportunity to rethink and retool the flood management system we knowtoday. That reshaping of flood management approaches can be accomplished in a way that provides floodrisk reduction to life and property as well as a broader array of public goals, including economicstability and environmental stewardship.
DWR and the USACE recently developed a set of guiding principles (presented in the draft California’sFlood Future: Recommendations for Managing the State’s Flood Risk of April 2013) that reflect anintegrated approach to flood management:
Floods cannot be entirely prevented. Flood management seeks to reduce the risk and consequencesof flooding to improve public safety, enhance environmental stewardship, and support economicstability.

Mid San Joaquin River RFMP
3 50 3. Flooding and Flood Hazards
Multiple benefit flood management solutions designed from a systemwide perspective provide themost responsible use of public resources.
Flood management is a shared responsibility. Effective flood management is enhanced bycollaboration and partnerships among public agencies at all levels (local, State, Federal) and acrossgeographic boundaries.
Public agencies must achieve sustainable solutions while making risk informed decisions for floodmanagement that will be durable across a spectrum of variables, including climate change.
These principles are expected to underlie flood management investment in California in the future.
3.9.2 Previously-Identified Flood Risk Reduction Multi-
benefit Opportunities
As an initial step in the planning process, previously identified flood management opportunities for the MidSJR Region were reviewed. In this subsection, we review some of these flood system capacity expansionideas that appear to hold special potential for achieving multiple benefits together with flood risk reduction.
More so than in any other region of the Central Valley, leadership in the kind of innovative, multi benefitapproaches to flood management envisioned by the 2012 CVFPP has already been demonstratedwithin the planning area. The Three Amigos and Dos Rios Ranch projects, on adjacent properties at theconfluence of the San Joaquin River and the Tuolumne River, are partially developed concepts for integratedflood management, habitat enhancement, and other benefits that already provide flood risk reductionlocally. Both projects have the potential, with further action, to provide additional flood risk reduction,both locally and possibly to downstream communities such as Stockton and Lathrop. These twoprojects are briefly discussed below and presented in more detail in Chapter 7, Proposed RegionalImprovements.
As previously described in Section 3.2.4 Flood Control System Performance – 1997 Flood, thepurchase of the Three Amigos was intended to serve as a NSA for flood hazard reduction, in which landsbehind the levees would be allowed to inundate; land uses would change to be compatible with flooding;flood easements would be purchased; ring levees and floodwalls would be built to provide localprotection; and levees would no longer need to be maintained. While the components of the NSA werebeing developed, however, the levees were repaired. Since that time, the full implementation of the NSAhas stalled. Meanwhile, in 2002, restoration of 777 acres of riparian habitat began on the SJRNWR. Since2002, approximately 2,700 acres of habitat has been rehabilitated. Recently, the USACE has beenreinvigorating the effort to implement the NSA and DWR has funded an effort to investigate the potentialfor transitory floodplain storage in more detail. Additional information on the structural and nonstructuralcomponents of this project is provided in Chapter 7, Proposed Regional Improvements.
The USFWS has proposed the expansion of the SJRNWR in two sections to the north and south of theexisting property. A Draft Environmental Assessment of the proposed expansion was released inNovember 2012 (USFWS, 2012). The expansion would allocate up to an additional 22,156 acres to theSJRNWR, which could provide non structural flood management opportunities. The flood managementopportunities associated with the proposed expansion of the SJRNWR is described in Chapter 7, ProposedRegional Improvements, of this plan.

2010 Stanislaus County -- Dam Inundation Hazard
Modesto
Ceres
Turlock
Waterford
Hughson
Riverbank
Oakdale
Newman
Patterson
Map Legend:Lakes
Rivers
Streams
Roads
Dam Inundation AreasDam Name
Don Pedro
Exchequer
New Melones
San Luis
Pine Flat
W W W W W W W W W W W W W W W W W W W W
W W W W W W W W W W W W W W W W W W W W
W W W W W W W W W W W W W W W W W W W W
W W W W W W W W W W W W W W W W W W W W
W W W W W W W W W W W W W W W W W W W W
W W W W W W W W W W W W W W W W W W W W
W W W W W W W W W W W W W W W W W W W W
W W W W W W W W W W W W W W W W W W W W
W W W W W W W W W W W W W W W W W W W W
W W W W W W W W W W W W W W W W W W W W
W W W W W W W W W W W W W W W W W W W W
W W W W W W W W W W W W W W W W W W W W
W W W W W W W W W W W W W W W W W W W W
Tulloch
¬
0 10 20 30Miles
Riverbank
Oakdale
Waterford
Hughson
Turlock
Ceres
Modesto
Patterson
Newman
Map displays Stanislaus Countywith Dam Inundation Areas
of regional dams.
Prepared by:Stanislaus CountyPublic Works - GIS
November, 2009
178
Mid San Joaquin River Regional Flood Management Plan . 120802
Figure 3-132010 Stanislaus County – Dam Inundation Hazard
SOURCE: Stanislaus County, 2010

Mid San Joaquin River RFMP
3 52 3. Flooding and Flood Hazards
This page intentionally left blank

Mid San Joaquin River RFMP
3. Flooding and Flood Hazards 3 53
The Dos Rios Ranch property is in a prime location for floodplain rehabilitation and the provision oftransitory flood storage. A study to investigation its flood storage potential is underway. Other resourcemanagement projects that have and/or are expected to contribute to flood risk reduction within theplanning area include the La Grange Floodplain Restoration and Spawning Gravel Augmentation. This, alongprojects with proposed activities within Dos Rios Ranch, is discussed further in Chapter 7, ProposedRegional Improvements, of this plan.

Mid San Joaquin River RFMP
3 54 3. Flooding and Flood Hazards
This page intentionally left blank

4. Emergency Response 4-1
4. Emergency Response
4.1 In t roduct ion This Chapter of the RFMP describes the current status of flood emergency response in the Mid SJR Regionand provides an assessment of the relative state of flood response readiness of responsible agencies. ThisChapter also summarizes the response structure and agency roles and the nature of residual risk in thearea. Finally, key response issues are identified with recommended actions for improving the level offlood response readiness
Information in this Chapter is based on a field survey performed in May/June 2013 from which the FloodEmergency Response Assessment Technical Memorandum found in Appendix D was developed.Information generated by the field survey was provided to local stakeholders for review and subsequentmodification and enhancement as appropriate through RFMP workshops and meetings.
4 .2 Background Initial emergency response to disaster events in California is the responsibility of local governmententities (i.e., counties, cities, special districts) and, in some cases, locally based State agencies (e.g.,California Highway Patrol). These local entities provide emergency response within their jurisdiction whichis defined by geography and specific mandated response functions. Due to this jurisdiction, local entitiesand locally based State agencies retain command of all subsequent emergency response and recoveryactivities occurring within that jurisdiction. The National Incident Management System (NIMS) and theStandardized Emergency Management System (SEMS) require that agencies use the Incident CommandSystem (ICS) to manage their response. Where a disaster event extends across multiple differentjurisdictions, by geography or function, the Incident Command System recommends that a UnifiedCommand be established but does not require it.
Mid San Joaquin River RFMP
4-2 4. Emergency Response
Counties and many cities also maintain a specialized “emergency management” function within theirorganization. This emergency management function is responsible for coordinating the response of thedepartments of the jurisdiction, assisting those internal departments with disaster readiness activities,and providing executive management control of the overall response. The emergency managementorganizations performing this function generally prepare and maintain an emergency operations plan(EOP) which describes how the disaster management function will be conducted. Annexes to this EOPprovide plans/procedures of the jurisdiction’s departments where they exist.
Counties also administer the “operational area” organization, which is a special purpose organizationestablished by State law composed of all local public jurisdictions within the county. The purpose of thismulti agency organization is to manage response resources and information within the County politicalboundaries. This special purpose operational area organization provides a key communications andcoordination link between local agencies as well as between those agencies and the State.
Except for those locally based State agencies which have initial emergency response responsibilities andtherefore a local incident command role, State agencies provide resources and support to the responsiblelocal agencies at their request. These resources are acquired under protocols laid out in mutual aidsystems and the SEMS. The Governor’s Office of Emergency Services (Cal OES) is responsible for thecoordination of this State response in support of impacted local agencies, and for assisting State agenciesto maintain a readiness to provide such emergency support. However, Cal OES does not play a role in thedisaster command structure managing the response in the field. The FEMA, which coordinates theresponse of federal agencies at requests for resources or support from the State, also does not have a rolein the local command structure managing response activities.
Local agencies having this “incident command” authority are responsible for maintaining a readiness tomeet their responsibilities for a disaster occurring within their jurisdictional boundaries using theprotocols of the NIMS and SEMS. Such readiness may take the form of developing a pre planned NIMSresponse organization for response to specific disaster agents, preparing written plans or protocols,conducting training and exercise programs, and the acquisition of specialized equipment, supplies, andfacilities. Whether an existing plan or training program is adequate or otherwise of an acceptable natureis subjective. Statutes only provide readiness mandates of a general nature and federal and Stateguidance does not provide a methodology for determining whether any particular response activity canbe performed to a sufficient level by a jurisdiction. Therefore, any assessment of a local agency’s“readiness” is dependent to a large degree on a subjective evaluation based on one or more “readinessindicators” (e.g., existence of a written plan or conduct of an exercise) that can be reviewed and assessed.
4.3 F lood Response
4.3.1 Flood Response Roles
Flood Emergency Response Structure
There are two key separate components of flood response; levee flood fight operations and general publicsafety operations. These components must be evaluated separately because each is conducted by adifferent group of jurisdictions/agencies and each component has very different response issues andchallenges. Levee flood fight operations include emergency activities aimed at preventing failure of a leveeduring a flood or containing flood waters in the event of a levee does fail. Such activities include levee patrol,

Mid San Joaquin River RFMP
4. Emergency Response 4-3
basic remedial actions involving the placement of sandbags and plastic visquine, and the acquisition ofprivate vendors or bulk materials for more substantive remedial actions on a levee such as making a reliefcut. General public safety operations include response activities such as public warning, evacuation, rescue,fire suppression, and recovery that are normally conducted in the area protected by a levee by traditionallaw and fire agencies.
Reclamation districts (RDs), where they exist, have jurisdiction for performing levee flood fight operationsas a concomitant of their day to day levee maintenance responsibility, which is established in theOperation & Maintenance (O&M) Manuals, the Supplements, and Authorization and AssuranceAgreements with the State and the USACE. Among local jurisdictions in the Mid San Joaquin Riverplanning area, only the City of Modesto and some fire agencies are known to have participated in someway in levee flood fight operations. In regard to the other response component, public safety operations,fire agencies provide fire suppression and rescue and law agencies provide traffic control and securityfunctions. Public warning and evacuation activities may be shared by multiple agencies depending on ajurisdiction’s response plans. Overall, public safety operations within an area protected by a levee areperformed by the local county or city agency, special purpose district (e.g., fire district), or communitybased organization that has jurisdiction within that area.
The Mid SJR Region includes nine RDs where these two separate response components exist and must beconducted together in a coordinated manner. Table 4 1, Mid SJR Region Reclamation Districts, shows theapproximate size, status, land uses, and assets of each of these districts along with the local agenciesresponsible for performing the public safety operations component within the area protected by thatdistrict’s levee.
Table 4 1Mid SJR Region Reclamation Districts
RDsSize (acres)Levees
PrimaryLand Use Critical Public Assets Status of District
Public SafetyAgencies*
1602 3,500 acres6.29 miles
Agriculture Westside Properties RentalUnits
Active SheriffWSCFPD
2031 10,000 acres13.19 miles
Agriculture Highway 132PG&E PipelineHetch Hetchy Aquaduct
Inactive Sheriff’s Dept;SFPDWAFPDCHP
2063 10,000 acres10.63 miles
Agriculture Crows Landing Road Bridge Active SheriffMVFPD
2091 7,000 acres7.92 miles
Agriculture Modesto Waste WaterTreatment Plant; GomesLake Drainage System; WestMain Street bridge
Active SheriffMVFPDWPFPD
2092 2,000 acres3.76 miles
AgricultureHabitat
N/A Active SheriffWPFPD
2099 2.32 miles Habitat N/A Inactive; removed leveesfrom system
SheriffWSCFPD
2100 2.70 miles Habitat N/A Inactive; removed leveesfrom system
SheriffWSCFPD
2101 2,000 acres3.51 miles
Agriculture Highway 132 Active SheriffWSCFPD
2102 Habitat N/A Inactive; removed leveesfrom system
SheriffWSCFPD
Agency AbbreviationsCHP California Highway PatrolMVFPD Mountain View Fire Protection DistrictSFPD Salida Fire Protection DistrictSheriff Stanislaus County Sheriff’s Department
WAFPD Woodland Avenue Fire Protection DistrictWPFPD Westport Fire Protection DistrictWSCFPD West Stanislaus County Fire Protection District
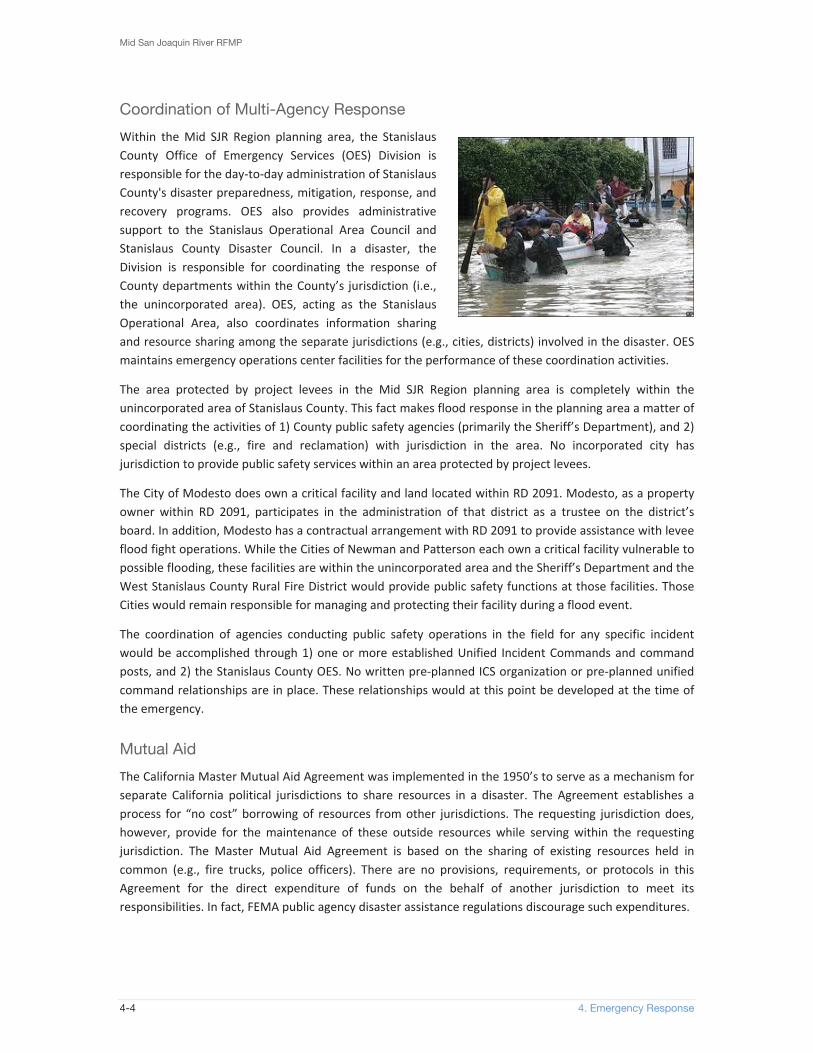
Mid San Joaquin River RFMP
4-4 4. Emergency Response
Coordination of Multi-Agency Response
Within the Mid SJR Region planning area, the StanislausCounty Office of Emergency Services (OES) Division isresponsible for the day to day administration of StanislausCounty's disaster preparedness, mitigation, response, andrecovery programs. OES also provides administrativesupport to the Stanislaus Operational Area Council andStanislaus County Disaster Council. In a disaster, theDivision is responsible for coordinating the response ofCounty departments within the County’s jurisdiction (i.e.,the unincorporated area). OES, acting as the StanislausOperational Area, also coordinates information sharingand resource sharing among the separate jurisdictions (e.g., cities, districts) involved in the disaster. OESmaintains emergency operations center facilities for the performance of these coordination activities.
The area protected by project levees in the Mid SJR Region planning area is completely within theunincorporated area of Stanislaus County. This fact makes flood response in the planning area a matter ofcoordinating the activities of 1) County public safety agencies (primarily the Sheriff’s Department), and 2)special districts (e.g., fire and reclamation) with jurisdiction in the area. No incorporated city hasjurisdiction to provide public safety services within an area protected by project levees.
The City of Modesto does own a critical facility and land located within RD 2091. Modesto, as a propertyowner within RD 2091, participates in the administration of that district as a trustee on the district’sboard. In addition, Modesto has a contractual arrangement with RD 2091 to provide assistance with leveeflood fight operations. While the Cities of Newman and Patterson each own a critical facility vulnerable topossible flooding, these facilities are within the unincorporated area and the Sheriff’s Department and theWest Stanislaus County Rural Fire District would provide public safety functions at those facilities. ThoseCities would remain responsible for managing and protecting their facility during a flood event.
The coordination of agencies conducting public safety operations in the field for any specific incidentwould be accomplished through 1) one or more established Unified Incident Commands and commandposts, and 2) the Stanislaus County OES. No written pre planned ICS organization or pre planned unifiedcommand relationships are in place. These relationships would at this point be developed at the time ofthe emergency.
Mutual Aid
The California Master Mutual Aid Agreement was implemented in the 1950’s to serve as a mechanism forseparate California political jurisdictions to share resources in a disaster. The Agreement establishes aprocess for “no cost” borrowing of resources from other jurisdictions. The requesting jurisdiction does,however, provide for the maintenance of these outside resources while serving within the requestingjurisdiction. The Master Mutual Aid Agreement is based on the sharing of existing resources held incommon (e.g., fire trucks, police officers). There are no provisions, requirements, or protocols in thisAgreement for the direct expenditure of funds on the behalf of another jurisdiction to meet itsresponsibilities. In fact, FEMA public agency disaster assistance regulations discourage such expenditures.

Mid San Joaquin River RFMP
4. Emergency Response 4-5
Stanislaus County and its jurisdictions (i.e., cities and special districts) share resources in a disaster underthe provisions of this Master Mutual Aid Agreement. No special or separate mutual aid agreement existswithin the Stanislaus Operational Area. Since the Master Mutual Aid Agreement does not mandate oraddress the direct provision of funds to help meet another jurisdiction’s responsibilities, StanislausOperational Area jurisdictions are not required to assist a RD to meet its function of preventing a leveefailure, or physically containing a flood, with direct expenditures. Stanislaus County, the City of Modesto,and fire agencies in the area indicate that they have no explicit policy regarding providing assistance toRDs, financial or otherwise.
U.S. Army Corps of Engineers and PL 84-99 Programs
USACE plays a unique role in flood response that must be clearly recognized in any planning effort toimprove local response capabilities. Most levees forming the SPFC were constructed through federal floodmanagement programs. USACE supervised the construction of such levees and upon completion of eachproject the responsibility for its maintenance was turned over to a local maintaining agency under writtenagreement. These agreements included an obligation to operate and maintain the project according toO&M manuals developed by USACE as well as provide assurances and other commitments. This federalobligation originating in the generally distant beginnings of the current levee system has played a centraland critical role in subsequent flood emergency response.
O&M Manual Flood Fight Components
USACE O&M Manuals issued at the time of project completion contain suggested methods of combatingflood conditions. The LMAs obligation to conform to their respective O&M manuals means that thisinformation must be referenced when current flood safety plans are developed. However, some of thisinformation is no longer current with modern response systems. Thus, while LMAs should ensure thatflood safety plans are consistent with their O&M Manuals, they should develop their plans with thecurrent operational area response system and protocols in mind. LMAs should note where flood responseprotocols must deviate from out of date suggestions in their O&M Manual. This information can then beforwarded to USACE as an addendum to the manual. This will ensure that flood fight operations areconducted in a manner consistent with current response systems as well as the O&M manuals. This actionshould occur concurrently with coordination with USACE for integration of federal resources into floodfight operational protocols. USACE involvement in flood fight under PL 84 99 authorities will continuedespite federal action to remove LMAs from PL 84 99 levee rehabilitation support and flood safety planswill need to address this involvement while maintaining O&M manuals as an active and critical part offlood response.
PL84-99 Levee Rehabilitation
A long standing role of USACE in flood emergency response was rehabilitation of damaged levees after aflood under PL 84 99 authority. Historically, there has been a strong dependence on the federal fundingunder this program to perform expensive re construction of levee breaches and other levee rehabilitationactions. With the exception of RD 2092 (Active status) and RD 2091 (Partial Inactive status), the remainingLMAs in the Mid SJR Region are not currently active under PL 84 99; if they remain inactive, these LMAswill not be eligible to receive repair funding after the next flood event. Ineligibility for such assistance haswide ranging consequences for the future of flood management in California and how levee maintenancewill be funded and structured in the future will need to be determined.

Mid San Joaquin River RFMP
4-6 4. Emergency Response
It is clear that the ability of the LMAs in the Mid SJR Region, with the possible exception of RD 2031, torepair levee breaches, or perform extensive repairs to levees damaged by impounded flood waters, isquestionable. RD 2031 is the exception due to the corporate nature of land ownership within that districtwhich allows landowners to bring considerable financial support to bear outside of the normal specialdistrict assessment process. However, RD 2031 is currently inactive with no board of trustees orfundraising abilities, and depending solely on the landowners for its financial capacity is not reliable.Other districts in the Mid San Joaquin River Region would have insufficient funds to undertake suchmassive construction projects and little ability through current special district assessment processes togenerate the needed funds. Experience has also shown that districts suffering a breach and subsequentflooding have found it nearly impossible to obtain loans from banks or other financial institutions togenerate cash flow for immediate action.
Absent this critical historic USACE assistance, the rehabilitation of the flood management system after aflood is unknown. If the LMAs cannot act promptly, then areas will remain flooded for longer periods andremain vulnerable to flooding from minor events for longer periods. This will further degrade the ability ofthe LMA to finance any rehabilitation of the system to its prior condition.
In this situation, the question becomes whether the next level of government, cities and county, withassets impacted by the flood waters would act to perform levee rehabilitation. It has been notedelsewhere in this chapter how the involvement of these entities in levee flood fight has been greatlyhindered by the jurisdictional barrier created by the formation of special districts for flood managementin the past. This jurisdictional barrier clearly also serves as a hindrance to action by those local entities tosystem rehabilitation. Motivation to act by a city or county would be entirely dependent on thatorganization’s perception of the level of importance of regaining use of any of its infrastructure impactedby the flood waters.
If city or county government fails to act, it would fall to the State, in particular to DWR, to act to repairbreaches and other levee damages. The lack of a standing emergency fund for such purposes at the Statelevel means that such action would require a political decision at the time of the event. There is no clearpre event policy addressing this issue in place at the State level as there is no clear pre event policy at thecity or county levels. There is no ready source of funds at the LMA, local or State level in place to replacethis historic federal assistance because there is no clear policy as to how this change in federal policy willbe addressed.
Some possible options available to address the loss of PL 84 99 funding includes joint discussions todefine a new structure for rehabilitating levee systems carried out by local and State agencies. This willinvolve either strengthening the LMA’s ability to perform this work or identifying new roles for other localand State agencies in system rehabilitation. Once a conceptual policy is in place then funding sources canbe identified. The SB27 Sacramento San Joaquin Delta Multi Hazard Coordination Task Force report issuedby the Governor in 2011 identified the need for a substantial emergency fund to be created to ensureadequate cash flow for expensive levee flood fight operations in an emergency. The role of such anemergency fund to provide cash flow for the rehabilitation of the system after a flood could be added tothe discussions concerning implementation of a new local/State structure for meeting this essential floodmanagement activity.

Mid San Joaquin River RFMP
4. Emergency Response 4-7
4.3.2 Emergency Response Readiness
Analysis of Residual Risk
Project levees were constructed in the Mid SJR Region toprevent damage from a flood of a specified magnitude. Sinceone or more of the levees may not perform this function inthe future due to a design, construction, or maintenanceflaw, there is a “residual risk” that flood waters at, or below,design criteria will degrade and fail the levee. In addition,because levees are designed to control floods of a specifiedmagnitude there is also a “residual risk” to the protectedarea that a flood exceeding the design criteria of the leveewill occur and either overtop or otherwise fail the levee.
This residual risk is addressed by developing the capacity to 1) effectively respond to the appearance of aflaw in a levee to prevent complete failure, 2) effectively respond to physically limit the extent, depth, orduration of floodwaters if a levee fails, 3) remove people and property from the area subject to flooding,and 4) provide additional physical protection to specific assets in place that cannot be removed. The levelof organizational, resource, and procedural capacity needed to perform these actions depends, in part, onthe potential response complexity of an area (for example, it is generally a more complex matter toevacuate an urban area than a rural area).
In regard to emergency response, the capacity needed to adequately address this residual risk would bepartially dependent on the relative difficulty of performing the protective actions listed above. In thisregard, the planning area project levees and surrounding area do not present any special problems for theconduct of flood fight operations. No special circumstances or conditions exist that would preventapplication of standard flood fight techniques where needed. In general, the complexity of performingevacuation to remove people and property from an area subject to flooding is less than for many areas ofthe Central Valley due to its rural nature. Even those urban areas subject to flooding in the vicinity of theSan Joaquin River are only exposed to shallow flooding reducing the complexity of conducting effectiveremoval operations. These sparse populations, limited numbers of critical infrastructure sites, or shallowflooding impacts lower the need for highly complex response plans (e.g., detailed evacuation routing). Asnoted in the Technical Memorandum in Appendix D, two exceptions to this are evacuation of dairies andpresence of hazardous materials, which justify relatively more complex response procedures and specialequipment to ensure proper warning and assistance is provided to affected residents.
Flood Fight Readiness
Determining whether an existing response capacity is adequate is highly subjective. For a short termstudy some simple indicators, as shown below in Table 4 2, Indicators in Flood Fight Readiness, must beused to merely provide an impression of the degree of attention that jurisdictions are applying topreparing to respond to a flood. In regard to flood fight capacity such simple indicators are the existenceof 1) written levee flood fight plans or flood specific plans for supporting agencies, 2) trained personnel toperform levee patrol and basic remedial actions (sandbagging, etc), 3) written and unambiguous floodfight command and control protocols, and 4) stockpiles of materials or budgeted funds for emergencyresponse. Simple indicators of the capacity of the Stanislaus Operational Area (all jurisdictions of theCounty) to rapidly and effectively support RD flood fight operations would be the existence of 1) flood

Mid San Joaquin River RFMP
4-8 4. Emergency Response
fight stockpiles maintained by entities other than RDs, 2) flood specific mutual aid procedures, 3) clearand unambiguous policy commitments for providing personnel and funds to RDs, and 4) regular jointexercises with RDs.
Table 4 2Indicators of Flood Fight Readiness
Agency
Flood Fight Plan orProcedures Specificto Helping w/Flood Fight
Clear Flood FightCommand Protocols
On Hand Resources:Materials, TrainedCrews, EmergencyFund (EF)
Clear Flood Fight MutualAid Policy for ProvidingMaterials, Personnel orFunds to RDs
Regular FloodFight Exercises:Internal,Multi Agency
RD 1602 No Patterson WestsideFarms providesleadership; No NIMStraining
Stockpile YesCrews – limited no. ofvolunteers onlyEF No
No No
RD 2031 No Landownerssupervise their ownoperations; NoDistrict command norNIMS training
Stockpile – YesCrews – Hired handsonlyEF No
No No
RD 2063 No District Presidentprovides leadership;No NIMS training
Stockpile – YesCrews – volunteersonlyEF Yes
No No
RD 2091 No Unclear command forProject Levee;Unclear command forGomes Lake Dike
Stockpiles NoCrews – Yes, City ofModesto providestrained crews undercontractEF Yes
No No
RD 2092 No Landowner providesleadership but relieson an advisor sharedwith RD2031; noNIMS training
Stockpiles – NoCrews – NoEF – No
No No
RD 2099/2100/2102
N/A N/A N/A N/A N/A
RD 2101 No District Presidentprovides leadership;No NIMS training
Stockpile – YesCrews – relies onfamily or emergencyhiresER – No
No No
County ofStanislaus
No N/A Stockpile – for GeneralPublic onlyCrews – NoEF – No
No No
City ofModesto
No Shares response withRD 2091 but unclearhow incidentcommand would beestablished
Stockpile – NoCrews – WWTP stafftrained annuallyEF – No
No No
City ofNewman
Some flood specificSOPs for responseat WWTP
PW providesleadership at WWTP;no NIMS training
Stockpile – NoCrews – NoEF – No
No No
City ofPatterson
No PW providesleadership at WWTP;no NIMS training
Stockpile – NoCrews – NoEF – No
No No
CHP No N/A Stockpile – NoCrews – NoEF – No
No No
MVFPD No No Stockpile – NoCrews – NoEF – No
No No

Mid San Joaquin River RFMP
4. Emergency Response 4-9
Table 4 2 (Continued)Indicators of Flood Fight Readiness
Agency
Flood Fight Plan orProcedures Specificto Helping w/Flood Fight
Clear Flood FightCommand Protocols
On Hand Resources:Materials, TrainedCrews, EmergencyFund (EF)
Clear Flood Fight MutualAid Policy for ProvidingMaterials, Personnel orFunds to RDs
Regular FloodFight Exercises:Internal,Multi Agency
SFPD No No Stockpile – NoCrews – NoEF – No
No No
Sheriff No No Stockpile – NoCrews – NoEF – No
No No
WAFPD No No Stockpile – NoCrews – NoEF – No
No No
WPFPD No No Stockpile – NoCrews – NoEF – No
Has responded to look atlevee at request of citizen;no training
No
WSCFPD No No Stockpile – NoCrews – NoEF – No
Has responded to look atlevee at request of citizen;no training
No
Agency AbbreviationsCHP California Highway PatrolMVFPD Mountain View Fire Protection DistrictSFPD Salida Fire Protection DistrictSheriff Stanislaus County Sheriff’s Department
WAFPD Woodland Avenue Fire Protection DistrictWPFPD Westport Fire Protection DistrictWSCFPD West Stanislaus County Fire Protection District
General Assessment of the Readiness to Conduct Flood Fight Operations
A review of the capacity indicators above indicates that the readiness of the Stanislaus Operational Areajurisdictions to conduct effective flood fight operations is below optimal. RDs have no written plans forconducting flood fight operations that would make key information and procedures readily available toresponders. While there is clear leadership within many districts for organizing and conducting flood fightoperations, none of the personnel who were identified as potential managers of such operations haveICS/NIMS training. Leadership would, therefore, be competent but would lack the ability to applyICS/NIMS concepts to agency coordination and mutual aid.
Stanislaus Operational Area agencies other than RDs do not maintain stockpiles of flood fight materials,do not have clear policies in regard to providing support to RDs, and do not maintained staff to assist withlevee patrol. The only exception is the City of Modesto which does provide flood fight assistance to RD2091 under contract. While there is no committed budget, the City and RD 2091 agree that in the event ofa declared emergency, or in the event that both parties agree, the City will take appropriate defensiveaction within its financial means to stabilize, protect and rebuild the levee to prevent losses to the Cityand RD 2091, while insuring public safety and well being in order to protect the City’s WWTP. WWTP staffwould perform the necessary duties. In regard to the provision of funds to prevent levee failure, the Cityof Modesto and Stanislaus County would only say that that policy issue would be decided at the time ofthe emergency.
Finally, RDs and those jurisdictions which would, or could conceivably, provide flood fight assistance donot conduct regular exercises to identify gaps in the development of an optimal response capability.These factors, the existence of a normal level of residual risk, and a review of best practices available inthe Central Valley would justify the evaluation that the Mid SJR Region planning area’s capacity to addressresidual risk through flood fight operations is well below optimal.

Mid San Joaquin River RFMP
4-10 4. Emergency Response
Public Safety Operations Readiness
In regard to public safety operations within the area protected by a project levee, some simple indicatorsof response capacity, as shown below in Table 4 3, Level of Public Safety Operations Readiness, would bethe existence of 1) general response plans, 2) flood specific response plans and/or training programs,3) general Incident Command System/National Incident Management System (NIMS) training programs,and 4) written protocols for establishing multi agency command and control in the floodplain. Indicatorsof the capacity of the Stanislaus Operational Area to rapidly and effectively apply resources to assist withthe removal of people and property from threatened areas would be existence of 1) resources/equipmentfor conducting warning, evacuation, and rescue operations and 2) clear law, fire, and EMS mutual aidprocedures.
Table 4 3Level of Public Safety Operations Readiness
Agency
Written EmergencyResponse Plan(General and/orFlood Specific)
Training andFrequency (ICS/NIMS;Flood ResponseSpecific)
Command andControl Protocolsfor FloodOperations
Resources/EquipmentAvailable/Suitable forFloodplain Warning,Evacuation, Rescue, etc.
WrittenMutual AidProcedures forLaw, Fire, EMS
StanislausCounty
Standard EOP onlyNo Flood SpecificPlans
ICS/NIMS YesFF specific – No
No Yes Yes
City ofModesto
Standard EOP onlyNo Flood SpecificPlans
ICS/NIMS – Yes, withinFire/LawFF specific – Yes,WWTP staff receive FFtraining and NIMStraining
No Yes Yes
City ofNewman
Standard EOP onlySome Flood SOPs fortheir WWTP
ICS/NIMS – Fire andLawFF Specific – No
No Yes Yes
City ofPatterson
Standard EOP onlyNo Flood SpecificPlans
ICS/NIMS – Fire andLawFF Specific – No
No Yes Yes
City of Turlock Standard EOP onlyNo Flood SpecificPlans
ICS/NIMS – Fire andLawFF Specific – No
No Yes Yes
MVFPD None ICS/NIMS – YesFlood Specific – No
No Yes Yes
SFPD None ICS/NIMS – YesFlood Specific No
No Yes Yes
WAFPD None ICS/NIMS – YesFlood specific – No
No Yes Yes
WPFPD None ICS/NIMS – YesFlood specific – No
No Yes Yes
WSCFPD None ICS/NIMS – YesFlood specific – No
No Yes Yes
Agency AbbreviationsCHP California Highway PatrolMVFPD Mountain View Fire Protection DistrictSFPD Salida Fire Protection DistrictSheriff Stanislaus County Sheriff’s Department
WAFPD Woodland Avenue Fire Protection DistrictWPFPD Westport Fire Protection DistrictWSCFPD West Stanislaus County Fire Protection District

Mid San Joaquin River RFMP
4. Emergency Response 4-11
General Assessment of Readiness to Conduct Public Safety Operations
A review of the capacity indicators above indicate that the readiness of the Stanislaus Operational Areajurisdictions to conduct effective public safety operations in the floodplain are adequate but belowoptimal based on a review of best practices in the Central Valley. Jurisdictions maintain normal generalemergency operations plans and conduct general ICS/NIMS training. There are the normal established fireand law mutual aid systems and specialized equipment for command and control is available. However,specific plans for response in the floodplain do not exist and no flood response specific training isprovided to responders. The exception would be City of Modesto WWTP staff who receives flood fighttraining. However, this is for flood fight operations and not necessarily evacuation or rescue operations.
Written plans for conducting more complex elements of public safety operations in a floodplain (e.g.,evacuation of dairies and hazardous materials) were not identified. Specific, written, protocols forestablishing command and control in the floodplain during flood events were also not identified. Finallyfacility specific written plans for removing or protecting in place critical infrastructure components werenot identified.
The existence of normal emergency plans, ICS/NIMS training, and specialized equipment indicate anormal competency to conduct public safety operations in the floodplain if needed. This competency,coupled with the less complex nature of the evacuation/rescue/security problem in the floodplain, wouldindicate normal and adequate response capacity. However, the lack of flood specific plans and training, aswell as the lack of written plans for more complex rural evacuation issues, would indicate that the Mid SJRRegion planning area’s flood response capacity for public safety operations is less optimal than it couldbe.
Gaps and Overlaps
Written emergency plans that do exist in the Mid SJR Region are general in nature and prepared by eachjurisdiction to describe how they will conduct their own operations within their own jurisdictionalboundaries. Although an Operational Area Council was identified, there are no procedures specific to theoperation of the Stanislaus multi agency Operational Area organization. The lack of flood responsespecific procedures or plans precludes the existence of overlaps. The lack of specific written command orresponse protocols specifically for response in the area protected by project levees makes it impossible toevaluate whether any other assumptions exist within jurisdictions about command or coordination thatwould conflict with each other.
The readiness analysis performed above indicate that four key general gaps exist in the Mid SJR Regionplanning area’s capacity to address all flood response issues in an optimal manner.
Lack of written levee flood fight plans or floodplain specific procedures within each jurisdiction’semergency operations plans. This is a key planning deficiency for RD 2091/RD 2063 where thereare numerous critical assets.
Ambiguity in identifying who is in command of flood fight operations. In those cases wherecommand is identified, there is a lack of ICS/NIMS training.
Lack of clear and unambiguous policies by operational area jurisdictions in regard to providingmutual aid of personnel, resources/materials, and funds to support levee flood fight operations.
Lack of joint exercises to identify response gaps and improvement opportunities.
Specific response issues relating to these four general gap categories are discussed below.

Mid San Joaquin River RFMP
4-12 4. Emergency Response
4.3.3 Funding and Commitment
There are two RDs that were identified as having a standing emergency fund to support flood fight efforts.Other districts indicated that assistance, funds or in kind help, would be solicited from property owners inthe district at the time of the emergency. The limited financial situation of RDs makes their ability torespond to flood emergencies difficult.
No other jurisdictions in the Stanislaus Operational Area maintain a designated and budgeted emergencyfund for responding to emergencies. Jurisdictions would clearly be dependent on their internal generalfund reserves or contingency fund to meet extraordinary costs of meeting their direct emergencyresponse mandates. Whether a jurisdiction’s general fund could deal with the extraordinary costs ofresponding to a disaster would be dependent on the size of the disaster and magnitude of its impact.
Use of a jurisdiction’s internal general fund to assist the RDs with levee flood fight operations is notrequired by existing mutual aid agreements or any statute. Such expenditure of jurisdictional tax dollars inanother jurisdiction has legal barriers and issues with FEMA disaster assistance regulations that wouldbest be addressed with a written flood specific mutual aid protocol. Such a protocol does not exist in theMid SJR Region.
Examination of the general funds of Stanislaus Operational Area jurisdictions would not be productivewith absence of a clear commitment or protocol for providing direct expenditure on behalf of anotherjurisdiction. No jurisdiction in the Stanislaus Operational Area has made a clear commitment to assist withfunding the levee flood fight responsibilities of the RDs.
Two rural fire districts do have a history of responding to look at a levee status at the request of residents.They did not interact with the RD and did not provide on going patrol or other assistance. The City ofModesto has a contractual arrangement with RD 2091 to provide levee patrol and basic flood fightresponse to levee problems. While there is no committed budget, the City and RD 2091 agree that in andevent of a declared emergency, or in the event that both parties agree, the City will take appropriatedefensive action within its financial means to stabilize, protect and rebuild the levee to prevent losses tothe City and RD 2091, while insuring public safety and well being in order to protect the City’sWastewater Treatment Plant. This contractual arrangement is unclear as to the specific limitations of suchassistance and does not have clear provisions for providing emergency financial assistance. The City ofModesto representative indicated that the City would have to evaluate whether it would provide suchassistance at the time. Without a clear commitment to provide financial assistance, and without adesignated budgeted emergency fund, it is difficult to evaluate the capacity of the jurisdictions to assistwith flood fight operations.
4.4 Response I ssues The following issues associated with emergency response planning for the Mid SJR Region have beenidentified:
Interaction with RDs. Stanislaus OES indicated that they often lack good contacts with the RDs. Therehas been some friction in the interaction of the County with the districts in regard to proclaimingemergencies and the process for requesting assistance with flood fight operations. This appeared tobe mainly an issue of clarification of the process of coordination between these separate jurisdictionsfor flood fight assistance and activation of emergency authorities and powers.

Mid San Joaquin River RFMP
4. Emergency Response 4-13
LMA Responsibilities. While it is clear that a levee maintaining agency is responsible formaintaining its levee and repairing any damage that may be caused by a flood, it is less clearwhether an LMA is directly responsible for 1) removing impounded flood waters resulting from abreach, and 2) taking action to limit damage if flood waters originating within their jurisdictionleaves their jurisdiction. General experience is that LMAs assist with removing impounded floodwaters to some extent within their financial resources but do not cross jurisdictional boundaries toflood fight flood waters leaving their jurisdiction.
Evacuation Planning. Written evacuation plans for areas protected by project levees were notidentified and no written plans for assisting property owners with the evacuation of dairies andremoval of hazardous materials stored at farm operations were identified. The County did notidentify a specific role for its departments in the conduct of dairy evacuation or hazardousmaterials removal. The rural nature of the Mid SJR Region simplifies the problems of warning,evacuation, and rescue for people but it elevates the importance of other evacuation and recoveryissues unique to agricultural areas such as evacuation of dairies, removal of hazardous materialsprior to the arrival of flood waters, and debris removal after the departure of flood waters.
Flood Fight Materials and Mutual Aid. No jurisdiction outside of RDs was identified that maintainsstockpiles of materials specifically for supporting levee flood fight operations. There is no specificprocess for RDs to request mutual aid.
Flood Fight Operations Training. No jurisdiction was identified that conducts regular flood specifictraining or provide DWR flood fight classes to its employees.
Debris Removal. County Public Works recognizes a function with debris removal from Countyroads. FEMA will allow the County to assist with removal of debris from private property that didnot originate from the property owner’s possessions or land. The County would need to accept thatrole and develop a written debris removal plan with criteria for ensuring that debris removed bythe County meets eligibility rules. The County does not have such a plan at this time.
Hazardous Materials. No written plan for organizing the removal of hazardous waste from aflooded area was identified.
Cost Recovery. None of the emergency responders have cost recovery documentation policies inplace.
Life Safety. The Crows Landing Road and the Las Palmas Avenue bridges are needed in the event ofan emergency because they carry most local traffic across the San Joaquin River. The loss of eitherbridge would require a one hour detour to reach the other side of the River. Since all hospitalfacilities are on the east side of the San Joaquin River the ability to use these bridges becomescritical to the safety of residents on the west side of the County. Loss of Highway 132 wouldexacerbate this problem and resultant delays in moving sick or injured people to appropriate care.
4.5 Oppor tun i t i es Despite the issues identified for emergency response planning in the Mid SJR Region, there are manyopportunities for the region to improve emergency response, as discussed below.
4.5.1 Standard Local Flood Response Plan Templates
The issuance of two grants by DWR for local flood emergency response projects has stimulated discussionon the need for local tactical flood response plans and the proper format for such plans. DWR grantguidance indicates that completion of such plans is a prerequisite to obtaining funds for other response

Mid San Joaquin River RFMP
4-14 4. Emergency Response
items such as supplies or communications. The recent addition of Water Code Section 9650 (AB156)which requires the preparation of “flood safety plans” also has highlighted the need for a standard andacceptable template for such local tactical flood response plans.
Such plans would have a levee flood fight component and a public safety warning/evacuation/rescuecomponent. San Joaquin County has over the past decade developed a local tactical flood response plan(called a flood safety plan within Section 9650) template using a mapping format and addressing bothcomponents. The maps and procedures developed under this concept display flood emergency responseinformation, plans, and protocols in a user friendly format. FEMA subsequently provided funds for thedevelopment of guides for implementing a similar program. In 2012, San Joaquin County adapted thisconcept to fully conform to the requirements of Water Code Section 9650.
During the summer of 2013, local tactical flood response plans (or flood safety plans) in line with thislatest standard were completed for two San Joaquin County RDs and submitted to DWR and the CVFPBfor review. Subsequently, DWR indicated that this format met Section 9650 requirements and that theDepartment considered this format the preferred methodology for completing local tactical floodresponse plans required by their grant guidance.
This situation provides an opportunity for the Mid San Joaquin River Planning Area to more rapidlycomplete local tactical flood planning project since clear, detailed, and tested methodology is nowapproved by the State
4.5.2 Funding Opportunities
Propositions 1E and 84 passed by the voters in 2006 provided, among other things, for $135 million infunding for enhancing flood emergency response in the State. In 2013, DWR issued the first grants tolocals from these funds for local flood emergency response projects. A “statewide” grant with totalfunding of $5 million was issued in March 2013, and a “Delta specific” grant with total funding of $5million was issued in August 2013. Stanislaus County jurisdictions were eligible for applying for thestatewide grant but did not submit an application. However, DWR has indicated that it is identifying fundsfor a second round of these grants that could occur in 2014. Funds for a second round of the Deltaspecific grant have already been identified which provides some assurance that a second round of thestatewide grant will also be forthcoming.
This situation provides a possible opportunity for the Mid San Joaquin River Region to apply for grantfunding to begin to implement emergency response and preparedness projects identified and in theregional flood management plan process. This potential funding opportunity should be integrated into thefinal plan and the funding needs for specific projects identified within the RFMP so that jurisdictions areprepared to submit a joint, well planned, application. It should be noted that several RDs lack theinstitutional capacity to secure grant funding at this time.
4.5.3 Joint Planning and Plan Maintenance Mechanisms
The Mid SJR Region RFMP process provides an opportunity for local jurisdictions to develop mechanismsand procedures for future joint flood emergency response planning and maintenance activities.Procedures and protocols used to jointly develop the regional plan should be adjusted for use after thecompletion of this project to perform joint planning or to jointly seek funding.

Mid San Joaquin River RFMP
4. Emergency Response 4-15
4.5.4 Conversion to Flood-Compatible Uses
The Mid SJR Region RFMP process provides an opportunity for local jurisdictions to consider convertingexisting uses to flood compatible ones within floodplains. Flood compatible uses can include areas usedfor certain habitat or agriculture. With fewer people and less at risk property in these flood prone areas,there would be a reduced need for emergency response. Projects such as Three Amigos that wouldrestore habitat and convert existing uses to flood detention are good examples of projects of this type.
4 .6 Genera l F ind ings This section describes the findings for public safety operations, flood fight operations, and overallemergency response preparedness.
4.6.1 Public Safety Operations
While they are obviously important, public safety operationswithin the planning area do not face highly complex orextensive issues such as those found in heavily urbanized areasin deep flood zones. The shallow nature of potential flooding inthe more urban areas of Patterson and Newman causeconsiderable damage but again are not a highly complexorganizational response challenge. Development of extensivepre plans for conducting resident warning, evacuation, orrescue would, in general, not be a priority for the planning areaif resources are limited. There are currently no writtenresponse plans specific to the planning area.
However, there are two issues regarding public safetyoperations that should be examined more closely for possibleaction. First, the structure of field command and control inregard to flood fight operations and public safety operations, aswell as the manner of their interaction, was unclear in some districts and not clearly documented in any.Second, the area does present the potential problem of evacuation of dairies and bulk hazardousmaterials from rural sites and debris removal following a flood. These more complex organizational issuesshould be examined more closely for potential action.
4.6.2 Flood Fight Operations
The presence of considerable private property, vital bridges and roads, and substantial infrastructurecritical to public safety and health focuses attention on the quality of flood fight operations in theplanning area. Effective and rapid action to prevent a levee breach, or to limit the extent, depth, orduration of flood waters in the event of a breach, is the only method for minimizing possible long termadverse impacts from loss of this infrastructure. Flood fight operations in this case would include plans forrapid removal of equipment or components of facilities where possible to speed restoration of services.
Currently there are very knowledgeable and experienced people available to direct flood fight operationsbut little or no written flood fight plans reflecting this knowledge are in place. Flood fight operations are

Mid San Joaquin River RFMP
4-16 4. Emergency Response
organized at the time of the emergency and are mostly conducted informally. The command structure forconducting flood fight operations in some cases is unclear, or at least not documented.
Also, the financial situation of the RDs is relatively weak and could be a barrier to improvement actionsand response. Grants or other sources of alternate funding should be explored to enhance RD responsecapabilities although several RDs lack the institutional capacity to secure grant funding at this time.Finally, processes for RDs to request mutual aid should be clearly defined and jurisdictions within theplanning area need to at least discuss and better define their policies for supporting flood fight operationsif requested. Improved coordination of RDs with the Stanislaus Operational Area organization to improvewarning and information flow would also be helpful.
4.6.3 Overall Flood Emergency Response Preparedness
The Mid SJR Region planning area is at a point where initial detailed planning for future flood fightoperations and concurrent public safety operations is needed and justified. Opportunities foraccomplishing this planning in the near future are discussed below. However, a major problem in areasthat have completed such detailed planning and training in the past is maintenance.
The long intervals between floods, and the other demands placed on the time of officials, makesmaintenance of plans and training over the long intervals between major floods difficult. The consistentcommunication and cooperation that is a key element of joint planning tends to stop when initialresources run out and other demands on time become a constant distraction. Any major project toimprove flood response in the Mid SJR Region should include a mechanism for ensuring propermaintenance of resulting improved plans and training programs created as a result of projectimplementation.
4.7 Spec i f i c Recommended
Pro jec ts Based on the findings made above, the following eight specific projects are recommended to improveflood emergency response planning in the Mid SJR Region and are described in more detail inSections 4.7.1 through 4.7.8:
Develop local levee flood flight plans or a joint coordinated flood fighting plan for related RDs;
Perform key hydrological studies;
Complete response plans for public safety agency functions;
Clarify command and control;
Provide emergency planning support for RDs;
Better define mutual aid for flood fight operations;
Develop a flood response training program; and
Form a Stanislaus Operational Area Flood Response Working Group within the StanislausOperational Area organization.

Mid San Joaquin River RFMP
4. Emergency Response 4-17
It should be noted that three of the projects evaluated in this RFMP came from these recommendations:Emergency Response Plan – Debris Management, Emergency Response Plan – Local Planning andTraining, and Hydraulic and Channel Migration Studies (see Chapter 7, Proposed Regional Improvements).
4.7.1 Local Levee Flood Fight Plans
In regard to flood fight operations, RDs and supporting agencies should develop local levee flood fightplans as part of an overall tactical flood safety plan as outlined by DWR. These flood fight plans woulddocument 1) historic information and flood fight knowledge of current and past district responders; 2)current response procedures for levee flood fight; and 3) options for containing floods from a breach.RDs, as the local jurisdiction responsible, would prepare the plans with the assistance of other localjurisdictions. Flood fight plans should include provisions for flood fighting non SPFC levees orembankments in the area that could provide protection but are not under the direct maintenanceresponsibility of a LMA or other agency.
The development of flood fight plans should also include identification of physical constraints to efficientresponse to levee problems. Areas where levee crowns or landside levee toe areas are inadequate tosupport potential needed response actions should be identified. Areas whose improvement wouldsupport more efficient flood fight response should also be identified. These structural improvementsrelated specifically to flood response can then become a part of the LMA levee improvement plan.
A standard template for development of such levee flood fight plans (part of flood safety plans mandatedby AB156 and also called tactical flood plans in DWR grant guidance) is emerging in the Central Valley thatis supported by DWR and FEMA. This template uses a map format to display information complementedwith a concise written RD emergency operations plan
4.7.2 Hydrological Studies
A key preliminary action to preparing the local flood fight plans in the Mid San Joaquin River region iscompletion of detailed topographic and hydrological studies for the area protected by RD 2091 and RD2063. The characteristics of flood flows that would occur in the event of a breach in either district need tobe identified. The RD 2091/RD 2063 area contains considerable critical infrastructure and is the mosthighly populated area protected directly by project levees. There is the potential that RD 2091 isdependent on the RD 2063 levees for protection as well as on its own levee system. A breach in RD 2091could also possibly cause flood waters to back into RD 2063 to some extent. In order to ensure the bestpossible protection of critical infrastructure in RD 2091 (e.g., the Modesto wastewater treatment plantand Gomes Lake), studies to determine the degree of dependence of RD 2091 on the RD 2063 levees needto be completed. The characteristics of flood flows from RD 2063 into RD 2091, and vice versa, also needsto be thoroughly understood in order to identify practical containment options and an effective jointflood fight plan between districts. This study would include obtaining the current topography andelevations of the area from new sources as needed to supplement existing datasets.
Other hydrological studies needed would better define flood threats to the wastewater treatment plantsof Newman and Patterson. These studies would confirm water elevations at which there is a significantthreat to those facilities and the characteristics of flood water movement in the event 1) water elevationsrise above the eastern boundary fence line at the Patterson plant, or 2) either the Newman WastewaterTreatment Plant flood management levee or Newman Wasteway embankment fails. This detailed

Mid San Joaquin River RFMP
4-18 4. Emergency Response
information would allow development of better trigger levels for actions to protect infrastructure andbetter plans for maintaining service if either of these events were to occur.
Completion of a channel meander analysis is also necessary for other areas of the Mid SJR Region tobetter identify future repair needs at specific locations.
Current and planned hydrological studies conducted by DWR under the CVFPP and other programs shouldbe accessed initially for information relevant to the above issues. Any current relevant informationgenerated by those state studies can be used as a starting point for additional needed work.
4.7.3 Response Plans for Public Safety Agency Functions
It is recommended that public safety agency evacuation plans be developed at a minimum for the areaprotected by RD 1602, RD 2063, and RD 2091. Evacuation procedures could be included on the respectiveflood safety plan, and should address rural evacuation of dairies and removal of bulk hazardous materials.All plans would provide clear command and control protocols and an emergency response commandorganization for conducting these operations. These plans and maps would be developed in cooperationwith local law and fire agencies and the RDs.
Finally, Stanislaus County should develop a debris removal plan and policy. Preparation of such a writtenplan would assist with ensuring reimbursement for debris removal costs incurred by the County after aflood from the State and federal disaster assistance programs. Stanislaus County operates the local wastedisposal system and has both jurisdiction and resources for operating a debris removal program. Ensuringeligibility for disaster financial assistance will allow the County to perform authorized debris removalwithout delay or uncertainty.
4.7.4 Command and Control
It is a high priority that local jurisdictions should clarify and document the command structure for areasthreatened by flood waters. Command of levee flood fight operations and command of public safetyoperations should be clarified and defined in terms of ICS procedures. It is also important to clarify howseparate flood fight commands and public safety agency commands will interact. These protocols couldbe included in the local tactical flood response plan (flood safety plan). In addition, RDs should adopt aformal mechanism for clearly designating a flood fight incident commander as part of their flood safetyplans.
The ICS provides procedures and protocols for establishing a “unified command” among agencies andjurisdictions with responsibility for managing or responding to a flood event in the same geographicalarea. Pre event discussion of a potential unified command structure for flood fight operations isparticularly important. Identification of areas of the flood management system that are mutuallydependent upon each other for protection will help determine which LMAs must work closely together ina common command. The role in such a unified command for State departmental Incident CommandTeams that may arrive to assist should be worked out. Whether State agencies are merely providingadvice, assuming a financial or jurisdictional responsibility for flood fight operations, or performing someother role will determine whether such outside resources will be part of the command or only a part ofthe operations or other function within the response. Review of the number of unified commands neededfor maximum efficiency can also determine whether a pre planned response by CalFIRE IncidentCommand Teams for helping with incident management is called for.

Mid San Joaquin River RFMP
4. Emergency Response 4-19
4.7.5 Emergency Planning Support for RD’s
The limited financial resources and staffing of RDs makes development and maintenance of detailed andadequate levee flood fight plans difficult. There is also a lack of expertise within RDs for preparation ofproper written emergency plans. The County of Stanislaus and City of Modesto should enter into anagreement with the RDs to provide administrative and professional support for the development andmaintenance of district plans. A cost sharing arrangement could be developed within this agreement.Another option would be to have the RDs form a collective that works to develop flood specificemergency response plans for the levees. The collective could interact directly with the cities andStanislaus County.
4.7.6 Mutual Aid for Flood Fight Operations
Jurisdictions making up the Stanislaus Operational Area should develop an agreement or procedureoutlining the specific process and characteristics for providing levee flood fight support and mutual aid toRDs. Potential support would include assistance with levee patrol, flood fight crews, and funds for theacquisition of private contractors and bulk materials. In particular, the provision of funds, or purchasingsupport, for acquisition of material from private vendors or bulk materials should be clearly defined. Totaldependence on the State or federal governments for emergency funding of response to threats to leveeintegrity could lead to delays that result in levee failure. Local jurisdictions should identify circumstancesin which they will intervene to support RD and non RD entities response financially to protect theirinterests and the general public.
4.7.7 Flood Response Training Program
State and federal governments require that public agencies institutionalize the NIMS for management ofdisaster incidents. DWR has also issued standardized protocols for marking levee problems during leveepatrols. A realistic training policy and program for RDs should be developed as part of the planningprocess to provide familiarization with NIMS procedures and flood fight protocols.
A comprehensive training program should include periodic and sustained joint exercises among agenciesinvolved in flood fight and public safety operations to ensure a well coordinated response, effectivecommand and control, and familiarity among agencies that do not work together on a routine basis.
4.7.8 Operational Area Flood Response Working Group
The Stanislaus Operational Area should form a flood response working group within that organizationcomposed of the RDs and public safety agencies with jurisdiction within the flood plain. This workinggroup should be created through a written agreement or protocol that defines meeting frequency,objectives, and specific review items. This group could then ensure that flood response productsdeveloped in past preparedness projects are maintained. This process would also ensure that there isongoing communication between jurisdictions and that new officials are properly briefed on currentpreparedness plans and their status.

Mid San Joaquin River RFMP
4-20 4. Emergency Response
This page intentionally left blank

5. Operations & Maintenance 5-1
5. Operations & Maintenance
5 .1 In t roduct ion The objective of this Operations and Maintenance (O&M) chapter of the RFMP is to provide an assessment ofthe Operation and Maintenance practices in the Mid San Joaquin River Region. This chapter includesbackground information on O&M, general findings, and recommendations for improving O&M in the region.
The content of this chapter is based on reviewing available information such as the Local MaintainingAgency Annual Reports for Levees of the State Plan of Flood Control and Inspection and Local MaintainingAgency Report to the Central Valley State Federal Flood Protection System, as well as discussions with RDstaff responsible for flood management system O&M. The Operations and Maintenance AssessmentTechnical Memorandum found in Appendix E was also developed from this information, and goes intomore specific details of each RD. Information generated throughout the process was provided to localstakeholders for review and subsequent modification and enhancement as appropriate through RFMPworkshops and meetings.
5 .2 Background Flood management facilities are subjected to natural forces that can reduce their effectiveness over time.O&M helps maintain the original design and reliability of flood management systems and involvesactivities including: routine inspections of flood management facilities, erosion control, vegetationremoval, debris and sediment removal, and control of burrowing animals. Coupled with long term floodrisk reduction projects, O&M strengthens the structural integrity of the levee systems in the Region. O&Mactivities are typically performed by the Levee Maintaining Agency (LMA) responsible for specifiedsegments of levee systems.
A common issue in the Mid SJR Region is that wave action and high water events cause erosion on thewaterside of levees, thereby altering the levee geometry and reducing a levee’s overall effectiveness.

Mid San Joaquin River RFMP
5-2 5. Operations & Maintenance
LMAs work to mitigate these issues by placing rock on the waterside of the levee to reduce the erosiveforces. To a lesser extent, slope grading/dragging can be done to repair minor depressions in the leveeslopes.
Burrowing animals also threaten the structural integrity of levees in the Region. Burrowing rodents cancreate extensive networks of tunnels throughout levee systems, creating a path for water to get from thewaterside to the landside of the levee. LMAs have employed measures such as grouting, baiting, andhunting to remove burrowing animals from their levees.
Additionally, thick vegetation on levees reduces the ability to visually inspect a levee. Therefore, LMAstrim/remove trees/shrubs and mow grass to meet guidelines established by USACE and DWR. It is notedthat vegetation requirements differ between USACE and DWR. It should also be noted that USACE hasrecently moved to an interim vegetation policy while they review their current policies.
Levee O&M are paramount to keeping leveed systems in working order, so that they are reliable andprovide an adequate level of protection. To ensure levees are being maintained correctly by the LMA’sthey are inspected by both the USACE and DWR.
5 .3 Genera l F ind ings This section describes the O&M findings that apply to the whole region.
Most of the RDs in the Mid San Joaquin Region are rural districts which encompass agricultural land.Accordingly, there are limited or no assessments, which means that individual land owners fund andperform necessary levee maintenance. Typical maintenance activities for the RD’s in the region include:vegetation management, rodent control, erosion control/repairs, crown maintenance, and slope dragging.
Vegetation and animal control were common issues that were noted in many of the DWR Levee InspectionSummaries for the RDs in the Region, which were also noted in discussions held with each RD. Discussionswith RD staff and representatives indicated environmental permitting challenges and Endangered SpeciesAct (ESA) constraints associated with O&M activities often puts districts in the middle of conflictingregulatory requirements. In these instances, RDs have to make the decision of whether to perform therequired O&M and potentially be fined for violating ESA regulations, or perform limited O&M that complieswith ESA requirements at the risk of failing regular inspections. Since RDs have limited financial resources asit is, the decision is often made to comply with ESA regulations and hope the limited O&M are sufficient.
However, failure to perform regular maintenance not only threatens financial support in the event of adisaster from the Public Law (PL) 84 99 program, but reduces the effectiveness of existing floodmanagement facilities to perform during a flood event, thereby threatening the people and propertybehind these levees. Currently, RD 2092 is the only district in the Mid San Joaquin Region that is eligiblefor PL 84 99 disaster assistance. It should be noted that this district is in the process of seeking toeliminate O&M responsibilities and will permit flowage on previously protected lands within the District.
In addition to permitting challenges, many RDs cited differing vegetation criteria as outlined by DWR andUSACE as a source of confusion and frustration. These differing criteria can often result in RDs receivingacceptable ratings on DWRs levee inspections, but unacceptable ratings on USACE (PL 84 99) inspections.This is problematic since two or more consecutive unacceptable ratings from USACE can jeopardize an LMA’seligibility in the PL 84 99 program, which provides levee rehabilitation assistance in the event of a disaster.

Mid San Joaquin River RFMP
5. Operations & Maintenance 5-3
Furthermore, many LMAs noted they were comfortable funding minimal O&M responsibilities, but thislevel of O&M has been insufficient to meet State and Federal requirements. Given their limited financialresources, these Districts are not able to generate the capital needed to implement large scale leveerepairs. Table 5 1, LMA Expenditures and Funding Sources, below, summarizes the approximate annualO&M expenditures, and sources of funding for the LMAs in the Region.
Table 5-1LMA Expenditures and Funding Sources
LMAApprox. Levee Miles
MaintainedApprox. Annual O&M
Expenditures O&M Funding Sources
RD 1602 6.29 $10,000 $12,000 Individual Property Owners
RD 2031 13.19 $30,000 Individual Property Owners
RD 2063 10.63 $83,000 Assessments
RD 2091 7.89* $40,000 $50,000 Assessments
RD 2092 3.76 $10,000 $12,000 Individual Property Owners
RD 2101 3.51 $25,000 Individual Property Owner
Gomes Lake 0.3 $14,000 $35,000Joint Powers Agreement, or JPA (TID, Stanislaus
County, City of Turlock, RD 2091, RD 2063)
*0.3 miles are maintained by TID under the Gomes Lake JPA
Based on this information, funding of routine O&M appears sustainable. However, the annualexpenditures cited above do not consider funding needs for large scale repairs or addressing existingencroachments. DWR grant programs can help LMAs with these expenses, but financial resources of theLMAs are limited, making it difficult to meet the local cost share requirements. Furthermore, LMA stafflimitations, combined with the fact that district staff typically work and/or manage farms full time, meanthere is little time left to apply for this funding. It is also noted that some LMAs expressed an interest inpooling O&M equipment resources to help control O&M expenses. In the event that LMAs are unable tofulfill their maintenance obligations, DWR or the CVFPB is authorized to form a State Maintenance Areaand take over LMA maintenance obligations and billing the LMA’s property owners for the service. AnLMA may request formation of a State Maintenance Area or seek to remove levees from the State Plan ofFlood Control. To date, no State Maintenance Areas exist in the San Joaquin River Basin, though severalexist in the Sacramento River Basin.
5 .4 Genera l Recommendat ions
fo r Improv ing O&M Based on the findings made above, the following recommendations to improve O&M in the Mid SJRRegion and are described in more detail, below. It should be noted that two of the projects evaluated inthis RFMP came from these recommendations: Consolidation of O&M and Regional MaintenanceTechnical Support (formulated from the recommendation to Develop a Technical Support and EducationProgram to Inform LMAs on Levee Maintenance Issues). In addition, one project concept to Develop

Mid San Joaquin River RFMP
5-4 5. Operations & Maintenance
Expedited Permitting Programs for Maintenance Activities was formulated from the recommendation ofimplementing a Programmatic Environmental Analysis for O&M, as described below.
5.4.1 Programmatic Environmental Analysis for O&M
As previously discussed, O&M activities such as vegetation and rodent control can impact endangeredspecies and habitat for these species. Reform of current permitting regulations may help RDs moreeffectively meet their O&M responsibilities, while complying with applicable regulations. A programmaticapproach to permitting routine O&M responsibilities for SPFC facilities through the region, or the State,may help meet their O&M responsibilities while complying with applicable regulations.
5.4.2 Establish Consistent Levee Vegetation Standards
Maintenance and/or removal of vegetation along the levee is aimed at improving public safety, leveesurface visibility, and levee accessibility. However, as noted in the previous section, it is common for anRD to receive an acceptable rating from DWR on vegetation management, but an unacceptable ratingfrom USACE. RDs in the Region need DWR and USACE to agree on a common standard for leveevegetation management.
A brief summary of the differing vegetation standards is provided below.
The USACE’s vegetation policy is outlined in an Engineering Technical Letter (ETL) titled “Guidelines forLandscape Planting and Vegetation Management at Levees, Floodwalls, Embankment Dams, andAppurtenant Structures.” According to the ETL, a vegetation free zone must be maintained along alllevees. The vegetation free zone is defined as a three dimensional corridor surrounding all levees,floodwalls, embankment dams, and critical appurtenant structures in all flood damage reduction systems.The ETL requires removal of all vegetation (except grass) on existing levees, plus vegetation within 15 feetof the landside levee toe. Tree canopies extending into this zone must be trimmed 8 feet above theground.
By contrast, DWR’s vegetation policy incorporates a Life Cycle Management (LCM) approach for “legacy”vegetation. This policy is aimed at limiting the financial costs associated with extensive vegetationremoval and potentially significant loss of habitat along levees. Under DWR’s vegetation managementstrategy, levees containing legacy trees along the landside or waterside slopes will be managed to allowvegetation and trees to live out their normal life cycles except where they pose a threat, while graduallyprogressing (over several decades) toward the current USACE policy of “eliminating woody vegetationfrom the vegetation free zone.” The LCM approach allows for the preservation of riparian habitat as longas the vegetation does not impair visibility and accessibility. The crown must be kept free of all vegetationsince it serves as a patrol road for levee maintenance.
DWR’s policy also permits trees on the waterside slope that are farther than 20’ from the crest due toengineering benefits including erosion protection, soil reinforcement, and sediment recruitment,provided visibility requirements are met, and the vegetation does not pose a threat to the integrity of thelevee.
Recently USACE has released its “Interim Policy for Determining Eligibility Status of Flood Risk ReductionManagement Projects for the Rehabilitation Program Pursuant to PL 84 99” (March 2014). This documenthas set interim policies on levee vegetation management. Following this interim policy, levee systems will

Mid San Joaquin River RFMP
5. Operations & Maintenance 5-5
no longer be removed from the PL 84 99 Program for vegetation issues alone while long term policies areset. This is a good short term solution until long term policies are set. These long term policies may bemore in line with DWR guidelines.
Reconciling these two differing criteria will enable RDs to focus on a meeting a single vegetation standardfor their levees. If this recommendation is combined with the programmatic approach to permittingroutine O&M responsibilities for SPFC facilities as discussed previously, this would enable RDs to complywith permitting requirements while completing regular O&M responsibilities.
5.4.3 Streamline Grant Application Process and/or Support
LMAs with Grant Applications
DWR has many grant programs available to assist LMAs with repairs and improvements to their leveesystems, which is good since many RDs lack the financial resources to implement large scalerepairs/improvements. However, grant applications can take a significant amount of time to prepare, andtechnical expertise to complete. Limited RD staff resources mean that grants often go unapplied for, thuspropagating system deficiencies.
RDs have expressed a desire to have DWR staff assist in the preparation of grant applications, especiallyfor deficiencies identified by DWR. The RDs could review and have their respective Boards approve suchapplications, if necessary. This would help address critical erosion/seepage sites and other needed repairsidentified by DWR.
As mentioned previously, RDs in the Mid San Joaquin Region have limited financial resources, making itdifficult for these areas to meet the local cost sharing requirements for State and Federal grant programs.Revisions to the State’s local cost sharing guidelines for projects that provide regional flood systembenefits should be considered by DWR.
Finally, many of the RDs in the Region are not formally organized which prevents them from being able toenter into funding agreements with the State. A solution is needed to enable Districts to apply for Statefunding. For Districts where organization is infeasible, one possibility is agreements amongst severalDistricts to enter into funding agreements with DWR.
5.4.4 Consolidation of O&M
Large mowers and grout equipment used for vegetation and rodent control can be expensive, and are notused continuously. Therefore, an opportunity exists for RDs in the Region to pool their resources andshare upfront and maintenance costs of operating one piece of machinery, rather than each RD having toown and operation their own mowers and grout equipment.
5.4.5 Develop Levee Maintenance Best Management
Practice (BMP) Guidance
Development of a handbook of BMPs for levee management would help educate LMA staff andstandardize O&M practices. The handbook would include guidance for all O&M challenges, includingaddressing burrows/burrowing animals, and managing vegetation consistent with both DWR and USACEstandards (until one standard can be agreed upon).

Mid San Joaquin River RFMP
5-6 5. Operations & Maintenance
It would describe methods (e.g., dragging chains, goat grazing, mechanical trimming) and include the prosand cons of each, so each LMA can choose what works best for their situation.
Encroachments (those in place, but lacking permitting documentation) could also be addressed within thehandbook. If no such protocol exists this would be a natural place to develop it.
5.4.6 Develop a Technical Support and Education Program
to Inform LMAs on Levee Maintenance Issues
This program would be a medium through which educational materials such as the BMP handbookdescribed above could be disseminated. This would likely be done by a staff person who would meet inperson with LMA staff and organize workshops to benefit multiple LMAs. This program could also beexpanded to support LMAs in grant applications, but this expansion would most likely require local costshare from benefitted parties.

6. Land Use and Environmental Enhancements 6 1
6. Land Use and Environmental
Enhancements
6 .1 In t roduct ion This chapter provides 1) information on the current and anticipated future relationship between landuses within the floodplain and flood risks within the Mid SJR Region’s planning area; 2) identifieddesirable ecosystem enhancements within the region; and 3) linkages between potential floodmanagement actions and ecosystem enhancement, including funding incentives. Additionally, thischapter provides a list of generic land use and environmental enhancement tools that might beemployed to reduce flood risk, enhance ecosystem functions and services and/or habitat, or both.These generic tools may provide concepts worthy of development into potential individual regionalimprovements; they may also suggest environmental enhancements to potential flood managementprojects.
Sources for the information provided in this chapter include reports prepared by the Almond Board ofCalifornia; California Department of Conservation (CDC); California Department of Water Resources (DWR);Central Valley Business Journal (CVBJ); University of California, Berkeley; Hoover, et al.; Krousky andWells; Stanislaus County; Stanislaus County Agricultural Commissioner; and Stanislaus Council ofGovernments (STANCOG).

Mid San Joaquin River RFMP
6 2 6. Land Use and Environmental Enhancements
6.2 Pas t , P resent , and Futu re
Land Use
6.2.1 Historical Context
The Draft Environmental Impact Report (EIR) for the 2011 Stanislaus County Regional Transportation Planincludes a detailed description of the history of land use in Stanislaus County that was used to prepare thefollowing discussion. The first Europeans to explore the planning area were Spaniards interested in thewatercourses of the San Joaquin Valley. Stanislaus County is named for the Stanislaus River, firstdiscovered by Spanish explorer Lieutenant Gabriel Moraga in 1806. After Mexico achieved independencefrom Spain in 1821, colonization of California progressed with numerous rancho lands granted by the Mexicangovernors. Most ranchos were located in the vicinity of missions, but there some ranchos that werelocated in the San Joaquin and Sacramento Valleys.
After the gold discovery of 1848, the population of California expanded exponentially. Early settlementpatterns in Stanislaus County indicate that Gold Rush immigrants ignored valley lands and towns for thefoothills of the Sierra Nevada. Communities of that early period, such as La Grange and Knight’s Ferry,were predominantly mining camps that grew up along the Tuolumne and Stanislaus Rivers.
By the 1860s, larger and more permanent settlements sprouted along the Stanislaus River, including thetowns of Oakdale, New Hope, Adamsville, and Paradise. Initially, wheat was the primary crop because itprovided farmers with a source of income relatively quickly. Other cereal grains, such as barley and oats,were also common. Steamboats and small barges plying the San Joaquin River provided earlytransportation for freight and passengers. Hill’s Ferry and Grayson became important shipping points forwheat during the 1860s. Numerous settlements were established on the San Joaquin, Stanislaus, andTuolumne Rivers, particularly at ferry crossing points, but the river towns were generally abandoned infavor of railroad towns during the 1870s. Agricultural development was spurred when the Central PacificRailroad (later Southern Pacific Railroad) came to Stanislaus County. Railroads played a key role in theformation of the two largest cities in Stanislaus County, Modesto and Turlock, as well as smaller towns.Like Modesto, Turlock was established in 1871 along the railroad line. During the late 19th and early 20thcenturies, Turlock developed as a shipping point and retail center for surrounding farms. Southern PacificRailroad branch lines constructed through the county in the 1880s stimulated small commercial centers,including Oakdale, Waterford, and Newman.
Implementation of new irrigation systems expanded opportunities for diversification in agriculture forStanislaus County. For example, although wheat was very important, alfalfa quickly became a significantcrop, providing feed for the growing herds of dairy cattle; the cultivation of orchard crops such as peaches,apricots, almonds, and oranges also became possible. Irrigation led to a new agricultural boom inStanislaus County during the early 20th century. Although the agricultural economy fluctuated duringthe 20th century, it remains the leading industry in Stanislaus County, generating an annual grossagricultural value of greater than three billion dollars (Stanislaus County, 2011).

Mid San Joaquin River RFMP
6. Land Use and Environmental Enhancements 6 3
6.2.2 Current Land Use and Trends
Existing land use within the planning area is characterized in Chapter 2, Regional Setting. As describedthere, current land uses within the planning area are predominantly agricultural, including a mix ofdairies, livestock pasture and range, livestock feed crops, and orchards. Farmland makes up 75 percent ofthe Mid SJR Region of the SPFC, with urban areas accounting for only four percent. The small areas withinthe Mid SJR Region of the SPFC that are under the jurisdiction of the City of Modesto are entirely urbanand developed land. Table 6 1, Mid San Joaquin River Region Land Use, includes a summary of land usewithin the Mid SJR Region of the SPFC by acres and percent of region.
Table 6 1Mid San Joaquin River Region Land Use
Land Use Category1 Acres of Land Type % of SPFC Area
Urban and Developed Land 1,260 4%
Native Vegetation and Grazing Land 5,160 18%
Local and Unique Farmland 7,260 25%
Prime and Statewide Importance Farmland 14,290 50%
Confined Animal Agricultural Land 620 2%
Rural and Semi Agricultural Land 160 1%
Total 28,750 100%
1See Chapter 2, Regional Setting, for a description of each of the land use categories.
SOURCE: Mid San Joaquin River Region Flood Atlas (Appendix A)
The remainder of the planning area outside of the Mid SJR Region of the SPFC is also dominated byagriculture and includes the cities of Modesto, Ceres, Turlock, Patterson, and Newman and communities ofGrayson, Westley, and Crows Landing. Table 6 2, Land Use in Planning Area, characterizes land use in theplanning area, which is approximately 91 percent agricultural. Existing parks and recreational areas in theplanning area are described in Section 2.4.1, Public Access and Restoration.
Table 6 2Land Use in Planning Area
Land Use Category Acres of Land Type % of Planning Area
Agriculture 887,442 91%
Commercial 1,043 <1%
Residential 7,508 1%
Industrial 4,425 <1%
Planned Development 8,808 1%
Urban Transition 9,835 1%
City 53,610 6%
Total 972,671 100%
SOURCE: Stanislaus County, Merced County, San Joaquin County

Mid San Joaquin River RFMP
6 4 6. Land Use and Environmental Enhancements
As described in Section 2.5.3, Protected Assets – Agriculture and Associated Infrastructure of this RFMP,milk is the top agricultural commodity in the planning area, but dairies here have struggled in recent yearsand almond, walnut and cherry production is increasing remarkably. Over 100 dairies across the SanJoaquin Valley closed in 2012 and more were expected to close in 2013 (CVBJ, 2013). The dairy closureswere primarily because of sharp increases in feed costs that were a result of a major drought in much ofthe Mid western United States in 2012. Given that drought conditions have worsened, the recent trend ofdairy closures may continue although a significant reduction in dairy production has yet to be seen for theregion (Stanislaus County Ag Commissioner, 2012).
There has been a net decrease in farmland of Prime and Statewide Importance in Stanislaus County overthe last 20 years. Irrigated farmland was also on the decline overall, but in 2010 there was a net increasefrom the planting of orchards and vineyards. There was 16,000 acres of new almond plantings between2008 2010 (CDC, 2014). Continued conversion of row crops and silage production land uses to nut and fruitproduction is anticipated in coming years, and this trend may have an impact on flood management acrossthe region. Given the both the cost to replace trees and the high price per unit of production, flooddamages to orchard crops may result in higher costs than flood damages to annual forage crops,depending on the timing and duration of flooding (Stanislaus County Ag Commissioner, 2012; Universityof California, 1997). Almond production in California has increased by over 82 percent in the last 10 years.Consistent with this statewide trend, almond production has increased significantly in Stanislaus,San Joaquin, and Merced counties by approximately 55, 65, and 56 percent, respectively. In StanislausCounty, the majority of the new nut and fruit crops have been planted in the eastern and northeasternportions of the county, though orchards are being planted throughout the county (Modesto Bee, 2014).Table 6 3, California Almond Production by County, includes the number of pounds produced annually inCalifornia counties with commercial almond operations. As shown in this table, Stanislaus County hasbeen one of California’s top three almond producing counties within each of last 10 years.
Another trend in agriculture in the San Joaquin Valley is increasing soil salinity. Salinity in San JoaquinValley soils has been increasing because the water imported via the Central Valley Project and StateWater Project to irrigate crops is high in salt content. San Joaquin Valley soils include dense clay layersthat prevent the salts from permeating into the ground. As a result, salts build up in the soil and mayimpede the ability of crops to grow. Many of the soils in the Central Valley are naturally saline and poorlydrained, and when irrigated, these soils leach salts into the shallow groundwater and root zone, alsoimpeding plant growth. Without comprehensive salinity management, decreased agricultural productionmay be observed in decreased acreage of actively farmed land in the region or changes in cropping andirrigation patterns over time. The San Joaquin Basin is experiencing a chronic salt imbalance withsignificantly more salt brought in through surface water deliveries than is conveyed out. In 2006, a jointeffort began among the CVRWQCB, State Water Resources Control Board, and local stakeholders toaddress salinity issues within the Central Valley and to adopt long term solutions. The collaborative effortis called Central Valley Salinity Alternatives for Long Term Sustainability (CV SALTS) and described in moredetail in Section 2.7, Agricultural Land Management and Water Quality.

Mid San Joaquin River RFMP
6. Land Use and Environmental Enhancements 6 5
Table 6 3California Almond Production by County (million pounds)
CropYear St
anislaus
SanJoaq
uin
Merced
Kern
Fresno
Mad
era
Tulare
Kings
Colusa
Glenn
Butte
Yolo
Teha
ma
Sutter All
Others Total
2003/04 169.3 55.3 129.3 205.9 176.9 94.5 18.5 12.3 55.0 42.3 50.0 6.6 8.0 5.7 4.1 1,033.6
2004/05 163.9 51.0 127.6 215.8 173.5 93.4 20.4 13.0 38.0 37.2 45.0 4.7 6.9 4.6 2.9 997.9
2005/06 132.2 41.8 102.1 210.1 160.1 82.4 15.9 12.0 40.3 42.6 50.4 5.6 8.4 4.6 2.7 911.4
2006/07 163.6 55.6 124.6 247.8 232.7 100.1 21.5 17.7 50.8 38.4 41.8 6.3 7.7 4.9 3.8 1,117.3
2007/08 223.3 75.2 172.9 271.0 253.8 125.3 26.7 17.9 66.2 51.8 66.7 10.0 11.4 5.6 5.1 1,383.6
2008/09 240.6 82.1 187.3 354.3 322.2 142.7 36.2 23.4 86.0 48.6 56.9 10.4 9.7 5.3 5.2 1,611.0
2009/10 198.8 70.7 156.7 317.9 281.9 112.3 32.6 20.6 75.7 52.7 49.2 12.4 10.9 5.2 4.9 1,402.6
2010/11 202.5 68.0 164.2 403.5 344.2 149.7 42.4 29.9 83.0 55.8 47.1 13.6 11.7 4.9 6.0 1,626.6
2011/12 269.7 87.9 216.7 472.6 443.0 206.1 44.5 39.0 85.5 59.7 49.0 17.9 11.9 6.9 6.6 2,017.1
2012/13 261.8 91.5 201.4 393.4 413.6 203.5 49.1 30.7 85.1 57.9 50.9 18.1 12.5 7.0 7.5 1,884.1
SOURCE: Almond Board of California, 2013

Mid San Joaquin River RFMP
6 6 6. Land Use and Environmental Enhancements
6.2.3 Land Use Regulations
Zoning Codes
The primary tool to regulating land use within a floodplain is through a local zoning code, which alsoimplements its general plan, as well as other laws, programs, and policies. Much of the land use withinthe Mid SJR Region and broader planning area is regulated by the Stanislaus County Code and StanislausCounty General Plan. The remaining portion of the planning area is regulated by the individual generalplans and zoning codes for the cities of Modesto, Ceres, Turlock, Patterson, and Newman. In addition,small amounts of land within the planning area are located within Merced and San Joaquin counties, andare subject to those communities’ zoning codes and general plans.
The Land Use, Conservation/Open Space, and Agricultural elements of the Stanislaus County General Planinclude several goals and policies that apply directly or are related to flood management, habitatconservation, and agricultural preservation. Goal Five of the Stanislaus County Conservation/OpenSpace Element is to: "Reserve, as open space, lands subject to natural disaster in order to minimize loss oflife and property of residents of Stanislaus County." Policy Four under Goal One in the Land Use Elementstates that development within the 100 year floodplain must meet the requirements of Chapter 16.50,Flood Damage Prevention, in the Stanislaus County Code. Chapter 16.50, Flood Damage Prevention,applies to special flood hazard areas (SFHAs) within the unincorporated areas of Stanislaus County thatare defined in the Stanislaus County Code as having special flood or flood related hazards and is shown onFEMA Flood Hazard Boundary Map (FHBM) or FIRM as Zone A, AO, AR, AE, A99, or AH. Figure 3 11,General Plan Land Uses within 100 , 200 , and 500 year Floodplains of this RFMP, shows the boundariesof each of these designated flood zones in the planning area. As shown, a significant portion of theplanning area falls within these flood zone designations. Currently, development is permitted withinSFHAs provided that the standards included in Chapter 16.50 of the Stanislaus County Code are met.Areas that are designated as floodways by the CVFPB are extremely hazardous because of the velocity anddepth of flood waters, which carry debris and have a high erosion potential. Development is prohibited indesignated floodways unless certification by a registered professional engineer or architect can beprovided demonstrating that encroachments would not result in any increase in the base flood elevation.Merced County, and the cities of Patterson, Modesto, Ceres, and Newman municipal codes include similarrequirements. The zoning codes for both San Joaquin County and the City of Turlock do not includespecific provisions associated with development within a floodplain.
Senate Bill 5
Other regulations are in effect at the state level that control land use. Senate Bill 5 (SB5) was passed in2007 which requires a 200 year level of flood protection for urban and urbanizing areas within California’sCentral Valley, and recommends 100 year flood protection for non urban areas. Under SB5, developmentin moderate or special flood hazard areas (i.e. 500 year and 100 year floodplains, respectively) would onlybe allowed within the Central Valley if a city or county can find, based on substantial evidence in therecord, that the development will be subject to less than 3 feet of flooding during a 200 year flood event.
For those areas where potential depth from a 200 year flood event is greater than 3 feet, the localgovernment will be required to make an Urban Level of Flood Protection (ULOP) finding. The localgovernment is required to make the ULOP finding before: (1) entering into a development agreement forany property that is located within a flood hazard zone; (2) approving a discretionary permit or other

Mid San Joaquin River RFMP
6. Land Use and Environmental Enhancements 6 7
discretionary entitlement, or a ministerial permit that would result in the construction of a new residence,for a project that is located within a flood hazard zone; or (3) approving a tentative map, or a parcel mapfor which a tentative map was not required, for any subdivision that is located within a flood hazard zone.This essentially means that no development can occur in urban or urbanizing areas unless 200 year floodprotection (with less than 3 feet of flooding) can be achieved. SB5 regulations require general plans andzoning codes of all local governments in the Central Valley be revised to reflect these standards by July2016. Local governments then have until 2025 to make the improvements and achieve this urban level offlood protection. See Figure 6 1, General Plan Designations and 100 and 200 year Floodplains, andFigure 6 2, Zoning Designations and 100 and 200 year Floodplains, for the current general plan andzoning designations within the 100 and 200 year floodplains in the planning area.
SB5 regulations have the potential to greatly affect future development within the planning area. The onlyurban (i.e., areas with 10,000 or more people) and urbanizing (i.e., areas that will have 10,000 or morepeople in 10 years) areas within the planning area are the cities of Modesto, Patterson, and Newman.Although the 200 year flood maps have not been developed for the Mid SJR Region, it is likely that therewill be areas that can experience flooding of 3 feet or greater during a 200 year flood event in these cities.Until these cities have their 200 year flood maps completed to determine where the ULOP findings arerequired to be made, and a plan to achieve the urban level of flood protection by 2025, only limitedgrowth can occur.
Preservation of Agricultural/Open Space Regulations
There are mechanisms in place that help facilitate the preservation of agriculture and open space areaswithin the Mid SJR Region. Chapter 21.118 Land Use Restriction of the Stanislaus County ZoningOrdinance includes provisions to implement the requirements of a thirty year land use restrictioninitiative. Under this chapter, any land that is redesignated or rezoned from an agricultural or open spaceuse to residential is contingent upon the approval by a majority vote of the county voters at a general orspecial local election. With this provision in place, the conversion of land from agriculture and open spaceto residential uses is more difficult to effect and the process of redesignation or rezoning takes longer.
Another mechanism for regulating land use is the California Land Conservation Act of 1965, referred to asthe Williamson Act, which is a tax relief measure for owners of farmland and open space lands. The actpermits the owner of land that is used for farming or open space uses including wildlife habitat to sign acontract with the applicable county guaranteeing that the land will remain in farming or open space usesfor a minimum of 10 years in return for assessing taxes on the property based on the agricultural or openspace value rather than the market value, which can result in a significant reduction in property taxes forthe landowner. As shown in Figure 6 3, Williamson Act Lands, significant portions of Stanislaus, Merced,and San Joaquin counties are under Williamson Act contracts with local landowners. The Williamson Acthas been an effective agricultural and open space preservation tool, though land covered underWilliamson Act contracts continues to decline in the planning area and throughout California (CDC, 2013).The Agricultural Element of the Stanislaus County General Plan includes policies and implementationmeasures to continue participation in and contribute to strengthening the Williamson Act to preserveagricultural and open space lands in Stanislaus County.

Mid San Joaquin River RFMP
6 8 6. Land Use and Environmental Enhancements
This page intentionally left blank

Stanislaus River
Tuolu
mne
Riv
er
San Joaquin River
CaliforniaAqueduct
D
elta-Mendota
Canal
ÄÅ99
ÄÅ219
ÄÅ108
ÄÅ132
ÄÅ33
§̈¦5
ÄÅ33
ÄÅ99
§̈¦5
ÄÅ140
Oresti
mbaCr
eek
Del
PuertoCreek
Little Salado Cr eek
C reek
Ripon
M e r c e dM e r c e dC o u n t yC o u n t y
S a n J o a q u i nS a n J o a q u i nC o u n t yC o u n t y
S t a n i s l a u sS t a n i s l a u sC o u n t yC o u n t y
Ceres
CrowsLanding
Empire
Grayson Keyes
Patterson
RiverbankSalida
Westley
Modesto
Newman
Salado
Mid San Joaquin River Regional Flood Management Plan . 120802Figure 6-1
General Plan Designations and 100- and 200-year Floodplains
SOURCE: USDA, 2012; ESRI, 2012; DWR, 2013; ESA, 2013
0 2
Miles
Mid San Joaquin River Region
Mainstem San Joaquin Regional Limits
State Plan of Flood Control Levee
Mid-San Joaquin Region ofState Plan of Flood Control Area
FEMA 100-yr Flood Zone
USACE 200-yr Flood Zone
Generalized Land Use
Low Density Residential
Medium Density Residential
High Density Residential
Agriculture
Commercial
Industrial
Public/Quasi-public
Park/Open Space
Mixed Use
Planned Development
City/Specific Plan
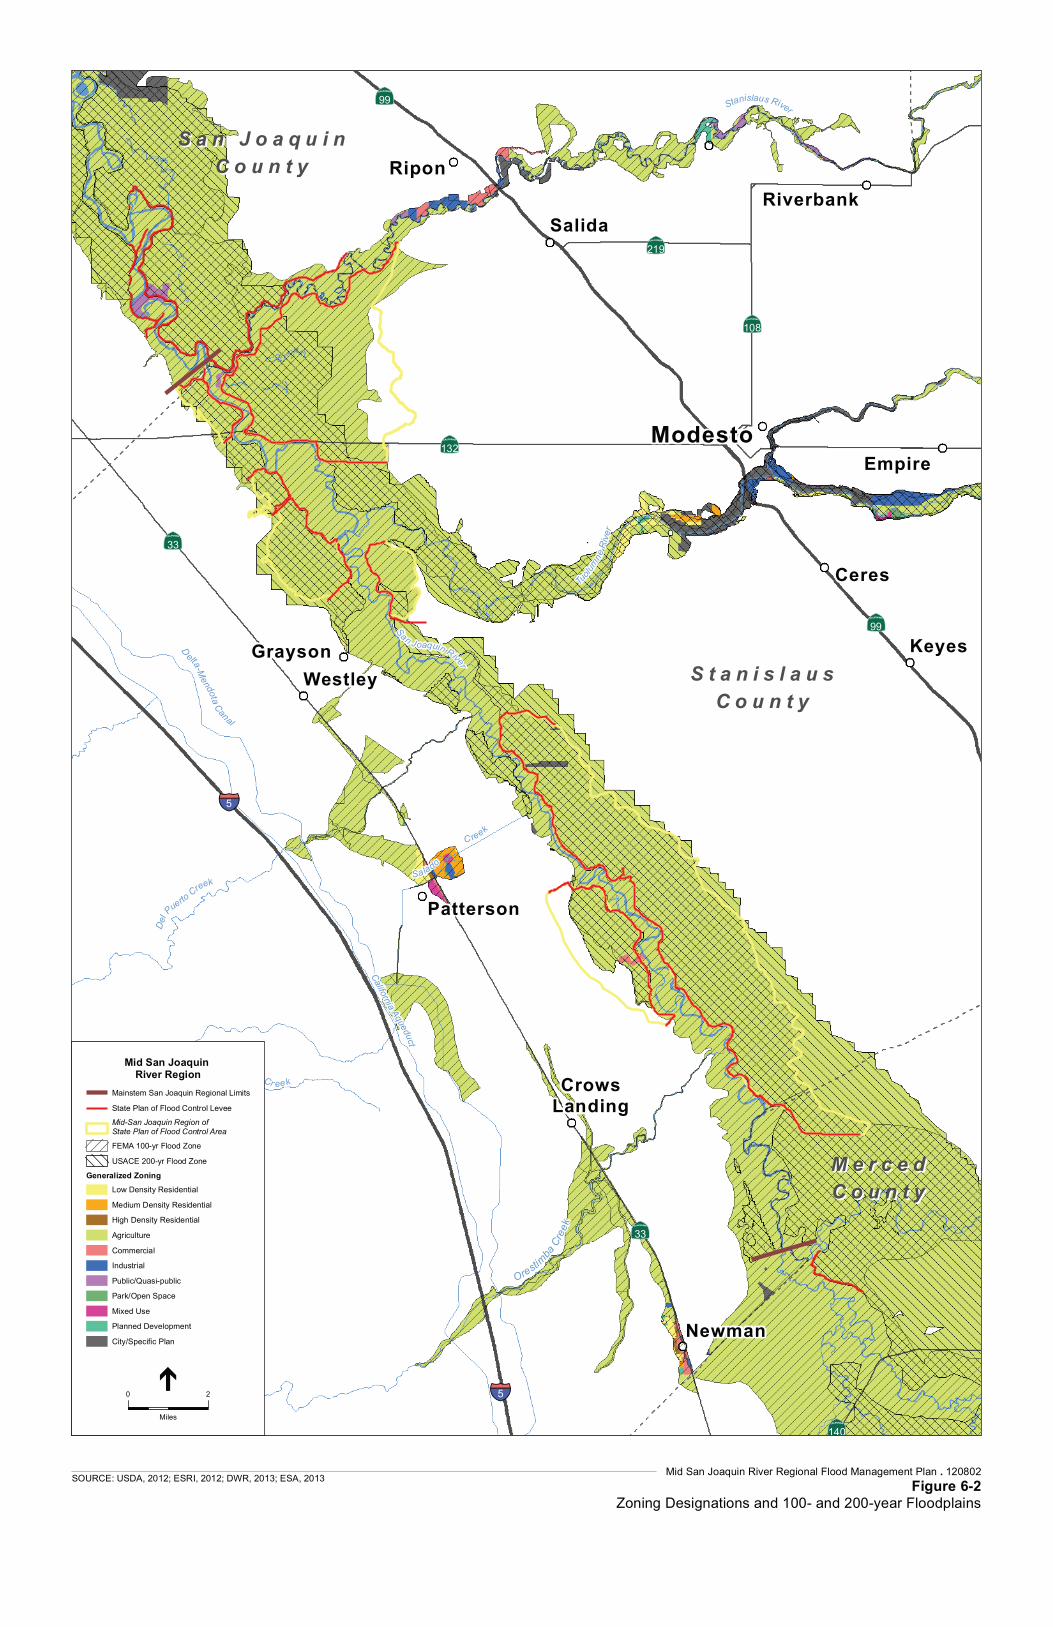
Stanislaus River
Tuolu
mne
Riv
er
San Joaquin River
CaliforniaAqueduct
D
elta-Mendota
Canal
ÄÅ99
ÄÅ219
ÄÅ108
ÄÅ132
ÄÅ33
§̈¦5
ÄÅ33
ÄÅ99
§̈¦5
ÄÅ140
Oresti
mbaCr
eek
Del
PuertoCreek
Little Salado Cr eek
C reek
Ripon
M e r c e dM e r c e dC o u n t yC o u n t y
S a n J o a q u i nS a n J o a q u i nC o u n t yC o u n t y
S t a n i s l a u sS t a n i s l a u sC o u n t yC o u n t y
Ceres
CrowsLanding
Empire
Grayson Keyes
Patterson
RiverbankSalida
Westley
Modesto
Newman
Salado
Mid San Joaquin River Regional Flood Management Plan . 120802Figure 6-2
Zoning Designations and 100- and 200-year Floodplains
SOURCE: USDA, 2012; ESRI, 2012; DWR, 2013; ESA, 2013
0 2
Miles
Mid San Joaquin River Region
Mainstem San Joaquin Regional Limits
State Plan of Flood Control Levee
Mid-San Joaquin Region ofState Plan of Flood Control Area
FEMA 100-yr Flood Zone
USACE 200-yr Flood Zone
Generalized Zoning
Low Density Residential
Medium Density Residential
High Density Residential
Agriculture
Commercial
Industrial
Public/Quasi-public
Park/Open Space
Mixed Use
Planned Development
City/Specific Plan

Stanislaus River
Tuolu
mne
Riv
er
San Joaquin River
CaliforniaAqueduct
D
elta-Mendota
Canal
ÄÅ99
ÄÅ219
ÄÅ108
ÄÅ132
ÄÅ33
§̈¦5
ÄÅ33
ÄÅ99
§̈¦5
ÄÅ140
Oresti
mbaCr
eek
Del
PuertoCreek
Little Salado Cr eek
C reek
Ripon
M e r c e dM e r c e dC o u n t yC o u n t y
S a n J o a q u i nS a n J o a q u i nC o u n t yC o u n t y
S t a n i s l a u sS t a n i s l a u sC o u n t yC o u n t y
Ceres
CrowsLanding
Empire
Grayson Keyes
Patterson
RiverbankSalida
Westley
Modesto
Newman
Salado
Mid San Joaquin River Regional Flood Management Plan . 120802Figure 6-3
Williamson Act Lands
SOURCE: USDA, 2012; San Joaquin Co., 2009; Merced Co., 2010; Stanislaus Co., 2013; ESRI, 2012; DWR, 2013; ESA, 2014
0 2
Miles
Mid San Joaquin River Region
Mainstem San Joaquin Regional Limits
State Plan of Flood Control Levee
Mid-San Joaquin Region ofState Plan of Flood Control Area
Parcels with Williamson Act Contracts
In Merced County
In San Joaquin County
In Stanislaus County

Mid San Joaquin River RFMP
6 12 6. Land Use and Environmental Enhancements
This page intentionally left blank

Mid San Joaquin River RFMP
6. Land Use and Environmental Enhancements 6 13
6.2.4 Land Use and Flood Risk
The land uses within a floodplain significantly influence flood risk. In the context of flood management,risk is defined as the product of the probability of a given flood occurring and the damage that wouldresult. The probability of a given flood occurring is influenced by climate, hydrology, and topography. Thedamage that would result depends on the land uses within the floodplain, flood protection systems thatare in place, and flood proofing measures that have been implemented. Development within a floodplaingenerally increases the damage that would be caused in the event of a given flood. As described inSection 3.8, Identified Flooding and Flood Hazards, land uses within the 100 and 500 year floodplains inthe Mid SJR Region include urban; rural and semi rural agricultural; native vegetation and grazing land;farmland of prime and Statewide importance; local and unique farmland; and confined animal agriculture.The vast majority of land within the 100 and 500 year floodplains in the Mid SJR Region and broaderplanning area is agricultural. According to recent data from the EPA, approximately 21 dairies are locatedwithin the 100 year floodplain in the Mid SJR Region (EPA, 2013). As discussed above under Section 6.2.3,per SB5, development within the 200 year floodplain in urban areas will not be permitted withoutprotection from a 200 year flood event. SB5 also recommends 100 year flood protection be provided fornon urban areas. Development in this context includes new residential, commercial, or industrial landuses and buildings for agricultural uses. As some fruit and nut trees are damaged by prolonged inundationand costly to replace, the flood risk needs to be balanced with potential profits before planting orchards.While the provisions of SB5 don’t preclude orchards in the 100 or 200 year floodplains, it would be goodland use practice to consider flood compatible uses that include production of crops that are floodtolerant, open space, some recreational facilities and uses, and areas of rehabilitated floodplain habitat.
6.2.5 Land Use Management Tools
Potential land use management tools are listed and described below that could go beyond therequirements of SB5 to reduce flood risk, enhance the environment, improve recreation, and preserveagricultural lands. The following list describes options that have been identified as part of the planningprocess and may or may not be selected for implementation. Those that are selected would need to bedefined further. It should be noted that these tools were not recommended for inclusion as a project inthe RFMP at this time.
As zoning is the primary tool used to regulate land use, zoning designations could be establishedthat only permit flood compatible land uses within the 100 and 200 year floodplains, particularlyin areas that are not able to meet the flood protection requirements of SB5. These designationscould also restrict flood incompatible uses, such as crops that are sensitive to inundation andestablishment of new or expanded dairies, to areas outside of the 100 and 200 year floodplainswhile allowing flood compatible agriculture within the floodplain boundaries. A separate zoningdesignation could be applied to areas in the floodplain with high potential for habitat rehabilitationwith associated restrictions to encourage the eventual creation of habitat in those areas. This effortwould require coordination and approval by local jurisdiction advisory and legislative bodies. Theproposed zoning designation would likely require a Stanislaus County General Plan Amendmentand an amendment to the Stanislaus County Zoning Code, as well as environmental review.
New Williamson Act contracts could be established on agricultural lands within floodplains,including on lands that would provide cropland and floodplain habitat, depending on the time ofyear. This might be accomplished through the development of new incentives or an enhanced

Mid San Joaquin River RFMP
6 14 6. Land Use and Environmental Enhancements
outreach program by Stanislaus County. Open space is considered a consistent land use for parcelsenrolled in the Williamson Act in Stanislaus County.
In order to balance flood risk with potential profits, Stanislaus County could choose to enactpolicies that would encourage flood compatible crops and discourage crops that are highlysensitive to prolonged inundation, such as dairies, permanent tree crops and food processingfacilities.
An incentive could be provided for preserving agricultural lands in the 100 , 200 , and 500 yearfloodplains. Agricultural lands could continue to be preserved through the Stanislaus CountyFarmland Mitigation Program, which currently requires mitigation for the loss of agricultural landto residential development at a 1:1 ratio, but could be expanded to include any form of land usechange that results in the loss of agriculture and extended beyond the unincorporated portions ofthe County.
A Transfer of Development Rights Program could be implemented to maintain floodplains in theplanning area as open space, fish and wildlife habitat, conservation lands, agriculture, or recreationwhile encouraging residential and commercial development within areas that are better suited forsuch development. A large area, such as a County, is needed to effectively implement this planningtool.
Regional mitigation planning could be developed in the planning area and in collaboration with theresource agencies and neighboring flood planning regions to provide needed environmentalmitigation for impacts associated with flood improvement projects and SPFC operations andmaintenance (O&M) activities. Any mitigation activities would need to be consistent with theCentral Valley Flood System Conservation Strategy (Conservation Strategy), which is scheduled forrelease in 2014.
An emergency response fee could be assessed on lands that are particularly costly to serve during aflood event. Two examples of such land uses are dairies and high density residential development.The fee would be designed to act as a deterrent to placing these land uses in the floodplain andcould fund emergency response actions that address the safety of lives and property, but alsoassociated costs such as mitigation for water contamination downstream that generally resultswhen dairies are flooded.
Additional land within the floodplains of the Mid SJR Region could be zoned for recreation andopen space to allow for additional parks and other recreational purposes, and improve publicaccess along the rivers and creeks while keeping the potential risk to floodplain assets low.Changing the zoning of the land would have to be accomplished at the local government level. Thisprocess would involve general plan amendments, zoning map amendments, possible amendmentsto the zoning code and the process would be subject to property owner input, PlanningCommission and Board of Supervisor consideration, and action through advertised public hearings.
Entities that have infrastructure within RDs might be compelled to contribute toward maintenancecosts. For example, a pipeline crossing an RD may benefit from flood protection; if so, the pipelineowner could be required to contribute to the flood protection service.
A statewide fund could be established to support RDs in maintaining levees when there is criticalinfrastructure within RD boundaries.

Mid San Joaquin River RFMP
6. Land Use and Environmental Enhancements 6 15
6.3 Potent ia l Env i ronmenta l
Enhancements The rivers in the planning area are critical migratory corridors for steelhead trout and other anadromousfish. Riparian and terrestrial habitats support a variety of wildlife species. As such, there is a need torehabilitate habitat in the planning area. As stated on page 3 21 of the 2012 CVFPP, “Under the SSIA,ecosystem restoration opportunities are integral parts of systems improvements, as well as urban, smallcommunity, and rural agricultural area flood protection projects.” Section 9616 (a) of the California WaterCode states that the environmental objectives of the Central Valley Flood Protection Act of 2008 are to1) promote natural dynamic hydrologic and geomorphic processes, 2) increase and improve the quantity,diversity, and connectivity of riparian, wetland, floodplain, and shaded riverine aquatic habitats, includingthe agricultural and ecological values of these lands, and 3) promote the recovery and stability of nativespecies and populations and overall biotic community diversity. Prior to and during the regional floodmanagement process, several potential areas and specific habitat rehabilitation projects have beenidentified in the planning area.
Riparian, wetland, floodplain, and shaded riverine aquatic habitats can be provided in wildlife areas andrefuges, designated conservation areas, and agricultural lands. As described in Section 2.4.2, EcologicallySensitive Areas and Habitat, there are two wildlife areas, two wildlife refuges, and several large areas ofconservation land within and near the Mid SJR Region of the SPFC. Atlas Map 18, Managed EnvironmentalLands (Appendix A), shows the locations of land managed by the USFWS, CDFW, The Nature Conservancy(TNC), River Partners, Tuolumne River Trust, and others. Figure 2 5, Managed Environmental Lands,shows these areas along with privately held lands with conservation easements, including those held bythe Natural Resources Conservation Service (NRCS). Analyses conducted for the 2012 CVFPP (DWR, 2012)identified 7,760 acres of floodplain lands along river corridors within the planning area that couldpotentially be hydrologically reconnected to the San Joaquin, Merced, Tuolumne, and Stanislaus rivers soas to benefit ecological processes. As shown in Figure 3 22, Floodplain Inundation Potential of RiverCorridors in the Lower San Joaquin Basin, of Attachment 9F: Floodplain Restoration Opportunity Analysisof the 2012 CVFPP, the majority of the area with a high potential for floodplain inundation in the planningarea is located along the San Joaquin River.
Conservation Needs
The following list describes the aspects of ecosystem degradation relevant to the planning area:
Loss of frequently activated floodplains
Constraints on channel migration processes, which foster the creation of new habitats andreinvigoration of habitats through disturbance
Reduction in the amount of riparian and marsh habitats
Hydrologic reconnection of floodplains, including salmon rearing habitat
Creation of, enhancement, and support of processes to engender riparian and marsh habitats
Removal of revetment to allow channel migration
Removal or remediation of fish passage barriers

Mid San Joaquin River RFMP
6 16 6. Land Use and Environmental Enhancements
Management of invasive plants
Provision of spawning gravel for salmonids and sturgeon
Creation of flood refugia for riparian obligate terrestrial species
Improvement of the connectivity among riparian corridors
In aquatic ecosystem rehabilitation, there is a set of general tools that can be used to meet habitatobjectives. These include:
planting native grasses on levees and a mix of native plants as hedgerows along agricultural lands,
coordinating vegetation management and erosion control maintenance,
breaching or setting back levees to reconnect floodplains and provide transient storage,
removing revetment to restore channel meander potential,
establishing conservation and flowage easements along agricultural lands,
removing fish passage barriers and screening surface water diversions,
augmenting spawning gravel in the river channel,
filling deep pools in the river channel where non native fish that prey on native juvenile salmonidstend to congregate (note that before specific deep pools are filled, it is important to determinewhether they provide important temperature refugia for anadromous fish), and
removing non native invasive vegetation.
Specific attributes of rehabilitated habitat would include seasonally inundated floodplains, naturalgeomorphic processes, riparian vegetation, shaded riverine aquatic cover, connectivity with adjacent ornearby habitat. The quality and quantity of riparian habitat will be important in the adaptation ofecosystems to climate change because riparian habitat is often more resilient to change when compared toupland terrestrial habitats, functions as an ecological corridor for a variety of plant and animal species, linksaquatic and terrestrial habitats, provides thermal refugia, and may temper anticipated changes to hydrology(Seavy, et al., 2009).
Several ongoing conservation planning efforts have planning area boundaries that overlap with the MidSJR RFMP planning area boundary, or are relevant because they have a nexus with the Mid SJR Region.Those plans are listed in Table 2 4, Conservation Plans Relevant to Planning Area. Attachment 2:Conservation Framework of the 2012 CVFPP listed the conservation opportunities that had beenidentified prior to publication, including several in the Mid SJR RFMP planning area. The list included thereconnection of historical sloughs and oxbows, restoration of riparian habitat, removal of invasive species,and restoration of floodplains along the San Joaquin River roughly between river miles 57 and 118 and theThree Amigos project to restore wetland, riparian, and floodplain habitat, remove nonessential levees,reduce floodway maintenance, and remove invasive species, and the Grayson Bypass Project, which is nolonger proposed. In addition to the environmental enhancement projects identified in the CVFPP,opportunities for groundwater recharge in concert with reconnecting floodplain lands were specificallyidentified for significant parts of the floodplain within the Mid SJR RFMP planning area. In particular,opportunities were identified at a site along Dry Creek, east of Modesto and one mile upstream of theTuolumne River and described in Attachment 8L: Groundwater Recharge Opportunities Analysis. Therange of storage capacity at the site was calculated as 6.6 to 12.7 thousand acre feet per square mile ofrecharge area. Last, the Central Valley Habitat Exchange (CVHE) is a new initiative to more completely

Mid San Joaquin River RFMP
6. Land Use and Environmental Enhancements 6 17
quantify the range of environmental benefits that are provided by agricultural lands through restorationactivities and/or a change in management by the landowner, and to promote the reintegration of habitatinto California’s agricultural lands. The CVHE will promote, monitor, and assist in the exchange of habitatcredits, which are a measure of the ability of a parcel to support a particular species or naturalcommunity. Willing landowners are offered the potential to gain another source of revenue and benefitfrom having high quality habitat on their land.
6.4 F lood Management and
Env i ronmenta l and
Recrea t iona l Enhancement
L inkages Multi benefit projects are those that combine flood management, environmental, recreational, waterquality, and other objectives to achieve improvements in each of these areas. Chapter 4.0, Integration ofConservation and Flood Management, of the Conservation Framework (Attachment 2 to the 2012 CVFPP)provides several examples of projects and programs that have incorporated flood management andenvironmental objectives. One example of a multi benefit effort to improve flood management andrecreational opportunities is also provided – the Interagency Agreement between DWR and the CaliforniaDepartment of Parks and Recreation (DPR), which will support multi benefit projects at the ColusaSacramento River State Recreation Area. As part of multi benefit projects, several actions can be takenthat deviate from more traditional flood maintenance, offering dual or multiple benefits. Levees can beremoved from the SPFC along with associated maintenance obligations. In such instances, the USACEO&M manual would be modified to allow breaching and other modification to the existing levees. Onlevees that have been or will be removed from the federal project, brushy vegetation can be reestablished on the levees through a three year restoration project and live trapping has shown that theseefforts are successful for wildlife recovery. On levees that must continue to pass state and federalinspections/maintenance requirements, native grass sod has been shown to provide marginal habitat thatcan act as a movement corridor for terrestrial species during flood events. Recreational access points canbe strategically placed to facilitate access for regular inspections and maintenance. Multi benefit projectsas well as any projects that alter hydraulics may have an influence on flood risk in neighboring regions. Assuch, coordination with the Upper San Joaquin River and Lower San Joaquin River/Delta South regions iscrucial in this planning process and into the future as projects are implemented.
Two examples of projects that have been identified during the regional flood management process areintroduced in the list below and described in more detail in Chapter 7, Proposed Regional Improvements.The descriptions below provide good examples of multi benefit projects to illustrate the concept.
Floodplain Expansion and Ecosystem Restoration at Dos Rios Ranch/Hidden Valley MitigationProject – This project would restore flooding and transient floodwater storage to approximately1,000 acres of historic floodplain, restore riparian habitats, promote river physical processes ofscour and deposition, and provide passive recreation along 6 river miles. Levees would be removedfrom the SPFC along with associated maintenance obligations and the USACE O&M manual wouldbe modified to allow breaching and other modification to the existing levees. While the propertyhas been purchased, additional investment is needed to develop mitigation opportunities, address

Mid San Joaquin River RFMP
6 18 6. Land Use and Environmental Enhancements
permitting needs, integrate recreational facilities, and remove levees from the federal project orotherwise modify the maintenance obligations.
Integrated Levee Vegetation Management – Flood Maintenance and Habitat – Since 2002, wildliferesearchers at the Endangered Species Recovery Program at CSU Stanislaus have been working withlandowners and other stakeholders to identify habitat management and restoration activities thatcan contribute to the recovery of terrestrial riparian species in the region including riparian brushrabbit (Sylvilagus bachmani riparius) and riparian wood rat (Neotoma fuscipes riparia). Levees in theregion provide crucial high ground refugia for such wildlife during flood events. Vegetation on leveesin the region is currently not managed to facilitate levee use during floods for wildlife survival andpost flood recovery. On levees that have been or will be removed from the federal project, brushyvegetation can be re established on the levees through a three year restoration project and livetrapping has shown that these efforts are successful for wildlife recovery. On levees that mustcontinue to pass state and federal inspections/maintenance requirements, native grass sod has beenshown to provide marginal habitat that can act as a movement corridor for terrestrial species duringflood events. This project includes re establishing appropriate vegetation on levee slopes to promoteterrestrial wildlife survival during floods – either native sod on active levees, or native brushvegetation on inactive levees (RDs 2099, 2100, 2102, and 2092 in the future).
Meeting multiple objectives broadens the available sources of funding. Flood management projects aregenerally funded from sources including local assessments, bond funds, and federal and state programs.Examples of funding associated with habitat rehabilitation and/or mitigation that can be accessed bymulti benefit projects include the Restoration Fund established as a requirement of the Central ValleyProject Improvement Act (CVPIA), programs under the National Oceanic and Atmospheric Administration(NOAA), USFWS, CDFW, and other state and federal agencies, as well as private foundations and othersources. Consistent with the vision described in the CVFFP, DWR will prioritize funding for multi benefitprojects identified in the current regional flood management planning process.
A number of studies have demonstrated the potential for dedication of floodplains to open space,recreational, and habitat enhancement uses to have a positive economic impact. A recent cost benefitanalysis on a northeast river concluded that the benefits of the 108 mile Meramec Greenway greatlyexceed the cost by reducing flood damages and increasing local property values (Krousky and Walls,2013). A general examination of floodplain valuation in the Central Valley provides a literature review anddiscusses multiple floodplain services (benefits) in association with their documented cost per acre(Eisenstein and Mozingo, 2013). A 2002 study evaluating the economic impact on Stanislaus County thatwould result from a floodplain rehabilitation along the San Joaquin and Tuolumne rivers concluded thatagricultural production would be reduced, but the net benefit would exceed the loss of agriculturalproduction by approximately $4.86 million over the 25 year period considered in the study. The benefitswere associated with economic activity generated by habitat and channel restoration activities, improvedaesthetics, and recreational use (USFWS, 2002).
Attachment 9A, Regional Advance Mitigation Planning, of the 2012 CVFPP describes the effort to provide amethod to achieve faster, less expensive, and better mitigation for unavoidable impacts associated withinfrastructure projects proposed within the state. Regional Advance Mitigation Planning (RAMP) can beintegrated with, and add benefits to, conservation planning efforts. The RAMP Work Group formed in 2008and includes DWR, Caltrans, EPA, USFWS, CDFW, California State Parks, the National Oceanic andAtmospheric Administration, USACE, California Regional Water Quality Control Boards, The NatureConservancy, Wildlife Conservation Board, UC Davis, Resources Legacy Fund, and the Federal HighwayAdministration. Projects that include habitat enhancement, such as those listed above, should be consideredfor inclusion in RAMP.

7. Proposed Regional Improvements 7 1
7. Proposed Regional
Improvements
7 .1 In t roduct ion This chapter describes the proposed regional improvements, or projects, that were identified throughthe stakeholder engagement process, which is described in Section 1.3, Stakeholder Engagement. TheRegional Partners collaborated with participating stakeholders to develop and refine descriptions ofeach of the proposed projects. The estimated cost of each project is provided in Chapter 9, RegionalFinancial Plan. The criteria used to evaluate and rank the projects and the outcome of that process aredescribed in Chapter 8, Regional Priorities.
7.2 Pro jec t Descr ip t ions Thirty seven projects were identified as having the potential to reduce flood hazards and provide otherbenefits to the planning area. A range of project types were identified; some examples include small damremoval, sediment load reduction, floodplain rehabilitation, a levee vegetation management program,studies to better understand flooding hazards, emergency response planning and training, flood educationprograms, compliance with Senate Bill 5 requirements, and storm drainage enhancements. The locations ofprojects with a specific project site are shown in Figure 7 1, Project Locations. Projects that don’t involve aspecific site are listed on Figure 7 1, but not shown on the map. Table 7 1, Summary of Proposed RegionalImprovements, includes the name, project lead, potential project partners, project status, project cost,project timeline, and a short project description. Potential project partners are those parties that intend topartner or would be willing to consider partnering on a specific project. Detailed descriptions of each projectare provided in Appendix F, Project Descriptions and Evaluations.

S tanislaus Ri ver
Merced River
120
219
132
165
140
33
99
5
108
Orest
imba
Creek
Del Puerto Creek
Salda Creek
Salda Creeklittle
California Aqueduct
Dry Creek
Tuolomne River
Delta-Mendota Canal
SanJoaquin
River
8
T u o l u m n eT u o l u m n eC o u n t yC o u n t y
PattersonTurlock
Riverbank
Modesto
1
2
3
4
56
14 7
9
10
11
12
13
15
16
17
18
19
20
21
22
23
242526
M e r c e dM e r c e dC o u n t yC o u n t y
S a n J o a q u i nS a n J o a q u i nC o u n t yC o u n t y
S t a n i s l a u sS t a n i s l a u sC o u n t yC o u n t y
Mid San Joaquin River Regional Flood Management Plan . 120802Figure 7-1
Project Locations
SOURCE: USDA, 2012; ESRI, 2012;DWR, 2013; ESA, 2013; CSWRCB, 2014
0 10
Miles
Mid San Joaquin River Region
Project Location
Mainstem San Joaquin Regional Limits
State Plan of Flood Control Levee
County Boundary
Mid-San Joaquin Region ofState Plan of Flood Control Area
Projects that don’t involve a specific site• Consolidation of Operation and Maintanance• Dry Creek Watershed Detention Reconnaissance Study• Emergency Response Plan – Debris Management• Emergency Response Plan – Local Planning and Training• Flood Risk Education• Integrated Levee Vegetation Management – Flood Maintenance and Habitat• Reducing Sediment Loading into the San Joaquin River from Westside Agricultural Lands• Regional Maintenance Technical Support• Sediment Management Investigation• Tuolumne River Flood Management Feasibility Study• Tuolumne River Regional Parkway• Westside Creeks On-Farm Multi-Benefit Program
Black Gulch Storm Drainage StudyCity of Newman/ Bureau of Reclamation Flood LeveeRehabilitationDennett Dam RemovalDos Rios Ranch Floodplain Expansion and Ecosystem Restoration Project and Hidden Valley Ranch Mitigation ProjectGomes Lake / Harding Drain ImprovementsHydrologic Study of Linkages between RD 2091 and RD 2063La Grange Floodplain Restoration and Spawning Gravel AugmentationLittle Salado CreekModesto WWTP - Reduce Flood Risk (Jennings Plant)Modesto WWTP - Reduce Flood Risk (Sutter Plant)Orestimba Creek Flood Management ProjectPatterson WWTP - Reduce Flood RiskRD 1602 ResilienceRD 2031 ResilienceRD 2063 ResilienceRD 2091 ResilienceRD 2101 ResilienceSalado Creek Flood Management ProjectSB 5 Compliance - City of ModestoSB 5 Compliance - City of NewmanSB 5 Compliance - City of PattersonRiverfront Park ProjectStorm Drainage Enhancements along Salado CreekThree Amigos (or the Non-structural Alternative at the San JoaquinRiver National Wildlife Refuge)Tuolumne River Regional Park - Carpenter Road/West ModestoFlood Management and Park DevelopmentWSID Fish Screen and Change in Point of Diversion
1. 2. 3. 4. 5. 6. 7. 8. 9. 10. 11. 12. 13. 14. 15. 16. 17. 18. 19. 20. 21. 22. 23. 24.
25.
26.
Projects

Mid San Joaquin River RFMP
7. Proposed Regional Improvements 7 3
Table 7 1Summary of Proposed Regional Improvements
Project Name Project Lead Potential Project Partners Project Status Project Cost Project Timeline Short Project Description
Black Gulch Storm Drainage Study* City of Patterson Stanislaus County Pre planning $28,000 Undetermined There is a permitted spillway into the Delta Mendota Canal (DMC) fromBlack Gulch, a drainage situated between Salado and Del Puerto creeks,which keeps a local commercial area in Patterson from flooding. A studyneeds to be performed to determine what alternative solutions might beappropriate if/when the DMC Authority decides to not renew thepermit.
City of Newman/ Bureau of ReclamationFlood Levee Rehabilitation
City of Newman Bureau of Reclamation Pre planning $225,000 45 day construction time Rehabilitate a flood protection levee on Bureau of Reclamation propertybetween the Newman Wasteway and the City of Newman WastewaterTreatment Plant (WWTP).
Consolidation of O&M Reclamation District (RD)2092
Interested parties include RDs 2031, 2101, 2092, 2091,1602; City of Modesto; California Department of WaterResources (funding, technical assistance); local ResourceConservation Districts; and Stanislaus County (potentialgovernance and management partners)
Planning $200,000 1 5 years Two or more Reclamation Districts form a formal partnership to sharetechnical, financial, and/or operational capacity to perform necessaryoperations and maintenance (O&M). As an initial step, invest 2 personyears to investigate potential governance options and design andimplement a pilot maintenance agreement project.
Dennett Dam Removal Tuolumne River Trust No partners identified at this time Planning. The Dam Removal Basis ofDesign Report is complete. Funding isrequired to complete a sedimenttoxicology test, plus NationalEnvironmental Policy Act (NEPA)/CaliforniaEnvironmental Quality Act (CEQA), andpermitting.
$700,000 2 years Removal of Dennett Dam, an abandoned low head dam located on thelower Tuolumne River in Modesto, California. The dam has been aninstream barrier to anadromous fish passage, controlling local hydraulicand sediment transport conditions, for over 60 years, while alsoimpeding water flow in the river. It is also a significant safety hazardadjacent to a major park, and has been the location of three drowningdeaths in the last five years, including two children.
Dos Rios Ranch Floodplain Expansion andEcosystem Restoration Project and HiddenValley Ranch Mitigation Project
River Partners Wildlife Conservation Board (WCB); DWR; United StatesBureau of Reclamation (USBR); United States Fish andWildlife Service (USFWS); Natural Resources ConservationService (NRCS); San Francisco Public Utilities Commission(SFPUC); California Department of Fish and Wildlife (CDFW)(funding partners, technical assistance); Central ValleyFlood Protection Board (CVFPB); National Marine FisheriesService (NMFS); United States Army Corps of Engineers(USACE); regulatory agencies; environmental nongovernmental organizations (NGOs); local municipalities;Reclamation District 2092 (project support and approvals);regional flood management agencies with mitigation needsthat may be filled on the property
Planning, Implementation $8,000,000 1 5 years Project to restore flooding and transient floodwater storage toapproximately 1,000 acres of historic floodplain, restore riparianhabitats, and promote river physical processes of scour and depositionalong 6 river miles. Remove levee maintenance obligations from StatePlan of Flood Control (SPFC) and modify USACE O&M manual to allowbreaching and other modification to the existing levees. Provide 191acres of habitat mitigation for future regional SPFC environmentalimpacts.
Dry Creek Watershed DetentionReconnaissance Study*
Stanislaus County and Cityof Modesto
USACE Pending funding grants $250,000 2015 2016 pending funding Complete a reconnaissance study of potential options for reducing floodrisks by detaining flood flows in the Dry Creek watershed, upstream ofthe City of Modesto.
Emergency Response Plan – DebrisManagement
Stanislaus County Office ofEmergency Services
Stanislaus County Public Works, cities within StanislausCounty, city public works departments within StanislausCounty, Patterson Irrigation District, West StanislausIrrigation District
Pre planning $110,000 1 5 years A debris management plan is needed to better prepare to restore publicservices and ensure public health and safety in the aftermath of a floodor earthquake and to better position the Mid SJR Region for emergencyresponse funding from the State of California, Federal EmergencyManagement Agency (FEMA), and other participating entities. StanislausCounty Office of Emergency Services proposes the development of acomprehensive, countywide debris management plan.
Emergency Response Plan – Local Planningand Training
Stanislaus County Office ofEmergency Services
Stanislaus County; City of Modesto; City of Patterson; Cityof Newman; Reclamation Districts 1602, 2063, and 2091;Patterson Irrigation District; West Stanislaus IrrigationDistrict
Pre planning $110,000 1 5 years Planning and training are necessary to improve coordination betweenlocal agencies so that emergency response can be improved in theplanning area. A program would be developed and implemented toaddress this need.

Mid San Joaquin River RFMP
7 4 7. Proposed Regional Improvements
Table 7 1Summary of Proposed Regional Improvements
Project Name Project Lead Potential Project Partners Project Status Project Cost Project Timeline Short Project Description
Flood Risk Education River Partners DWR and USACE levee maintenance and inspection staff;CVFPB; regional flood management agencies, including SanJoaquin River Flood Control Agency (SJRFCA); San JoaquinArea Flood Control Agency (SJAFCA); Lower San JoaquinLevee District (LSJLD); counties; cities; USFWS, CDFW,USACE, NGOs with an interest in river and floodmanagement and education
Pre planning $30,000 Dependent upon funding –could start immediately andcontinue indefinitelycontingent upon funding
Develop and implement a regional flood risk management educationalprogram to raise awareness of flood risks and elevate the level of publicunderstanding with respect to flood risk management needs and thevalue of investments to address them. For the local maintaining agencies(LMAs), include education on their role in flood risk management andprovide technical guidance/assistance on levee maintenance activitiesand permitting requirements.
Gomes Lake / Harding Drain Improvements Gomes Lake Joint PowersAuthority
Turlock Irrigation District, Stanislaus County, ReclamationDistrict 2063, Reclamation District 2091
Pre planning $1,700,000 1 5 years This project includes multiple components to enhance the function,reliability, flexibility and capacity of the Gomes Lake facility, which storesand drains stormwater and return flows, providing flood risk reductionbehind the east bank levees of the San Joaquin River.
Hydraulic and Channel Migration Studies* Stanislaus County Office ofEmergency Services
RD 2091, Gomes Lake JPA, City of Modesto, City ofNewman, City of Patterson
Pre planning $200,000 1 5 years Two regional studies (mainstem San Joaquin River flood hydraulics andchannel migration) and three focused hydraulic studies are needed tobetter inform flood management in the Mid SJR Region.
Integrated Levee Vegetation Management –Flood Maintenance and Habitat
River Partners Funding partners WCB, DWR, USBR, NRCS; landowners;RDs; environmental NGOs; technical experts as needed
Planning $6,400,000 1 5 years This project includes re establishing appropriate vegetation on leveeslopes to promote terrestrial wildlife survival during floods – eithernative sod on active levees or native brush vegetation on inactive levees(RDs 2099, 2100, 2102, and 2092 in the future).
La Grange Floodplain Restoration andSpawning Gravel Augmentation
Tuolumne River Trust Stanislaus County Parks and Recreation Pre planning $1,500,000 1 5 years Restore 77 acres of degraded floodplain habitat along the TuolumneRiver in La Grange while developing a source of spawning gravel toimprove and enhance existing spawning beds in the Tuolumne River.
Little Salado Creek Stanislaus County USACE Planning $5,000,000 1 5 years Construction of a project to partially divert, retain and percolate up to1,030 cubic feet per second (cfs) of flow from Little Salado Creek.
Modesto WWTP Reduce Flood Risk City of Modesto No partners identified at this time Pre planning $80,000,000 Undetermined Develop and evaluate potential solutions to existing flood hazards at theModesto Sutter and Jennings WWTPs, including completion of twostudies (Sutter Plant Relocation Feasibility Study and a WastewaterTreatment Facilities Master Plan) that are currently in process, andimplement the preferred alternative.
Orestimba Creek Flood Risk ManagementProject
City of Newman Stanislaus County, Orestimba Creek Flood Control District,USACE
Planning $44,000,000 1 5 years Construction of a 4.7 mile chevron levee along east bank of CentralCalifornia Irrigation District (CCID) Main Canal and a 1 mile cross levee toreduce flood risk to Newman and adjacent agricultural areas, providing a200 year level of protection. The chevron levee would include 3 feet offreeboard above the mean 200 year water surface elevation.
Patterson WWTP – Reduce Flood Risks* City of Patterson No partners identified at this time Pre planning $27,000 Undetermined Develop and evaluate potential solutions to existing flood hazards at theCity of Patterson WWTP.
RD 1602 Resilience RD 1602 CVFPB permitting, technical assistance; landownersfunding, governance; DWR funding, technical assistance;USACE small role in emergency response, possibly fundingfor repairs; Stanislaus County oversees district governanceand financing; engineering firms, environmental firms,other technical experts as needed
Pre planning $4,700,000 1 5 years Complete the necessary repairs and upgrades to bring RD levee systemback into “Active” status for PL 84 99 eligibility.
RD 2031 Resilience RD 2031 CVFPB permitting, technical assistance; landownersfunding, governance; DWR funding, technical assistance;USACE small role in emergency response, possibly fundingfor repairs; Stanislaus County oversees district governanceand financing; engineering firms, environmental firms,other technical experts as needed
Pre planning $2,000,000 1 5 years Complete the necessary repairs and upgrades to bring RD levee systemback into “Active” status for PL 84 99 eligibility.

Mid San Joaquin River RFMP
7. Proposed Regional Improvements 7 5
Table 7 1Summary of Proposed Regional Improvements
Project Name Project Lead Potential Project Partners Project Status Project Cost Project Timeline Short Project Description
RD 2063 Resilience RD 2063 CVFPB permitting, technical assistance; landownersfunding, governance; DWR funding, technical assistance;USACE small role in emergency response, possibly fundingfor repairs; Stanislaus County oversees district governanceand financing; engineering firms, environmental firms,other technical experts as needed
Pre planning $900,000 1 5 years Complete the necessary repairs and upgrades to bring RD levee systemback into “Active” status for PL 84 99 eligibility.
RD 2091 Resilience RD 2091 CVFPB permitting, technical assistance; landownersfunding, governance; DWR funding, technical assistance;USACE small role in emergency response, possibly fundingfor repairs; Stanislaus County oversees district governanceand financing; engineering firms, environmental firms,other technical experts as needed
Pre planning $400,000 1 5 years Complete the necessary repairs and upgrades to bring RD levee systemback into “Active” status for PL 84 99 eligibility.
RD 2101 Resilience RD 2101 CVFPB permitting, technical assistance; landownersfunding, governance; DWR funding, technical assistance;USACE small role in emergency response, possibly fundingfor repairs; Stanislaus County oversees district governanceand financing; engineering firms, environmental firms,other technical experts as needed
Pre planning $3,000,00 1 5 years Complete the necessary repairs and upgrades to bring RD levee systemback into “Active” status for PL 84 99 eligibility, including addressing amajor levee erosion site.
Reducing Sediment Loading into the SanJoaquin River from Westside AgriculturalLands
West Stanislaus RCD NRCS, irrigation districts, Westside Coalition Ongoing with an existing list of interestedproducers.
$65,000,000 15 years Improve irrigation technology with buried drip and sprinkler irrigationsystems that allow for the capacity to irrigate a variety of crop types andeffectively eliminate erosion of sediment off of farm fields whencompared to traditional, flood irrigation practices. Sediment loadingresults in reduced capacity of and increased flooding in Westside Creeksand the San Joaquin River.
Regional Maintenance Technical Support RD 2091 and RD 2092 CVFPB permitting, technical assistance; landownersfunding, governance; DWR funding, technical assistance;USACE possibly funding for repairs; Stanislaus Countyoversees governance and financing; engineering firms,environmental firms, other technical experts as needed
Pre planning $100,000 1 5 years Development and implementation of a shared staffing position tosupport LMA fulfillment of maintenance responsibilities within the MidSJR Region.
Riverfront Park Project City of Patterson Stanislaus County, San Joaquin River Valley Coalition Pre planning $2,500,000 Undetermined Creation of a riverfront park, recreational trail, and enhanced habitatalong the western bank of the San Joaquin River between Old Las PalmasAvenue and Eucalyptus Avenue.
Salado Creek Flood Management Project City of Patterson Stanislaus County Pre planning $600,000 Undetermined Widening of Salado Creek from the Delta Mendota Canal to the citylimits.
SB5 Compliance – City of Modesto* City of Modesto Stanislaus County Pre planning $130,000 Phases I and II 1 year; PhaseIII 10 20 years
Comply with SB 5 regulations through update of the City’s relevantplanning documents and completion of a preliminary engineering reportto identify potential alternatives on how the City can provide 200 yearflood protection.
SB5 Compliance – City of Newman* City of Newman No partners identified at this time Pre planning $125,000 Phases I and II – 3 years?;Phase III 10 20 years
Comply with SB 5 regulations through update of the City’s relevantplanning documents and completion of a preliminary engineering reportto identify potential alternatives on how the City can provide 200 yearflood protection.
SB5 Compliance – City of Patterson* City of Patterson No partners identified at this time Pre planning $205,000 Phases I and II – 3 years?;Phase III 10 20 years
Comply with SB 5 regulations through update of the City’s relevantplanning documents and completion of a preliminary engineering reportto identify potential alternatives on how the City can provide 200 yearflood protection.
Sediment Management Investigation* River Partners DWR, CVFPB, flood management agencies relevant to theUpper SJR RFMP and Lower SJR/Delta South RFMP
Pre planning $250,000 1 5 years Complete a study that identifies sediment induced chokepoints alongthe San Joaquin River in the planning area, the dynamics that createthem, and potential actions to improve flood conveyance in those areas.

Mid San Joaquin River RFMP
7 6 7. Proposed Regional Improvements
Table 7 1Summary of Proposed Regional Improvements
Project Name Project Lead Potential Project Partners Project Status Project Cost Project Timeline Short Project Description
Storm Drainage Enhancements along SaladoCreek
City of Patterson No partners identified at this time Pre planning $880,000 Undetermined Installation of reinforced concrete pipelines under the CaliforniaNorthern Railroad wooden bridge to improve storm drainage alongSalado Creek.
Three Amigos (also known as the Nonstructural Alternative at the San JoaquinRiver National Wildlife Refuge)
San Joaquin River NationalWildlife Refuge
River Partners, USFWS Anadromous Fish RestorationProgram, USACE, early project partners USDA/NRCS, DWR,CALFED
Planning $5,500,000 More than 5 years Project to restore flooding and transient floodwater storage to morethan 3,100 acres of historic floodplain, restore riparian habitats, andpromote river physical processes of scour and deposition along 3 milesof the San Joaquin River. While the lands have been purchased,additional investment is needed to implement flood risk reduction goalsconsistent with the Refuge’s habitat management goals. Needed effortsinclude planning and design of the Refuge for flood management as wellas removal of levees from the federal project.
Tuolumne River Flood ManagementFeasibility Study*
Stanislaus County City of Modesto, USACE Dormant $3,000,000 Approximately 5 years Complete a USACE Feasibility Study, or a study similar in scope, thatevaluates how the management of the Tuolumne River could be revisedto improve flood management, enhance aquatic habitat, and improvewater quality.
Tuolumne River Regional Park – CarpenterRoad/West Modesto Flood Managementand Park Development
Tuolumne River RegionalPark Joint Powers Authority
City of Modesto, City of Ceres, Stanislaus County, TuolumneRiver Trust
Planning. The Tuolumne River RegionalPark Master Plan, adopted in 2001,includes the overview for development ofthe Carpenter Road Area. Funding isrequired to implement the construction ofthe levee and to develop the Specific Planfor the Carpenter Road Area.
$750,000 Approximately 2 years Help reduce flood damages in West Modesto neighborhoods whiledeveloping the adjacent Tuolumne River Regional Park.
Tuolumne River Regional Parkway Tuolumne River RegionalPark Joint Powers Authority
City of Modesto, City of Ceres, Stanislaus County, TuolumneRiver Trust
Planning and construction $60,000,000 15 25 years to completion Continued development of the undeveloped areas of the TuolumneRiver Regional Park including the Gateway Parcel.
Westside Creeks On Farm Multi BenefitProgram
Audubon California West Stanislaus Resource Conservation District, irrigationdistricts, NRCS, USFWS, California Wildlife ConservationBoard
This project is in the concept phase, butsince the project lead is currentlyconducting very similar work in theSacramento Valley; thus, work could beginvery quickly if funding were allocated.
$75,000 3 years Provide outreach and technical assistance to landowners in theStanislaus County Westside Creek watersheds for multi benefit flood riskreduction projects.
WSID Fish Screen and Change in Point ofDiversion Project
West Stanislaus IrrigationDistrict
CDFW, NMFS, USFWS, USBR Planning, design, and permitting $38,000,000 1 5 years This RMFP Project will help support three (3) Phases of the WSID FishScreen Project while significantly improving site specific and regionalflood management and resilience, and ecosystem enhancement. Phase 1would provide cost share to complete the planning, design andpermitting of mutually beneficial fish screen alternatives. Phase 2funding would contribute to the required 50% non federal cost share forconstruction of WSID’s preferred alternative fish screen project. Phase 3would provide cost share contribution to help develop and complete theplanning, design and permitting of integrated and mutually beneficialflood management and resilience and ecosystem enhancements along90% of the WSID intake canal and alignment across the SJRNWR.
* Indicates a project that is primarily or entirely a study.

Mid San Joaquin River RFMP
7. Proposed Regional Improvements 7 7
7 .3 Pro jec t Concepts Table 7 2, Project Concepts, includes nine concepts that were identified during the planning process.These were project ideas that were described but not developed in sufficient detail to allowconsideration as detailed projects. Often they lacked an identified champion or party to take the lead.Many were ideas for major projects or programs that were appropriate for development at a largergeographic scale than within the Mid SJR Region alone. More detailed descriptions of each of theproject concepts are provided in Appendix G, Project Concept Descriptions.
Table 7 2Project Concepts
Project Concept Name Short Description
Develop Expedited PermittingPrograms for MaintenanceActions
Coordinate with all permitting agencies to develop a permitting program that will reduce thetime and cost required to permit routine maintenance actions.
Divert Flood Flows toAgricultural Lands (both inthe Mid SJR and the UpperSan Joaquin Regions)
Diverting flood flows onto nearby agricultural and refuge land along the San Joaquin River coulddecrease peak flows within the channels.
Ecosystem Restoration AlongWaterways (both in the MidSJR and the Upper SanJoaquin Regions)
Similar to routing flood flows onto agricultural land, an alternative approach would be toacquire agricultural properties along the San Joaquin River and allow for seasonal floodplaininundation to provide fish rearing habitat as well as the diversion of flood flows, and, in someareas, the direct recharge of groundwater. This type of project could be implemented as aconservation easement, part of the Central Valley Habitat Exchange, or an ecosystem mitigationbank.
Emergency ResponseImprovement
Implement the following measures to improve emergency response in the planning area: 1)develop local flood fight plans with support from larger agencies, such as Modesto andStanislaus County; 2) develop public safety agency evacuation plans; 3) clarify and documentthe command structure for areas with flood risk; 4) better define operational area logisticalsupport for flood fight operations; and 5) form a Stanislaus Operational Area flood responseworking group.
Improve Upstream ReservoirOperations
Update and improve upstream reservoir operations through enhancements to coordinationamong operating entities; use of additional information, including forecasting; broadercommunications with others, including local communities; improved and accessible gaging; andupdated flood control manuals. Analyze and implement actions to modify upstream reservoiroperations to improve flood management; aquatic, riparian, and floodplain habitat; waterquality; and recreation.
San Joaquin River BasinSediment Status andDynamics Study
For the entire San Joaquin River basin 1) develop a reach based sediment budget andconceptual model of sediment processes and then 2) develop one or more sediment transportmodels and analyze transport processes to develop sediment management recommendationsat a basin wide scale.
San Joaquin River NationalWildlife Refuge ProposedExpansion
The United States Fish and Wildlife Service is considering expanding the San Joaquin RiverNational Wildlife Refuge in two sections to restore and enhance habitat to benefit birdsmigrating along the Pacific Flyway and many other wildlife species that may be compatible orcomplementary with flood conveyance and transient floodwater storage on floodplains in theMid San Joaquin River region.

Mid San Joaquin River RFMP
7 8 7. Proposed Regional Improvements
This page intentionally left blank

8. Regional Priorities 8 1
8. Regional Priorities
8 .1 In t roduct ion This chapter explains the criteria used to evaluate and prioritize the projects and concepts described inChapter 7, Proposed Regional Improvements, and describes the process and outcome of evaluating andprioritizing each.
A two step process was applied to first define the set of eligible projects and then rank them using multiplecriteria (multiple criteria evaluation). Two types of potential projects, or “regional improvements”, wereconsidered:
Concept level recommendations. These were project ideas that were described but notdeveloped in sufficient detail to allow consideration as detailed projects. Often they lacked anidentified champion or party to lead the project. Many were ideas for major projects orprograms that were appropriate for development at a larger geographic scale than within theMid SJR Region alone. Sometimes they simply were not ripe for consideration.
Project level recommendations. These proposed projects have an identified champion or partyto lead the project and some level of development.
Concept level recommendations were subject to screening, but not ranking. Project level recommendationswere both screened and ranked. Concept level recommendations were subject to review and comment asthe drafts of this chapter were reviewed. Project level recommendations were selected through ranking thatis based on the application of identified criteria using available information and the judgment of the RegionalPartners, subject to review and comment by the stakeholders. This evaluation and ranking was explicit andpresented to the stakeholders for review.

Mid San Joaquin River RFMP
8 2 8. Regional Priorities
8 .2 Pr io r i t i za t ion Cr i te r i a Prioritization Criteria were used to identify the proposed regional improvements for the Mid SJR RFMPin a transparent two step process. The Prioritization Criteria applied included both Screening andRanking Criteria. The flow chart shown in Figure 8 1, Prioritization Process, depicts the processgraphically. First, all potential projects were screened using the Screening Criteria and qualitativelyevaluated (High, Medium, Low) to identify which regional improvements would be included in theRFMP. Only potential projects that scored Medium or High on both of the Screening Criteria wereretained as draft proposed project level proposals or regional improvements in the RFMP. Draftproposed project level regional improvements were submitted for inclusion in the Financial Plan,presented in Chapter 9 of this document. Second, in concert with the development of the FinancialPlan, the Ranking Criteria were used by the RFMP Partners to identify the draft relative priority or rankof each of the project level regional improvements. The ranking was reviewed with the Stakeholdersand a final subset of the projects selected for inclusion in this chapter. The final set of RecommendedRegional Improvements, including both concept level and project level improvements, were made bythe RFMP Partners after the Financial Plan was developed and Stakeholder comments were considered.
The projects were evaluated with respect to Ranking Criteria, using available data, on an approximaterelative scale, such as High, Medium, Low, or N/A. No weighting factor was applied.1 A narrative isprovided to justify the score selected.
Figure 8-1 Prioritization Process
1 Preliminary assumption. Additionally, a “level of certainty” modifier may be applied to adjust raw scores if there is significantuncertainty associated with specific proposed projects that makes them inappropriate to directly compare to other, more welldeveloped projects.

Mid San Joaquin River RFMP
8. Regional Priorities 8 3
8.2.1 Screening Criteria
Recommended improvements had to score Medium or High on both of these criteria to have beenincluded in the RFMP as Proposed Regional Improvements. The score of Low, Medium, or High for eachof the criteria was based on the RFMP objectives and the professional judgment of the Project Partners.
SC1 Consistency with RFMP goals. The project is consistent with the goals of the RFMP and CVFPP.
SC2 Implementation feasibility. The project is considered reasonably plausible with respect toimplementation. It is well founded with respect to purpose and the expectation of effectivenessand has no significant legal impediments, community opposition, or other factors that wouldpreclude its implementation or make it unlikely.
8.2.2 Ranking Criteria
Given the relatively minor level to which most projects in the Mid SJR Region’s planning area have beendeveloped, scoring using the Ranking Criteria was also conducted on a largely semi quantitative basis,adequate to provide a relative valuation of the proposed projects.
Project level improvements were ranked by assigning a relative score (High, Medium, Low, or N/A) foreach of the following criteria.
RC1 Implementation feasibility. No significant legal impediments, community opposition, or otherfactors exist that would make the project infeasible to implement.
RC2 Financial feasibility. There is a current or anticipated source of funding that would cover all orthe majority of the cost of the project. If appropriate, funds to cover any required cost share areavailable or can reasonably be expected to be obtained.
RC3 Flood risk reduction – life. A decrease in the number of lives at risk due to flooding, at presentand over the long term. This can be achieved either through the movement of individuals out ofthe floodplain or improved flood protection.
RC4 Flood risk reduction flood damage. A reduction in the assets at risk, measured in dollars, atpresent and over the long term. This can be achieved either through the modification of landuses within the floodplain or improved flood protection.
RC5 Operations, maintenance, and repair. An improvement in efficiency and effectiveness, orreduction of need at present and over the long term
RC6 Ecosystem function. The project would be consistent with ecosystem priorities and goals ofadopted plans, including the CVFPP’s Conservation Strategy. Ecosystem benefits must contributeto recovery and are in addition to any mitigation requirements.
RC7 Institutional support. An improvement in the support for entities contributing to flood management.
RC8 Other benefits. There are multiple benefits; system wide effects; benefits that affect areasbeyond the region; operations, maintenance and repair needs facilitation or reduction; and/orimproved institutional support.
RC9 Cost effectiveness. The benefit is greater than the cost, measured in dollars or the relative costof achieving similar benefits through other means.
RC10 Low potential for dis benefits. After mitigation, the project would not have any significantadverse impacts.

Mid San Joaquin River RFMP
8 4 8. Regional Priorities
8.2.3 Scoring
After all of the eligible project level concepts were scored, points were preliminarily assigned to eachcriterion score: High = 3, Medium = 2, Low = 1. Guidance was developed for each criterion regarding whenthe scores of High, Medium, and Low apply. The guidance is included in Appendix F, Project Descriptionsand Evaluations. Since two of the ranking criteria relate to the reduction of flood risk, RC 3 (life risk) andRC 4 (flood damages), flood risk reduction was given greater emphasis among the 10 ranking criteria if allcriteria are treated equally (no weighting). Projects scoring at least one “High,” or at least one “Medium”and one “Low,” on the two flood risk reduction ranking criteria were identified as the Highest Priorityprojects for the RFMP. The remaining projects were ranked based on the summation of all of the rankingcriterion scores. They were split into two groups, “High Priority” and “Medium Priority” at a break basedon the total (summed) scores.
8.3 App l ica t ion o f P r io r i t i za t ion
Cr i te r ia
8.3.1 Application of Screening Criteria
Using the scoring guidance described above, each project and project concept was evaluated under thescreening criteria. All projects had to score Medium or High on both of these criteria to have beenincluded in the RFMP as Proposed Regional Improvements. All proposed projects passed this test. Thescores assigned to each project and project concepts are included in Table 8 1, Screening and RankingScores. Appendix F, Project Descriptions and Evaluations, includes a description of why each score waschosen.
8.3.2 Application of Ranking Criteria
Each project was then ranked according to the ten criteria shown in Section 8.2.2. As with the screeningcriteria, Appendix F includes a description of why each score was chosen under the Ranking Criteria. Insome cases, the level of detail available in the project description influenced the scoring. For example,scores of Low and Medium under Ranking Criterion RC 3, Flood Risk Reduction – Life Risk weredifferentiated, in part, by how well the information in the project description allowed for characterizationof the flood risk reduction potential.
8.4 Summary o f Screen ing and
Rank ing Outcomes The summary of screening and ranking outcomes is shown in Table 8 1, Screening and Ranking Scores. Asshown in Table 8 1, all 37 projects were screened, ranked, and are categorized into three tiers: HighestPriority, High Priority, and Medium Priority.

Mid San Joaquin River RFMP
8. Regional Priorities 8 5
Table 8 1Screening and Ranking Scores
Consistencywith RFMPgoals
Implementationfeasibility
Implementationfeasibility
Financialfeasibility
Flood riskreductionlife risk
Flood riskreductionflooddamage
Operations,maintenance, andrepair
Ecosystemfunction
Institutional support
Otherbenefits
Costeffectiveness
Lowpotentialfor disbenefits
Project Name SC 1 SC 2 RC 1 RC 2 RC 3 RC 4 RC 5 RC 6 RC 7 RC 8 RC 9 RC 10Highest priorityCity of Newman/Bureau of Reclamation Flood Levee Rehabilitation M M M H M L N/A N/A N/A M M MConsolidation of O&M H M M M L M H N/A H M M HDennett Dam Removal H H H M H L N/A H N/A M H HDry Creek Watershed Detention Reconnaissance Study* M M M H M M N/A N/A N/A N/A M MEmergency Response Plan – Local Planning and Training H H H H M M H N/A H N/A H HFlood Risk Education H M M H L M L N/A L L H HModesto WWTP Reduce Flood Risk M H H L M L N/A N/A N/A M M MOrestimba Creek Flood Risk Management Project M H H L M M N/A N/A M N/A M MRegional Maintenance Technical Support H M M H L M H L H L H HSB5 Compliance – City of Modesto* H H H H M L N/A N/A L L H MSB5 Compliance – City of Newman* H H H H M L N/A N/A L L H MSB5 Compliance – City of Patterson* H H H H M L N/A N/A L L H MTuolumne River Flood Management Feasibility Study* H M M M M M N/A L N/A L M HTuolumne River Regional Park – Carpenter Road/West Modesto Flood Management and Park Development H H H M M L N/A H N/A M H MHigh priorityDos Rios Ranch Floodplain Expansion and Ecosystem Restoration Project and Hidden Valley Ranch Mitigation Project H H H H L L M H N/A H H HEmergency Response Plan – Debris Management M M M H L L L N/A M H H HIntegrated Levee Vegetation Management – Flood Maintenance and Habitat H H H M N/A N/A H H N/A L M HLa Grange Floodplain Restoration and Spawning Gravel Augmentation H M M M L L N/A H N/A M H HRD 2031 Resilience H M M H L L M N/A M M M HRD 2063 Resilience H M M H L L M N/A M M M HRD 2091 Resilience H M M H L L M N/A M M H HThree Amigos (also known as the Non structural Alternative at the San Joaquin River National Wildlife Refuge) H H H H L L M H L H H HWSID Fish Screen and Change in Point of Diversion Project M H H M N/A L M H M H M MWestside Creeks On Farm Multi Benefit Program H M M H L L L M M L H HMedium priorityBlack Gulch Storm Drainage Study* M M M H L L N/A N/A N/A N/A M MGomes Lake / Harding Drain Improvements M M M M L L M N/A N/A N/A M HHydraulic and Channel Migration Studies* M M M M L L M N/A N/A N/A M HLittle Salado Creek M H H M L L N/A N/A N/A M M HPatterson WWTP – Reduce Flood Risks* M M M H L L N/A N/A N/A L M MRD 1602 Resilience H M M L L L M N/A M M L HRD 2101 Resilience H M M L L L M N/A M M L HReducing Sediment Loading into the San Joaquin River from Westside Agricultural Lands H H H L L L L N/A N/A M L HRiverfront Park Project H M M M L L N/A H N/A M L HSalado Creek Flood Management Project M M M M L L N/A N/A N/A N/A M MSediment Management Investigation* H M M M N/A N/A L L N/A N/A H HStorm Drainage Enhancements along Salado Creek M M M M L L N/A N/A N/A M M MTuolumne River Regional Parkway H M M L L L N/A H N/A M M M
H = High; valued as 3 pointsM = Medium; valued as 2 pointsL = Low; valued as 1 pointN/A = Not Applicable; valued as 0 point* Indicates a project that is primarily or entirely a study.NOTE: See Appendix F for more detail.

Mid San Joaquin River RFMP
8 6 8. Regional Priorities
This page intentionally left blank

9. Regional Financial Plan 9 1
9. Regional Financial Plan
9 .1 In t roduct ion This chapter is meant to provide a high level overview of the capacity of the region to fund the projectsidentified in the RFMP and to identify deficiencies in funding. To provide this overview, the chapter beginswith a summary of the financial challenges in the region, followed by information on available Federal andState funding sources, as well as a discussion on local funding capacity and a summary of estimated costshares for the projects within the RFMP. Lastly, general findings and recommendations for future bondfunding are given. This section is based on Appendix H, Financial Plan Technical Memorandum, of thisdocument.
The cost share estimates provided in this chapter are based on the assumption that potential fundingsources will be available at the time a given project moves forward and that the project will receive anaward. Many of the Federal and State funding sources discussed in the chapter are competitive in natureand have limited available funding so an award is not guaranteed even if all criteria is met. Additionally,the estimated provided herein are intended for planning purposes only. A specific financial plan will benecessary for each project if/when it moves forward.
9.2 Methodo logy and
Assumpt ions The methodologies and assumptions used for the information in this chapter are described below.

Mid San Joaquin River RFMP
9 2 9. Regional Financial Plan
9.2.1 Methodology
The following steps were taken to obtain the data within this report:
Project Review
o Project descriptions were reviewed to identify key elements of the project, such aslocation (urban vs. rural, San Joaquin River vs. Tuolumne River, etc.) and main objective(restoration, flood management, etc.).
o Project Costs were estimated from a number of sources, including existing studies andinformation from project stakeholders.
For PL 84 99 projects lacking existing data, a unit cost of $2 million per mile ofunacceptable levee was used to estimate a costs.
Potential Funding Source Research and Review
o Potential Funding Sources within the region were researched to determine how muchfunding was available in each funding source, what type of cost share was offered, andwhat types of projects were eligible.
Project and Cost Share Matching
o Once key elements of both projects and funding sources were identified, they were usedto match projects to funding sources that they met the criteria for.
Application of Cost Share Information to Project Cost Data
o Once projects were matched with their Potential Funding Sources, the cost sharepercentages from the funding sources were applied to the project cost to get a cost share(in dollars) at the Federal, State, and Local level. The assumptions made during thisprocess are described below.
Local Assessment Analysis
o An analysis of potential local assessments was performed by separating the region intoland use types and applying the average assessment rates of each land use type. Details ofthe analysis can be found in the Financial Plan Technical Memorandum, attached asAppendix H of this document, under the Local Funding Source section.
9.2.2 Assumptions
The following assumptions were made to estimate cost shares for each project:
When projects matched with multiple funding sources, the lowest cost share percentage was usedin order to obtain the most conservative cost share estimate.
When projects had a cost range, the highest cost was used to obtain the most conservativeestimate of cost share.
DWR programs were assumed to have a 50% 90% cost share range per the DWR’s “Guidelines forEstablishing Local Agency Cost Sharing Formulas for Select Flood Programs and Projects” (2010)unless it was otherwise stated in the grant guidelines.
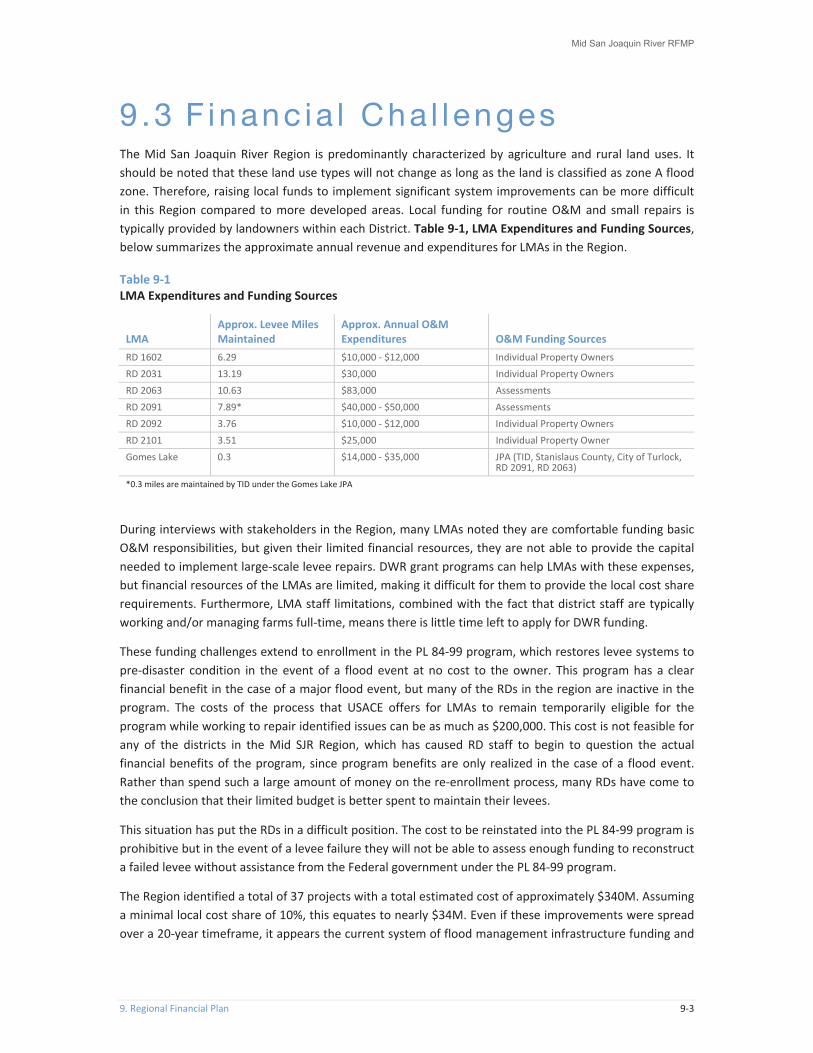
Mid San Joaquin River RFMP
9. Regional Financial Plan 9 3
9.3 F inanc ia l Cha l lenges The Mid San Joaquin River Region is predominantly characterized by agriculture and rural land uses. Itshould be noted that these land use types will not change as long as the land is classified as zone A floodzone. Therefore, raising local funds to implement significant system improvements can be more difficultin this Region compared to more developed areas. Local funding for routine O&M and small repairs istypically provided by landowners within each District. Table 9 1, LMA Expenditures and Funding Sources,below summarizes the approximate annual revenue and expenditures for LMAs in the Region.
Table 9 1LMA Expenditures and Funding Sources
LMAApprox. Levee MilesMaintained
Approx. Annual O&MExpenditures O&M Funding Sources
RD 1602 6.29 $10,000 $12,000 Individual Property OwnersRD 2031 13.19 $30,000 Individual Property OwnersRD 2063 10.63 $83,000 AssessmentsRD 2091 7.89* $40,000 $50,000 AssessmentsRD 2092 3.76 $10,000 $12,000 Individual Property OwnersRD 2101 3.51 $25,000 Individual Property OwnerGomes Lake 0.3 $14,000 $35,000 JPA (TID, Stanislaus County, City of Turlock,
RD 2091, RD 2063)*0.3 miles are maintained by TID under the Gomes Lake JPA
During interviews with stakeholders in the Region, many LMAs noted they are comfortable funding basicO&M responsibilities, but given their limited financial resources, they are not able to provide the capitalneeded to implement large scale levee repairs. DWR grant programs can help LMAs with these expenses,but financial resources of the LMAs are limited, making it difficult for them to provide the local cost sharerequirements. Furthermore, LMA staff limitations, combined with the fact that district staff are typicallyworking and/or managing farms full time, means there is little time left to apply for DWR funding.
These funding challenges extend to enrollment in the PL 84 99 program, which restores levee systems topre disaster condition in the event of a flood event at no cost to the owner. This program has a clearfinancial benefit in the case of a major flood event, but many of the RDs in the region are inactive in theprogram. The costs of the process that USACE offers for LMAs to remain temporarily eligible for theprogram while working to repair identified issues can be as much as $200,000. This cost is not feasible forany of the districts in the Mid SJR Region, which has caused RD staff to begin to question the actualfinancial benefits of the program, since program benefits are only realized in the case of a flood event.Rather than spend such a large amount of money on the re enrollment process, many RDs have come tothe conclusion that their limited budget is better spent to maintain their levees.
This situation has put the RDs in a difficult position. The cost to be reinstated into the PL 84 99 program isprohibitive but in the event of a levee failure they will not be able to assess enough funding to reconstructa failed levee without assistance from the Federal government under the PL 84 99 program.
The Region identified a total of 37 projects with a total estimated cost of approximately $340M. Assuminga minimal local cost share of 10%, this equates to nearly $34M. Even if these improvements were spreadover a 20 year timeframe, it appears the current system of flood management infrastructure funding and

Mid San Joaquin River RFMP
9 4 9. Regional Financial Plan
implementation may be unsustainable unless other benefits can be provided for other uses or even otherregions.
9 .4 Ava i l ab le Fund ing Sources This section provides an overview of some of the funding sources available in the region. Due to thechanging nature of funding sources, this list is not intended to detail every funding source available, butinstead includes the most common funding sources in the Region. This section describes funding sourcesat the Federal and State level, separated into conservation, structural, and non structural programs. Thetable below includes each funding source looked at within the financial plan, with a short description andthe associated cost share. For more detailed information on funding programs, see the Mid San JoaquinRFMP Financial Plan Technical Memorandum, attached as Appendix H of this document.
9.4.1 Federal Programs
Program Name Program Summary Cost ShareConservation Funding Sources
Agricultural Conservation EasementProgram (ACEP)
Provides financial and technical assistance to help conserveagricultural lands and wetlands and their related benefits
50% 75%
Anadromous Fish Restoration Program andAnadromous Fish Screen Program
Designed to protect, restore, and enhance fish, wildlife, andassociated habitats in the Central Valley
50%
Central Valley Project Improvement Act(CVPIA) – Habitat Restoration Program andConservation Program
Highly integrated efforts to restore and protect species andhabitats impacted by the CVP.
Not Required
Endangered Species Act Section 6 GrantProgram
Provides grants to states and territories to participate in awide array of voluntary conservation projects for candidate,proposed, and listed species.
75% 90%
Environmental Quality Incentives Program(EQIP)
Provides assistance to agricultural producers in order toaddress natural resource concerns and deliver environmentalbenefits.
50%
Land and Water Conservation Fund Provides matching grants to States and local governments forthe acquisition and development of public outdoor recreationareas and facilities.
50%
North American Wetlands Conservation Act(NAWCA)
Provides matching grants to carry out wetlands conservationprojects.
50%
Structural Flood Management Funding Sources
Flood Mitigation Assistance (FMA) Provides funding to assist in efforts to reduce or eliminate therisk of repetitive flood damage to buildings and structuresinsurable under the National Flood Insurance Program (NFIP).
75% 100%
Pre Disaster Mitigation (PDM) Designed to help implement a sustained pre disaster naturalhazard mitigation program to reduce overall risk to thepopulation and structures from future hazard events, whilealso reducing reliance on Federal funding from futuredisasters.
75% 90%
USACE Funding Cost sharing with USACE on SPFC USACE studies and projects 50% 65%
Non Structural Flood Management Funding Sources
Emergency Watershed Protection Program– Floodplain Easement Option (EWP FPE)
Provides an alternative measure to traditional EWP recovery,where it is determined that acquiring an easement in lieu ofrecovery measures is the more economical and prudentapproach to reducing a threat to life or property.
Not Required

Mid San Joaquin River RFMP
9. Regional Financial Plan 9 5
9.4.2 State Programs
Program Name Program Summary Cost ShareConservation Funding Sources
California Riparian Habitat ConservationProgram (CRCHP)
Designed to protect, preserve, restore and enhance riparianhabitat throughout California 50% 90%
California River Parkways Program Competitive grant program for river parkways projects. 50% 90%
Central Valley Flood System ConservationFramework and Strategy
Funds planning and implementation of projects in support ofthe Central Valley Flood System Conservation Framework andthe Conservation Strategy.
50% 90%
Flood Corridor Program (FCP) Funds non structural flood risk reduction projects containingecosystem and/or agricultural land conservation components 50% 90%
Habitat Conservation Fund (HCF) Program
Provides funds to local entities to protect threatened species,to address wildlife corridors, to create trails, and to provide fornature interpretation programs which bring urban residentsinto park and wildlife areas
50%
Inland Wetlands Conservation Program Created to protect, restore, and enhance wetlands andassociated habitats. 50%
Urban Greening for SustainableCommunities Planning
Provides funds to assist entities in developing a master urbangreening plan that will ultimately result in projects to help theState meet its environmental goals and the creation of healthycommunities.
Not Req.
Urban Greening for SustainableCommunities Project
Provides funds to preserve, enhance, increase or establishcommunity green areas such as urban forests, open spaces,wetlands and community spaces (e.g., community gardens).
Not Req.
Urban Streams Restoration Program
Provides grants for stream restoration projects that reduceflooding or erosion and associated property damages; restore,enhance, or protect the natural environment; and promotecommunity involvement, education, and stewardship in urbanstreams.
Not Req.
Structural Flood Management Funding Sources
Flood System Repair Project (FSRP)Designed to evaluate (feasibility), design, and construct repairson non urban SPFC facility (levees, channels, structures, etc.)deficiencies.
50% 90%
Integrated Regional Water Management(IRWM)
Grant funds for development and revisions of IRWM Plans, andimplementation of projects in IRWM Plans. 50% 75%
Local Levee Assistance Program (LLAP)
Designed for projects to immediately repair and improvecritically damaged local levees, evaluate levee stability andlevee seepage and underseepage, and to perform design oralternatives analysis.
50% 90%
Small Community Flood Risk Reduction(SCFRR)
Designed to help implement projects to reduce flood risk insmall, rural, and agricultural communities in the Central Valley. 50% 90%
Storm Water Flood Management Program Designed to help fund storm water management projects thatreduce flood damage and provide multi benefits. 50% 75%
Systemwide Flood Risk Reduction (SWFRR) Designed to help implement recommendations of the Basinwide feasibility studies. 50% 90%
Urban Flood Risk Reduction (UFRR) Designed to help improve urban SPFC levees within the CentralValley to a 200 year level of protection. 50% 90%
Non Structural Flood Management Funding Sources
Flood Emergency Response – ForecastCoordinate Operations (F CO)
Designed to further participation of reservoir operators(affecting the Central Valley) in the F CO program. 50% 90%
Flood Emergency Response StatewideEmergency Response Grants
Designed to provide support for local EAPs or related floodpreparedness and response activities. 50% 90%
Watershed and EnvironmentalImprovement Program
Designed to proactively manage, protect and restoreenvironmental resources affected by SPUFC systemoperations.
Not Req.

Mid San Joaquin River RFMP
9 6 9. Regional Financial Plan
9.4.3 Local Funding Sources
The following sections detail potential sources of funding for the local cost share that is required by manyFederal and State grant programs.
Proposition 218 Assessments
An analysis of potential local assessments was performed by separating the Region into land use typesand applying the average assessment rates of each land use type. Details of the analysis can be found inthe Financial Plan Technical Memorandum, attached as Appendix H of this document, under the LocalFunding Source section.
Table 9 2, Assessment Analysis shows the details of the results of the assessment analysis.
Table 9 2Assessment Analysis
Benefit AreaDistrict WithinBenefit Area
HypotheticalAssessmentPotential
Total CurrentAssessments
Hypothetical NetAssessmentPotential
1 1602 $20,778 $12,000 $8,7782 2031 $70,461 $30,000 $40,4613 2063 $81,864 $56,000 $25,8644 2091 $50,298 $50,000 $2985 2101 $8,075 $25,000 $0*
Total $75,400*If current assessments were found to be greater than assessment potential, net assessment potential was found to be 0.
Calculating future funding potential using the hypothetical net yearly assessment potential of $75,400,and assuming a 4% interest rate compounded annually over a 30 year period, it was found that the regioncould possibly raise $1.3 million over the next 30 years, in present day dollars.
It should be noted that RD 2063 is currently spending $83,000 per year on O&M responsibilities and isonly assessing $56,000 per year. Even if the district assessed up to its hypothetical assessment potentialof $81,864 it would not assess enough to meet the current demand. This situation is not sustainable.Since RD 2091 and the Gomes Lake Facilities both depend on RD 2063 for protection, a solution involvingfunds from these areas could be feasible and should be explored in more detail.
City Governments
The cities of Modesto, Patterson, and Newman are not within the boundaries of the Mid SJR Region asdefined by DWR, but are important urban centers to the Mid SJR Region planning area, have a flood nexusto the Region, and have projects identified in the RFMP effort. Furthermore, the City of Modesto is a keyproperty owner in RD 2091 and the City of Turlock is a beneficiary in the Gomes Lake Facility within RD2091. Discussions with city staff indicate that there is no existing budget available for flood managementprojects, and that any contribution would have to come from the City’s general fund. These funds arealready committed in many cases, thus, any contribution from them would be difficult to obtain.

Mid San Joaquin River RFMP
9. Regional Financial Plan 9 7
Stanislaus County
Discussions with County staff found that there is little to no allowance in the existing budget for floodmanagement, with the exceptions of funding for Office of Emergency Service (OES) and funding for theGomes Lake facility in RD 2091. With this being the case, any contribution from the County would likelyhave to come from their general fund. With so many demands already on the general fund it will be achallenge to divert any additional funds to go toward fulfilling the local cost share for flood managementprojects. Therefore, County contributions to the local cost share of projects should not be expected.
NGO Funding in the Region
Funding from NGOs in the region is one possible way to raise the local cost share that projects willrequire. Below are some NGOs with funding programs that could possibly contribute to the required localcost share for projects.
California Water Foundation
The California Water Foundation (CWF), an initiative of Resources Legacy Fund (RLF), awards grants in ourthree principal program areas – Increasing Water Use Efficiency, Improving Groundwater Management,and Restoring River Systems – as well as the overarching program area of Advancing Integrated WaterManagement.
http://www.californiawaterfoundation.org/
National Fish and Wildlife Foundation
NFWF supports conservation efforts in all 50 states, U.S. territories and abroad. Grants are made througha competitive process and awarded to some of the nation’s largest environmental organizations, as wellas some of the smallest. NFWF specializes in bringing all parties to the table – individuals, governmentagencies, nonprofit organizations and corporations in order to protect and restore imperiled species,promote healthy oceans and estuaries, improve working landscapes for wildlife, advance sustainablefisheries and conserve water for wildlife and people.
http://nfwf.org/Pages/default.aspx
Stanislaus Community Foundation
Stanislaus Community Foundation supports high impact opportunities within Stanislaus County. Workingin partnership with local agencies, the foundation brings funding and resources to the community forgrants and scholarships.
http://www.stanislauscommunityfoundation.org/
Trust for Public Land
The Trust for Public Land (TPL) helps communities to raise funds for conservation, conduct conservationresearch and planning, acquire and protect land, and design and renovate parks, gardens, andplaygrounds. The TPL does this by helping state and local governments design, pass, and implementlegislation and ballot measures that create new public funds.
https://www.tpl.org/

Mid San Joaquin River RFMP
9 8 9. Regional Financial Plan
9.5 Pro jec t Cost Share The following tables show estimated cost shares for each project identified by the RFMP effort. The costshares in the tables represent conservative estimates from the funding sources that each project wasmatched with. For more information on how projects were matched with funding sources and a detailedlist of what funding programs were matched with each project, please see the Mid San Joaquin RFMPFinancial Plan Technical Memorandum (Appendix H).
For the following tables projects have been broken into two categories: Projects within the Mid SanJoaquin Boundary and Projects Outside of the San Joaquin Boundary. The information in these tables ismeant to give a planning level estimate of what the Federal, State, and Local cost shares might look likefor each project, and to get a total regional cost for each cost share type, in order to provide insight intothe amount of future bond funding that may be needed.
9 .6 F ind ings The total costs for all projects identified within the Mid SJR Region planning area for this RFMP effort is onthe order of $340 million dollars. Below these projects are discussed in two sections: projects within theMid SJR Region and those outside the Region but within the planning area.
The total estimated cost of all identified projects within the Mid SJR Region is approximately $219 million.Based on the assumed cost share for each project (see Appendix H) this equates to an estimated Federalcost share of $ 135 million, a State cost share of $42 to $71 million, and local funding in the amount of$13 million to $42 million.
According to the assessment analysis, the districts within the Mid SJR Region could hypothetically raiselocal cost share funds in the range of $1.3 million over the next 30 years. Subtracting that amount fromthe total required local cost share for all projects within the Mid SJR Region leaves a total of $12 million to$41 million of local cost share deficit. With this amount of local cost share deficit it is clear that the Regionwill need assistance from sources other than assessments.
Projects that are located outside of the Mid SJR Region, but within the Mid SJR Region planning areatotaled approximately $120 million. State cost share for these projects is in the range of $29 million to$54 million, leaving a local cost share range of $6 million to $30 million.
An assessment analysis of the regions outside the boundaries of the Region was not within the scope ofthis report, but due to the urban nature of many of the areas which these projects are located, it can beassumed that the assessment potential in a successful proposition 218 election would be much largerthan that of the rural districts within the boundaries of the Mid SJR Region.

Mid San Joaquin River RFMP
9. Regional Financial Plan 9 9
Projects Within the Mid San Joaquin Region Boundary
Project
Cost Share (%)
ProjectTotal
Project Cost
Cost Share ($)
FederalCost
Share (%)
State CostShare Range (%)
Local CostShare Range (%)
Federal CostShare
Non FederalProject Cost
State CostShare Range
Local CostShare Range Local Cost Share Source
Low High Low High Low High Low High
PrivateLand
OwnersLocal
GovernmentNon ProfitOrganization
Consolidation of O&M 0% 50% 90% 10% 50% Consolidation of O&M $200,000 $0 $200,000 $100,000 $180,000 $20,000 $100,000 X
Dos Rios Ranch Floodplain Expansion andEcosystem Restoration Project and HiddenValley Ranch Mitigation Project
50% 50% 90% 10% 50%Dos Rios Ranch Floodplain Expansion andEcosystem Restoration Project and HiddenValley Ranch Mitigation Project
$8,000,000 $4,000,000 $4,000,000 $2,000,000 $3,600,000 $400,000 $2,000,000X
Emergency Response Plan DebrisManagement
0% 50% 90% 10% 50%Emergency Response Plan DebrisManagement
$110,000 $0 $110,000 $55,000 $99,000 $11,000 $55,000X
Emergency Response Plan Local Planning andTraining
0% 50% 90% 10% 50%Emergency Response Plan Local Planningand Training
$110,000 $0 $110,000 $55,000 $99,000 $11,000 $55,000X
Flood Risk Education 50% 50% 90% 10% 50% Flood Risk Education $30,000 $15,000 $15,000 $7,500 $13,500 $1,500 $7,500 X
Gomes Lake / Harding Drain Improvements 75% 50% 90% 10% 50% Gomes Lake / Harding Drain Improvements $1,700,000 $1,275,000 $425,000 $212,500 $382,500 $42,500 $212,500 X
Hydraulic and Channel Migration Studies 0% 50% 75% 25% 50% Hydraulic and Channel Migration Studies $200,000 $0 $200,000 $100,000 $150,000 $50,000 $100,000 X
Integrated Levee Vegetation ManagementFlood Maintenance and Habitat
75% 50% 90% 10% 50%Integrated Levee Vegetation ManagementFlood Maintenance and Habitat
$6,400,000 $4,800,000 $1,600,000 $800,000 $1,440,000 $160,000 $800,000X
Modesto WWTP Reduce Flood Risk 75% 50% 90% 10% 50% Modesto WWTP Reduce Flood Risk $80,000,000 $60,000,000 $20,000,000 $10,000,000 $18,000,000 $2,000,000 $10,000,000 X
Reclamation District 1602 Resilience 75% 50% 90% 10% 50% Reclamation District 1602 Resilience $4,700,000 $3,525,000 $1,175,000 $587,500 $1,057,500 $117,500 $587,500 X
Reclamation District 2031 Resilience 75% 50% 90% 10% 50% Reclamation District 2031 Resilience $2,000,000 $1,500,000 $500,000 $250,000 $450,000 $50,000 $250,000 X
Reclamation District 2063 Resilience 75% 50% 90% 10% 50% Reclamation District 2063 Resilience $3,500,000 $2,625,000 $875,000 $437,500 $787,500 $87,500 $437,500 X
Reclamation District 2091 Resilience 75% 50% 90% 10% 50% Reclamation District 2091 Resilience $400,000 $300,000 $100,000 $50,000 $90,000 $10,000 $50,000 X
Reclamation District 2101 Resilience 75% 50% 90% 10% 50% Reclamation District 2101 Resilience $2,500,000 $1,875,000 $625,000 $312,500 $562,500 $62,500 $312,500 X
Reducing Sediment Loading into San JoaquinRiver from Westside Agricultural Lands
50% 50% 75% 25% 50%Reducing Sediment Loading into San JoaquinRiver from Westside Agricultural Lands
$65,000,000 $32,500,000 $32,500,000 $16,250,000 $24,375,000 $8,125,000 $16,250,000X
Regional Maintenance Technical Support 0% 50% 90% 10% 50% Regional Maintenance Technical Support $100,000 $0 $100,000 $50,000 $90,000 $10,000 $50,000 X
Sediment Management Investigation 0% 50% 90% 10% 50% Sediment Management Investigation $250,000 $0 $250,000 $125,000 $225,000 $25,000 $125,000 X
Three Amigos (also known as the Nonstructural Alternative at the San Joaquin RiverNational Wildlife Refuge)
50% 50% 90% 10% 50%Three Amigos (also known as the Nonstructural Alternative at the San JoaquinRiver National Wildlife Refuge)
$5,500,000 $2,750,000 $2,750,000 $1,375,000 $2,475,000 $275,000 $1,375,000X
Westside Creeks On Farm Multi BenefitProgram
50% 50% 90% 10% 50%Westside Creeks On Farm Multi BenefitProgram
$75,000 $37,500 $37,500 $18,750 $33,750 $3,750 $18,750X
WSID Fish Screen Project 50% 50% 90% 10% 50% WSID Fish Screen Project $38,000,000 $19,000,000 $19,000,000 $9,500,000 $17,100,000 $1,900,000 $9,500,000 X
Totals $218,775,000 $134,202,500 $84,572,500 $42,286,250 $71,210,250 $13,362,250 $42,286,250

Mid San Joaquin River RFMP
9 10 9. Regional Financial Plan
Projects Outside of the Mid San Joaquin Region Boundary
Project
Cost Share (%) Cost Share ($)
Federal CostShare (%)
State Cost Share Range (%) Local Cost Share Range (%)
Total ProjectCost
Federal CostShare
Non FederalProject Cost
State CostShare Range
Local CostShare Range Local Cost Share Source
Low High Low High Low High Low HighPrivate LandOwners
LocalGovernment
Non ProfitOrganization
Black Gulch Drainage Study 0% 50% 75% 25% 50% $28,000 $0 $28,000 $14,000 $21,000 $7,000 $14,000 X
City of Newman/ Bureau of Reclamation FloodLevee Rehabilitation
75% 50% 90% 10% 50% $225,000 $168,750 $56,250 $28,125 $50,625 $5,625 $28,125X
Dennet Dam Removal 50% 50% 90% 10% 50% $700,000 $350,000 $350,000 $175,000 $315,000 $35,000 $175,000 X
Dry Creek Watershed Detention ReconnaissanceStudy
50% 50% 90% 10% 50% $250,000 $125,000 $125,000 $62,500 $112,500 $12,500 $62,500X
La Grange Floodplain Restoration and SpawningGravel Augmentation
50% 50% 90% 10% 50% $1,500,000 $750,000 $750,000 $375,000 $675,000 $75,000 $375,000X
Little Salado Creek 50% 50% 90% 10% 50% $5,000,000 $2,500,000 $2,500,000 $1,250,000 $2,250,000 $250,000 $1,250,000 X
Orestimba Creek Flood Management Project 50% 50% 90% 10% 50% $44,000,000 $22,000,000 $22,000,000 $11,000,000 $19,800,000 $2,200,000 $11,000,000 X
Patterson WWTP Reduce Flood Risk 75% 50% 90% 10% 50% $27,000 $20,250 $6,750 $3,375 $6,075 $675 $3,375 X
Riverfront Park Project 50% 50% 90% 10% 50% $2,500,000 $1,250,000 $1,250,000 $625,000 $1,125,000 $125,000 $625,000 X
Salado Creek Flood Management Project 50% 50% 75% 25% 50% $600,000 $300,000 $300,000 $150,000 $225,000 $75,000 $150,000 X
SB5 Compliance City of Modesto 75% 50% 90% 10% 50% $130,000 $97,500 $32,500 $16,250 $29,250 $3,250 $16,250 X
SB5 Compliance City of Newman 75% 50% 90% 10% 50% $125,000 $93,750 $31,250 $15,625 $28,125 $3,125 $15,625 X
SB5 Compliance City of Patterson 75% 50% 90% 10% 50% $205,000 $153,750 $51,250 $25,625 $46,125 $5,125 $25,625 X
Storm Drainage Enhancements along SaladoCreek
75% 50% 90% 10% 50% $880,000 $660,000 $220,000 $110,000 $198,000 $22,000 $110,000X
Tuolumne River Flood Management FeasibilityStudy
50% 50% 75% 25% 50% $3,000,000 $1,500,000 $1,500,000 $750,000 $1,125,000 $375,000 $750,000X
Tuolumne River Regional Park – CarpenterRoad/West Modesto Flood Management andPark Development
50% 50% 90% 10% 50% $750,000 $375,000 $375,000 $187,500 $337,500 $37,500 $187,500X
Tuolumne River Regional Parkway 50% 50% 90% 10% 50% $60,000,000 $30,000,000 $30,000,000 $15,000,000 $27,000,000 $3,000,000 $15,000,000 X
Totals $119,920,000 $60,344,000 $59,576,000 $29,788,000 $53,344,200 $6,231,800 $29,788,000
Mid San Joaquin River RFMP
9. Regional Financial Plan 9 11
9.7 Recommendat ions fo r
Fu tu re Bond Fund ing Due to the Mid San Joaquin Region’s lack of local funding potential, the recommendation of the RFMPteam is that the State to make higher cost shares available for projects in the region. These higher costshares will be necessary in order to accomplish many of the projects identified by the RFMP effort. TheRFMP team identified two ways of making these higher State cost shares possible. The first is for the Stateto revisit its grant guidelines, with special consideration to the local ability to pay provisions. This couldallow projects that are unable to pay the local cost share the chance to be funded. The second is for theState to consider increasing its contributions for projects that have major ecosystem benefits due to thepublic benefit such projects provide. Since many of the projects in the Mid San Joaquin Region containrestoration elements this could help make up for the lack of local funding potential.

Mid San Joaquin River RFMP
9 12 9. Regional Financial Plan
This page intentionally left blank

10. Outlook for the Future 10-1
10. Outlook for the Future In this section, the Mid San Joaquin River’s current flood setting is broadly characterized and theexpectations for the future within the current planning horizon are described.
10 .1 P lann ing Area in 2014 Stanislaus County, together with the portions of theMid SJR Region withinMerced and San Joaquin Counties, isestimated to include nearly 78,000 acres with a 1% chance of flood inundation each year. Most of these landsare in agricultural production, with an additional portion dedicated to habitat and open space. A total of 11,063people reside within these floodplain lands, with 2,129 people residing within floodplain lands included in theMid SJR Region’s LMAs. The highest concentration of assets within the floodplains of the planning area occursalong the Tuolumne River in and near the City of Modesto. The wastewater treatment plant serving the city ofPatterson is located within the floodplains of the planning area, while one of the two plants serving the city ofModesto is located within RD 2091 of theMid SJR Region.
At this time, the apparent level of Emergency Response preparedness to address flood hazards within the MidSJR Region is relatively low. Flood fighting within the Region is conducted on an ad hoc basis, with heavyreliance on the experience of landowners and lacking both written plans and mutual aid agreements. Theplanning area appears to have a somewhat higher level of preparedness for responding to emergencies ingeneral, but little flood specific focus. Additionally, little coordination or planning with respect to EmergencyResponse appears to occur between the LMAs of the Region and the rest of the planning area.
The project levees within the Mid SJR Region are thought to provide sufficient hydraulic capacity to passapproximately a 25 to 50 year flood event. However, all of the LMAs have levees identified as havingsignificant seepage risk, which could cause levee failures and flooding in much smaller events. DWR hasestimated the annual probability of flooding behind the project levees in the Region as ranging frommore than4% (flooding in less than a 25 year event) up to 2% (flooding in a 50 year event) (DWR, 2012a).

Mid San Joaquin River RFMP
10-2 10. Outlook for the Future
Of the nine LMAs within the Mid SJR Region, four (RD 2099, RD 2100, RD 2102, RD 2092) are transitioning theirlevees out of the State Plan of Flood Control as land uses shift towards habitat and away from agriculturalproduction, a change designed to reduce flood risk while providing ecosystem benefits. The remaining fiveLMAs are currently all “Inactive” under PL 84 99, rendering them ineligible to receive assistance in the form ofpost flood repairs. RD 1602 and RD 2031 lack elected Boards of Directors. All of the RDs experience challengesin conducting operations and maintenance to the satisfaction of either the USACE, DWR, or both. Two of theLMAs, RD 2101 and RD 2063, have major erosion sites on their levees. Based on the financial analysisconducted for the RFMP, neither of these RDs appears to be financially sustainable, in part due to the cost ofthe local share needed for erosion repairs.
10.2 P lann ing Area in 2040+ The flood management systems and floodplains of the Mid SJR planning area will be changing dramatically inthe decades to come.
The following description is an educated guess about what that future will look like—a projection based onexpert judgment and available information from the Regional FloodManagement Planning process.
Several land use changes are expected to lead to reduced flood risks in selected areas. The RDs of the SJRNWRand RD 2092 (Dos Rios/Hidden Valley Ranch) are both expected to have completed their transition out of theState Plan of Flood Control. The lands within their boundaries will have shifted to being managed for habitatpurposes, and flood risk therefore will decline as a result. Two to three of the remaining five RDs areanticipated to have also ceased to operate as part of the State Plan of Flood Control as a result of financial oroperational challenges, though their land use may continue as agricultural production or shift to habitat,recreation, or some mix of those uses. Depending on the land use, flood risks in these areas may decline aswell. Given DWR’s anticipated need for habitat mitigation for their flood projects, it seems likely that someportion of these lands will be acquired for habitat purposes through purchase as easements or in fee title. Theeffects of SB 5 on new development are anticipated to significantly slow the rate of increase in flood risk thatmight otherwise occur in the cities of Modesto, Patterson, and Newman.
Investments in Emergency Response, which are expected to be relatively easy to fund, are anticipated to leadtomajor improvements in flood fight and public safety operations coordination, planning, and effectiveness.
For the RDs that continue to manage levees as part of the State Plan of Flood Control, some changes areanticipated. Consistency between DWR and USACE maintenance requirements seems likely. Operations andmaintenance may be consolidated for all or some of the RDs if the proposed exploration of this concept ispromising and a successful pilot implementation follows. While regulatory constraints on operations andmaintenance activities will continue, additional support for conducting these activities, through guidance or astreamlined permitting program, may exist.
Limited funding for flood management, particularly at the local level, is expected to continue to constrainproject development and implementation. Nonetheless, a portion of the flood management studies proposedin this document is likely to have been completed, and some smaller flood management projects implemented.One or two large projects with a primary flood management purpose may also be implemented or in processby this point in time.
The scenario described above suggests the potential for a future Mid SJR planning area that has reduced floodrisk, despite an expected increase in population. It will require a concerted effort by the stakeholders of the

Mid San Joaquin River RFMP
10. Outlook for the Future 10-3
Mid SJR planning area to develop, build support for, and get funding for a multiplicity of flood managementprojects, as well as supporting land use management policies to restrict further development in the floodplainand changes in the operations of upstream reservoirs to reduce flood risk.
With consistent and persistent effort, this vision of the Mid SJR planning area’s improved flood future may beachieved—or even surpassed.

Mid San Joaquin River RFMP
10-4 10. Outlook for the Future
This page intentionally left blank

11. References 11 1
11. References Almond Board of California. 2013. 2013 Almond Almanac.
California Bond Accountability. 2014. Systemwide Flood Risk Reduction (SWFRR). FloodSAFE ImplementationPrograms Draft Table. January. http://bondaccountability.resources.ca.gov/plevel1.aspx?id=124&pid=5.
California Bond Accountability. 2010. Urban Flood Risk Reduction (UFRR).http://bondaccountability.resources.ca.gov/plevel1.aspx?id=99&pid=5.
California Data Exchange Center (CDEC). 2014a. Merced River Near Stevinson. http://cdec.water.ca.gov/rtables/MST.html. Accessed July 29, 2014.
_____. 2014b. Rating Table: San Joaquin River Near Newman. http://cdec.water.ca.gov/rtables/NEW.html.Accessed July 29, 2014.
_____. 2014c. Rating Table: San Joaquin River Near Vernalis. http://cdec.water.ca.gov/rtables/VNS.html.Accessed July 29, 2014.
_____. 2014d. Rating Table: Stanislaus R at Orange Blossom Bridge.http://cdec.water.ca.gov/rtables/OBB.html. Accessed July 29, 2014.
_____. 2014e. Rating Table: Tuolumne River atModesto. http://cdec.water.ca.gov/rtables/MOD.html.Accessed July 29, 2014.
California Department of Conservation (CDC). 2013. The California Land Conservation Act 2012 Status Report.October.
_____. 2014. California Farmland Conversion Report 2008 2010. April.
California Department of Finance (CDF), Performance Review Unit. 1997. Inventory of Flood ControlAgencies. November.
California Department of Parks and Recreation. 2013. Habitat Conservation Fund (HCF) Program.March 13. http://www.parks.ca.gov/?page_id=21361.

Mid San Joaquin River RFMP
11 2 11. References
California Department of Water Resources (DWR). 1997. Final Report of the Flood Emergency ActionTeam. June.
_____. 2003. California’s Groundwater, Bulletin 118, Update 2003. October.
_____. 2008. Urban Streams Restoration Program. August. http://www.water.ca.gov/urbanstreams/docs/guidelines.pdf.
_____. 2009. California Water Plan Update 2009, Volume 3, Regional Reports: San Joaquin River, Bulletin160 09.
_____. 2010. Flood Corridor Program (FCP). November.http://www.water.ca.gov/floodmgmt/fpo/sgb/fpcp/docs/Final_Flood_Corridor_Guidelines.pdf.http://www.water.ca.gov/floodmgmt/fpo/sgb/fpcp/funding_cycle.cfm.FloodSAFE Implementation Programs (January 2014) Draft Table.
_____. 2011a. Geotechnical Assessment Report, South NULE Study Area, Non Urban Levee EvaluationsProject, prepared by Kleinfelder. May.
_____. 2011b. Local Maintaining Agency Annual Report for Levees of the State Plan of Flood Control,California Water Code Sections 9140 9141.
_____. 2011c. Central Valley Flood Management Planning Program, Flood Control System Status Report.December.
_____. 2011d. Local Levee Assistance Program (LLAP). Guidelines for Providing Funding to Local PublicAgencies Under Proposition 84 of 2006. September.
_____. 2011e. Flood Emergency Response – Forecast Coordinate Operations (F CO). FloodSAFEImplementation Programs Draft Table. January. http://www.water.ca.gov/floodsafe/docs/FCO_Program_Grant_Guidelines.pdf.
_____. 2012a. Central Valley Flood Protection Plan. June.
_____. 2012b. Flood System Repair Project Field Data Sheets.
_____. 2012c. 2012 Inspection and Local Maintaining Agency Report of the Central Valley State federalFlood Protection System.
_____. 2012d. Central Valley Flood System Conservation Framework and Strategy. February 14.http://www.water.ca.gov/floodsafe/fessro/docs/flood11_guidelines.pdf.
_____. 2012e. Flood Emergency Response Statewide Emergency Response Grants. FloodSAFEImplementation Programs (January 2014) Draft Table. December. http://www.water.ca.gov/floodmgmt/hafoo/fob/floodER//122112_statewide_flood_er_guidelines_final.pdf.
_____. 2013a. Draft California’s Flood Future: Recommendations for Managing the State’s Flood Risk.April.
_____. 2013b. Mid San Joaquin River Regional Flood Atlas.
_____. 2013c. Integrated Water Resources Information System. www.water.ca.gov/iwris. AccessedJuly 6, 2013.
_____. 2013d. Flood System Repair Project (FSRP). FloodSAFE Implementation Programs Draft Table. June.http://www.water.ca.gov/floodmgmt/fmo/docs/FSRP Draft Guidelines 0221.2013.pdf.

Mid San Joaquin River RFMP
11. References 11 3
_____. 2014a. Guidelines 2014 IRWM Drought Solicitation Integrated Regional Water ManagementImplementation Grant Program Funded by Proposition 84. January 18.
_____. 2014b. StormWater Flood Management Program. June. http://www.water.ca.gov/irwm/grants/docs/Guidelines/P84_IRWM_GL_Drought2014_Final.pdf
California Emergency Management Agency (CEMA), California Natural Resources Agency, FederalEmergency Management Agency, California Energy Commission, California Polytechnic StateUniversity. 2012. California Adaptation Planning Guide, Understanding Regional Characteristics.July.
California Natural Resources Agency. 2002. Inland Wetland Conservation Program.http://ceres.ca.gov/wetlands/introduction/inland_easement.html. Accessed 03/11/2014.
_____. 2012. California River Parkways Program. October.http://resources.ca.gov/bonds_docs/P50_Grant_Guidelines_FINAL.pdf.
_____. 2012. Urban Greening for Sustainable Communities – Planning. October. http://resources.ca.gov/grant_programs.html#. http://resources.ca.gov/bond/Urban_Greening_PLANNING_Guidelines_October_2012.pdf.
_____. 2012. Urban Greening for Sustainable Communities – Project. October. http://resources.ca.gov/bond/Urban_Greening_PROJECT_Guidelines_October_2012.pdf.
Catalog of Federal Domestic Assistance. 2014. Anadromous Fish Restoration Program and AnadromousFish Screen Program. https://www.cfda.gov/index?s=program&mode=form&tab=core&id=200daf76afcc578965460cdc9537b261.
Central Valley Business Journal (CVBJ). 2013. Central Valley dairy industry remains shaky in economicrecovery. http://cvbj.biz/central valley dairy industry remains shaky in economic recovery/.Accessed November 4, 2013.
City of Modesto, prepared by Carollo Engineers (Modesto). 2007. Wastewater Treatment Master PlanUpdate. March.
_____. 2008. Wastewater Treatment Master Plan Supplement. September.
_____. 2011. City of Modesto, 2010 – 2015 Local Hazard Mitigation Plan. December 13.
City of Patterson. 2013. Water Operations Division website.www.ci.patterson.ca.us/Default.aspx?pi=84&ni=150. Accessed May 24, 2013.
Central Valley Business Journal (CVBJ). 2013. Central Valley dairy industry remains shaky in economicrecovery. http://cvbj.biz/central valley dairy industry remains shaky in economic recovery/.Accessed November 4, 2013.
CV SALTS. 2013. Welcome to LSJR. http://www.cvsalinity.org/index.php/lsjr.html. Accessed September 30,2013.
EDAW. 2001. Tuolumne River Regional Park Master Plan. Prepared for the Joint Powers Authority: City ofModesto, City of Ceres, Stanislaus County. December.
Eisenstein, William and Louise Mozingo. 2013. Valuing Central Valley Floodplains: A Framework forFloodplain Management Decisions. The Center for Resource Efficient Communities, University ofCalifornia, Berkeley. May 15. Available at: http://crec.berkeley.edu/valuing_floodplains.pdf.
Federal Emergency Management Agency (FEMA). 2008. Flood Insurance Study, Stanislaus County,California, and Incorporated Areas. September 26.

Mid San Joaquin River RFMP
11 4 11. References
_____. 2009. Flood Insurance Study, San Joaquin County, California and Incorporated Areas. October 16.
_____. 2013. Pre Disaster Mitigation Program FOA. July 12.
Hoover, M. B., H. E. Rensch, E. G. Rensch,W. N. Abeloe. 2002. Historic Spots in California. Revised by Douglas E.Kyle. Palo Alto, CA: Stanford University Press.
Krousky, Carolyn andMargaretWalls. 2013. Floodplain Conservation as a FloodMitigation Strategy, ExaminingCosts and Benefits. July, revised October.
Ignacio Lopez, retired Patterson Wastewater Treatment Plant Manager. Personal communication. July 11,2013.
Laura Anhalt, City of Modesto. Personal communication. September 26, 2013.
McBain and Trush. 2000. Habitat Restoration Plan for the Lower Tuolumne River Corridor, Final Report.March.
Merced County. 2013. Merced County website. http://www.co.merced.ca.us/. Accessed October 2, 2013.
Modesto Bee. 2014b. Stanislaus County supervisors accept groundwater recommendations, action plan. June10.
_____. 2014b. Stanislaus Orchards and Permanent CropsMultiply. March 1.
Modesto Irrigation District, 2014. A Water History, Modesto Irrigation District website.http://www.mid.org/water/default.jsp Accessed July 14, 2014.
National Park Service. 2013. Land and Water Conservation Fund. October 10.http://www.parks.ca.gov/pages/1008/files/lwcf%20application%20guide_%20final%20draft%2010.10.2013.pdf.
National Weather Service (NWS). 2013a. Advanced Hydrologic Prediction Services, San Joaquin River atVernalis. water.weather.gov/ahps2/hydrograph.php?wfo=sto&gage=vnsc1&view=1,1,1,1,1,1,1.Accessed June 19, 2013.
_____. 2013b. Advanced Hydrologic Prediction Services, San Joaquin River at Newman.water.weather.gov/ahps2/hydrograph.php?wfo=hnx&gage=nwmc1. Accessed June 19, 2013.
_____. 2013c. Advanced Hydrologic Prediction Services, Merced River at Stevinson. water.weather.gov/ahps2/hydrograph.php?wfo=hnx&gage=stvc1&view=1,1,1,1,1,1,1. Accessed June 19, 2013.
_____. 2013d. Advanced Hydrologic Prediction Services, Tuolumne River at Modesto. water.weather.gov/ahps2/hydrograph.php?wfo=sto&gage=mdsc1&view=1,1,1,1,1,1,1. Accessed June 19, 2013.
_____. 2013e. Advanced Hydrologic Prediction Services, Stanislaus River at Orange Blossom Road.water.weather.gov/ahps2/hydrograph.php?wfo=sto&gage=obbc1&view=1,1,1,1,1,1,1. AccessedJune 19, 2013.
Natural Resources Conservation Service. 2014. Environmental Quality Incentives Program (EQIP). March.
Patterson Public Works Department (Patterson). 2013. Floodplain Management.http://www.ci.patterson.ca.us/Default.aspx?pi=84&ni=150. Accessed June 19, 2013.
Peterson Brustad Engineers, Inc. (PBI). 2013. Flood Emergency Response Assessment Technical Report,Mid San Joaquin River Regional Flood Management Plan. June.

Mid San Joaquin River RFMP
11. References 11 5
Private Landowner Network (PLN). 2006. California Riparian Habitat Conservation Programhttp://www.privatelandownernetwork.org/yellowpages/resource.aspx?id=14402 Accessed03/11/2014
Red Lodge Clearinghouse. 2014. California Inland Wetlands Conservation Program.http://rlch.org/funding/california inland wetlands conservation program. Accessed 03/11/2014.
_____. 2014. California Riparian Habitat Conservation Program. http://rlch.org/funding/californiariparian habitat conservation program. Accessed 03/11/14.
River Partners. 2008. Effects of Long Duration Flooding on Riparian Plant Species in Restoration Plantings:San Joaquin River National Wildlife Refuge, Stanislaus County, California. March.
San Francisco Public Utilities Commission. 2013. Watershed and Environmental Improvement Program.December 11. http://www.sfwater.org/modules/showdocument.aspx?documentid=4628.
Seavy, Nathaniel E., Thomas Gardali, Gregory H. Golet, F. Thomas Griggs, Christine A. Howell, Rodd Kelsey,Stacy L. Small, Joshua H. Viers, and James F.Weigand. 2009.Why Climate ChangeMakes RiparianRestorationMore Important than Ever: Recommendations for Practice and Research. EcologicalRestoration. September.
Stanislaus Council of Governments (STANCOG). 2011. Regional Transportation Plan Environmental ImpactReport. April 2010.
Stanislaus County. 2010. Stanislaus County Multi Jurisdictional Hazard Mitigation Plan Updated 2010.
_____. 2011a. Stanislaus County Crop Report.
_____. 2011b. Stanislaus County General Plan, Agricultural Element. December 20.
_____. 2012. Stanislaus County Agricultural Crop Report 2012.
_____. 2013a. Orestimba Creek Flood Control District Committee Fact Sheet. May 15.
_____. 2013b. Preliminary Draft Groundwater Protection Ordinance #3.http://www.stanag.org/pdf/advisory board/draft ordinance aab 010410.pdf. Accessed July 6, 2013.
_____. 2013c. Stanislaus County Supervisorial Districts Map,www.stancounty.com/board/pdf/supervisoral districts map.pdf. Accessed June 3, 2013.
_____. 2013d. Water Advisory Committee Fact Sheet. December 17.
State of California Wildlife Conservation Board (WCB). 2013. California Riparian Habitat ConservationProgram. https://www.wcb.ca.gov/programs/riparian.aspx. Accessed 03/11/2014.
The Board of Supervisors of the County of Stanislaus (Stanislaus County). 2011. Action Agenda Summary,Approval of an Amendment to Extend the Expiration Date of the Interim Operations andMaintenance Agreement for the Gomes Lake Facility to July 31, 2011 with Stanislaus county,Turlock Irrigation District, City of Turlock, Reclamation Districts (RD) 2091 and 2063. July 7.
_____. 2013a. Stanislaus County Supervisorial Districts Map.www.stancounty.com/board/pdf/supervisoral districts map.pdf. Accessed June 3, 2013.
_____. 2013b. Orestimba Creek Flood Control District Committee Fact Sheet. May 15.
Turlock Irrigation District. 2014. Water, Turlock Irrigation District website. http://www.tid.org/waterAccessed July 14, 2014.

Mid San Joaquin River RFMP
11 6 11. References
United States Army Corps of Engineers (USACE). 1961. Supplement to Standard Operation andMaintenance Manual, Lower San Joaquin River and Tributaries Project, California, Unit No. 6, EastLevee of the San Joaquin River in Reclamation Districts No. 2063 and 2091.
_____. 1968a. Supplement to Standard Operation and Maintenance Manual, Lower San Joaquin River andTributaries Project, California, Unit No. 12, West Levee of San Joaquin River from Opposite Mouthof Tuolumne River Downstream to Stanislaus County Line within R. D. Nos. 2099, 2100, 2101 and2102.
_____. 1968b. Supplement to Standard Operation and Maintenance Manual, Lower San Joaquin River andTributaries Project, California, Unit No. 3, North Levee of Stanislaus River and East Levee of SanJoaquin River within R. D. Nos. 2064, 2075, 2094 and 2096.
_____. 1968c. Supplement to Standard Operation and Maintenance Manual, Lower San Joaquin River andTributaries Project, California, Unit No. 11, West Levee of San Joaquin river from Durham Bridge toParadise Dam within R.D. No. 2085 and R.D. No. 2095.
_____. 1968d. Supplement to Standard Operation and Maintenance Manual, Lower San Joaquin River andTributaries Project, California, Unit No. 4, East Levee of San Joaquin River within ReclamationDistrict No. 2031.
_____. 1997a. Phase III Basin Report, Final Levee Repairs, San Joaquin River Basin, Reclamation Districts2100 and 2102, Stanislaus County, California. June.
_____. 1997b. Phase III Project Information Report: Lower San Joaquin River Emergency Levee Repairs SJ14 Reclamation District 2092 Stanislaus County, California. June.
_____. 1999. Sacramento and San Joaquin River Basins, California Post Flood Assessment. March.
_____. 2000. Sacramento and San Joaquin River Basins Comprehensive Study, California: Geomorphic andSediment Baseline Evaluation of the San Joaquin River from the Delta to the Confluence with theMerced River and Major Tributaries. Prepared by Mussetter Engineering, Inc. and Jones & StokesAssociates, Inc. April.
_____. 2001a. Reclamation District 2092 Transfer: Correspondence of Michael J. Walsh to Peter D.Rabbon (The Reclamation Board). February.
_____. 2001b. Reclamation District 1602 Transfer: Correspondence of Michael J. Walsh to Peter D.Rabbon (The Reclamation Board). April.
_____. 2001c. Reclamation District 2063 Transfer: Correspondence of Michael J. Walsh to Peter D. Rabbon(The Reclamation Board). April.
_____. 2001d. Reclamation District 2091 Transfer: Correspondence of Michael J. Walsh to Peter D.Rabbon (The Reclamation Board). April.
_____. 2006. Project Information Report for Public Law 84 99 Levee Rehabilitation: Reclamation District1602. October.
_____. 2007. Project Information Report for Public Law 84 99 Levee Rehabilitation: Reclamation District2063. August.
_____. 2012. Orestimba Creek, West Stanislaus County, California, Draft Report for Public Review DraftInterim Feasibility Study, Draft EA/IS. December.
_____. Undated. Reclamation District 2101 Transfer: Correspondence of Michael J. Walsh to Peter D.Rabbon (The Reclamation Board).

Mid San Joaquin River RFMP
11. References 11 7
United States Bureau of Reclamation (USBR). 2013. About the CVP Conservation program and CVPIAHabitat Program. http://www.usbr.gov/mp/cvpcp/. Accessed 03/07/2014.
_____.2013. Central Valley Project Conservation Program and Central Valley Project Improvement ActHabitat Restoration Program. http://www.grants.gov/web/grants/viewopportunity.html?oppId=236611. Accessed 03/07/2014.
United States Census Bureau (US Census Bureau). 2013a. Census 2010. www.census.gov/2010census/popmap/ipmtext.php?fl=06. Accessed June 13, 2013.
_____. 2013b. Cities with 100,000 or More Population in 2000 ranked by Population.www.census.gov/statab/ccdb/cit1020r.txt. Accessed May 28, 2013.
United States Department of Agriculture (USDA) Natural Resource Conservation Service (NRCS). 2013.Agricultural Conservation Easement Program. http://www.nrcs.usda.gov/wps/portal/nrcs/detail/national/programs/easements/acep/?cid=stelprdb1242695. Accessed 04/02/2014.
_____. 2013. Emergency Watershed Protection Program Floodplain Easement (EWP FPE).http://www.nrcs.usda.gov/wps/portal/nrcs/detail/national/programs/easements/acep/?cid=stelprdb1242695. Accessed 04/02/2014
United States Department of Homeland Security (DHS) [FEMA/Risk Reduction Division]. 2012a. The FiscalYear 2013 Flood Mitigation Assistance (FMA) Grant Program.
_____. 2012b. The Fiscal Year 2013 Pre Disaster Mitigation (PDM) Grant Program.
United States Environmental Protection Agency (EPA). 2013. Dairy Manure Management in the SanJoaquin Valley. http://www.epa.gov/region9/ag/dairy/locations.html. Accessed September 23,2013.
United States Fish andWildlife Service (USFWS). 2002. The Economic Impact on Stanislaus County of PublicLand Acquisitions and Conservation Easements on Floodplain Lands Along the Lower Tuolumne and SanJoaquin Rivers. December.
_____. 2012. Proposed Expansion, San Joaquin River National Wildlife Refuge, Environmental Assessment,Land Protection Plan, and Conceptual Management Plan.
_____. 2014. North American Wetlands Conservation Act.http://www.fws.gov/birdhabitat/Grants/NAWCA/index.shtm. Accessed 06/2014.
_____. 2014. Endangered Species Act Section 6 Grant Program. http://www.fws.gov/endangered/esalibrary/pdf/FY%2014%20CESCF%20RFP%20Grant%20Announcement%20Standard%20Format.FINAL.pdf.
United States Geological Survey (USGS). 2013. USGS Station Statistics.http://water.usgs.gov/osw/streamstats/. Accessed September 10, 2013.
_____. 2012. National Hydrography Database.
United States Government (33 U.S.C. 701n) (69 Stat. 186). United States Code, 2006 Edition, Supplement4, Title 33, Navigation and Navigable Waters, Chapter 15, Flood Control, Section 701n, EmergencyResponse to Natural Disasters.
United States Government Printing Office. 1999. USACE Funding. August.http://www.gpo.gov/fdsys/pkg/PLAW 106publ53/pdf/PLAW 106publ53.pdf.
University of California. 1997.Waters recede, damage estimates soar. California Agriculture 51(1):4 5. DOI:10.3733. January February.

Mid San Joaquin River RFMP
11 8 11. References
URS and Stillwater Sciences. 2004.Merced River Corridor Restoration Plan, Phase IV: Dredger Tailings Reach,Technical Memorandum #2, Hydraulic Model of theMerced River Dredger Tailings Reach. April.

Mid San Joaquin River RFMP
11. References 11 9
This page intentionally left blank