mid-america earthquake centermae.cee.illinois.edu/publications/reports/report07-02.pdf ·...
TRANSCRIPT

1
Mid-America Earthquake CenterMid-America Earthquake Center

2
Mid-America Earthquake CenterMid-America Earthquake Center
TABLE OF CONTENTS LIST OF TABLES .........................................................................................................................................3 LIST OF FIGURES .......................................................................................................................................3 1. EXECUTIVE SUMMARY- NON-EXPERT............................................................................................5 2. EXECUTIVE SUMMARY-EXPERT......................................................................................................7 3. OVERVIEW OF THE EARTHQUAKE AND LOSSES.........................................................................9 4. SEISMOLOGICAL FEATURES.........................................................................................................12
4.1 TECTONIC SETTING ......................................................................................................................12 4.2 HISTORICAL SEISMICITY ...............................................................................................................13 4.3 MACRO-SEISMIC DATA AND FAULT MECHANISM.............................................................................15 4.4 SEISMOGRAPH RECORDINGS ........................................................................................................16 4.5 IMPLICATIONS ON EARTHQUAKE HAZARD.......................................................................................23
5. BUILT ENVIRONMENT LOSSES......................................................................................................25 5.1 RESIDENTIAL BUILDINGS...............................................................................................................25 5.2 COMMERCIAL BUILDINGS ..............................................................................................................26 5.3 EDUCATIONAL BUILDINGS .............................................................................................................29 5.4 PUBLIC BUILDINGS .......................................................................................................................32 5.5 BRIDGE STRUCTURES ..................................................................................................................33
6. GEOTECHNICAL EFFECTS .............................................................................................................36 6.1 LANDSLIDES.................................................................................................................................36 6.2 LIQUEFACTION .............................................................................................................................36 6.3 FOUNDATIONS .............................................................................................................................37
7. VOLCANIC ACTIVITY .......................................................................................................................38 7.1 HISTORICAL PERSPECTIVE............................................................................................................38 7.2 RECENT ERUPTION ......................................................................................................................39
8. HISTORICAL MONUMNETS AND HERITAGE ................................................................................41 8.1 PRAMBANA ..................................................................................................................................41 8.2 BOROBUDUR................................................................................................................................44
9. SOCIAL AND ECONOMIC CONSEQUENCES.................................................................................46 9.1 IMPACT ON EDUCATION ................................................................................................................46 9.2 IMPACT ON HEALTHCARE..............................................................................................................46 9.3 SOCIAL IMPLICATIONS ..................................................................................................................47 9.4 ECONOMIC IMPLICATIONS .............................................................................................................48
10. RECOMMENDATIONS..................................................................................................................49 11. ACKNOWLEGEMENTS ................................................................................................................51 12. REFERENCES...............................................................................................................................52 13. APPENDICES................................................................................................................................54
13.1 FIELD MISSION MEMBERS AND SPECIALIZATION...............................................................54 13.2 INDONESIAN HOST ORGANIZATIONS...................................................................................54 13.3 ITINERARY AND ROUTE..........................................................................................................55

3
Mid-America Earthquake CenterMid-America Earthquake Center
LIST OF TABLES Table 3.1 Source parameters from different sources ...................................................................................9 Table 3.2 Distribution of casualties by district (BAPPENAS, 2006)............................................................10 Table 3.3 Distribution of housing damage (BAPPENAS, 2006) .................................................................11 Table 4.1 Historical earthquakes in the Java region...................................................................................14 Table 4.2 Estimated fault rupture dimension ..............................................................................................16 Table 4.3 Conversion factors for measured data at YOGI station..............................................................18 Table 4.4 Soil class for each attenuation relationship ................................................................................21 Table 4.5 Prediction of PGA by attenuation relationships with various soil classes and fault types ..........22 Table 9.1 Summary of damage and losses in the education sector, Rp billion (BAPPENAS, 2006) .........46 Table 9.2 Summary of damage and losses in the health sector, Rp billion (BAPPENAS, 2006)...............47
LIST OF FIGURES Figure 3.1 General location map and epicenter............................................................................................9 Figure 4.1 Regional tectonic setting............................................................................................................12 Figure 4.2 Interplate and intraplate earthquake potential in Java...............................................................13 Figure 4.3 Historical earthquakes in the Java region.................................................................................14 Figure 4.4 Location of OPAK fault and epicenters by several institutions .................................................15 Figure 4.5 Damage intensities in villages from UNOSAT (red: severe) and presumed fault ....................15 Figure 4.6 Location of recording stations...................................................................................................16 Figure 4.7 Soil profile in Yogyakarta City (BMG) .......................................................................................16 Figure 4.8 Correction of data using Cubic Spline Interpolation .................................................................17 Figure 4.9 Vertical velocity data at station YOGI and BJI..........................................................................17 Figure 4.10 Acceleration at BJI (mean value)............................................................................................19 Figure 4.11 Acceleration at YOGI (mean value) ........................................................................................19 Figure 4.12 Elastic acceleration spectra (5% damping) considering uncertainty ......................................20 Figure 4.13 Acceleration spectra for mean value with various ductility levels and 1.0% damping............20 Figure 4.14 Comparison with seismic coefficient of design spectra by UBC 97........................................21 Figure 4.15 Attenuation relationship for horizontal ground motion on soft soil..........................................22 Figure 4.16 Attenuation relationships for vertical ground motion on soft soil ............................................22 Figure 4.17 Contour PGA maps for affected region using attenuation relationship (soft soil) by Campbell et al (2003) ......................................................................................................................................................23 Figure 5.1 Heavily damaged residential building ........................................................................................25 Figure 5.2 Housings on the hillside of mountain at Nglepen – Sengir (Sumberharjo village), north of Opak fault (S7° 49.02’-E110° 30.371’ and altitude of 422 m)...............................................................................26 Figure 5.3 Damage of GOR Sport Stadium (S 7° 47.901’-E110° 23.007’ altitude 450 m) .........................27 Figure 5.4 Damage of columns at the second storey, GOR Sport Stadium ...............................................27 Figure 5.5 Verification of column damage, GOR Sport Stadium ................................................................28 Figure 5.6 Damages on IBIS hotel, Malioboro (S7°47.58’-E110°21.99’ altitude 454m) .............................28 Figure 5.7 Damage of Multipurpose Building, UIN (S7° 47.162’-E110° 23.574’) ......................................29 Figure 5.8 Elevation of IAI from design drawing ........................................................................................30 Figure 5.9 Front and side views of IAI (S7° 51.076’-E110° 21.468’) .........................................................30 Figure 5.10 Failure of exterior columns in IAI ............................................................................................31 Figure 5.11 Failure of interior columns in IAI .............................................................................................31 Figure 5.12 Failure of STIE campus (S7° 49.630’-E110° 22.063’) ............................................................31 Figure 5.13 Soft first storey of the left building in STIE..............................................................................32 Figure 5.14 Short column effect and sub-standard materials in STIE .......................................................32 Figure 5.15 Overall view of BPKP (S7° 50.692’-E110° 21.688’) ...............................................................33 Figure 5.16 Collapsed column and gap between left and right parts of building .......................................33 Figure 5.17 Winongo Bridge (S7°50.46’-E110°20.88’ altitude 342 m) .......................................................34 Figure 5.18 Overpass bridge in Yogyakarta City (S7°47.19’-E110°24.62’ altitude 507 m) ........................34 Figure 5.19 Designed distance of gap between bridge decks ....................................................................35 Figure 6.1 Landslide at Nglepen - Sengir (S7°49.02’ - E110°30.371’ - 422m altitude) ..............................36

4
Mid-America Earthquake CenterMid-America Earthquake Center
Figure 6.2 Ground slumping at Nglepen - Sengir (Sumberharjo village), north of OPAK fault (S7° 49.02’-E110° 30.371’ and altitude of 422 m) ..............................................................................................37 Figure 6.3 Housing collapsed by ground failures........................................................................................37 Figure 7.1 Two main volcanic alignments in Central Java and the location of Merapi volcano .................38 Figure 7.2 Eruptive activity of Merapi Volcano since 1768 (Beauducel, 1998). .........................................39 Figure 7.3 Mount Merapi in Central Java, Indonesia (Photo Courtesy of English Wikipedia) ....................39 Figure 7.4 Mount Merapi from Space (August 24, 2003). Image courtesy of the Image Science & Analysis Laboratory, NASA Johnson Space Center (http://eol.jsc.nasa.gov)...........................................................40 Figure 8.1 Layout of Prambanan Temple complex (UNESCO, 2004)........................................................41 Figure 8.2 General view of Prambanan Temple complex...........................................................................42 Figure 8.3 Observed state of damage of Prambanan Temples..................................................................43 Figure 8.4 Damage to Prambanan and previous retrofitting with steel dowels ..........................................43 Figure 8.5 Evidence of internal heavy damage; stones shown on the staircase........................................44 Figure 8.6 Borobudur Temple .....................................................................................................................45 Figure 13.1 Route of site survey. Thick color lines represent GPS logs of the routes ...............................56 Figure 13.2 The location of structures investigated by team and the route shown in green ......................57

5
Mid-America Earthquake CenterMid-America Earthquake Center
1. EXECUTIVE SUMMARY- NON-EXPERT On 27 May 2006, at 5:54 local time, a medium-sized earthquake hit the central
section of the Island of Java in Indonesia. The shaking that lasted about 60 seconds caused widespread death and destruction to the heavily populated and relatively prosperous region. Most hit were Bantul in Yogyakarta Province and Klaten in Central Java Province. The large and affluent Yogyakarta City was also severely affected. More than 5,700 people were killed, whilst the injury list exceeded 37,000. Over 156,000 houses and other structures were totally destroyed. Total published economic losses were estimated to be over $3B; it is highly likely that this number considerably under-estimates the economic impact.
The region is subjected to well-understood and studied earthquake hazard and many earthquakes have happened both off- and onshore. The region of most intense shaking is estimated to be about 200 square kilometers. The shaking intensity was captured by some measurement devices and indicates that the ground motion was more intense than comparable earthquakes elsewhere. Severe shaking seems to have happened in both horizontal directions as well as the vertical direction.
A study of the recorded ground motion and the earthquake design code in Indonesia indicates that on the whole the structures in the affected regions have been subjected to significantly higher forces than the code would have required. Cases of slope instability, some rock falls and soil failure were either observed by the MAE Center Team or reported to them. Large ground fissures were widespread, but none were associated with the earthquake rupture. In general, ground engineering effects were not overly influential in this earthquake.
Both traditional and modern designed structures have been hit hard. Traditional houses are normally built of brick or stone masonry, with few in concrete block masonry walls, supporting a timber roof with tiles. The foundations are commonly stone rubble. Little tying of these components is undertaken, and most of the failures were due to loss of corner support of roofs, brittle shear cracking, and shedding of masonry and collapse of corners due to over-stressing. In many cases, where heavy slate tiles were used, the roof caused the collapse of the walls. Many engineered structures suffered either severe damage or partial to total collapse. Even modern reinforced concrete structures were hard hit; some were under construction at the time of the earthquake. Failure at connections between beams and columns and a number of other failure modes were also observed. Extensive damage of interiors and facades was also widespread, causing very significant economic loss and in a few cases death and injury. The impact on roads and bridges was limited, with the exception of the closure of the airport for a couple of days.
Educational, health and religious structures were severely affected, causing grave social impact. Trauma and stress effects were most serious especially in children. The eruption of Merapi volcano before, during and after the earthquake shaking has compounded the traumatic experience of the residents of the region affected. At least 70,000 people permanently lost their source of income. The local economy was affected very significantly with a reduction in projected growth from 5% to 1.3% in 2006.
The recommendations of the MAE Center Team are that detailed hazard studies are urgently required, underpinned by a massive increase in density and speed of deployment of an advanced earthquake monitoring network. Detailed local site work is

6
Mid-America Earthquake CenterMid-America Earthquake Center
also urgently called for to quantify the effect of the soft deposits. In addition to updating the existing code, a simple no-calculations code is required, coupled with a concerted public education and awareness campaign to stress the need for earthquake resistant construction. Urgent development or acquisition of means of estimating the impact of future earthquakes is needed. Finally, the development of mitigation, response and recovery plans is urgently required.

7
Mid-America Earthquake CenterMid-America Earthquake Center
2. EXECUTIVE SUMMARY-EXPERT
On 27 May 2006, at 5:54 local time, a magnitude Mw 6.3 earthquake hit the central
section of the Island of Java in Indonesia. The shaking that lasted about 60 seconds caused widespread death and destruction to the heavily populated and relatively prosperous region. Most hit were Bantul in Yogyakarta Province and Klaten in Central Java Province. The large and affluent Yogyakarta City was also severely affected. More than 5,700 people were killed, whilst the injury list exceeded 37,000. Over 156,000 houses and other structures were totally destroyed. Total published economic losses were estimated to be over $3B; it is highly likely that this number considerably under-estimates the economic impact.
The tectonic setting of the region is dominated by the subduction of the Indo-Australian plate under the Eurasian plate, which causes large deep earthquakes mainly north of Java. High frictional stresses also cause medium earthquakes on the over-riding plate that are observed often within and to the south of the Island. There are no subduction or thrust earthquakes in the latter region. The megathrust region to the west-north west of Java has also caused colossal earthquakes. Therefore, the study region is subjected to three potential earthquakes, medium, large and massive. Return periods cannot be constrained but the region is certainly subjected to high to very high seismic hazard. Many historical and instrumental earthquakes have been previously recorded in the region, both off- and onshore.
Some fault plane solutions point towards a left-lateral strike-slip mechanism. The region most affected correlates with a movement of the known Opak fault. The estimated fault rupture dimensions are 20 km long by 10 km wide. The earthquake shaking was captured by a number of seismographs that had certain deficiencies leading to a highly unreliable set of records. Using back-analysis and reconstructive techniques, the records were remedied and have given some insight into the nature of shaking. The duration of shaking of 60 seconds is unusually long, given the earthquake magnitude. The horizontal peak ground acceleration could have been as high as 0.5g, with a relatively high vertical acceleration of about 0.47g. The reconstructed records indicate that the maximum horizontal ground motion amplification was nearly 5, with a vertical amplification factor of 3. Whereas the latter is in the normal range, the former is almost twice as large as the average values reported in the literature. This may point towards the significance of horizontal amplifications on soft soil deposits. Vertically propagating compressional waves are usually not affected by soil type, nor are they even affected by liquefaction. The spectra exhibit high amplifications in a wide period range, especially the vertical spectra. This is also unusual and cannot be explained without further study.
The implications of the shape of the retrieved spectra are serious. If the Indonesian code follows UBC 1997, and classifies Yogyakarta, as reported, in zone 3, then the ground design acceleration is at most 0.3g. If a response modification factor R of 5 is assumed for low ductility structures, and an amplification factor of 2.5 is used, the seismic base shear coefficient for design would be 0.15. The spectra shown in this report indicate that low ductility structures (μ=2) were subjected to lateral force coefficients in the region of 0.6-0.7, about 4-5 times as much as the code coefficient. Even for long period structures, the seismic code coefficient from the calculated spectra is about 0.15 or more,

8
Mid-America Earthquake CenterMid-America Earthquake Center
much higher than the code would have indicated. Therefore, even if these structures were designed to resist seismic forces according to the code, they would have suffered unexpectedly high levels of damage. This would have been compounded by high vertical motion that led to load coefficients of 0.6-0.8, assuming elastic response.
Cases of slope instability, some rock falls and liquefaction was either observed by the MAE Center Team or reported to them. Large ground fissures were widespread, but none were associated with fault movement. In general, geotechnical effects were not overly influential in this earthquake.
Both traditional non-engineered and modern engineered structures have been hit hard. Traditional houses are normally built of brick or stone masonry, with few in concrete block masonry walls, supporting a timber roof with tiles. The foundations are commonly stone rubble. Little tying of these components is undertaken, and most of the failures were due to loss of corner support of roofs, brittle shear cracking and shedding of masonry and collapse of corners due to over-stressing. In many cases, where heavy slate tiles were used, the roof caused the collapse of the supporting elements by shear or flexure. Many engineered structures suffered either severe damage or partial-to-total collapse. Even modern RC structures were hard hit; some were under construction at the time of the earthquake. Failure at beam-column connections, axial crushing of over-stressed columns and shear failure of columns were repeatedly observed. Extensive non-structural damage was also widespread, causing very significant economic loss and in a few cases death and injury. The impact on transportation was limited, with the exception of the closure of the airport for a couple of days.
Educational, health and religious structures were severely affected, causing grave social impact. Trauma and stress effects were most serious especially in children. The eruption of Merapi volcano before, during and after the earthquake shaking has compounded the traumatic experience of the residents of the region affected. At least 70,000 people permanently lost their source of income. The local economy was affected very significantly with a reduction in projected growth from 5% to 1.3% in 2006.
The recommendations of the MAE Center Team are that detailed hazard studies are urgently required, underpinned by a massive increase in density and speed of deployment of an advanced earthquake monitoring network that includes accelerometers as well as seismographs. Detailed micro-zonation work is also urgently called for to quantify the effect of the soft deposits from the subduction regime on top of which many communities reside. In addition to updating the existing code, a deemed-to-satisfy, no-calculations code is required, coupled with a concerted public education and awareness campaign to stress the need to earthquake resistant construction. Urgent development or acquisition of tools for impact assessment is called for, to avail of accurate assessment results on which mitigation, response and recovery activities would be based. Legislation that converts the recommendations into mandatory requirements is also needed.

3. OVERVIEW OF THE EARTHQUAKE AND LOSSES
A moderate-to-strong earthquake of moment magnitude, Mw 6.3 (body wave
magnitude, Mb 5.9) hit the central region of the Island of Java in Indonesia at 5:54 local time on 27 May 2006 (22:54 UTC on 26 May 2006) causing widespread destruction and loss of life and property. The location of the earthquake according to the United States Geological Survey (USGS) is 20 km SSE of Yogyakarta City at 7.962oS – 110.458oE, as shown in Figure 3.1. Other studies give different locations, as shown in Table 3.1. Whereas the tectonic setting is that of major subduction of the Indo-Australian plate under Eurasia, with the region affected being on the Sunda micro-plate, fault plane solutions indicated a left-lateral strike-slip mechanism trending NE-SW. Whereas some reports implicate the Opak Fault in the earthquake, this has not been conclusively confirmed and nothing is known as to the initiation, propagation or extent of faulting at the time of publication of this report. No conclusive evidence of surface manifestation of the fault exists, to the satisfaction of the MAE Center Team, and no evidence linking the eruption of Mount Merapi volcano that preceded the 27 May 2006 earthquake.
Figure 3.1 General location map and epicenter
Table 3.1 Source parameters from different sources
Magnitude Epicenter Institution Time Depth (km) Mb Ms Mw Latitude (S) Longitude (E)
BMG, Indonesia 5:54:01 11.87 5.9 8.03 110.32 ESDM, Indonesia 5:54:01 17 6.2 8.00 110.43 USGS, USA 5:53:58 10 6.3 7.96 110.46 Harvard CMT, USA 5:54:05 21.7 6.0 6.3 6.4 8.03 110.54 ERI, Japan 5:53:59 10 6.4 8.00 110.30 NIED, Japan 5:53:58 10 6.3 7.89 110.41 EMSC, Europe 5:53:58 10 6.4 8.04 110.39 GEOFON, Germany 5:54:02 N/A 5.8 8.04 110.43
9
Mid-America Earthquake CenterMid-America Earthquake Center

10
Mid-America Earthquake CenterMid-America Earthquake Center
Strong ground shaking has affected mainly two districts; Bantul in Yogyakarta Province and Klaten in Central Java Province. The City of Yogyakarta was also strongly hit alongside a number of districts in the prosperous and heavily populated central region of the island of Java. A limited number of seismograph recordings of the main shock exist and these mainly reached their amplitude calibration limit, hence the records are clipped. Reconstructive analysis of the recordings indicates horizontal peak ground accelerations in the region of 0.20~0.34g at the YOGI station, approximately 10 km from the presumed epicenter. Vertical ground motion is estimated from structural collapse back-analysis at 0.18~0.30g and used to constrain the ground accelerations inferred from the seismograms. Geotechnical effects included major land slides in the hills NE of the epicenter, some rock falls and reported fluctuation in the level and quality of well water. No conclusive evidence of liquefaction was obtained, even though the water table was relatively shallow, at about 4m.
Table 3.2 Distribution of casualties by district (BAPPENAS, 2006)
Province and District Death Toll Number Injured Yogyakarta 4,659 19,401
Bantul 4,121 12,026 Sleman 240 3,792 Yogyakarta City 195 318 Kulonprogo 22 2,179 Gunung Kidul 81 1,086
Central Java 1,057 18,526 Klaten 1,041 18,127 Magelang 10 24 Boyolali 4 300 Sukoharjo 1 67 Wonogiri - 4 Purworejo 1 4
Total 5,716 37,927
The death toll is estimated at over 5,700, whilst injuries may be up to 60,000 of an exposed population of more than 5M. Table 3.2 gives a breakdown of casualties by district (BAPPENAS, 2006), and is considered by several individuals with whom the MAE Center Team met to be an under-estimate. At least 156,000 buildings were totally destroyed, and over 200,000 suffered varying degrees of damage. All damaged buildings inspected showed lack of seismic design provisions, adequate robustness considerations and/or poor quality of construction. Bridges were largely unaffected, while a limited number of roads were partially closed for some time and two rail roads were observed to be twisted following the earthquake. The local airport was mildly affected and was back to full operation within two days. The effect on utility networks was also limited. One out of two precious World Heritage monuments, the Hindu temple of Prambanan, was heavily damaged. The other, the Buddhist temple of Borobudur, retrofitted by UNESCO in 1970s, was unaffected. Other important religious establishments were also affected; between 10% and 20% of all religious centers were damages to varying degrees, thus affecting the communities in the region.

11
Mid-America Earthquake CenterMid-America Earthquake Center
Table 3.3 Distribution of housing damage (BAPPENAS, 2006)
Totally destroyed Damaged Total Yogyakarta Province 88,249 98,343 186,592
Bantul 46,753 33,137 79,890 Sleman 14,801 34,231 49,032 Gunung Kidul 15,071 17,967 33,038 Yogyakarta City 4,831 3,591 8,422 Kulonprogo 6,793 9,417 16,210
Central Java 68,415 103,689 172,104 Klaten 65,849 100,817 166,666 Sukoharjo 1,185 488 1,673 Magelang 499 729 1,228 Purworejo 144 760 904 Boyolali 715 825 1,540 Wonogiri 23 70 93
Total 156,664 202,032 358,696
Educational facilities, some of the best in Indonesia, were severely hit by the earthquake, with over 2,000 educational facilities partially or totally losing their function for extended periods. This included total collapse of several schools and many buildings in universities. Healthcare facilities, also among the best in Indonesia, were adversely affected with 17 hospitals closed in Yogyakarta City alone. Other locations were severely hit, primarily due to structural collapse of buildings.
Total direct economic losses are cautiously estimated at $3.1B1. It is reported that over 90% of the losses were in the private sector with only 10% in the public sector. No estimates of indirect losses exist but these are expected to be at least equal to or much higher than the direct losses, which are in themselves under-estimates2.
1 Figures are extracted from a report whose provenance is unclear. It is stated that it is a product of BAPPENAS and international
partners, including the World Bank and Asia Development Bank, but this is not explicitly mentioned in the report authorship. Also, the report quotes the losses in the Kashmir (Pakistan) earthquake of October 2005 as being $2.85M, while a report by the World Bank and Asia Development Bank gives a figure of $5.1M
2 In the opinion of the writers, WB-ADB, and others, economic loss estimates tend to be on the low side. Counting losses, as opposed to measuring output before and after a natural disaster, usually leads to low estimates.

4. SEISMOLOGICAL FEATURES
4.1 TECTONIC SETTING
Understanding the Yogyakarta earthquake in a regional setting, and hence understanding its implications on earthquake hazard, requires understanding the larger region extending to the north, to Andaman and Nicobar Islands, and to the south and east, to the northern tip of Australia and Timor.
The global tectonic picture is that of subduction of the Indo-Australian plate under the Eurasian plate along an arc of about 6000 kms and at an average rate of about 5 cms/yr. Slip rates on the northern section of the subduction mechanism reach about 7 cm/yr (Figure 4.1). The latter is approximately a circular arc with an angle of 100o, and a radius of about 2300 km, centered north of the Philippines. Major earthquakes have occurred in the region with a trend towards interplate earthquakes in the northern parts, near Sumatra, and smaller magnitude earthquakes of mixed origins near Java on the forearc basin, where evidence exist of aseismic slip on the subduction surface. The last and strongest earthquake on this mechanism is the megathrust Mw 9.0 earthquake of December 2004 that caused a rupture of over 1200 km, and caused the death of nearly 300,000 individuals from direct shaking as well as a major tsunami (Bilham et al, 2005).
Figure 4.1 Regional tectonic setting
12
Mid-America Earthquake CenterMid-America Earthquake Center
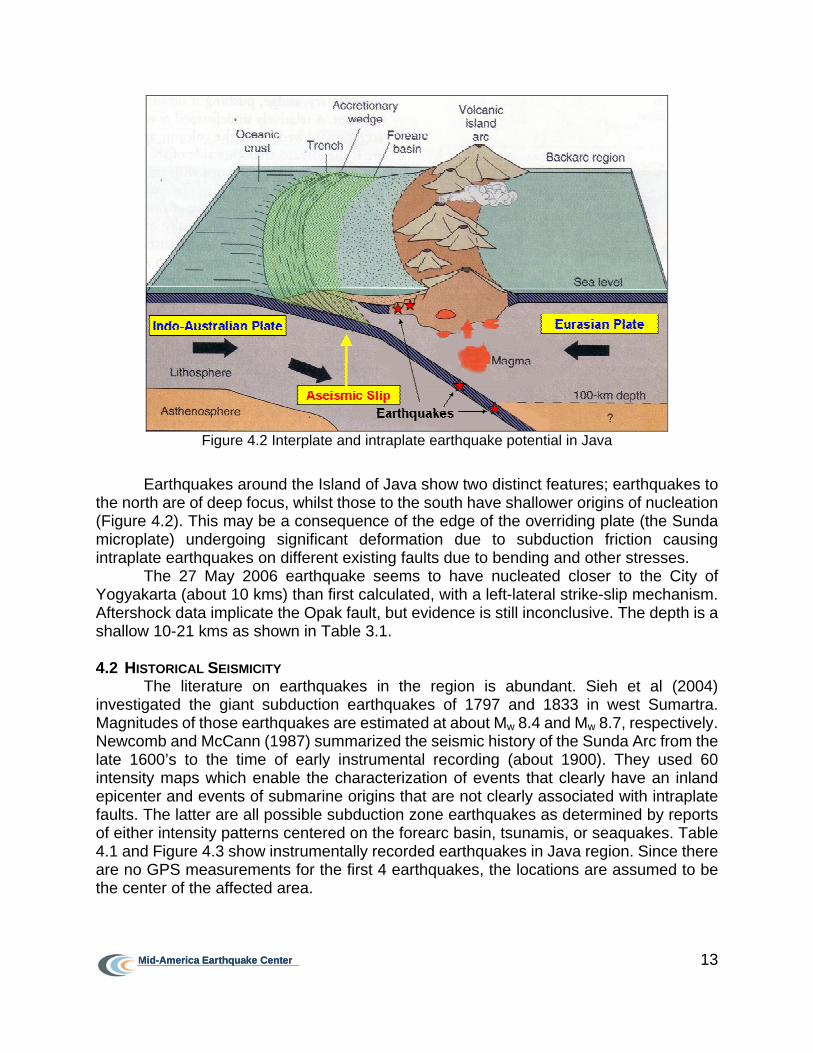
Figure 4.2 Interplate and intraplate earthquake potential in Java
Earthquakes around the Island of Java show two distinct features; earthquakes to
the north are of deep focus, whilst those to the south have shallower origins of nucleation (Figure 4.2). This may be a consequence of the edge of the overriding plate (the Sunda microplate) undergoing significant deformation due to subduction friction causing intraplate earthquakes on different existing faults due to bending and other stresses.
The 27 May 2006 earthquake seems to have nucleated closer to the City of Yogyakarta (about 10 kms) than first calculated, with a left-lateral strike-slip mechanism. Aftershock data implicate the Opak fault, but evidence is still inconclusive. The depth is a shallow 10-21 kms as shown in Table 3.1.
4.2 HISTORICAL SEISMICITY
The literature on earthquakes in the region is abundant. Sieh et al (2004) investigated the giant subduction earthquakes of 1797 and 1833 in west Sumartra. Magnitudes of those earthquakes are estimated at about Mw 8.4 and Mw 8.7, respectively. Newcomb and McCann (1987) summarized the seismic history of the Sunda Arc from the late 1600’s to the time of early instrumental recording (about 1900). They used 60 intensity maps which enable the characterization of events that clearly have an inland epicenter and events of submarine origins that are not clearly associated with intraplate faults. The latter are all possible subduction zone earthquakes as determined by reports of either intensity patterns centered on the forearc basin, tsunamis, or seaquakes. Table 4.1 and Figure 4.3 show instrumentally recorded earthquakes in Java region. Since there are no GPS measurements for the first 4 earthquakes, the locations are assumed to be the center of the affected area.
13
Mid-America Earthquake CenterMid-America Earthquake Center

Table 4.1 Historical earthquakes in the Java region Year Month Date Latitude
(South) Longitude
(East) Ms, Intensity, or the reported description
Depth (km)
1797 - - - - 8.4 - 1833 - - - - 8.7 - 1840 January 4 - - Tsunami - 1859 October 20 - - Tsunami - 1867 June 10 - - MM >VIII - 1875 March 28 - - MM=V~VII - 1903 February 27 8.00 106.00 7.9 25 1921 September 11 11.35 110.76 7.5 - 1937 September 27 8.88 110.65 7.2 - 1955 May 29 10.30 110.50 6.38 - 1962 December 21 9.00 112.40 6.27 - 1963 December 16 6.40 105.40 6.13 - 1972 May 28 11.05 116.97 6.2 - 1974 September 7 9.80 108.48 6.5 - 1976 July 14 8.22 114.87 6.5 36 1977 August 19 11.16 118.41 7.9 33 1977 October 7 9.95 117.32 6.3 33 1979 July 24 11.15 107.71 6.9 31 1979 October 20 8.32 116.02 6.2 33 1979 Nov 2 7.66 108.25 6.0 25 1979 December 17 8.41 115.96 6.3 33 1982 March 11 9.27 118.48 6.4 33 1982 August 7 11.14 115.42 6.2 33 2006 May 27 7.96 110.46 6.3 10 2006 July 17 9.22 107.32 7.7 34
Figure 4.3 Historical earthquakes in the Java region
Table 4.1 and Figure 4.3 indicate that there were many strong events affecting
Java and confirm that the tectonics of the region are dominated by the subduction of the Australia plate north-northeastward beneath the Sunda micro-plate. Major earthquakes larger than magnitude 7 have occurred every about 25 years as listed in Table 4.1.
14
Mid-America Earthquake CenterMid-America Earthquake Center

4.3 MACRO-SEISMIC DATA AND FAULT MECHANISM As mentioned in Section 3, the earthquake struck at 5:54 local time on May 27,
2006 (22:54 on May 26 coordinated universal time UTC). According to USGS, the magnitude was 6.3, and the location coordinates were 7.962S-110.458E, with a focal depth of 10 km (6.2 miles). The distance from the epicenter was 20 km SSE of Yogyakarta which was severely affected and 455 km ESE of Jakarta which is the capital of Indonesia. Striking in the early morning hours, the earthquake claimed over 5,700 lives, injured between 40,000 and 60,000, and affected hundreds of thousands of livelihoods.
A definitive fault mechanism has not been agreed upon. As explained in Section 4.1, the tectonics of Java is dominated by the subduction of the Australia plate north-northeastward beneath the Eurasian plate. The Australia plate dips from the Java trench, attaining depths of 100-200 km beneath the island of Java, and depths of 600 km north of the island. According to USGS, the earthquake of 27 May 2006 occurred at shallow depth in the overriding Sunda plate well above the dipping Australia plate. Therefore, it can be concluded that the earthquake was not directly associated with the subduction regime, but rather on local faults that are stressed due to the deeper subduction mechanism.
Figure 4.4 Location of OPAK fault and
epicenters by several institutions Figure 4.5 Damage intensities in villages from
UNOSAT (red: severe) and presumed fault Since the fault plane solution available is a strike-slip mechanism, it is likely that a
shallower fault is responsible for the earthquake. Reports implicate the OPAK fault, location shown in Figure 4.4, in the earthquake. Early report from NIED, Japan (Nakano et al, 2006) explained the source mechanism using waveform data obtained at BJI and LEM stations which are about 90 km and 300 km from epicenter, respectively. They concluded that the source mechanism was dominated by a strike slip component with Mw 6.3. The estimated epicenter by NIED is shown in Figure 4.4 and this epicenter is located near OPAK fault. The epicenter and presumed fault region is well correlated with damage levels in the affected area provided by UNOSAT (http://www.unosat.org) as shown in
15
Mid-America Earthquake CenterMid-America Earthquake Center
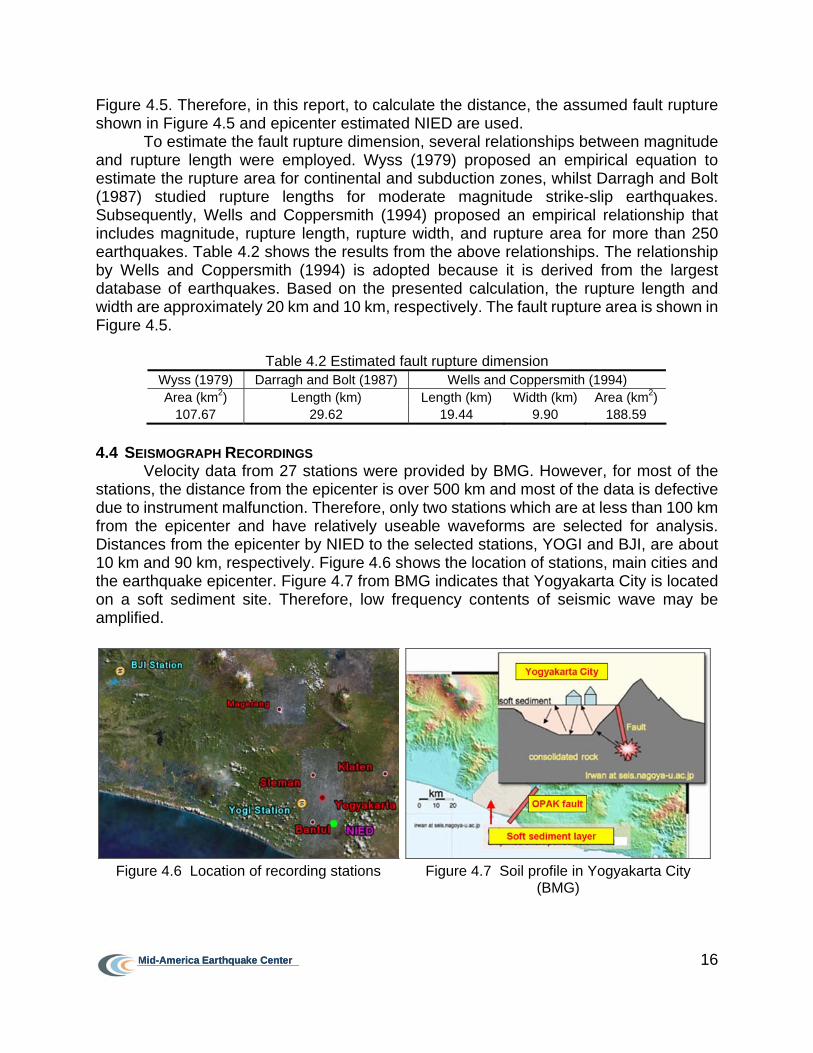
Figure 4.5. Therefore, in this report, to calculate the distance, the assumed fault rupture shown in Figure 4.5 and epicenter estimated NIED are used.
To estimate the fault rupture dimension, several relationships between magnitude and rupture length were employed. Wyss (1979) proposed an empirical equation to estimate the rupture area for continental and subduction zones, whilst Darragh and Bolt (1987) studied rupture lengths for moderate magnitude strike-slip earthquakes. Subsequently, Wells and Coppersmith (1994) proposed an empirical relationship that includes magnitude, rupture length, rupture width, and rupture area for more than 250 earthquakes. Table 4.2 shows the results from the above relationships. The relationship by Wells and Coppersmith (1994) is adopted because it is derived from the largest database of earthquakes. Based on the presented calculation, the rupture length and width are approximately 20 km and 10 km, respectively. The fault rupture area is shown in Figure 4.5.
Table 4.2 Estimated fault rupture dimension
Wyss (1979) Darragh and Bolt (1987) Wells and Coppersmith (1994) Area (km2) Length (km) Length (km) Width (km) Area (km2)
107.67 29.62 19.44 9.90 188.59
4.4 SEISMOGRAPH RECORDINGS Velocity data from 27 stations were provided by BMG. However, for most of the
stations, the distance from the epicenter is over 500 km and most of the data is defective due to instrument malfunction. Therefore, only two stations which are at less than 100 km from the epicenter and have relatively useable waveforms are selected for analysis. Distances from the epicenter by NIED to the selected stations, YOGI and BJI, are about 10 km and 90 km, respectively. Figure 4.6 shows the location of stations, main cities and the earthquake epicenter. Figure 4.7 from BMG indicates that Yogyakarta City is located on a soft sediment site. Therefore, low frequency contents of seismic wave may be amplified.
Figure 4.6 Location of recording stations Figure 4.7 Soil profile in Yogyakarta City (BMG)
16
Mid-America Earthquake CenterMid-America Earthquake Center

The record at the YOGI station is truncated because the instrument had reached its calibration limit. Therefore, the saturated velocity records at the YOGI station are reconstructed using a cubic spline interpolation as shown in Figure 4.8. This is a unique piecewise cubic polynomial with two continuous derivatives with breaks at all interior data points except for the leftmost and the rightmost pair. The corrected vertical velocity plots at the YOGI station with velocity data at the BJI station are shown in Figure 4.9.
20 20.5 21 21.5 22 22.5
-2.5E+007
-2.0E+007
-1.5E+007
-1.0E+007
-5.0E+006
0.0E+000
5.0E+006
Time (sec)
Vel
ocity
Raw DataCorrected Data
Figure 4.8 Correction of data using Cubic Spline Interpolation
-20
-15
-10
-5
0
5
10
15
20
0 10 20 30 40 50 60 70 80 90 10
Time (sec)
Velo
city
x1
06
0
RawCorrected
Station: YOGIComponent: VERT
(a) YOGI station
-5-4-3-2-1012345
0 20 40 60 80 100 120 140 160 180 200
Time (sec)
Vel
ocity
x1
06
Station: BJIComponent: VERT
(b) BJI station
Figure 4.9 Vertical velocity data at station YOGI and BJI
17
Mid-America Earthquake CenterMid-America Earthquake Center

18
Mid-America Earthquake CenterMid-America Earthquake Center
As shown in Figure 4.9, there is no information about the vertical axis scales for the data and attempts at clarifying this issue with colleagues from Indonesia have failed. Therefore, to determine the conversion factor for the vertical scale, the following options are considered:
A. Instrumental gain for “Streckeisen STS-2” with 24bit digitizer which was used in
YOGI station a) Sensitivity of STS-2 with low gain: 1500 Volts/m/sec. b) Sensitivity of Data logger (Q4120 and Q730): 419430 count/volts.
B. PGA of vertical ground motion obtained by a back-analysis with GOR structure,
Yogyakarta
Table 4.3 shows the PGA values estimated by conversion factor for each of the above options. In option A, the sensitivity should be determined by calibration. Those values usually vary and are associated with large uncertainties. However, due to lack of information except instrument types, it was assumed that the normally employed gain was used. The calculated peak ground acceleration of about 0.03g is unreasonable, especially considering the distance from the epicenter (10 km) and the observed damage levels in Yogyakarta. Therefore, option B is selected to determine the conversion factor. In Section 5.2 of this report, back-analysis of a collapsed sports pavilion is presented. The back-analysis provides bounds on the vertical motion causing collapse, taking into account the uncertainty associated with supply (material strength) and demand (spectral amplification). The results are invoked herein. As shown in Table 4.3, the lower and upper limits on the PGA of the vertical motion were calculated. The resulting factor was applied to the horizontal PGA with the assumption that the instrument conversion factor is the same for both components. Figure 4.10 and Figure 4.11 show the obtained acceleration record for the mean values of PGA at BJI and YOGI stations. Due to problems with the instrument, the East-West component at BJI is not available. The estimated vertical PGA at YOGI station is 0.183g ~ 0.303g and the horizontal PGA is 0.197g~0.336g. The PGA at BJI station is evaluated as 0.021~0.035g and 0.015~0.025g for horizontal and vertical components, respectively. These provide the best available estimates in the absence of more reliable data. The cumbersome procedure followed in this section underlines the extreme importance of intense instrumentation programs in regions exposed to earthquake risk.
Table 4.3 Conversion factors for measured data at YOGI station
Peak Ground Acceleration EW NS VERT Cases Predicted
PGA Conversion
Factor m/sec2 g m/sec2 g m/sec2 g
Instrumental Gain 1.590E-09 0.3200 0.0326 0.3301 0.0336 0.2976 0.0303 Min. 0.1830 9.591E-09 1.9304 0.1968 1.9908 0.2029 1.7952 0.1830
Mean 0.2434 1.276E-08 2.5676 0.2617 2.6479 0.2699 2.3878 0.2434 Back-Analysis
with GOR (VERT) Max. 0.3030 1.588E-08 3.1963 0.3258 3.2963 0.3360 2.9724 0.3030

EW component is unavailable
-0.3
-0.2
-0.1
0
0.1
0.2
0.3
Acc
eler
atio
n (g
)
0.262g, EW
-0.3
-0.2
-0.1
0
0.1
0.2
0.3
Acc
eler
atio
n (g
) 0.028g, NS
-0.3
-0.2
-0.1
0
0.1
0.2
0.3
Acc
eler
atio
n (g
)
0.270g, NS
-0.3
-0.2
-0.1
0
0.1
0.2
0.3
0 10 20 30 40 50 60 70 80Time (sec)
Acc
eler
atio
n (g
)
0.020g, VERT
-0.3
-0.2
-0.1
0
0.1
0.2
0.3
0 10 20 30 40 50 60 70 8
Time
0
(sec)
Acc
eler
atio
n (g
) 0.243g, VERT
Figure 4.10 Acceleration at BJI (mean value) Figure 4.11 Acceleration at YOGI (mean value)
The signal from YOGI is the most usable of the available records, since it is
obtained from an area where significant damage has occurred. The signal from BJI station is very weak. Therefore, spectra for the YOGI records are evaluated with uncertainties and different ductility levels. Figure 4.12 illustrates the elastic spectra with 5% damping for three components with the bands of uncertainty described above. The highest amplification is about 5.0 for the EW component. This is compared to the value of 2.6, which is the 84 percentile amplification factor given by Newmark and Hall (1982), thus indicating the relative severity of the YOGI record. For the vertical acceleration spectra, the highest amplification factor is about 3.0, associated with a relatively broad period range of high amplification. This value is identical with the amplification factor given by Eurocode 8 (EC8) which is based on the proposed spectra by Elnashai and Papazoglou (1997). However, the range of high amplification is 0.05~0.15 sec in EC8, while high amplifications in the YOGI record go up to 0.35 seconds. Notwithstanding that the spectra are obtained from reconstructed (or salvaged) data from saturated waveforms, the high frequency contents may be credible because the correction method affects low frequency modulation more than its high frequency counterpart. Therefore, this is an unusual feature that may explain the extensive damages and failure of roofs and vertical members in Yogyakarta. Ratio quantities are not affected by the instrument conversion.
19
Mid-America Earthquake CenterMid-America Earthquake Center

0
0.2
0.4
0.6
0.8
1
1.2
1.4
1.6
1.8
0 0.5 1 1.5 2 2.5 3
Period (sec)
Acc
eler
atio
n Sp
ectr
a (g
)
MaxMeanMin
0
0.2
0.4
0.6
0.8
1
1.2
1.4
1.6
1.8
0 0.5 1 1.5 2 2.5
Period
3
(sec)
Acc
eler
atio
n Sp
ectr
a (g
)
MaxMeanMin
(a) EW (b) NS
0
0.2
0.4
0.6
0.8
1
1.2
1.4
1.6
1.8
0 0.5 1 1.5 2 2.5
Period
3
(sec)
Acc
eler
atio
n Sp
ectr
a (g
)
MaxMeanMin
(c) VERT
Figure 4.12 Elastic acceleration spectra (5% damping) considering uncertainty
0
0.1
0.2
0.3
0.4
0.5
0.6
0.7
0.8
0.9
1
0 0.5 1 1.5 2 2.5
Period
3
(sec)
Acce
lera
tion
Spe
ctra
(g)
μ=2
μ=3
μ=4
0
0.1
0.2
0.3
0.4
0.5
0.6
0.7
0.8
0.9
1
0 0.5 1 1.5 2 2.5
Period
3
(sec)
Acce
lera
tion
Spe
ctra
(g)
μ=2
μ=3
μ=4
(a) EW (b) NS Figure 4.13 Acceleration spectra for mean value with various ductility levels and 1.0% damping
If the Indonesian code follows UBC 1997, and classifies Yogyakarta, as reported,
in zone 3, then the ground design acceleration is 0.3g for rock (SB in UBC 1997) and 0.36g for soil (SD in UBC 1997). If a response modification factor R of 5 is assumed for low
20
Mid-America Earthquake CenterMid-America Earthquake Center

ductility structures, and an amplification factor of 2.5 is used, the seismic base shear coefficient for design would be 0.15 ~ 0.18. As shown in Figure 4.14, the spectra indicate that low ductility structures (μ=2) were subjected to lateral force coefficients in the region of 0.6-0.7, about 4-5 times as much as the code coefficient. Even for long period structures, the seismic code coefficient from the calculated spectra is about 0.15 or more, much higher than the code would have indicated. Therefore, even if these structures were designed to resist seismic forces according to the code, they would have suffered unexpectedly high levels of damage.
0
0.1
0.2
0.3
0.4
0.5
0.6
0.7
0.8
0 0.5 1 1.5 2 2.5 3
Period (sec)
Acc
eler
atio
n Sp
ectr
a (g
)μ=2
μ=3
μ=4
UBC 97 with SDUBC 97 with SB
Figure 4.14 Comparison with seismic coefficient of design spectra by UBC 97
Two attenuation relationships by Ambraseys et al (2005) and Campbell et al
(2003) are employed to assess the severity of motion in this earthquake, and to construct iso-acceleration plots. The latter two relationships are selected because they pertain to strike-slip and thrust mechanisms, large magnitude, and a large and uniformly processed data base. In this report, two soil types, i.e. soft and stiff soil, are used as shown in Table 4.4. For example, firm and very firm soils in the attenuation relationship by Campbell et al (2003) are jointly categorized as soft soil. Figure 4.15 and Figure 4.16 illustrate the attenuation of ground acceleration with standard deviation for thrust and strike slip faults measured on soft soil for horizontal and vertical ground motion. The peak ground acceleration values from YOGI and BJI stations are also shown along with error bars corresponding to lower and upper limits established from earlier sections of this report. Distances are measured from the presumed epicenter by NIED due to uncertainty in fault rupture location and length. The selected attenuation relationships support the PGA estimated by back-analysis and reconstructed velocity records. The attenuation for strike-slip mechanisms tends to have a good agreement with PGAs at YOGI and BJI, especially, the attenuation by Campbell et al (2003).
Table 4.4 Soil class for each attenuation relationship
Ambraseys et al (2005) Campbell et al (2003) Soil Class Soil type Shear Velocity (m/s) Soil type Shear Velocity (m/s)
Firm soil 210 ~ 390 Soft Soil Soft soil 180 ~ 360 Very firm soil 290 ~ 490 Soft rock 310 ~ 530 Stiff Soil Stiff soil 360 ~ 750 Firm rock 490 ~ 1170
21
Mid-America Earthquake CenterMid-America Earthquake Center

1 10 50 100 150
0.05
0.1
0.2
0.5
1
1.5
Distance (km)
PG
A(g
)
Ambraseys-SoftCampbell-Firm SoilCampbell-Very Firm SoilAmbraseys-Soft(+/- σ)Campbell-Firm Soil(+/- σ)Campbell-Very Firm Soil(+/- σ)YOGI StationBJI Station
1 10 50 100 150
0.05
0.1
0.2
0.5
1
1.5
Distance (km)
PG
A(g
)
Ambraseys-SoftCampbell-Firm SoilCampbell-Very Firm SoilAmbraseys-Soft(+/- σ)Campbell-Firm Soil(+/- σ)Campbell-Very Firm Soil(+/- σ)YOGI StationBJI Station
(a) Strike-slip fault (b) Thrust fault
Figure 4.15 Attenuation relationship for horizontal ground motion on soft soil
1 10 50 100 150
0.05
0.1
0.2
0.5
1
1.5
Distance (km)
PGA(
g)
Ambraseys-SoftCampbell-Firm SoilCampbell-Very Firm SoilAmbraseys-Soft(+/- σ)Campbell-Firm Soil(+/- σ)Campbell-Very Firm Soil(+/- σ)YOGI StationBJI Station
1 10 50 100 150
0.05
0.1
0.2
0.5
1
1.5
Distance (km)
PG
A(g
)
Ambraseys-SoftCampbell-Firm SoilCampbell-Very Firm SoilAmbraseys-Soft(+/- σ)Campbell-Firm Soil(+/- σ)Campbell-Very Firm Soil(+/- σ)YOGI StationBJI Station
(a) Strike-slip fault (b) Thrust fault Figure 4.16 Attenuation relationships for vertical ground motion on soft soil
Table 4.5 Prediction of PGA by attenuation relationships with various soil classes and fault types
Peak ground acceleration (g) Ambraseys et al (2005) Campbell et al (2003) City
Distance from
epicenter by NIED
Comp. Soft soil Stiff soil Soft soil Stiff soil
Strike-Slip Fault Hor. 0.2446 ~ 0.3591 0.2002 ~ 0.2939 0.1748 ~ 0.4922 0.1645 ~ 0.4489
Bantul 8 km Vert. 0.1213 ~ 0.1922 0.1127 ~ 0.1786 0.1220 ~ 0.4704 0.1217 ~ 0.4087 Hor. 0.2092 ~ 0.3072 0.1712 ~ 0.2514 0.1467 ~ 0.4183 0.1338 ~ 0.3768
Yogyakarta 10 km Vert. 0.1002 ~ 0.1588 0.0931 ~ 0.1475 0.1033 ~ 0.3839 0.1030 ~ 0.3226 Hor. 0.1101 ~ 0.1616 0.0901 ~ 0.1323 0.0773 ~ 0.2257 0.0669 ~ 0.1986
Sleman 20 km Vert. 0.0494 ~ 0.0782 0.0459 ~ 0.0727 0.0520 ~ 0.1795 0.0489 ~ 0.1509
Thrust Fault Hor. 0.3122 ~ 0.4584 0.2555 ~ 0.3752 0.2483 ~ 0.6991 0.2337 ~ 0.6376
Bantul 8 km Vert. 0.1482 ~ 0.2348 0.1376 ~ 0.2182 0.1451 ~ 0.5593 0.1446 ~ 0.4859 Hor. 0.2671 ~ 0.3921 0.2186 ~ 0.3209 0.2084 ~ 0.5942 0.1900 ~ 0.5352
Yogyakarta 10 km Vert. 0.1224 ~ 0.1941 0.1137 ~ 0.1803 0.1228 ~ 0.4564 0.1224 ~ 0.3835 Hor. 0.1405 ~ 0.2063 0.1150 ~ 0.1688 0.1099 ~ 0.3205 0.0950 ~ 0.2821
Sleman 20 km Vert. 0.0603 ~ 0.0956 0.0560 ~ 0.0888 0.0618 ~ 0.2134 0.0582 ~ 0.1794
22
Mid-America Earthquake CenterMid-America Earthquake Center

(a) Contour map for horizontal ground motion (b) Contour map for vertical ground motion Figure 4.17 Contour PGA maps for affected region using attenuation relationship (soft soil) by
Campbell et al (2003) The predictions for severely damage areas are given Table 4.5. Contour maps for
horizontal and vertical ground acceleration are generated using the presumed fault and attenuation relationship by Campbell et al (2003) with mean value of PGA for soft soil, and shown in Figure 4.17. The dimensions of the presumed fault rupture are estimated as 20 km long and 10 km for wide as explained in Section 4.3. It is noted that the PGA values in the vicinity of the fault, such as in Bantul, are significantly higher than elsewhere. Considering the dispersion in PGA, the maximum horizontal ground motion accelerations are 0.49g and 0.41g for Bantul and Yogyakarta City, respectively. In the case of vertical ground motion, the PGAs are 0.47g and 0.38g. The ratios of vertical to horizontal PGA are 0.96 and 0.93 for Bantul and Yogyakarta City, respectively. Those values are exceptionally high compared with 0.6~0.67 which most seismic design code adopt, with the exception of EC8 and the Egyptian Loading Code. Early reports and observations by Indonesian colleagues from Bandung Institute of Technology (Hoedajanto, 2006) about the significance of the vertical motion are therefore confirmed.
It is of utmost importance to note that the above evaluation does not include near-source effects in their entirety. Due to the vicinity of the presumed fault to the densely populated region that has been so severely affected, near source effects on attenuation and shaking intensity may be significant.
4.5 IMPLICATIONS ON EARTHQUAKE HAZARD
The complex tectonic setting described in Section 4.1 leads to complex implications for the seismic exposure of Indonesia. Also, lessons learned from the Great Sumatra earthquake of December 2004 are of relevance in commenting on hazard in Java.
The rupture region of the December 2004 earthquake enveloped, or re-ruptured, segments of the subduction zone that were ruptured in previous earthquakes and that
23
Mid-America Earthquake CenterMid-America Earthquake Center

24
Mid-America Earthquake CenterMid-America Earthquake Center
have not built sufficient slip to indicate maturity to cause an earthquake (Bilham et al, 2005). Moreover, it was observed that earthquakes on the northern segment of the Indo-Australian-Eurasian subduction zone have unpredictable return periods (Sieh et al, 2004). It is postulated in the latter reference that due to unknown reasons, earthquakes happen in couplets, separated by a few decades. The separation between each pair does not account for the large magnitudes of the earthquakes. For example, two major earthquakes of magnitudes 8.4 and 8.7 occurred in 1797 and 1833, respectively. The 1797 event had one forth of the slip of the later event. Therefore, the locked-in strain was not released in the first earthquake, leading to a major earthquake on the same segment of the fault only 36 years later. Therefore, it is conceivable that a powerful earthquake nucleating on the east-west segment of the subduction zone would also envelope segments of the fault that has rupture before, or recently, regardless of their observed slip rates. It is concluded that there are potentially three sources of future earthquake hazard in the Island of Java, as follows:
• Shallow earthquakes in the overriding plate due to the deformation of the latter as
the subducted plate applies non-uniform frictional forces at the interface between the two plates. These earthquakes would have mainly strike-slip or normal faulting, and its magnitude would be in the range of 6.0-6.5 (e.g. 27 May 2006).
• Deep thrust earthquakes associated with the subduction zone and filling gaps left by historical earthquakes. From a study of historical seismicity, the magnitudes of these earthquakes are likely to be in the range of 7.0-7.5 (e.g. 11 September 1921).
• Deep thrust earthquakes as above, but mobilizing very large segments of the subduction region, even those that have not theoretically built up sufficient strain to cause fracture in their own right. The magnitude of such earthquakes may be above 8.0 (e.g. 25 December 2004).
Due to the dearth of measured data from the recent earthquake, and the sparsely
spread Indonesian BMG network, insufficient information exist to constrain the above magnitudes and determine return periods. However, the existing geological and tectonic evidence, and the recently observed activity, lends weight to the assessment provided above of future seismic exposure of the Island of Java. The probability of occurrence of one of the above postulated scenarios poses considerable risk. The cumulative probability of occurrence of one of the three possible scenarios is high. The risk is compounded by the fact that very densely populated locales exist in the forearc region, which includes the debris from the subduction mechanism. Such relatively soft sediments tend to amplify the motion and elongate the duration of shaking, thus compounding the expected damage.
5. BUILT ENVIRONMENT LOSSES
5.1 RESIDENTIAL BUILDINGS
The most severely affected areas were Bantul in the Province of Yogyakarta and Klaten in Central Java. According to an early report (BAPPENAS, 2006), a total 5,716 people died while 37,927 people were injured. Of the total death toll, 4,121 occurred in Bantul, while 1,041 died in Klaten district. A total of 156,664 housing units were totally destroyed as described in Section 3. The high level of damage is mainly due to the high density of the population (1600 persons/sq.km) and the almost complete lack of seismic design provisions.
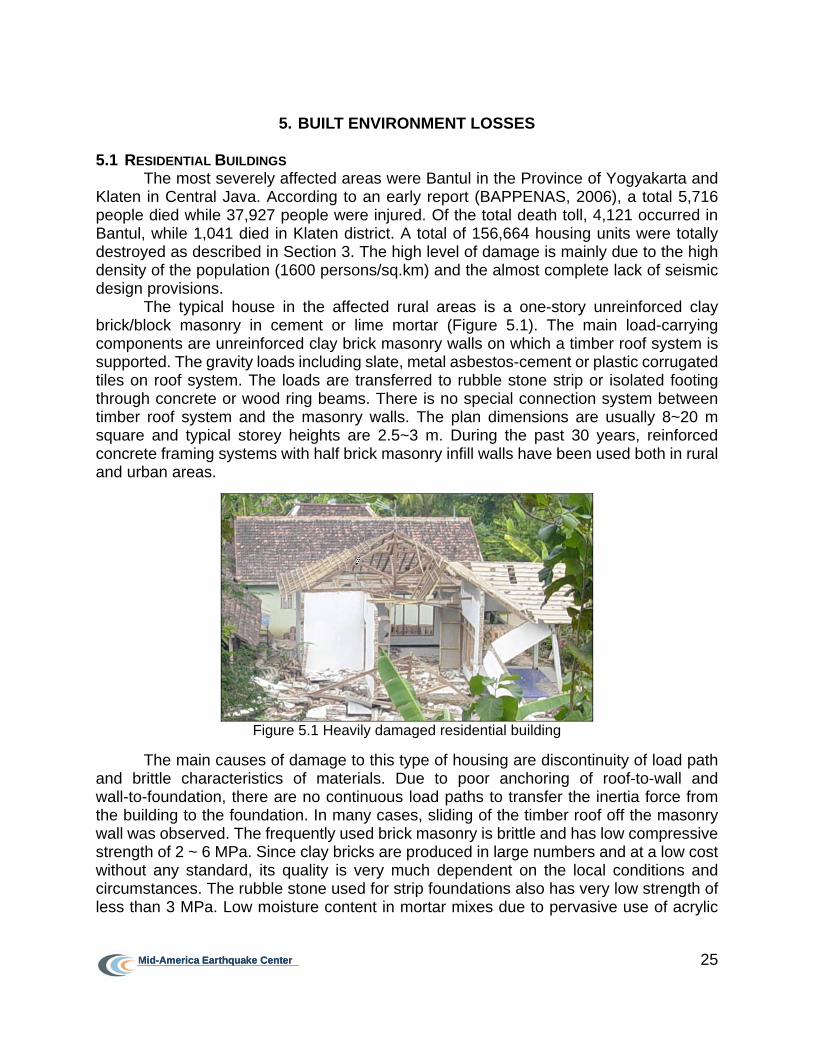
The typical house in the affected rural areas is a one-story unreinforced clay brick/block masonry in cement or lime mortar (Figure 5.1). The main load-carrying components are unreinforced clay brick masonry walls on which a timber roof system is supported. The gravity loads including slate, metal asbestos-cement or plastic corrugated tiles on roof system. The loads are transferred to rubble stone strip or isolated footing through concrete or wood ring beams. There is no special connection system between timber roof system and the masonry walls. The plan dimensions are usually 8~20 m square and typical storey heights are 2.5~3 m. During the past 30 years, reinforced concrete framing systems with half brick masonry infill walls have been used both in rural and urban areas.
Figure 5.1 Heavily damaged residential building
The main causes of damage to this type of housing are discontinuity of load path
and brittle characteristics of materials. Due to poor anchoring of roof-to-wall and wall-to-foundation, there are no continuous load paths to transfer the inertia force from the building to the foundation. In many cases, sliding of the timber roof off the masonry wall was observed. The frequently used brick masonry is brittle and has low compressive strength of 2 ~ 6 MPa. Since clay bricks are produced in large numbers and at a low cost without any standard, its quality is very much dependent on the local conditions and circumstances. The rubble stone used for strip foundations also has very low strength of less than 3 MPa. Low moisture content in mortar mixes due to pervasive use of acrylic
25
Mid-America Earthquake CenterMid-America Earthquake Center

and weather shield paint contributes to the brittleness of the mortar. The most salient damage features of non-engineered buildings were:
1) Failures at corners of walls and at doors and window openings 2) Roof system sliding off the supporting walls 3) Shear, flexural or combined cracking of masonry brick walls 4) Failures at connection regions between roof, wall and foundations According to a preliminary damage and loss assessment report (BAPPENAS,
2006), more than 90% of the total damage of housing occurred in the four rural districts of Bantul, Klaten, Sleman, and Gunung Kidul. The MAE Center field survey confirmed the above and observed that damage varied very widely even within the same block, indicating that a main culprit is the inconsistent quality of construction.
Figure 5.2 Housings on the hillside of mountain at Nglepen – Sengir (Sumberharjo village), north
of Opak fault (S7° 49.02’-E110° 30.371’ and altitude of 422 m)
Figure 5.2 shows two totally collapsed buildings that are located at Nglepen - Sengir. The two buildings were constructed on a mountainous mild slope where nearby ground settlement was observed, possibly due to a collapsed karst or a distant slope instability.
Considering that most housing units in rural areas are built by local contractors or even the owners, it is very important to raise the community awareness of the need for seismic resistant design under the control of qualified technicians, as discussed in the Recommendations section of this report.
5.2 COMMERCIAL BUILDINGS
Most of the commercial buildings damaged in the affected areas are engineered multi-story reinforced concrete structures. Although the Indonesian building code includes seismic design provisions, a number of buildings are non-ductile reinforced concrete structures with masonry infills consisting of solid brick or concrete block.
Figure 5.3 shows the damage inflicted on the GOR (Gedung Olah Raga - Among Rogo) Sport Stadium, in Yogyakarta which is a two story high reinforced concrete structure. The main collapse mechanism is the failure of perimeter columns by inward flexure, under the downward inertia load effect of the heavy truss roof. The steel truss carried exceptionally heavy roof titles, perhaps 3 or more kilograms each. As shown in
26
Mid-America Earthquake CenterMid-America Earthquake Center

Figure 5.3 (b), local buckling, tearing and separation of partial truss members were observed. Figure 5.4 and Figure 5.5 show that flexural hinges of the columns are visible either at the joint with slab or at the connection with beams. The failure of the flexural hinges was caused by insufficient spacing of ties, insufficient splice length, use of smooth bars, and poor quality of concrete. Severe non-structural damage in the infill walls was also observed.
(a) Overview of GOR Sport Stadium (b) Collapse of roof truss system
Figure 5.3 Damage of GOR Sport Stadium (S 7° 47.901’-E110° 23.007’ altitude 450 m)
(a) Column failures (b) Close view of flexural damages at column
Figure 5.4 Damage of columns at the second storey, GOR Sport Stadium
As explained previously, the observed failure mechanism is that the damaged columns of the second story were mostly bent inwards. This may be due to the vertical ground motion leading to very high vertical forces applied on the heavy roof resulting in the inwards failure of all perimeter columns. According to back-calculations with dimensions of severely damaged column sections and the roof system measured on site, a range of vertical ground accelerations could be obtained with consideration of material variability. The material strengths were considered as 17.1 to 27.6 MPa for concrete compressive strength (f’c) and 310.0 to 520.0 MPa for reinforcement yield strength (Fy). Figure 5.5 shows the calculated lower and upper limits of moment capacity of columns and the required vertical ground accelerations to reach the moment capacity. For example, the calculated vertical ground accelerations were 0.183g for the lower limit of flexural resistance (589 kN-m) and 0.30g for the upper limit of flexural resistance of 977 kN-m. 27
Mid-America Earthquake CenterMid-America Earthquake Center
0
200
400
600
800
1000
1200
0 0.0002 0.0004 0.0006 0.0008 0.001 0.0012Curvature
Mom
ent (
kN-m
) Lower Limit in Material Uncertainty
Upper Limit in Material Uncertainty
A-A Section
pM 589 kN m= −
pM 977 kN m= −
0
200
400
600
800
1000
1200
0 0.0002 0.0004 0.0006 0.0008 0.001 0.0012Curvature
Mom
ent (
kN-m
) Lower Limit in Material Uncertainty
Upper Limit in Material Uncertainty
A-A Section
pM 589 kN m= −
pM 977 kN m= −
A-A Section
pM 589 kN m= −
pM 977 kN m= −
2.32
9 m
49.3 m
A A
Wmass =4.944x10⁻² kN s2/m
g0.183 g X 0.3 g≤ ≤
2.32
9 m
49.3 m
A A
Wmass =4.944x10⁻² kN s2/m
g0.183 g X 0.3 g≤ ≤ (a) Moment-curvature curve of column section (b) Flexural damages at the column
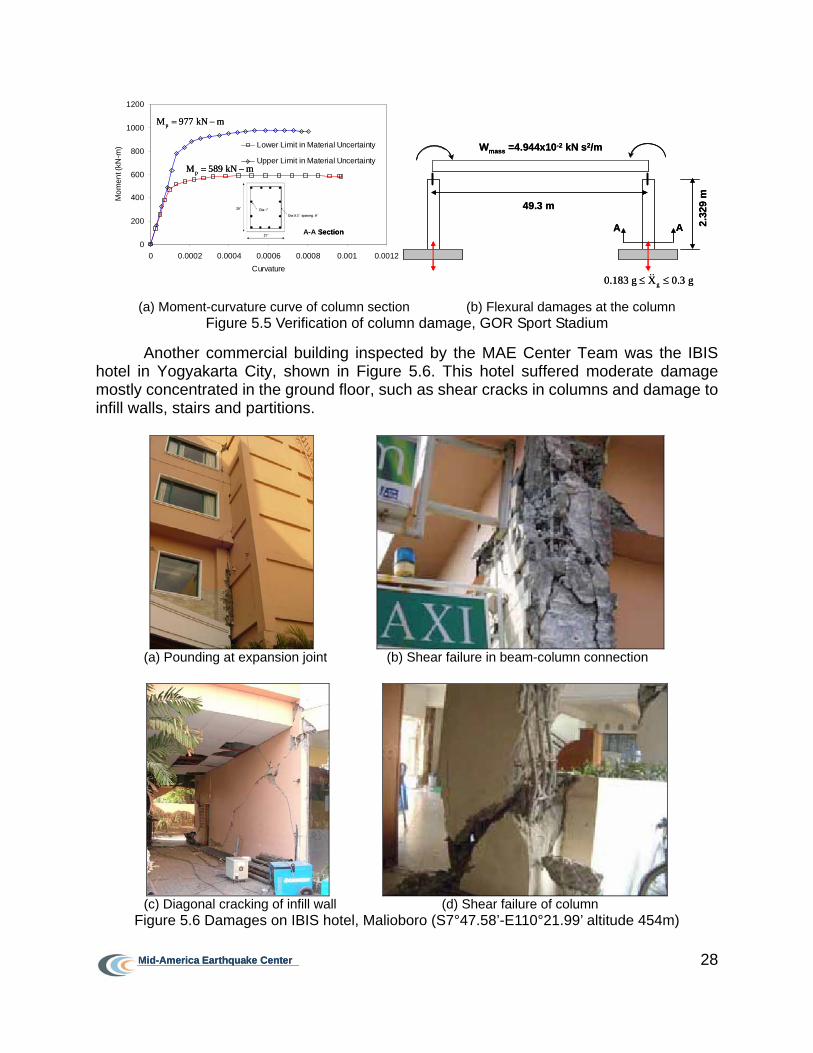
Figure 5.5 Verification of column damage, GOR Sport Stadium Another commercial building inspected by the MAE Center Team was the IBIS
hotel in Yogyakarta City, shown in Figure 5.6. This hotel suffered moderate damage mostly concentrated in the ground floor, such as shear cracks in columns and damage to infill walls, stairs and partitions.
(a) Pounding at expansion joint (b) Shear failure in beam-column connection
(c) Diagonal cracking of infill wall (d) Shear failure of column
Figure 5.6 Damages on IBIS hotel, Malioboro (S7°47.58’-E110°21.99’ altitude 454m)
28
Mid-America Earthquake CenterMid-America Earthquake Center

Pounding damage was also observed between two parts of the building that were separated by an expansion joint, as shown in Figure 5.6 (a). Brittle shear failure of the beam-column connection was observed as shown in Figure 5.6 (b). Even though there were enough ties, the column showed brittle failure because of overstressing and the poor quality concrete. Figure 5.6 (c) shows diagonal cracks of the non-structural infill wall which started at the discontinuity joint. Figure 5.6 (d) also shows one of the frequently-observed column failures caused by compressive axial and shear interaction. When the site was visited, rehabilitation was underway.
5.3 EDUCATIONAL BUILDINGS
Yogyakarta is one of the major provinces of concentration of universities, secondary and primary schools in Indonesia. According to early report (BAPPENAS, 2006), in Yogyakarta, 2,155 educational facilities were heavily damaged or totally collapsed. Bantul district was the most severely affected area with 949 or 90% of the damaged educational buildings. In Central Java, 752 buildings were damaged or destroyed. Klaten district had the highest level of damage in this province, with 64 buildings destroyed and 257 buildings severely damaged which is 38% of the buildings in the district.
(a) Front view (b) Failure of roof
(c) Damage of second floor (d) Smooth bars in the column
Figure 5.7 Damage of Multipurpose Building, UIN (S7° 47.162’-E110° 23.574’) The first educational institution inspected by the MAE Center Team was the
National Islamic University (Universitas Islam Nasional - Sunan Kalijaga). Most of the buildings in this University campus were under construction and most of the damage was 29
Mid-America Earthquake CenterMid-America Earthquake Center

observed on roofs and non-structural elements. Figure 5.7 shows the Multi-purpose Building which was one of the most severely damaged in the complex. The roof has collapsed and the second floor columns failed. Figure 5.7 (d) indicates that smooth bars were used hence bond slip may have contributed to the failure.
One of the most severely damaged buildings in Yogyakarta City is the Indonesian
Art Institute (IAI - Institut Seni Indonesia) shown in Figure 5.8 to Figure 5.11. Figure 5.8 shows the original design drawing and indicates that the left and right parts of this building are almost identical. Notwithstanding, whilst the first storey of the left part totally collapsed as shown in Figure 5.9, the right part was only partially damaged. As shown in Figure 5.10 and Figure 5.11, the exterior column of the right part failed in shear, whilst the exterior and interior columns of the left part failed by shear and axial distress. Therefore, it is concluded that the left columns failed first followed by the exterior right columns. Since this building was almost symmetric based on the drawings, it is difficult to find the failure source. The shear failure of the left columns may have been caused by short column effect due to the existence of the non-structural panel.
Figure 5.8 Elevation of IAI from design drawing
(a) Front view (b) Side view, left
Figure 5.9 Front and side views of IAI (S7° 51.076’-E110° 21.468’)
30
Mid-America Earthquake CenterMid-America Earthquake Center

(a) Exterior left column (b) Exterior right column
Figure 5.10 Failure of exterior columns in IAI
(a) Failure of interior columns (b) Closeup of failed column, left
Figure 5.11 Failure of interior columns in IAI
Another educational institution inspected by the MAE Center Team was the University of Economic Science (STIE – Sekolah Tinggi Ilmu Ekonomi Kerja Sama). There were two almost identical buildings on same site, while the damage levels were very different. Figure 5.12 shows that the first storey of the left building collapsed by soft storey while the right building sustained heavy roof damage.
(a) Heavy damage by soft story at left site (b) Survival with minor damage at right site
31
Mid-America Earthquake CenterFigure 5.12 Failure of STIE campus (S7° 49.630’-E110° 22.063’)
Mid-America Earthquake Center

(a) Front view (b) Back view
Figure 5.13 Soft first storey of the left building in STIE
(a) Damage due to short column effect (b) Smooth bars in column
Figure 5.14 Short column effect and sub-standard materials in STIE Figure 5.13 clearly depicts the soft first storey failure of the left building whilst
Figure 5.14 shows the short column failure and the use of smooth bars in construction.
5.4 PUBLIC BUILDINGS The economic losses due to damage of government structures public
administration buildings in Yogyakarta and Central Java province is estimated to have reached $15Million (BAPPENAS, 2006). The MAE Center Team investigated the Finance and Development Audit Agency (BPKP – Badan Pengawasan Keuangan dan Pembanguan) which partially collapsed. It is the most severely damaged structure among public buildings in Yogyakarta City. Figure 5.15 shows the overall layout of BPKP which is a 3-storey RC structure. Whereas half the building suffered collapse, the other has sustained only minor damage. The partial collapse may have been caused by failure of the biaxially loaded corner column. The corner column would have also been subjected to large shear forces from rotation of the building due to plan irregularities. Figure 5.16 shows the failure of beam-column joint and an 8 in gap between left and right parts of the building.
32
Mid-America Earthquake CenterMid-America Earthquake Center

(a) Entire view (b) Collapsed right side of building
Figure 5.15 Overall view of BPKP (S7° 50.692’-E110° 21.688’)
(a) Failure at beam column joint (b) 8” gap between left and right parts of building
Figure 5.16 Collapsed column and gap between left and right parts of building
5.5 BRIDGE STRUCTURES Roads and bridges of about 49 km were affected by the earthquake. Minor
disruption resulted, since the damage was rather light. Bridge structures experienced slight damages, mostly cracking and crushing at the expansion joint by pounding. Cracking of abutments, settlement of approach embankment, and permanent movements of the deck both in longitudinal and transverse directions were observed.
Figure 5.17 shows the damage of the Winongo Bridge in Yogyakarta City. It is a warren truss bridge with a deck. The bridge experienced slight damage at the expansion joint that did not cause closure. There was conspicuous movement of the deck in the longitudinal direction, confirmed from the deformation of the rubber bearing as shown in Figure 5.17(b). Sliding of an embankment and heavily damaged residential housings was observed in the vicinity of the structure.
33
Mid-America Earthquake CenterMid-America Earthquake Center

(a) Overview of Winongo Bridge (b) Evidence of deck movement
(c) Cracking of abutment (d) Settlement of approach embankment Figure 5.17 Winongo Bridge (S7°50.46’-E110°20.88’ altitude 342 m)
The MAE Center Team also inspected an overpass structure (Figure 5.18). Visual
inspection of the bridge confirmed that was serious damage from the earthquake. The cause of the damage was thought to be due to pounding between the bridges as Figure 5.18 show no gap between the adjacent structures. However, Inspection of the design drawings obtained from the designers (Figure 5.19) showed that the different gap sizes were in the original design.
(a) Overpass bridge (b) Gap between bridge decks
Figure 5.18 Overpass bridge in Yogyakarta City (S7°47.19’-E110°24.62’ altitude 507 m) 34
Mid-America Earthquake CenterMid-America Earthquake Center

100 228100 228
Figure 5.19 Designed distance of gap between bridge decks
35
Mid-America Earthquake CenterMid-America Earthquake Center

6. GEOTECHNICAL EFFECTS
Provided herein is an overview of the geotechnical effects observed by the MAE
Center Team. It should be noted that these effects were not overwhelming in this earthquake; and in the affected region, landslide was the most dominant ground failure observed. However, site response is postulated to have been one of the most influential parameters in precipitating the extensive damage observed. As pointed out in earlier sections of this report, the region affected lies on debris from the subduction mechanism, hence amplification of horizontal shaking, as observed in the high amplification ratios (ground acceleration-to-spectral acceleration), must have played a significant role in the widespread destruction observed.
6.1 LANDSLIDES
The landslide shown in Figure 6.1 occurred at Nglepen - Sengir (Sumberharjo village, Prambanan). Based upon visual inspection and discussions with local residents the affected area was approximated to be 500 meters long, 30 meters wide, and 30 meters deep. However, it is not clear whether the landslide was triggered solely by the earthquake. Researchers from Gajah Mada University reported the existence of karstic cavities within the area. Moreover, a water-way had been observed near the area following the earthquake (Ehime University, 2006). These findings thus support speculation that the earthquake caused the collapse of an underground cavity near the area that in turn triggered the landslide.
Figure 6.1 Landslide at Nglepen - Sengir (S7°49.02’ - E110°30.371’ - 422m altitude)
6.2 LIQUEFACTION The MAE Center Team did not observe first hand evidence of liquefaction during
the site visit. However, it was reported that liquefaction occurred in several places including Imogiri and further north to Sleman and Klaten (Unjianto, 2006). Additionally, local residents reported liquefied sediments being ejected through ground fissures during the earthquake. Therefore, it could be concluded that liquefaction occurred in several locations; however, its effects were minimal.
36
Mid-America Earthquake CenterMid-America Earthquake Center

6.3 FOUNDATIONS In several areas building foundations were severely affected by ground
deformation caused by the landslide. Figure 6.2 shows a combination of ground slumping and landslide on the hillside at north of the OPAK fault. Housing units built on the hillside were heavily damaged or totally collapsed due to ground failure. Figure 6.3 (a) shows large ground cracks running through the village whilst Figure 6.3 (b) shows complete collapse of housing units.
(a) View from starting point of ground slumping (b) Complete collapse by ground slumping Figure 6.2 Ground slumping at Nglepen - Sengir (Sumberharjo village), north of OPAK fault (S7°
49.02’-E110° 30.371’ and altitude of 422 m)
(a) Ground cracks near residential area (b) Collapsed house
Figure 6.3 Housing collapsed by ground failures
37
Mid-America Earthquake CenterMid-America Earthquake Center

7. VOLCANIC ACTIVITY
7.1 HISTORICAL PERSPECTIVE
Merapi volcano was created in the period of late Pleistocene - early Holocene. As
shown in Figure 7.1, it is situated at the intersection between two main volcanic alignments; Ungaran - Telomoyo - Merbabu - Merapi (north to south) and Lawu - Merapi - Sumbing - Sindoro - Slamet (east to west). Among these volcanoes, Merapi is the youngest.
Figure 7.1 Two main volcanic alignments in Central Java and the location of Merapi volcano
Merapi volcano is situated above the subduction zone between the Eurasian and
Australian tectonic plates. From presently available data, it is not clear if there is a direct link between the May 27 earthquake and the ongoing eruption of the volcano Merapi which is several tens of kilometers to the north. The occurrence of shallow-focus earthquakes near volcanoes is not unusual worldwide (USGS, http://www.usgs.gov/). Sometimes the association of earthquakes and volcanic eruptions is so close in space and time that it is clear that the earthquakes are triggered by the magmatic processes that caused the eruption. In many cases earthquakes occur in the general vicinity of volcanoes, however, there are no obvious links between the two geological effects. In such cases, the general spatial association of volcanoes and earthquakes is probably due to both seismic and magmatic phenomena being localized by a broader tectonic process
Merapi volcano has been active for many years. In the early stage of its growth, it had a basaltic magma with effusive eruptions (Beauducel, 1998). The characteristics of magma then change to more silicic and more viscous. Lava extrusion may be effusive or explosive. Recently, magma from Merapi has been quite viscous so that it extrudes and accumulates at the crater surface as a lava dome. Merapi activity is characterized by very frequent eruption ranging from 1 to 5 years of time duration, weak explosion, and low gas 38
Mid-America Earthquake CenterMid-America Earthquake Center

pressure. Figure 7.2 illustrates the eruption activity of Merapi since 1768. Black intervals stand for explosions preceded and/or followed by near-continuous lava extrusions, like flows or domes. The average duration of eruption periods equals 1.6 year, those of inactivity are 6 years. The augmentation of activity through the years is probably due to lack of information in the earlier time.
Figure 7.2 Eruptive activity of Merapi Volcano since 1768 (Beauducel, 1998).
7.2 RECENT ERUPTION
The most recent eruption before the 2006 activity was in 1992, lasting for ten years. Since the eruption started in 1992, lava dome had been continuously extruded growing almost half a meter per day. In 1994, the entire collapse of lava dome generated pyroclastic flows which traveled several kilometers from the summit and killed 43 people. After the 1994 eruption, lava avalanches and pyroclastic flow had continued forming a new lava dome in the crater until the eruption activity calmed down in the late 2002. Recently, in April 2006, the eruption began again. On April 19, 2006, smoke from the summit reached a height of 400 meters and on April 23, 2006, nine tremors were detected which signaled significant magma movement. In early May, active lava flow had begun and authorities put neighboring villages on high alert to have residents prepared for a likely evacuation.
Figure 7.3 Mount Merapi in Central Java, Indonesia (Photo Courtesy of English Wikipedia)
39
Mid-America Earthquake CenterMid-America Earthquake Center

Figure 7.4 Mount Merapi from Space (August 24, 2003). Image courtesy of the Image
Science & Analysis Laboratory, NASA Johnson Space Center (http://eol.jsc.nasa.gov) Although it is not clear that the series of recent eruptions are directly linked with the
earthquake, high alert level of 4 for Merapi has been kept after the earthquake. The residents of the region therefore have to contend with both earthquakes and a volcano for years to come, thus complicating the risk management scene in Central Java.
40
Mid-America Earthquake CenterMid-America Earthquake Center

8. HISTORICAL MONUMNETS AND HERITAGE
8.1 PRAMBANA
The temple complex was built during the Sanjaya Dynasty in the 9th century. The general layout is shown in Figure 8.1. The central area has three main temples according to the Hindu Trinity - 'Vishnu' facing to the North, 'Shiva' in the centre, and 'Brahma' to the South. Facing each of these temples is a smaller shrine for their symbolic vehicles. The vehicle of Shiva (the Destroyer) is Nandi the bull, the vehicle of Vishnu (the God creator) is the Garuda eagle, and, Brahma (the Guardian god) has a vehicle of the swan, Angsa. Each temple has its own smaller courtyard. The main temple Vishnu, situated in the inner courtyard, is surrounded by smaller temples called Pewara temples. These temples were apparently built, and given as gifts to the king as acknowledgement of his regency. The grounds and lawn are well kept, and scattered with stones of smaller temples yet to be reconstructed. Walls of varying height can be seen around the complex, even though most are in fragmented. There are well over 250 smaller temples in the complex spread out on the Prambanan plain.
Figure 8.1 Layout of Prambanan Temple complex (UNESCO, 2004)
The temple was re-discovered in 1818, apparently after being covered in volcanic ash from Mount Merapi volcano (Section 7) for hundreds of years. Figure 8.2 shows a general view of the state of the Temple prior to the 27 May 2006 earthquake. Around the turn of the 19th to the 20th century the temple and its reliefs were photographed many times and for the purpose of better visibility of the reliefs they were over-painted with an ochre colored paint by a Dutch archeologist from Leiden University. This paint remains one of the most serious causes of deterioration in the reliefs; a problem as yet unresolved.
Originally all temples were built in dry masonry, with the stones interlocking by a type of traditional groove construction called “nat”. 41
Mid-America Earthquake CenterMid-America Earthquake Center

Figure 8.2 General view of Prambanan Temple complex
Candi Siwa was the first part to be reconstructed in a more comprehensive manner; started 1918 and lasted until 1953, when Candi Siwa (Shiva) was formally inaugurated. This restoration considers mainly static (gravity) loads and reinforced concrete was used without isolation from the rest of the building materials. The original voids of the ‘nat’ method were filled with concrete, and surface painted to camouflage the new material. The water-soluble parts of the concrete lead to one of the main conservation problems at Prambanan temple today. Decades later, the reconstruction of the other temples followed: Brahma temple (1987), Wisnu (Vishnu) temple (1991) and the three Wahana (vehicles) temples; namely Garuda, Nandi and Angsa. Some smaller temples were also restored in 1993 (UNESCO, 2004). All restoration used reinforced concrete, but later efforts included isolating the concrete from the original structure using araldite tar. Voids that used to be filled with concrete during the first phase of the restoration were filled with an epoxy-sand mix to avoid the water-soluble material known to be the cause of the problems. Other mechanisms of restoration were used; no documentation was found by the MAE Center Team, but visual inspection indicated the use of steel dowels to avoid toppling and slip, as discussed hereafter.
In 1991, the site was declared a World Heritage Site, a status that befits its immense history and significance to the Hindu culture. It is interesting that the UNESCO investigation of the two sites, from which most of the information above is taken, does not mention earthquake hazard in any way. Taking into account the well known seismic hazard in Central Java, this was a costly oversight, as confirmed by the effect of the 27 May 2006 earthquake on Prambanan, briefly described below.
By the time of the field investigation many of the collapsed parts of the Temple were removed. A representative condition of one of the temples is shown in Figure 8.3.
42
Mid-America Earthquake CenterMid-America Earthquake Center

Figure 8.3 Observed state of damage of Prambanan Temples
As mentioned above, evidence of use of steel dowels were observed by the MAE Center Team. In Figure 8.4 such evidence is shown, where a steel bar is shown, circled in yellow. This seems to be an ad hoc intervention, and local guides were not aware of the history or extent of such works. In general, the locals, even the official guides, knew very little indeed about the history of the monument.
Figure 8.4 Damage to Prambanan and previous retrofitting with steel dowels
43
Mid-America Earthquake CenterMid-America Earthquake Center

The site investigation team also noted heavy damage to internal voids in some of the temples, as shown in Figure 8.5.
Figure 8.5 Evidence of internal heavy damage; stones shown on the staircase
In general, damage to the Prambanan was extensive, and many parts of the temples are currently precariously tilted and scantly supported. The status of this invaluable cultural and religious monument is critical. Immediate and concerted action is therefore needed. Taking into account that the MAE Center Team estimates of ground acceleration at the site is in the range of 0.20~0.34g, this is by now means a worst case scenario. Future earthquakes may result in much higher accelerations and therefore may cause immense damage that could be beyond reasonable repair.
8.2 BOROBUDUR Borobudur, one of the greatest Buddhist temples in the world, is located in the
Indonesian province of Central Java, about 40 km north-west from Yogyakarta, on a plateau that is the caldera of an ancient volcano ringed by the Menoreh mountain.
Borobudur, shown in Figure 8.6, is built as a single large stupa from about two-million stone blocks of andesite, a gray volcanic stone. The foundation is a square, 118 meters on each side. It has eight levels, of which the lower five are square and the upper three are circular. The upper level features seventy-two small stupas surrounding one large central stupa. The relief panels at the base and the next five levels of the temple depict a branch of Buddhism known as Mahayana Buddhism. Borobudur is one of the most popular tourist attractions in Indonesia, and it is still a place of prayer and pilgrimage.
44
Mid-America Earthquake CenterMid-America Earthquake Center

Figure 8.6 Borobudur Temple
The colossal relic of Borobudur temple was built by Sailendra dynasty between 750 and 842 AD. For centuries, Borobudur lay hidden under layers of volcanic ash and jungle growth. Sir Thomas Stanford Raffles, the British Governor of Indonesia, revealed the temple in 1814. The massive restoration project was carried out from 1907 to 1911 led by the Captain/Major of engineers Theodoor Van Erp. In the period 1973–1984 the next restoration effort was carried out under the guidance and financing of UNESCO. The temple has since been listed as one of UNESCO’s World Heritage Sites.
Initial reports suggest that Borobudur remains undamaged from the earthquake and also the team did not observe any indication of damage from the earthquake during the visit.
45
Mid-America Earthquake CenterMid-America Earthquake Center

46
Mid-America Earthquake CenterMid-America Earthquake Center
9. SOCIAL AND ECONOMIC CONSEQUENCES
9.1 IMPACT ON EDUCATION The Province of Yogyakarta is a major education center in Indonesia, with a high
concentration of universities, secondary schools, and primary schools (BAPPENAS, 2006). According to the latter report, the earthquake has had a major impact on the education sector. The impact has also been felt in the neighboring province of Central Java.
The joint report also stated that the quality of the school buildings was a major aspect in the high level of destruction. Many social sector buildings, in particular elementary schools in rural areas, were built in the 1970s with special government grant funds in a fast-track construction phase to accommodate increasing demand of elementary schools following major improvements in infant and child mortality rates. Maximizing the use of funds for the growing number of school children took priority over conformity with building codes and other safety standards.
Table 9.1 summarizes the level of damage and losses in the education sector in the Province of Yogyakarta and Central Java province. The total damage and losses in the education sector in these two provinces are estimated at Rp 1.74 trillion. Loss estimates include the cost of temporary school facilities, recruitment and training of new teachers, payment of temporary teachers, clean-up, and counseling.
Table 9.1 Summary of damage and losses in the education sector, Rp billion (BAPPENAS, 2006)
Effects Ownership Damages
Buildings Equipment Sub-totalLosses Total Public Private
Central Java 317 3 320 12 332 244 88 Yogyakarta 1,304 59 1,363 44 1,407 910 497
Total 1,621 62 1,683 56 1,739 1,154 585
9.2 IMPACT ON HEALTHCARE According to the joint report (BAPPENAS, 2006), the health status of the Province
of Yogyakarta was among the best in the country, followed closely by Central Java province, especially in districts adjacent to Yogyakarta City. The Human Development Index (HDI) for Yogyakarta province is higher than the national average. For instance, average life expectancy had been 73.0 years in Yogyakarta in 2002 compared with 67.8 in Indonesia and infant mortality rate was 23.3 per thousand live births for Yogyakarta in 2004 compared with the national average of 35. This is attributed to high quality education and healthcare services in Yogyakarta province. On the other hand, most of the HDI index for Central Java province is closer to the national average. An important feature of health services in these areas is the dominant role played by the private sector, which delivers more than two-thirds of ambulance response and the majority of hospital care.

47
Mid-America Earthquake CenterMid-America Earthquake Center
The earthquake has had a significant impact on the health care sector in Yogyakarta and Central Java province (BAPPENAS, 2006). The earthquake has damaged 17 private hospitals in Yogyakarta City and has caused slight damage to one public hospital in Klaten district, Central Java. In the Province of Yogyakarta, 41 private clinics were recorded as being damaged or destroyed and 1,631 private home practices were affected. From a total of 117 health centers in the Province of Yogyakarta, 45 were destroyed, 22 were severely damaged, and 16 were slightly damaged. In Klaten district, Central Java, two health centers were destroyed, seven were severely damaged, seven were slightly damaged, and the loss of one mobile health clinic was recorded. Magelang and Boyolali districts in Central Java province suffered severe and slight damage to some health centers. In the Province of Yogyakarta, from 324 health posts, 73 were destroyed, 35 were severely damaged, and 42 were slightly damaged. In Central Java province, eight health posts were destroyed, 25 were severely damaged, and 19 were slightly damaged in Klaten district; and then four health posts were destroyed and one was slightly damaged in Sukoharjo district. Three maternity posts were destroyed in the Province of Yogyakarta. Damage to public primary health service units (health centers, health posts, maternity posts, and health personnel quarters) was greatest in the districts of Bantul, Gunung Kidul, Sleman, Klaten, and Sukoharjo.
Table 9.2 Summary of damage and losses in the health sector, Rp billion (BAPPENAS, 2006)
Province and District Damage Loss Total Yogyakarta 1408.059 14.636 1422.695 Sleman 198.237 1.487 199.724 Bantul 418.380 4.449 422.829 Gunung Kidul 169.115 1.147 170.262 Yogykarta 604.400 7.420 611.820 Kulonprogo 17.927 0.133 18.060 Central Java 101.969 6.004 107.973 Klaten 15.291 0.403 15.694 Other Districts 86.678 5.601 92.279 Total 1510.028 20.640 1530.668 Table 9.2 summarizes the level of damage and losses in the healthcare sector in
the two provinces of Yogyakarta and Central Java. The total damage is estimated at about Rp 1.5 trillion, and the estimated losses are about Rp 21 billion. About 65% of these total damage and losses is suffered by private practices and hospitals.
9.3 SOCIAL IMPLICATIONS
More than 8.3 million inhabitants in 11 districts were affected by the earthquake of May 2006. The area is geographically limited but densely populated. The destructive earthquake resulted in over 5,700 deaths, almost 38,000 people injured and nearly157,000 houses destroyed.
According to estimates by preliminary damage and loss assessment (BAPPENAS, 2006), more than 3,982 Rp Billion losses were incurred in the social services sectors and more than 9,025 Rp Billion losses were incurred in the productive sectors. The joint losses in the two sectors made up almost 45% of the total damages and losses. Considering the fact that services and trade jointly made up 39% of regional GDP in 2004,

48
Mid-America Earthquake CenterMid-America Earthquake Center
the hardest hit on both of the two sectors will result in significant loss of jobs (approximately 130,000 jobs) and increase of poverty rate in the affected area. The future employment situation will depend on the reconstruction efforts. In order to inject more money into the local community, particular attention should be put on rebuilding of the market and market-supporting infrastructures so that they quickly emerge out of significant slow down of the economy. One of the options could be letting local contractors with a good knowledge of available local labor lead the reconstruction.
Trauma and stress levels of the residents, especially children, in the severely affected area were kept very high by the activity of Merapi volcano. Farmer workers in particular showed deep reluctance to start rebuilding their homes or work their fields. The most urgent need for people was to ensure speedy recovery of basic necessities such as water and sanitation. In order to mitigate vulnerability and disaster, government-led intervention should focus on livelihood support and technical assistance for reconstruction of the infrastructure and provision of basic amenities.
9.4 ECONOMIC IMPLICATIONS
The economy of the affected area is a rather mixed scene of agriculture; 16% and industry (26%). Tourism plays also an important role in the region with almost 18% share (under trade, hotels and restaurants), whilst transportation is at 6% of the economy. It is reasonable to assume that transportation is also affected by tourism.
With about 2.2% contribution to the Indonesian GDP, the economic impact on the country is insignificant. For the local population though, the impact is profound. It is expected that over 130,000 jobs will be lost in the various sectors. Some of these will be made up for through increased construction, but the extent by which this will affect the overall break picture is not known. It is expected that there will be a large net loss of livelihood, with over 70,000 people losing their source of income. The number of households affected is just marginally less than 70,000, and the number of individuals in these households is several times that number.
Much of the local industry is related to artisan products that are marketed in other parts of Indonesia, particularly the region of Bali. Concerns over loss of market share are high in the minds of those in positions of authority in central Java. Indeed, the fact that the losses in the region constitute less than 1% of GDP on the national level is a source of concern, since no nationally-supported efforts may be forthcoming. Locally, the economic growth forecast of 5.5% for the next two years is likely to be around 1.3% (reduction of 75%) in 2006 and ~4% (reduction of 25%) in 2007. The economic consequences of this medium-sized earthquake on the local population are therefore debilitating.

49
Mid-America Earthquake CenterMid-America Earthquake Center
10. RECOMMENDATIONS
The medium magnitude 6.3 Yogyakarta earthquake of 27 May 2006 inflicted a
heavy toll on lives and livelihoods in a large region in the central part of the prosperous and heavily populated island of Java in Indonesia. The area is subjected to several sources of earthquake hazard, postulated in this report to be three, that when aggregated paint an alarming picture for the future. The region is also mainly built on soft deposits that are the product of the tectonic processes of subduction of the Australian plate beneath the Eurasian plate. Such soft deposits tend to amplify earthquake motion in a wide range of periods that envelopes the response periods of a wide range of structures and infrastructure systems. Definitive recommendations await further in-depth studies and interactions with authorities and researchers in Indonesia, and are best addressed by local people. The following preliminary recommendations for priorities and action are offered at this early stage by the MAE Center field investigation team:
Hazard • Significant expansion and acceleration of the current BMG-lead national
instrumentation program for the deployment, operation and maintenance of a dense network of digital acceleration recording stations that covers not only the southern region of Java but the entire Indonesian territory.
• Mandatory requirement for instrumenting all new projects with a minimum of sensing stations for the collection of vital response data.
• Development of a micro-zonation program for areas of special soil conditions and areas in the vicinity of known potentially active faults.
• Undertaking comprehensive seismic risk assessment studies using probabilistic seismic hazard analysis (PSHA), deterministic studies for critical sites (DSHA), and time-dependent seismic hazard assessment, leading to new and improved nationally accepted hazard maps.
Planning for Risk Management • Launching of data collection effort for all assets exposed to earthquakes. • Drawing a regional assessment, mitigation, response and recovery needs. • Development or adoption of a loss assessment software tool that is used in regional
and national scenario loss assessments for the purposes of planning of response, determination of required mitigation measures, stockpiling of required equipment and recruitment of necessary personnel, and articulating a detailed response and recovery plan of action.
Design and Construction • Adoption of two-tier policy for seismic design codes, one for detailed design of
important facilities and large civil infrastructure projects, based on the existing Indonesian code (similar to UBC 1997), latest technologies and international experience adapted to Indonesia, and the second as a set of ‘deemed-to-satisfy’ codes using local practice, regional languages, pictorial-visual presentations and no

50
Mid-America Earthquake CenterMid-America Earthquake Center
calculation requirements, for small family residences and similar structures, using indigenous materials.
• Implementation of hierarchical, self-monitored, strict construction authorization procedures. This should include continuous control of all construction and concurrent penalties on defaulting, non-conforming and random housing.
• Mandating earthquake resistant design according to the published codes. • Development of codes for seismic resistance of infrastructure and lifeline systems. • Complete and rigorous review of historical monuments in regions of this exposure,
coupled with the development of guidelines specific to retrofitting of these monuments taking into account the materials used for their construction and the interaction between environmental and earthquake impacts.
Public Awareness • Launch of awareness and risk education campaigns aimed at the public at large. • Re-education of contractors, engineers and officials entrusted with design,
construction and supervision of construction. • Development of school curricula, animated media and museum displays to ensure
that the community is risk-aware and that decisions are taken in a risk management environment.
Social Impact Reduction • Development of special policies and design procedures, with enhanced safety, for
critical facilities, primarily schools, hospitals, emergency response centers, power generation, water supply, gas supply and similar facilities that are central to the operation of a complex societal system.
• Development of a plan to respond to trauma and stress related to consequences of earthquake and volcanic eruptions.
• Development of medium and long-term plan for the sector of the population most in danger of losing the primary source of income in the case of a natural disaster.
Legislation • Backing up all the above by rigorous legislative structures and clear frameworks for
adherence and continuous monitoring. • Legislating for a complete and comprehensive framework of emergency management
professionals at the local, regional and national levels, and a clear reporting mechanism, alongside a tiered emergency preparedness plan.
• Establishing a ‘Disaster Fund’ that is used to provide regional emergency relief, and funded by a modest tax on new projects. Such funds have precedence and experience should be gained from other countries on this issue.
The above list is not comprehensive and is subject to further refinement and
articulation as more information becomes available and the needs are better defined. The investigative work continues at the MAE Center and a detailed report including several case studies will be issued in due course.
51
Mid-America Earthquake CenterMid-America Earthquake Center
11. ACKNOWLEGEMENTS
The Mid-America Earthquake Center field mission team is greatly indebted to
many individuals, universities, companies and government organizations in Indonesia for their assistance in making this visit possible and successful. Apologies are offered upfront for not having a complete record of all those who have given their time and effort so freely and who made the MAE Center Team feel welcomed and supported. First and foremost sincere thanks are due to Dr. Wendy Aritenang, Secretary General of the Ministry of Transportation of Indonesia, for facilitating the visit, arranging all necessary contacts and means of transportation, and providing invaluable support for this field mission. Mr. Supandi, from Dr. Aritenang’s office, was instrumental in streamlining all activities of the MAE Center Field Mission Team and without whom the mission would not have been as successful as it has been. The team would also like to express sincere gratitude to Dr. Indradjat Sidi, Dr. Wono Setyabudhi, and Dr. Dradjat Hoedajanto, Professors at Bandung Institute of Technology, for their help in establishing the initial contacts in Indonesia and for hosting the MAE Center Team in Bandung. Other colleagues from Bandung with whom the team exchanged thoughts are Senior Vice-Rector Adang Surahman, Head of Geotechnical Engineering Masyhur Irsyam, Business Director Bambang Budiono, Head of Center Wayan Sengara and faculty members Dyah Kusumastuti, Muslinang Moestopo and Iswandi Imran.
Special gratitude is also due to Dr. Pariatmono, Assistant Deputy Director of the Office of Science and Technology at the Ministry of Research and Technology, for hosting meetings with the Department of Research and Technology and the Meteorological and Geophysical Agency (BMG). Special thanks are also due to Dr. P.J. Prih Harjadi, Director of Geophysical Data and Information System of the Meteorological and Geophysical Agency, and his staffs for hosting the team. Thanks are due to Dr. Fauzi of BMG for his valuable presentation and subsequent advice.
Thanks are due to many individuals who have helped planning the route of the field mission, in particular to Professor Sarwidi and his assistant Mr. Gunawan from the Center for Earthquake Engineering, Dynamic Effect and Disaster Studies at the Indonesian Islamic University in Yogyakarta and officials from the Department of Public Work of the Province of Yogyakarta.
Ir. Arif Rahman from the Department of Research and Technology, Dr. Taufik Gunawan from BMG, and Mr. Gunawan, Indonesian Islamic University, joined the field observations. The significant help and information that they have provided to the team are deeply appreciated. Special thanks are also due to Messrs. Restu and Heri Gunawan from the Department of Transportation for their assistant in making and executing the travel arrangement.
The field mission was funded by the Mid-America Earthquake Center, a National Science Foundation Engineering Research Center under grant EEC-9701785. Administrative arrangements for the mission were undertaken by Deidre Bever, Sue Dotson, and Sarah Challand, all from the University of Illinois and the Mid-America Earthquake Center.

52
Mid-America Earthquake CenterMid-America Earthquake Center
12. REFERENCES
Ambraseys, N. N., Douglas, J., Sarma, S. K., and Smit, P. M., “Equations for the
Estimation of Strong Ground Motions from Shallow Crustal Earthquakes Using Data from Europe and the Middle East: Horizontal Peak Ground Acceleration and Spectral Acceleration”, Bulletin of Earthquake Engineering, Vol 3, 1-53, 2005
Ambraseys, N. N., Douglas, J., Sarma, S. K., and Smit, P. M., “Equations for the
Estimation of Strong Ground Motions from Shallow Crustal Earthquakes Using Data from Europe and the Middle East: Vertical Peak Ground Acceleration and Spectral Acceleration”, Bulletin of Earthquake Engineering, Vol 3, 55-73, 2005
Beauducel, F., "Structures and Mechanical Behaviour of Merapi Volcano, Java: a
Methodological Approach of the Deformation Field", Ph.D Thesis, Univ. Paris VII, Institut de Physique du Globe de Paris, 1998
Bilham, R., Engdahl, E. R., Feldl, N., and Satyabala, S. P., "Partial and Complete Rupture
of the Indo-Andaman Plate Boundary 1847-2004" Seismological Research Letters, Vol 76, 299-311, 2005
Böhm, C. B., “Experts mission to Prambanan and Borobudur World Heritage Sites”, ETH
Zurich, 2004 Darragh, R. B., and Bolt, B. A., “A Comment on the Statistical Regression Relation
between Earthquake Magnitude and Fault Rupture Length”, Bulletin of the Seismological Society of America, Vol 77, 1479 – 1484, 1987
Ehime University, “Report on Central Java Earthquake”, The Disaster Prevention
Information Research Center at Ehime University, 18-19, 2006 Elnashai, A.S. and Papazoglou, A.J., “Procedure and Spectra for Analysis of RC
Structures Subjected to Strong Vertical Earthquake Loads”, Journal of Earthquake Engineering, Vol 1 (1), 121-156., 1997
Eurocode 8, “Design Provisions for Earthquake Resistance of Structures”, CNE (Comite
Europeen de Normalisation), 1998 Hoedajanto, D., Personal Communication with Elnashai, A.S., Bandung Institute of
Technology, 2006 Joint Report from BAPPENAS, the Provincial and Local Governments of D.I.Yogyakarta,
the Provincial and Local Governments of Central Java, and international partners, “Preliminary Damage and Loss Assessment, Yogyakarta and Central Java Natural Disaster”, June 2006

53
Mid-America Earthquake CenterMid-America Earthquake Center
Nakano, M., Kumagai, H., Miyakawa, K., Yamashina, T., Inoue, H., and Ishida, M., “Source Mechanism Analysis of the Java Earthquake (May 26, 2006) using Waveform Data Obtained by the Indonesian Broadband Seismograph Network (Realtime-JISNET) ”, NIED, Japan, 2006
Newcomb, K., R. and McCann, W.,R., “Seismic History and Seismotectonics of the
Sunda Arc”, Journal of Geophysical Research, Vol. 92, No. B1, 421-439, 1987 Newmark, N. M. and W. J. Hall, “Earthquake Spectra and Design”, Earthquake
Engineering Research Institute, Berkeley, California, 1982 Sieh, K., Natawidjaja, D. H., Chlieh, M., Galetzka, J., Avouac, J., Suwargadi, B. W.,
Edwards, R., and Cheng, H., “The giant subduction earthquakes of 1797 and 1833, West Sumatra: Characteristic couplets, uncharacteristic slip”, American Geophysical Union, Fall Meeting 2004, 2004
Unjianto, B., "The Worst Damage from the Earthquake on Mt. Merapi Sediment Deposits",
Suara Merdeka Cyber News (http://www.suaramerdeka.com/), July 3, 2006 Wells, D. L. and Coppersmith, K.J., “New Empirical Relationships among Magnitude,
Rupture Length, Rupture Width, Rupture Area, and Surface Displacement”, Bulletin of the Seismological Society of America, Vol 84, 974-1002, 1994
Wyss, M., “Estimating Maximum Expectable Magnitude of Earthquakes from Fault
Dimensions”, Geology, 7(7), 336-340, 1979

54
Mid-America Earthquake CenterMid-America Earthquake Center
13. APPENDICES
13.1 FIELD MISSION MEMBERS AND SPECIALIZATION
Name Technical Role Logistical Role
Amr Salah Elnashai (i) structural earthquake engineering; (ii) strong-motion effects Team Leader
Sung Jig Kim (i) structural earthquake engineering; (ii) engineering seismology
Documentation and Report Coordinator
Gun Jin Yun (i) structural earthquake engineering;
(ii) geotechnical earthquake engineering
Communications Coordinator in the
USA
Djoni Eka Sidarta (i) structural earthquake engineering;
(ii) geotechnical earthquake engineering
Communications Coordinator in
Indonesia
13.2 INDONESIAN HOST ORGANIZATIONS
1. Ministry of Transportation 2. Ministry of Research and Technology 3. Meteorological and Geophysical Agency 4. Department of Transportation, Province of Yogyakarta 5. Department of Public Work, Province of Yogyakarta 6. Center for Earthquake Engineering, Dynamic Effect and Disaster Studies at the
Indonesian Islamic University, Yogyakarta 7. Gajah Mada University, Yogyakarta 8. Bandung Institute of Technology, Bandung, West Java Province

55
Mid-America Earthquake CenterMid-America Earthquake Center
13.3 ITINERARY AND ROUTE
July 3 – 9, 2006, (see Figure 13.1 and Figure 13.2 in subsequent pages)
Date Description
AM Arrival from the USA in Jakarta
July 3 PM
Meeting at Ministry of Transportation of the Republic of Indonesia with Ministry of Research and Technology and Meteorological and Geophysical Agency
AM Meeting at Meteorological and Geophysical Agency, including Department of Public Works
July 4
PM
Depart to Yogyakarta Meeting with director of Center for Earthquake Engineering, Dynamic Effect and Disaster Studies at the Indonesian Islamic University, Yogyakarta
July 5 Survey structural damage from Yogyakarta to Bantul
AM Survey geotechnical effects from Yogyakarta to Parangtritis beach through Opak fault region
July 6 PM Meeting at Gajah Mada University, Yogyakarta
AM Survey Borobudur Temple and Merapi volcano July 7
PM Depart to Jakarta
AM Depart to Bandung July 8
PM Meeting at Bandung Institute of Technology
July 9 Team Returns to the USA

Figure 13.1 Route of site survey. Thick color lines represent GPS logs of the routes
56
Mid-America Earthquake CenterMid-America Earthquake Center

Figure 13.2 The location of structures investigated by team and the route shown in green
57
Mid-America Earthquake CenterMid-America Earthquake Center