microwave-tc intensity estimation
TRANSCRIPT

Microwave-TC intensity estimation
Ryo OyamaMeteorological Research Institute
Japan Meteorological Agency

Contents1. Introduction
2. Estimation of TC Maximum Sustained Wind (MSW) using TRMM Microwave Imager (TMI) data
3. Estimation of TC Minimum Sea Level Pressure (MSLP) based on warm core intensity observed by Advanced Microwave Sounding Unit-A (AMSU-A)
4. Future plan for Microwave-TC intensity estimation
2

IntroductionSatellite observations are essential for analysis of tropical cyclone (TC) intensity, such as Minimum Sea Level Pressure (MSLP) and Maximum Sustained Wind (MSW), particularly where in situ observations are sparse.
Use applications:• Early analysis• Best track analysis• Creation of TC bogus
vortex for NWP initial analysis
TC intensity analysis(MSLP, MSW)
In situ observations : Low spatial resolution
Satellite observations: Wide coverage, high temporal resolution (for MTSAT)
3

Dvorak technique(based on Infrared image from geostationary satellite)
:A primary method based on satellite observation
Brightness temperature (TB) of MTSAT infrared channel for TC Songda (1102):Cloud top temperature
Dvorak technique requires analysis skills based on enough experience !
Curved band pattern Eye pattern Shear pattern
00UTC 23 May 2011 20UTC 26 May 2011 23UTC 28 May 2011
CDG
CMG
W
B
LG
MG
DG
OW
WMG
Cold
Warm
4

However, Dvorak technique has some weak points.
Jun.22 11UTC(CB cluster)
Jun.23 20UTC(CB cluster)
Jun.24 10UTC(Curved band)
Jun.26 06UTC(Shear/LCV)
970975980985990995
100010051010
00 12 00 12 00 12 00 12 00 12 00 12 00 12 00
MSL
P (h
Pa)
Month/Day and Time (UTC)
Dvorak MSLP Best track MSLP
6/21 6/22 6/23 6/24 6/25 6/26 6/27
TC Meari (1105)
in situ observation at Miyako-jima:
982 hPa
5

Satellite microwave sensor can observe TC internal structure !
Warm core
MW radiation from cloud/rain
:ice/liquid water
55 GHz MW radiation from the atmosphere
: temperatureIR radiation from cloud top
: cloud top temperature
gray : clouds, white: ice cloud/rain, light blue : liquid rain
Eye
wal
l
Spira
l rai
n ba
nd
10-19 GHz MW radiation from sea surface
: sea foams induced by surface winds
Sea surface with sea foams induced by winds
Scattering by ice particles
MTSAT NOAA/AMSU TRMM/TMI
6

Estimation of TC maximum sustained wind (MSW) using TRMM Microwave
Imager (TMI) data
7

Basic TC structure seen in rain and wind distributions
Pre
ssur
e le
vel (
hPa)
Inner core (radius < 100~200 km)
Convergence near the surface increases due to increase of inflow with tangential wind intensified,
Cloud and rain water increases as eye walls and rain bands are formed.
Radial cross section through an idealized, axially symmetric hurricanein TC inner core (Wallace and Hobbs 2006)
8

TRMM/TMI observation
TMI microwave imager (November 1997~)• Onboard TRMM for observing rain and sea surface over the tropical region.• Channel frequencies (GHz) : 10.7(V/H), 19.35(V/H), 21.3(V), 37(V/H) and
85.5(V/H).• Spatial resolution of data is 38.3 km (10.7GHz)~4.4 km (85.5GHz).• 3 observations per day at maximum available (depending on TC location)
TRMM
9
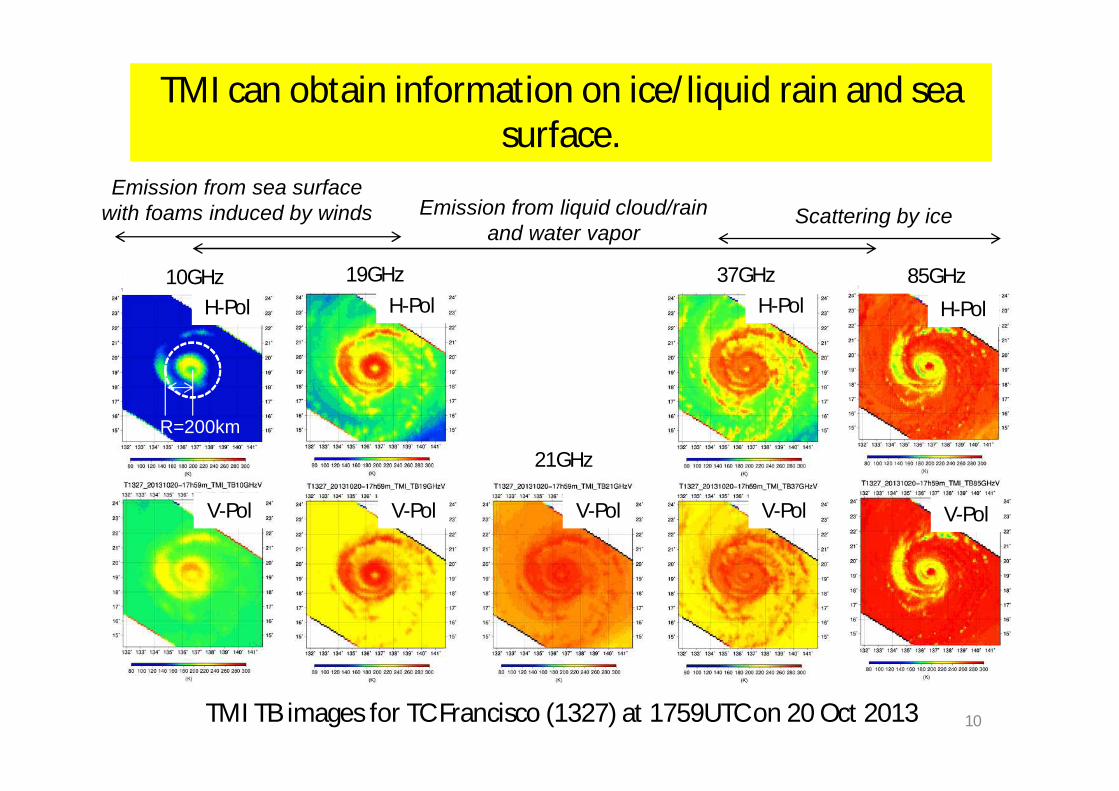
85GHz
TMI can obtain information on ice/liquid rain and sea surface.
10GHz 19GHz 37GHz
TMI TB images for TC Francisco (1327) at 1759UTC on 20 Oct 2013
R=200km
Emission from liquid cloud/rainand water vapor
Scattering by iceEmission from sea surface
with foams induced by winds
V-Pol V-Pol V-Pol V-Pol
H-Pol H-Pol H-Pol
21GHz
V-Pol
H-Pol
10
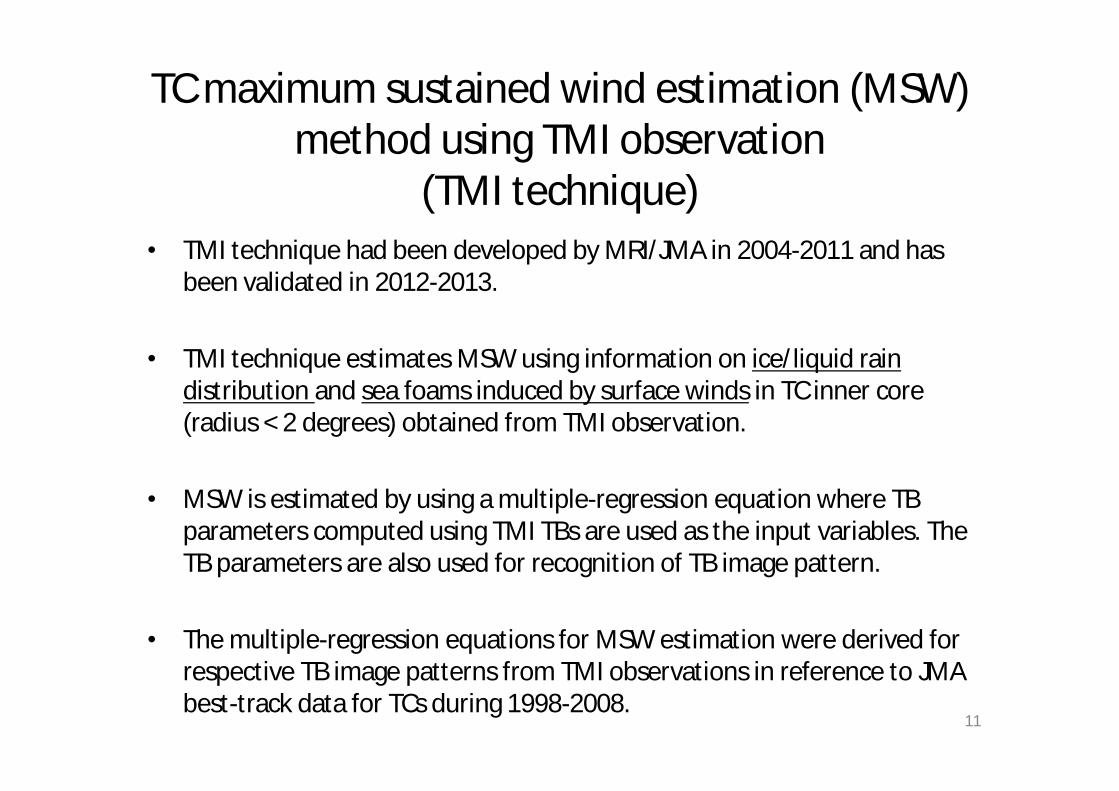
TC maximum sustained wind estimation (MSW) method using TMI observation
(TMI technique) • TMI technique had been developed by MRI/JMA in 2004-2011 and has
been validated in 2012-2013.
• TMI technique estimates MSW using information on ice/liquid rain distribution and sea foams induced by surface winds in TC inner core (radius < 2 degrees) obtained from TMI observation.
• MSW is estimated by using a multiple-regression equation where TB parameters computed using TMI TBs are used as the input variables. The TB parameters are also used for recognition of TB image pattern.
• The multiple-regression equations for MSW estimation were derived for respective TB image patterns from TMI observations in reference to JMA best-track data for TCs during 1998-2008.
11

Algorithm of TMI technique for MSW estimation
Domains for computing TB parameters
abou
t 200
km
2.0°
1.5°
1.0°
0.5°0.25°
TC Moving
(Step 1) TB parameters (max, average, min etc. in the defined domains) for TMI channels are computed.
(Step 3) MSW is estimated by using a multiple-regression equation for each TB image pattern.
(Step 2) TB image pattern of TC inner core (radius < 2 degrees) was determined (out of 10 patterns) using TB parameters.
Regression equation for MSW estimation:
MSW = A0 + Σ {A(n) x TBparam(n)} TBparam(n): TB parameters highly
correlated to MSWn = 1 to 7
12
85GHz TB

Validation of MSW estimates by TMI technique with reference to the best-track data
Black : Observations for TCs in 1998-2008(used for deriving the estimation equation)
Number = 749
Red : Observations for TCs in 2009-2012(independent on the estimation equation)
Number = 341RMSE = 6.26 m/sBIAS = 0.99 m/s
Relatively large estimation errors come from(i) Inadequate use of TB parameters for
estimation during TC formation stage(ii) Determination error of TC center
position
Best track MSW (m/s)
MSW
est
imat
e by
TM
I tec
hniq
ue (m
/s)
13

TC Soulik (1307)
13
18(m/s)33.451.5
46.341.230.9
/July
MSW
in situ observation at Yonaguni-jima
14

1015202530354045505560
00 12 00 12 00 12 00 12 00 12 00 12 00 12 00
MSW
(m
/s)
(UTC)
TMI MSWDvorak MSWJMA best track
7/7 7/8 7/9 7/10 7/11 7/12 7/13
TC Soulik (1307)
85GHz (PCT)
10GHz (H)
① ②③ ④
①
② ③ ④
in situ observation at Yonaguni-jima:
44 m/s (10-min ave.)
ice cloud/rain
liquid rain and sea foams
15

Summary and conclusion on MSW estimation by TMI technique
• TMI technique estimates MSW based on TB parameters computed using TMI TBs in TC inner core.
• Validation of the MSW estimates to best track data for TCs in 2009-2012 showed that RMSE is 6.26 m/s (comparable to Dvorak technique).
• It is essential to find in which situation MSW estimate by TMI technique could support operational TC intensity analysis, in addition to improvements of the algorithm.
16

Estimation of TC Minimum Sea Level Pressure (MSLP) based on warm core
intensity observed by Advanced Microwave sounding Unit-A (AMSU-A)
17

What is warm core ?• Warm core is formed near TC center, with a positive temperature anomaly
to the environment.• Warm core is a characteristic feature to identify TC intensity and TC size.
Warm air Low surface pressure
Large (small) warm core Large (small) TC size
TC Bolaven (1215)MSLP=940 hPa, MSW=41 m/s,
R30 = 555km
Temperature anomaly by AMSU-A for TC Danas (1324)MSLP=975 hPa, MSW=31 m/s,
Shortest radius of 30knot winds (R30)= 222km
Anomaly~5K at 200 hPa
Anomaly~11Kat 200 hPa
TB attenuation of microwave
18

Advanced Microwave Sounding Unit-A (AMSU-A)AMSU-A
- is onboard NOAA and METOP series polar orbital satellites.- has been operated since 1998 (NOAA-15 is the first satellite for AMSU).- observes twice per day at maximum (5 satellites available)- consists of twelve channels (Ch3 - Ch14) for atmospheric temperature
sounding.
atmosphereAMSU-A 55-GHz band channels observe radiation from oxygen in the atmosphere.
width of scan line: about 2000 km
NOAA
19

Weighting functions of AMSU-A channels
(Kidder et al. 2000)
trop
osph
ere
Field of View (FOV) of AMSU-A channels (open ellipses)
(kidder et al. 2000)
AMSU-A FOV size: 48km - 150 km
20
• AMSU-A channels for observing the troposphere are Ch4 (900 hPa level), Ch5 (600 hPa), Ch6 (400 hPa), Ch7 (250 hPa) and Ch8 (180 hPa).
• TBs for Ch4 and Ch5 for observing the lower troposphere tend to be attenuated significantly by rain near TC center.
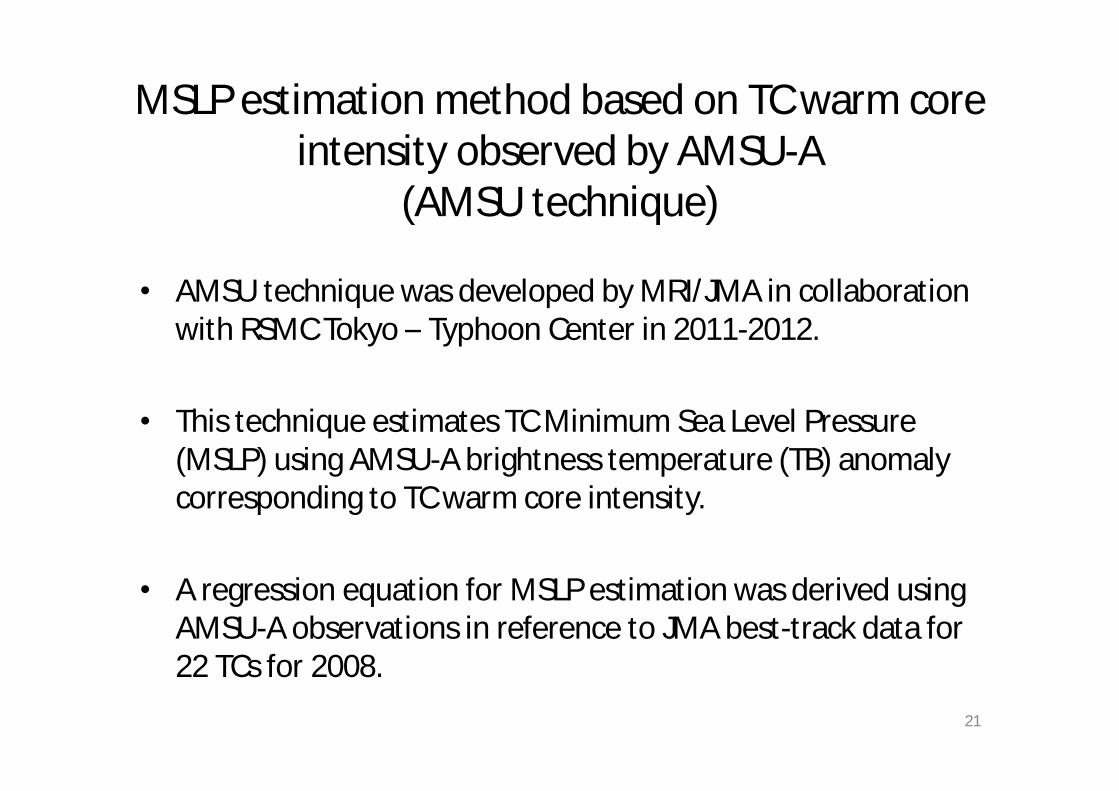
MSLP estimation method based on TC warm core intensity observed by AMSU-A
(AMSU technique)
• AMSU technique was developed by MRI/JMA in collaboration with RSMC Tokyo – Typhoon Center in 2011-2012.
• This technique estimates TC Minimum Sea Level Pressure (MSLP) using AMSU-A brightness temperature (TB) anomaly corresponding to TC warm core intensity.
• A regression equation for MSLP estimation was derived using AMSU-A observations in reference to JMA best-track data for 22 TCs for 2008.
21
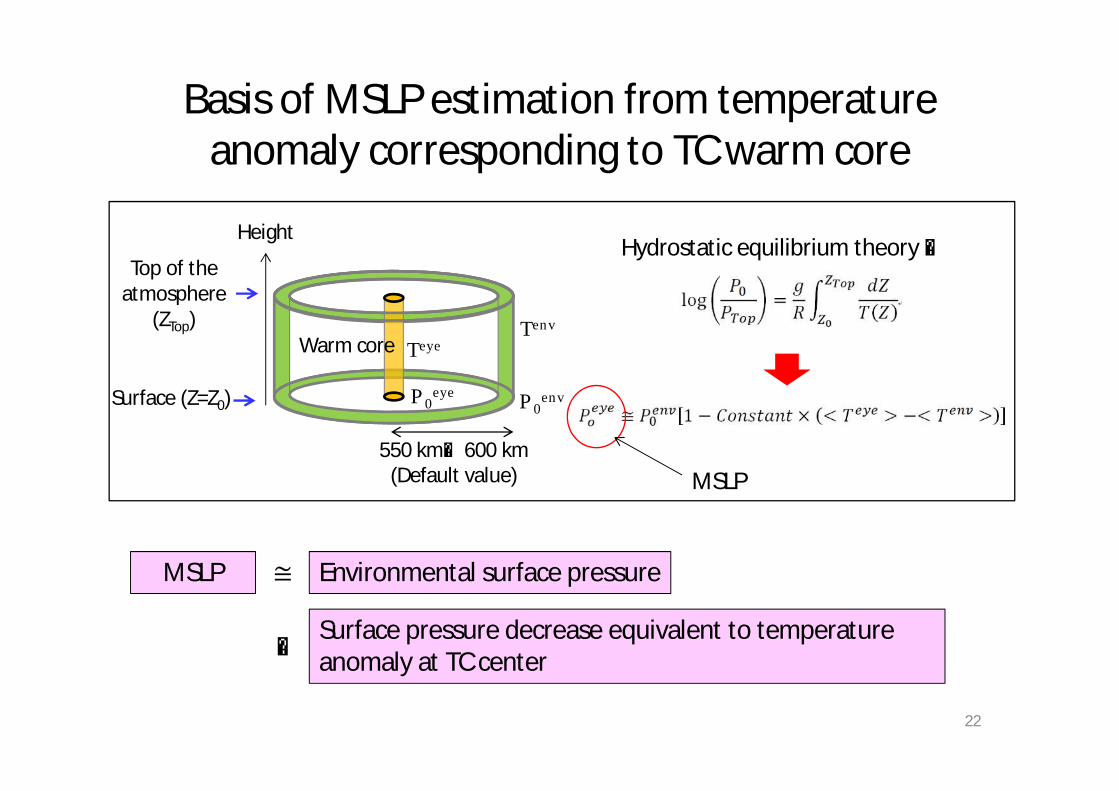
Basis of MSLP estimation from temperature anomaly corresponding to TC warm core
MSLP Environmental surface pressure
Surface pressure decrease equivalent to temperature anomaly at TC center
≅-
Tenv
Teye
Height
Top of the atmosphere
(ZTop)
Surface (Z=Z0) P0envP0
eye
Hydrostatic equilibrium theory :
550 km~600 km(Default value)
Warm core
MSLP
22

Warm core intensity used for MSLP estimation
Max TB anomalyMax TB anomalyMax TB anomaly
TB anomaly forCh6 (~400 hPa level)
TB anomaly forCh7 (~250 hPa level)
TB anomaly forCh8 (~180 hPa level)
Maximum(defined as warm core intensity)
23

y = 0.0235x - 0.0965Number = 102
-4
-3
-2
-1
0
1
2
3
4
-40 -30 -20 -10 0 10 20 30 40 50 60 70 80
AMAX
_DIF
F(K
)
SIWAMAX
(c) Ch8
Correction of warm core intensity retrieval errorsand MSLP estimation
Error due to low spatial resolution (48~150 km) of AMSU-A observation
Scattering Index over Water (SIW)unde
rest
imat
ion
of w
arm
co
re in
tens
ity (K
)
MSLP estimation equation derived using AMSU-A observations with reference to JMA best track data for TCs in 2008 :
MSLP = SLOPE×(warm core intensity) + OFFSET
TB attenuation error due to ice particles
These warm core intensity retrieval errors are corrected by developed schemes.
Ch8
24

Validation of AMSU MSLPs to JMA best-track data for TCs during 2009-2011
y = 0.878 x + 120.99 R = 0.89
RMSE =10.1 hPaBIAS = 0.3 hPa
880
900
920
940
960
980
1000
1020
880 900 920 940 960 980 1000 1020
Estim
atio
n (h
Pa)
Best track MSLP (hPa)
2009 - 2011
Number of observations: 1029RMSE : 10.1 hPaBIAS: 0.3 hPa
Statistical validation revealed several characteristics of AMSU MSLPs:
1. Better quality of AMSU MSLPs for large TCs than compact TCs, suggesting a difficulty of observing small warm core.
2. Quality degrading of AMSU MSLPs due to too large microwave scattering near TC center.
3. Superiority of AMSU MSLPs to Dvorak MSLPs when TC is not compact and TC cloud pattern is “Curved band” or “Shear/LCV”.
25

Characteristics of MSLP estimates by AMSU technique
• Characteristics of MSLP estimates by AMSU technique (AMSU MSLP) are shown in comparison with JMA best track data and MSLP estimates by Dvorak technique (Dvorak MSLP) for three typical cases of TCs during 2009-2011.
• For TCs during 2009-2011, JMA best track data depends on Dvorak MSLP, while it does not depend on AMSU MSLP.
• Shortest radius of 30 knot winds (R30) from best track data is used as TC size related to warm core size. Average R30 value between 2000-2011 for each MSLP is also used as the criterion.
26

TC Meari (1105)
970975980985990995
100010051010
00 12 00 12 00 12 00 12 00 12 00 12 00 12 00
MSL
P (h
Pa)
Month/Day and Time (UTC)
Dvorak MSLP AMSU MSLP Best track MSLP
6/21 6/22 6/23 6/24 6/25 6/26 6/27
average R30 (261 km) < R30 of Meari (370 km)for MSLP of 975 hPa
AMSU-A TB anomaly (Ch6): ~400 hPa MW scattering (SIW) IR TB; Shear pattern
27

TC Noru (1113)
980
985
990
995
1000
1005
1010
12 00 12 00 12 00 12 00 12 00 12 00
MSL
P (h
Pa)
Month/Day and Time (UTC)
Dvorak MSLP AMSU MSLP Best track MSLP
9/2 9/3 9/4 9/5 9/6
average R30 (197 km) < R30 of Noru (370 km)for MSLP of 990 hPa
AMSU-A TB anomaly (Ch6): ~400 hPa MW scattering (SIW) IR TB; Shear/LCV
28

TC Mirinae (0921)
950
960
970
980
990
1000
1010
00 12 00 12 00 12 00 12 00 12 00 12 00 12 00 12 00 12 00
MSL
P (h
Pa)
Month/Day and Time (UTC)
Dvorak MSLP AMSU MSLP Best track MSLP
10/25 10/26 10/27 10/28 10/29 10/30 10/31 11/1 11/2
average R30 (354 km) > R30 of Mirinae (148 km)for MSLP of 960 hPa
AMSU-A TB anomaly (Ch6): ~400 hPa MW scattering (SIW) IR TB
29

Summary and conclusion on MSLP estimationby AMSU technique
• AMSU technique estimates MSLP using TC warm core intensity as observed by AMSU-A.
• MSLP estimates by AMSU technique tended to be better than those by Dvorak technique for incompact TCs with specific TC cloud patterns (Curved band or Shear/LCV).
• AMSU MSLP is expected to support operational MSLP analysis when in situ data is not available and the estimation accuracy of Dvorak technique is low.
30

Future plan for Microwave-TC intensity estimation
RSMC Tokyo – Typhoon center began to use TC intensity estimates by AMSU and TMI techniques as references for the operational TC intensity analysis in 2013.
Future works for further contribution of the estimation to operational TC intensity analysis are:
• Improvements to the current algorithms• Use of satellite observations other than AMSU-A and TMI for
TC intensity estimationSSMIS microwave imager/sounder (DMSP)AMSR2 microwave imager (GCOM-W1) ATMS microwave sounder (NPP)
31

Thank you
32