microstructures, crystallographic fabric development and deformation mechanisms in natural hematite...
TRANSCRIPT
at SciVerse ScienceDirect
Journal of Structural Geology 40 (2012) 29e43
Contents lists available
Journal of Structural Geology
journal homepage: www.elsevier .com/locate/ jsg
Microstructures, crystallographic fabric development and deformationmechanisms in natural hematite aggregates deformed under varied metamorphicconditions
Mônica Mendes*, Leonardo LagoeiroUniversidade Federal de Ouro Preto, Departamento de Geologia, Campus Morro do Cruzeiro s/n�, 35400-000 Ouro Preto, Minas Gerais, Brazil
a r t i c l e i n f o
Article history:Received 8 January 2011Received in revised form26 March 2012Accepted 16 April 2012Available online 27 April 2012
Keywords:Crystallographic preferred orientationIron formationsHematiteElectron backscattered diffractionDeformation mechanisms
* Corresponding author. Tel.: þ55 31 9247 9798.E-mail address: [email protected] (M
0191-8141/$ e see front matter � 2012 Elsevier Ltd.doi:10.1016/j.jsg.2012.04.005
a b s t r a c t
Naturally deformed hematite aggregates from 15 different iron ore mines located in Quadrilátero Fer-rífero region, Brazil, were analyzed in order to verify the influence of increasing temperature anddeformation intensity on their microstructural and textural aspects as well as the deformation mecha-nisms associated with the metamorphic conditions. The electron backscattered diffraction (EBSD)technique was applied in order to get qualitative and quantitative data concerning with microstructuralparameters, crystallographic preferred orientation (CPO) and misorientation between hematite grains.The microstructures of these aggregates vary from randomly oriented hematite grains with approxi-mately equant grains, to strongly oriented and elongated grains following the increase in deformationaland metamorphic polarity toward east in the region. In the low deformation domain (western region)the deformation mechanisms are typically microfracturing and dissolution precipitation creep formagnetite rich aggregates. In the high-strain domain (eastern region), the deformation is accommodatedby a combination of basal intracrystalline slip (c) (<a>) and grain boundary sliding, with rotation aroundhematite [c] axis. No evidences for recrystallization processes in these aggregates can be supported byour results, probably due to the superposition of subsequent processes.
� 2012 Elsevier Ltd. All rights reserved.
1. Introduction
The iron formations from Quadrilátero Ferrífero (QF) region,located in the southeast of Brazil, draw the attention of researchesnot only because its high economic mineral potential, but also forthe complexity of deformation of these rocks. Microstructural andtextural studies, in terms of crystallographic preferred orientation(CPO), acquired a great importance due to the use of techniques oftextural analysis (e.g. Siemes et al., 2000; Rosière et al., 2001;Morales et al., 2008). The use of hematite CPO data not onlypermits, for example, the analysis of seismic properties of iron orebodies (Morales et al., 2008b), which can be important tools for ironore exploration, but also allows the interpretation of deformationmechanisms that operates in the accommodation of deformation inthese rocks (Siemes et al., 2003, 2008; Rosière et al., 2001).
During its deformational history, the QF region was subjected todifferent deformational and metamorphic conditions, witha progressive increase in intensity of the deformation conditions
. Mendes).
All rights reserved.
and temperatures toward the east (Herz, 1978; Pires, 1995). Itresulted in a progressive variation, from west to east, of iron oxidecontent in the iron ore bodies (Lagoeiro, 1998; Rosière et al., 2001;Rosière and Rios, 2004; Barbosa and Lagoeiro, 2010) and especiallytextural changes (Rosière et al., 2001).
In this work, we present the results of microstructural andtextural analysis of 15 iron ore samples (hematite aggregates) fromdifferent mines located in QF region (Fig. 1). These samples wereanalyzed through the electron backscattered diffraction (EBSD)technique (Prior et al., 1999), and the results were used to evaluatehow the microstructures and the CPO of hematite minerals vary indifferent tectonic domains and the implications in terms of thedeformation mechanisms responsible for the observed micro-structures and the determined CPOs.
Similar work was previously carried out by Rosière et al. (2001).These authors performed microstructural and textural analysis ofiron ore sampled in different deformational and metamorphicdomains in QF. Textural analysis of hematite was conducted via theneutron diffraction technique. The authors verified that the CPOpatterns vary with the increasing of the deformation and concludedthat the deformation occurred by basal slip, diffusive processes andgrain growth. Even though the neutron diffraction technique
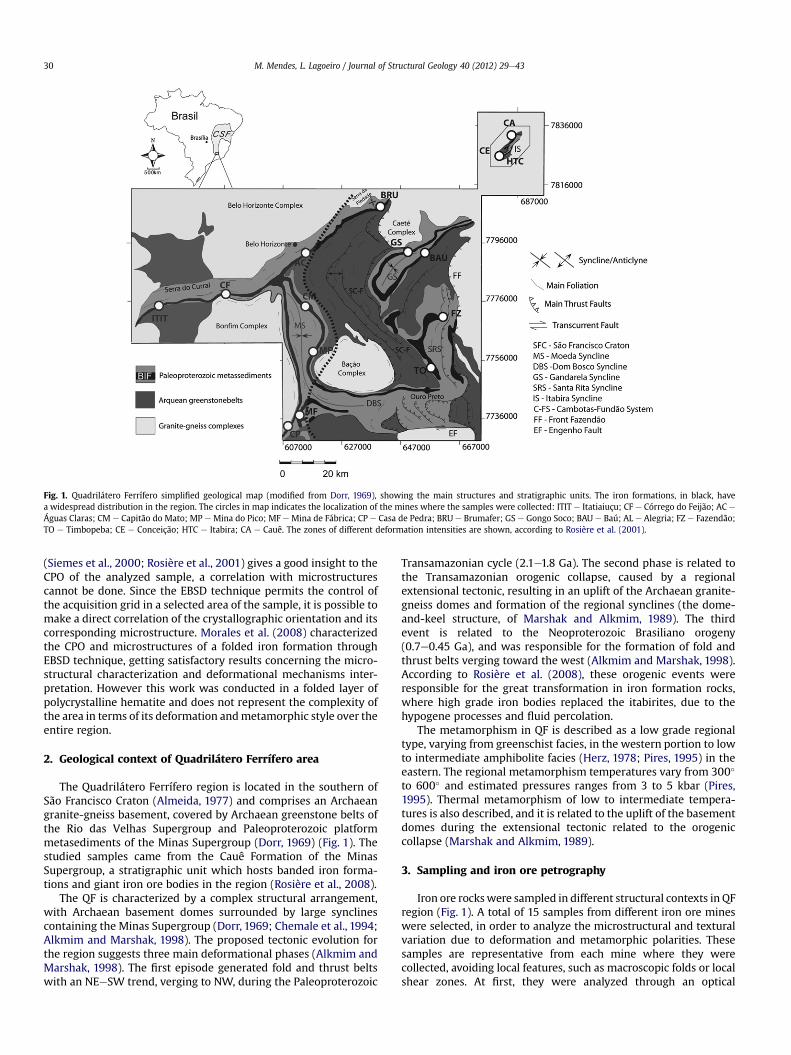
Fig. 1. Quadrilátero Ferrífero simplified geological map (modified from Dorr, 1969), showing the main structures and stratigraphic units. The iron formations, in black, havea widespread distribution in the region. The circles in map indicates the localization of the mines where the samples were collected: ITIT e Itatiaiuçu; CF e Córrego do Feijão; AC e
Águas Claras; CM e Capitão do Mato; MP e Mina do Pico; MF e Mina de Fábrica; CP e Casa de Pedra; BRU e Brumafer; GS e Gongo Soco; BAU e Baú; AL e Alegria; FZ e Fazendão;TO e Timbopeba; CE e Conceição; HTC e Itabira; CA e Cauê. The zones of different deformation intensities are shown, according to Rosière et al. (2001).
M. Mendes, L. Lagoeiro / Journal of Structural Geology 40 (2012) 29e4330
(Siemes et al., 2000; Rosière et al., 2001) gives a good insight to theCPO of the analyzed sample, a correlation with microstructurescannot be done. Since the EBSD technique permits the control ofthe acquisition grid in a selected area of the sample, it is possible tomake a direct correlation of the crystallographic orientation and itscorresponding microstructure. Morales et al. (2008) characterizedthe CPO and microstructures of a folded iron formation throughEBSD technique, getting satisfactory results concerning the micro-structural characterization and deformational mechanisms inter-pretation. However this work was conducted in a folded layer ofpolycrystalline hematite and does not represent the complexity ofthe area in terms of its deformation andmetamorphic style over theentire region.
2. Geological context of Quadrilátero Ferrífero area
The Quadrilátero Ferrífero region is located in the southern ofSão Francisco Craton (Almeida, 1977) and comprises an Archaeangranite-gneiss basement, covered by Archaean greenstone belts ofthe Rio das Velhas Supergroup and Paleoproterozoic platformmetasediments of the Minas Supergroup (Dorr, 1969) (Fig. 1). Thestudied samples came from the Cauê Formation of the MinasSupergroup, a stratigraphic unit which hosts banded iron forma-tions and giant iron ore bodies in the region (Rosière et al., 2008).
The QF is characterized by a complex structural arrangement,with Archaean basement domes surrounded by large synclinescontaining the Minas Supergroup (Dorr, 1969; Chemale et al., 1994;Alkmim and Marshak, 1998). The proposed tectonic evolution forthe region suggests three main deformational phases (Alkmim andMarshak, 1998). The first episode generated fold and thrust beltswith an NEeSW trend, verging to NW, during the Paleoproterozoic
Transamazonian cycle (2.1e1.8 Ga). The second phase is related tothe Transamazonian orogenic collapse, caused by a regionalextensional tectonic, resulting in an uplift of the Archaean granite-gneiss domes and formation of the regional synclines (the dome-and-keel structure, of Marshak and Alkmim, 1989). The thirdevent is related to the Neoproterozoic Brasiliano orogeny(0.7e0.45 Ga), and was responsible for the formation of fold andthrust belts verging toward the west (Alkmim and Marshak, 1998).According to Rosière et al. (2008), these orogenic events wereresponsible for the great transformation in iron formation rocks,where high grade iron bodies replaced the itabirites, due to thehypogene processes and fluid percolation.
The metamorphism in QF is described as a low grade regionaltype, varying from greenschist facies, in the western portion to lowto intermediate amphibolite facies (Herz, 1978; Pires, 1995) in theeastern. The regional metamorphism temperatures vary from 300�
to 600� and estimated pressures ranges from 3 to 5 kbar (Pires,1995). Thermal metamorphism of low to intermediate tempera-tures is also described, and it is related to the uplift of the basementdomes during the extensional tectonic related to the orogeniccollapse (Marshak and Alkmim, 1989).
3. Sampling and iron ore petrography
Iron ore rockswere sampled in different structural contexts in QFregion (Fig. 1). A total of 15 samples from different iron ore mineswere selected, in order to analyze the microstructural and texturalvariation due to deformation and metamorphic polarities. Thesesamples are representative from each mine where they werecollected, avoiding local features, such as macroscopic folds or localshear zones. At first, they were analyzed through an optical
M. Mendes, L. Lagoeiro / Journal of Structural Geology 40 (2012) 29e43 31
microscope, in order to observe their general microstructuralaspects. Taking into account the deformational (Rosière et al., 2001)and metamorphic intensity polarities (Herz, 1978; Pires, 1995), andalso themicrostructural and ironoxides compositionvariation, thesesamples were classified in three deformational domains, accordingto themore significantvariations: lowdeformationdomain (westernregion of QF), high deformation domain (eastern region of QF) andintermediate deformation domain, where the rocks assume transi-tional characteristics between these two domains of more con-trasting deformational intensities. This classification was doneaccording to the most expressive microstructural and mineralogicalcharacteristics observed in these rocks. It is important to note thatthe changes in iron ore rocks are progressive, according to theincrease in deformational intensity and metamorphic grade.
Iron ore rocks from the low deformation domain (ITIT e Ita-tiaiuçu and CF e Córrego do Feijão) are composed mainly ofmagnetite. They occur as fragments of varied sizes and shapes with
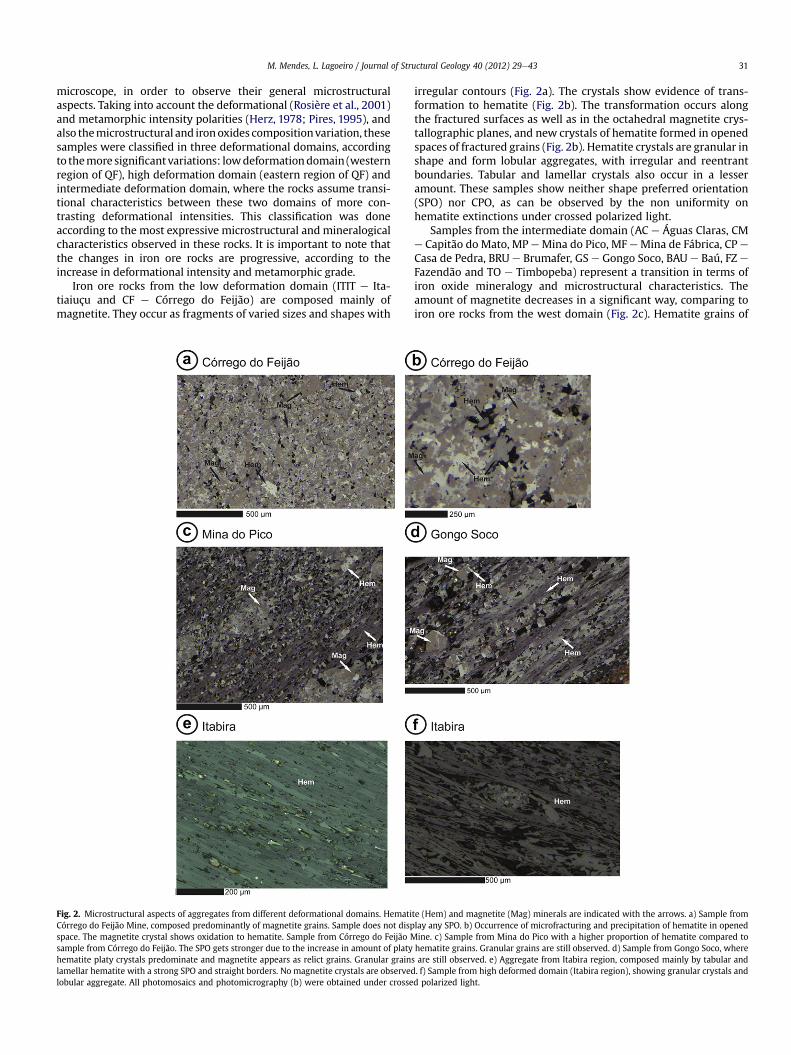
Fig. 2. Microstructural aspects of aggregates from different deformational domains. HematiCórrego do Feijão Mine, composed predominantly of magnetite grains. Sample does not dispspace. The magnetite crystal shows oxidation to hematite. Sample from Córrego do Feijão Msample from Córrego do Feijão. The SPO gets stronger due to the increase in amount of platyhematite platy crystals predominate and magnetite appears as relict grains. Granular grainlamellar hematite with a strong SPO and straight borders. No magnetite crystals are observedlobular aggregate. All photomosaics and photomicrography (b) were obtained under crosse
irregular contours (Fig. 2a). The crystals show evidence of trans-formation to hematite (Fig. 2b). The transformation occurs alongthe fractured surfaces as well as in the octahedral magnetite crys-tallographic planes, and new crystals of hematite formed in openedspaces of fractured grains (Fig. 2b). Hematite crystals are granular inshape and form lobular aggregates, with irregular and reentrantboundaries. Tabular and lamellar crystals also occur in a lesseramount. These samples show neither shape preferred orientation(SPO) nor CPO, as can be observed by the non uniformity onhematite extinctions under crossed polarized light.
Samples from the intermediate domain (AC e Águas Claras, CMe Capitão do Mato, MP eMina do Pico, MF eMina de Fábrica, CP e
Casa de Pedra, BRU e Brumafer, GS e Gongo Soco, BAU e Baú, FZ e
Fazendão and TO e Timbopeba) represent a transition in terms ofiron oxide mineralogy and microstructural characteristics. Theamount of magnetite decreases in a significant way, comparing toiron ore rocks from the west domain (Fig. 2c). Hematite grains of
te (Hem) and magnetite (Mag) minerals are indicated with the arrows. a) Sample fromlay any SPO. b) Occurrence of microfracturing and precipitation of hematite in openedine. c) Sample from Mina do Pico with a higher proportion of hematite compared tohematite grains. Granular grains are still observed. d) Sample from Gongo Soco, wheres are still observed. e) Aggregate from Itabira region, composed mainly by tabular and. f) Sample from high deformed domain (Itabira region), showing granular crystals andd polarized light.
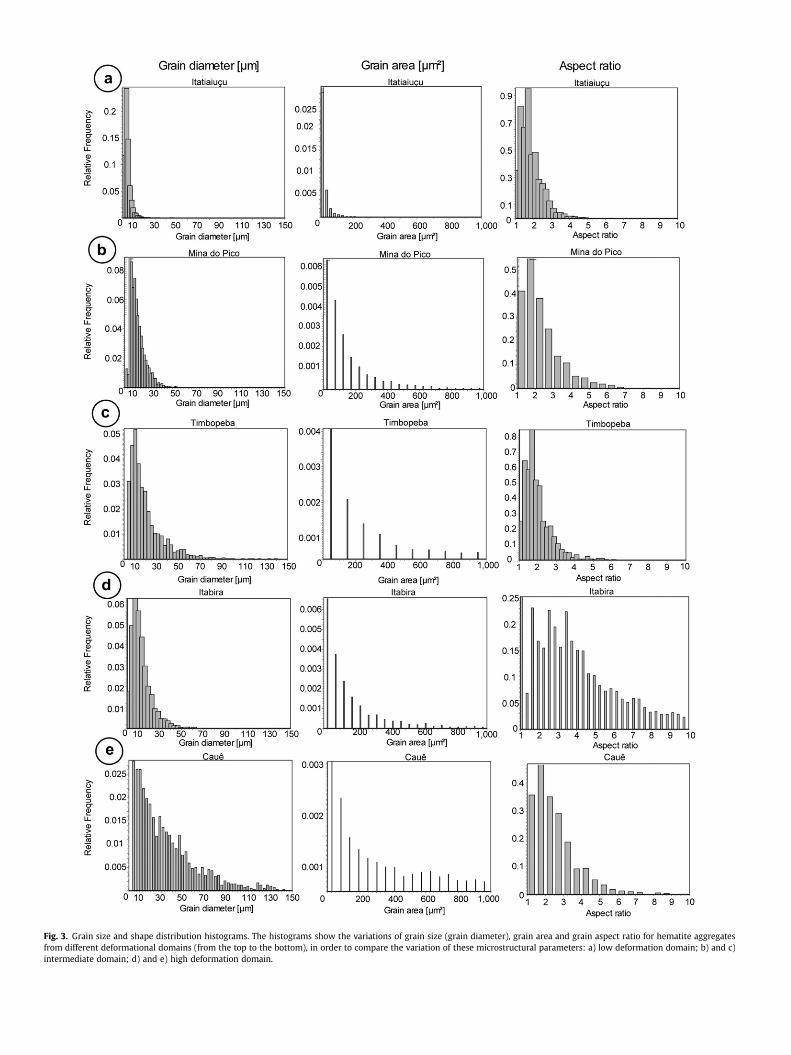
Fig. 3. Grain size and shape distribution histograms. The histograms show the variations of grain size (grain diameter), grain area and grain aspect ratio for hematite aggregatesfrom different deformational domains (from the top to the bottom), in order to compare the variation of these microstructural parameters: a) low deformation domain; b) and c)intermediate domain; d) and e) high deformation domain.
M. Mendes, L. Lagoeiro / Journal of Structural Geology 40 (2012) 29e43 33
lobate and more equant shapes coexist with lamellar hematitecrystals (Fig. 2c and d). These lamellar crystals tend to occur alignedparallel to the bulk foliation of the iron rockswhich imprint in theserocks an incipient SPO. There is a progressive increase of proportionof crystals of hematite of lamellar shape toward the eastern part ofthe QF, which can result in gradual predominance of rocks witha pronounced SPO (Fig. 2c and d).
In the eastern high deformation domain (CA e Cauê, CE e Con-ceição e HTC e Itabira), the iron ore rocks have a schistose aspect(Fig. 2e and f). In this domain, the rocks are formed exclusively byhematite, with sparse or no magnetite crystals. Hematite occurs astiny platelet-like grains, with specular aspect (specularite). Theserocks are commonly called hematitites. There is a predominance oflamellar hematite, with straight boundaries that aligns completelywith the major extension direction, giving the aggregates a strongSPO (Fig. 2e). Local aggregates of lobular and granular crystals arealso observed, although in a significantly less proportion (Fig. 2f).
4. EBSD analysis
EBSD analyses were performed in a SEM JEOL JSM5510 equippedwith Nordlys HKL-Oxford EBSD detector, installed in the Laboratoryof Microscopy andMicroanalysis (MICROLAB), in the Department ofGeology of the Universidade Federal de Ouro Preto, Brazil. The SEMoperated at 20 keV andmean beam current of 64 mA. The samples tobe analyzed were oriented in the SEM chamber with a tilt angle of70� to the horizontal. Other parameters usedwereworking distanceof 32mmandmean angular deviation (MAD), which corresponds tothe deviation between the standard Kikuchi bands of the mineraland those obtained for the sample, of 1 or 1.5�. The minimum andmaximum numbers of detected bands used were 5 and 7 respec-tively, and the number of reflectors equal to 50. The EBSD datawereacquired and processed through software package Channel 5(Oxford-HKL). The post-processing of orientation maps was carriedout using the Tango program, eliminating the non-indexed andmisindexedpoints by spike correction andextrapolating the indexeddata to produce realistic maps. The microstructural parameters ofthe grains, such as area, diameter and aspect ratio were obtainedthrough the same program. Inverse pole figures (IPFs) and rotationaxis of the crystals were obtained through the Mambo program andthe pole figures for prismatic planes {11e20} and {10e10}, rhombplane {10e14} and basal {0001} crystallographic plane were plottedusing the program PFch5 (Mainprice,1990). The PFch5 also generatethe pole figure J (pfJ) index, which uses the formulation ofMichibayashi and Mainprice (2004). A random distribution is char-acterized by a pfJ of unity whereas a single crystal will have a muchlarger pfJ index. Misorientation between grains is expressed as
Fig. 4. Variation of mean a) diameter, b) area and c) aspect ratio for all the analyzed sam
histograms of distribution of misorientation angles (correlated anduncorrelated grains) and distribution of misorientation axes(Mambo program). The plotted points correspond to the activatedrotation direction, coincident with crystallographic directions, foreach rotation angle interval.
5. Results
5.1. Grain shape and size distribution
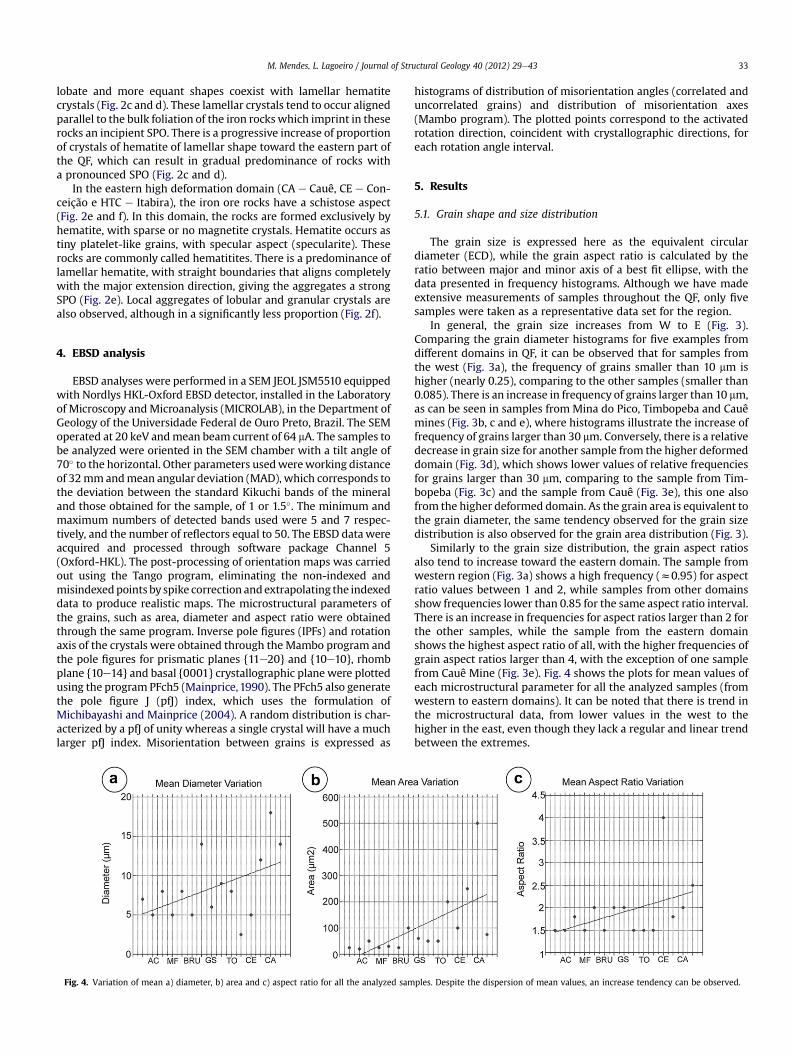
The grain size is expressed here as the equivalent circulardiameter (ECD), while the grain aspect ratio is calculated by theratio between major and minor axis of a best fit ellipse, with thedata presented in frequency histograms. Although we have madeextensive measurements of samples throughout the QF, only fivesamples were taken as a representative data set for the region.
In general, the grain size increases from W to E (Fig. 3).Comparing the grain diameter histograms for five examples fromdifferent domains in QF, it can be observed that for samples fromthe west (Fig. 3a), the frequency of grains smaller than 10 mm ishigher (nearly 0.25), comparing to the other samples (smaller than0.085). There is an increase in frequency of grains larger than 10 mm,as can be seen in samples from Mina do Pico, Timbopeba and Cauêmines (Fig. 3b, c and e), where histograms illustrate the increase offrequency of grains larger than 30 mm. Conversely, there is a relativedecrease in grain size for another sample from the higher deformeddomain (Fig. 3d), which shows lower values of relative frequenciesfor grains larger than 30 mm, comparing to the sample from Tim-bopeba (Fig. 3c) and the sample from Cauê (Fig. 3e), this one alsofrom the higher deformed domain. As the grain area is equivalent tothe grain diameter, the same tendency observed for the grain sizedistribution is also observed for the grain area distribution (Fig. 3).
Similarly to the grain size distribution, the grain aspect ratiosalso tend to increase toward the eastern domain. The sample fromwestern region (Fig. 3a) shows a high frequency (z0.95) for aspectratio values between 1 and 2, while samples from other domainsshow frequencies lower than 0.85 for the same aspect ratio interval.There is an increase in frequencies for aspect ratios larger than 2 forthe other samples, while the sample from the eastern domainshows the highest aspect ratio of all, with the higher frequencies ofgrain aspect ratios larger than 4, with the exception of one samplefrom Cauê Mine (Fig. 3e). Fig. 4 shows the plots for mean values ofeach microstructural parameter for all the analyzed samples (fromwestern to eastern domains). It can be noted that there is trend inthe microstructural data, from lower values in the west to thehigher in the east, even though they lack a regular and linear trendbetween the extremes.
ples. Despite the dispersion of mean values, an increase tendency can be observed.
M. Mendes, L. Lagoeiro / Journal of Structural Geology 40 (2012) 29e4334
5.2. Crystallographic preferred orientations
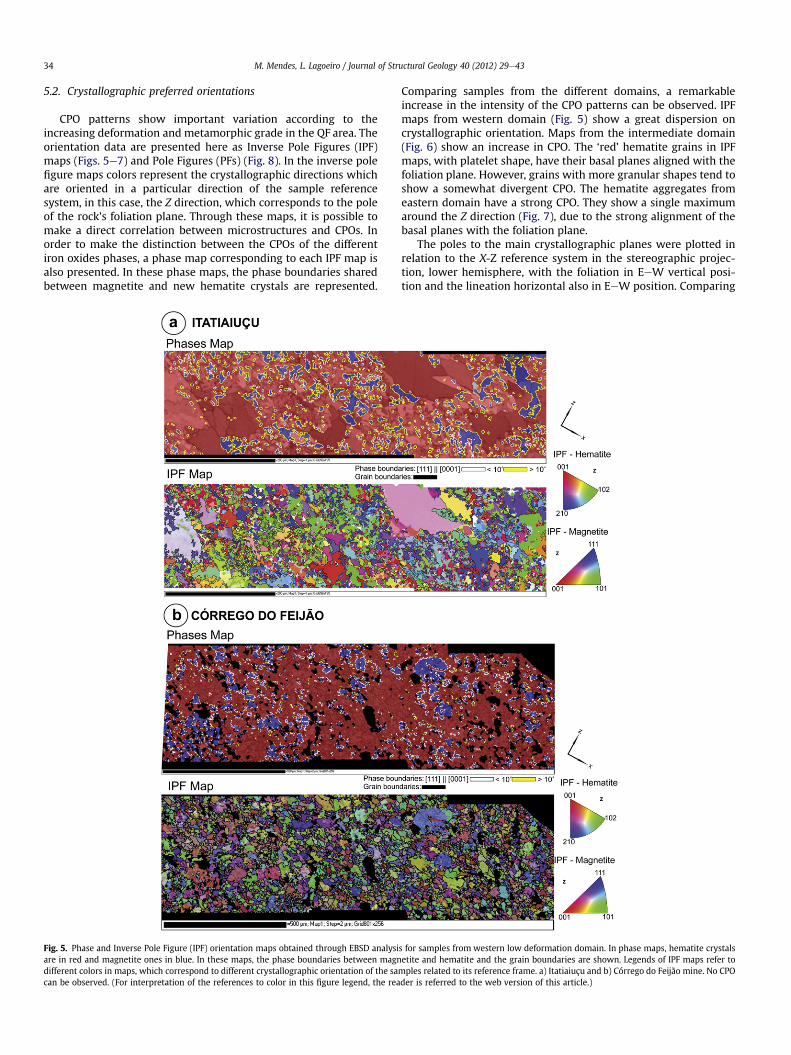
CPO patterns show important variation according to theincreasing deformation and metamorphic grade in the QF area. Theorientation data are presented here as Inverse Pole Figures (IPF)maps (Figs. 5e7) and Pole Figures (PFs) (Fig. 8). In the inverse polefigure maps colors represent the crystallographic directions whichare oriented in a particular direction of the sample referencesystem, in this case, the Z direction, which corresponds to the poleof the rock’s foliation plane. Through these maps, it is possible tomake a direct correlation between microstructures and CPOs. Inorder to make the distinction between the CPOs of the differentiron oxides phases, a phase map corresponding to each IPF map isalso presented. In these phase maps, the phase boundaries sharedbetween magnetite and new hematite crystals are represented.
Fig. 5. Phase and Inverse Pole Figure (IPF) orientation maps obtained through EBSD analysiare in red and magnetite ones in blue. In these maps, the phase boundaries between magndifferent colors in maps, which correspond to different crystallographic orientation of the sacan be observed. (For interpretation of the references to color in this figure legend, the rea
Comparing samples from the different domains, a remarkableincrease in the intensity of the CPO patterns can be observed. IPFmaps from western domain (Fig. 5) show a great dispersion oncrystallographic orientation. Maps from the intermediate domain(Fig. 6) show an increase in CPO. The ‘red’ hematite grains in IPFmaps, with platelet shape, have their basal planes aligned with thefoliation plane. However, grains with more granular shapes tend toshow a somewhat divergent CPO. The hematite aggregates fromeastern domain have a strong CPO. They show a single maximumaround the Z direction (Fig. 7), due to the strong alignment of thebasal planes with the foliation plane.
The poles to the main crystallographic planes were plotted inrelation to the X-Z reference system in the stereographic projec-tion, lower hemisphere, with the foliation in EeW vertical posi-tion and the lineation horizontal also in EeW position. Comparing
s for samples from western low deformation domain. In phase maps, hematite crystalsetite and hematite and the grain boundaries are shown. Legends of IPF maps refer tomples related to its reference frame. a) Itatiaiuçu and b) Córrego do Feijão mine. No CPOder is referred to the web version of this article.)
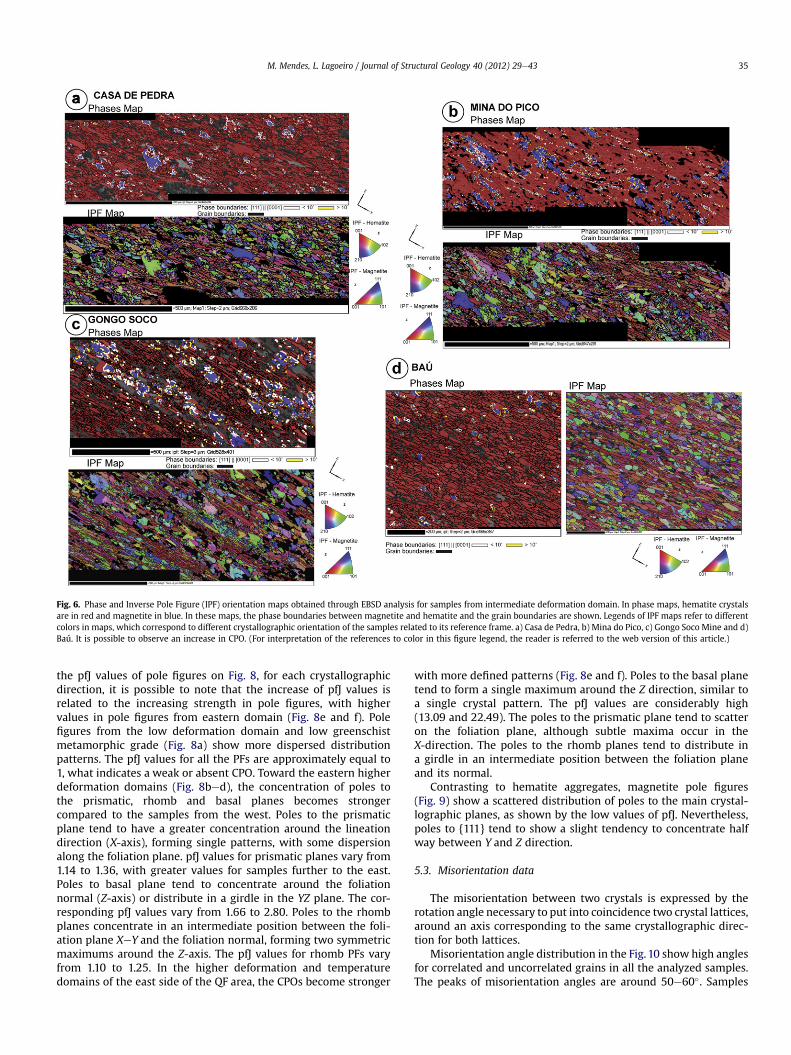
Fig. 6. Phase and Inverse Pole Figure (IPF) orientation maps obtained through EBSD analysis for samples from intermediate deformation domain. In phase maps, hematite crystalsare in red and magnetite in blue. In these maps, the phase boundaries between magnetite and hematite and the grain boundaries are shown. Legends of IPF maps refer to differentcolors in maps, which correspond to different crystallographic orientation of the samples related to its reference frame. a) Casa de Pedra, b) Mina do Pico, c) Gongo Soco Mine and d)Baú. It is possible to observe an increase in CPO. (For interpretation of the references to color in this figure legend, the reader is referred to the web version of this article.)
M. Mendes, L. Lagoeiro / Journal of Structural Geology 40 (2012) 29e43 35
the pfJ values of pole figures on Fig. 8, for each crystallographicdirection, it is possible to note that the increase of pfJ values isrelated to the increasing strength in pole figures, with highervalues in pole figures from eastern domain (Fig. 8e and f). Polefigures from the low deformation domain and low greenschistmetamorphic grade (Fig. 8a) show more dispersed distributionpatterns. The pfJ values for all the PFs are approximately equal to1, what indicates a weak or absent CPO. Toward the eastern higherdeformation domains (Fig. 8bed), the concentration of poles tothe prismatic, rhomb and basal planes becomes strongercompared to the samples from the west. Poles to the prismaticplane tend to have a greater concentration around the lineationdirection (X-axis), forming single patterns, with some dispersionalong the foliation plane. pfJ values for prismatic planes vary from1.14 to 1.36, with greater values for samples further to the east.Poles to basal plane tend to concentrate around the foliationnormal (Z-axis) or distribute in a girdle in the YZ plane. The cor-responding pfJ values vary from 1.66 to 2.80. Poles to the rhombplanes concentrate in an intermediate position between the foli-ation plane XeY and the foliation normal, forming two symmetricmaximums around the Z-axis. The pfJ values for rhomb PFs varyfrom 1.10 to 1.25. In the higher deformation and temperaturedomains of the east side of the QF area, the CPOs become stronger
with more defined patterns (Fig. 8e and f). Poles to the basal planetend to form a single maximum around the Z direction, similar toa single crystal pattern. The pfJ values are considerably high(13.09 and 22.49). The poles to the prismatic plane tend to scatteron the foliation plane, although subtle maxima occur in theX-direction. The poles to the rhomb planes tend to distribute ina girdle in an intermediate position between the foliation planeand its normal.
Contrasting to hematite aggregates, magnetite pole figures(Fig. 9) show a scattered distribution of poles to the main crystal-lographic planes, as shown by the low values of pfJ. Nevertheless,poles to {111} tend to show a slight tendency to concentrate halfway between Y and Z direction.
5.3. Misorientation data
The misorientation between two crystals is expressed by therotation angle necessary to put into coincidence two crystal lattices,around an axis corresponding to the same crystallographic direc-tion for both lattices.
Misorientation angle distribution in the Fig. 10 show high anglesfor correlated and uncorrelated grains in all the analyzed samples.The peaks of misorientation angles are around 50e60�. Samples
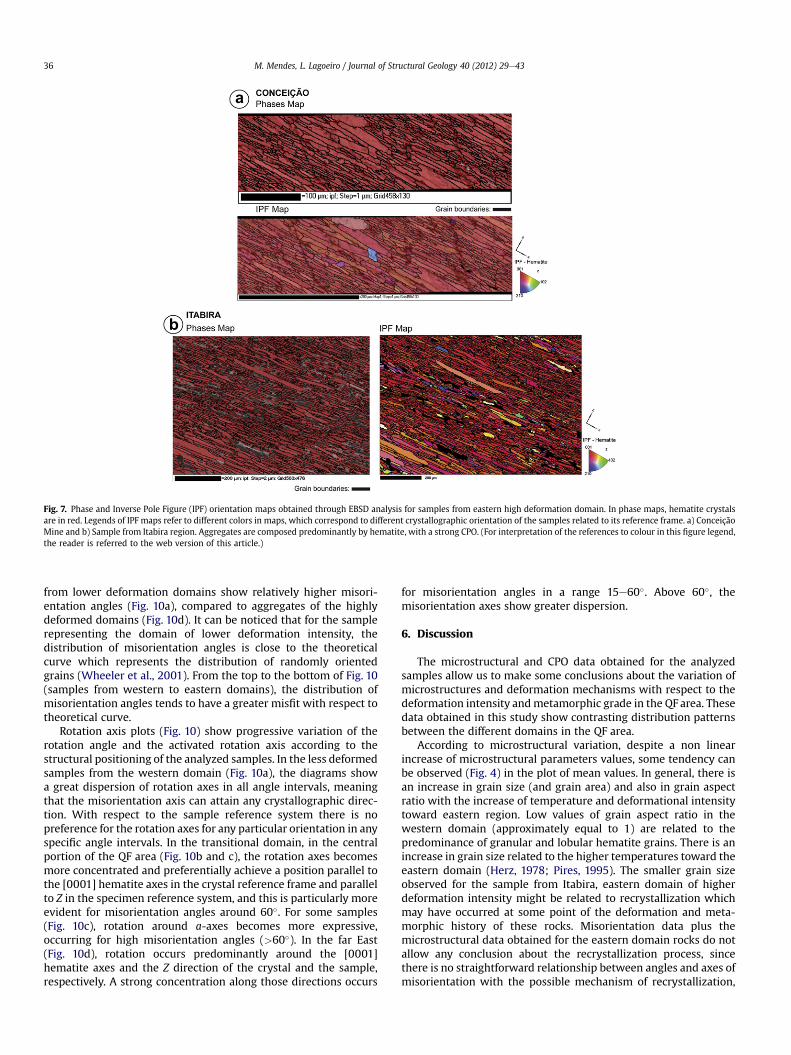
Fig. 7. Phase and Inverse Pole Figure (IPF) orientation maps obtained through EBSD analysis for samples from eastern high deformation domain. In phase maps, hematite crystalsare in red. Legends of IPF maps refer to different colors in maps, which correspond to different crystallographic orientation of the samples related to its reference frame. a) ConceiçãoMine and b) Sample from Itabira region. Aggregates are composed predominantly by hematite, with a strong CPO. (For interpretation of the references to colour in this figure legend,the reader is referred to the web version of this article.)
M. Mendes, L. Lagoeiro / Journal of Structural Geology 40 (2012) 29e4336
from lower deformation domains show relatively higher misori-entation angles (Fig. 10a), compared to aggregates of the highlydeformed domains (Fig. 10d). It can be noticed that for the samplerepresenting the domain of lower deformation intensity, thedistribution of misorientation angles is close to the theoreticalcurve which represents the distribution of randomly orientedgrains (Wheeler et al., 2001). From the top to the bottom of Fig. 10(samples from western to eastern domains), the distribution ofmisorientation angles tends to have a greater misfit with respect totheoretical curve.
Rotation axis plots (Fig. 10) show progressive variation of therotation angle and the activated rotation axis according to thestructural positioning of the analyzed samples. In the less deformedsamples from the western domain (Fig. 10a), the diagrams showa great dispersion of rotation axes in all angle intervals, meaningthat the misorientation axis can attain any crystallographic direc-tion. With respect to the sample reference system there is nopreference for the rotation axes for any particular orientation in anyspecific angle intervals. In the transitional domain, in the centralportion of the QF area (Fig. 10b and c), the rotation axes becomesmore concentrated and preferentially achieve a position parallel tothe [0001] hematite axes in the crystal reference frame and parallelto Z in the specimen reference system, and this is particularly moreevident for misorientation angles around 60�. For some samples(Fig. 10c), rotation around a-axes becomes more expressive,occurring for high misorientation angles (>60�). In the far East(Fig. 10d), rotation occurs predominantly around the [0001]hematite axes and the Z direction of the crystal and the sample,respectively. A strong concentration along those directions occurs
for misorientation angles in a range 15e60�. Above 60�, themisorientation axes show greater dispersion.
6. Discussion
The microstructural and CPO data obtained for the analyzedsamples allow us to make some conclusions about the variation ofmicrostructures and deformation mechanisms with respect to thedeformation intensity andmetamorphic grade in the QF area. Thesedata obtained in this study show contrasting distribution patternsbetween the different domains in the QF area.
According to microstructural variation, despite a non linearincrease of microstructural parameters values, some tendency canbe observed (Fig. 4) in the plot of mean values. In general, there isan increase in grain size (and grain area) and also in grain aspectratio with the increase of temperature and deformational intensitytoward eastern region. Low values of grain aspect ratio in thewestern domain (approximately equal to 1) are related to thepredominance of granular and lobular hematite grains. There is anincrease in grain size related to the higher temperatures toward theeastern domain (Herz, 1978; Pires, 1995). The smaller grain sizeobserved for the sample from Itabira, eastern domain of higherdeformation intensity might be related to recrystallization whichmay have occurred at some point of the deformation and meta-morphic history of these rocks. Misorientation data plus themicrostructural data obtained for the eastern domain rocks do notallow any conclusion about the recrystallization process, sincethere is no straightforward relationship between angles and axes ofmisorientation with the possible mechanism of recrystallization,
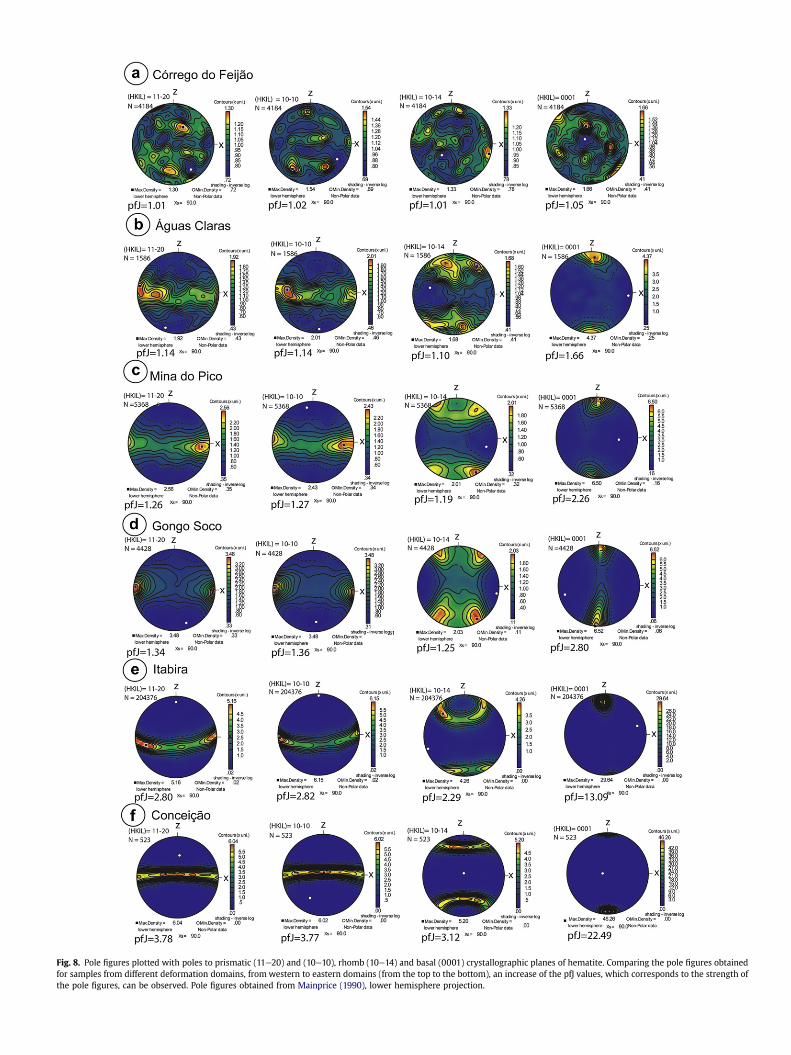
Fig. 8. Pole figures plotted with poles to prismatic (11e20) and (10e10), rhomb (10e14) and basal (0001) crystallographic planes of hematite. Comparing the pole figures obtainedfor samples from different deformation domains, fromwestern to eastern domains (from the top to the bottom), an increase of the pfJ values, which corresponds to the strength ofthe pole figures, can be observed. Pole figures obtained from Mainprice (1990), lower hemisphere projection.
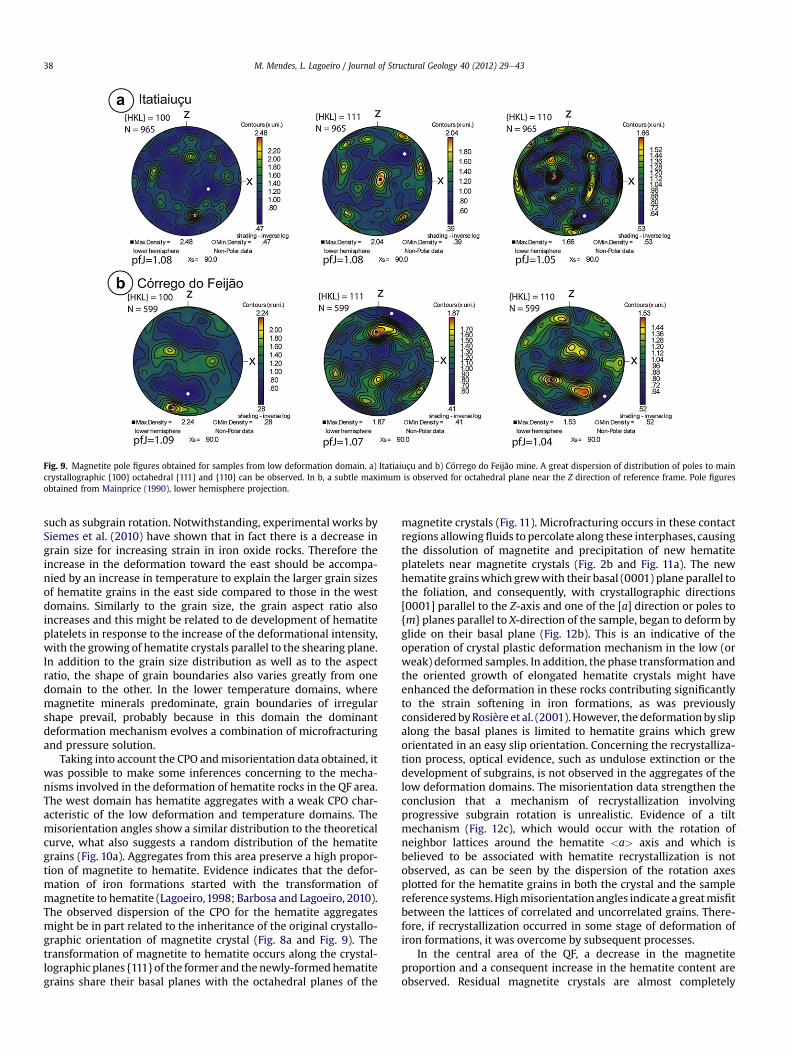
Fig. 9. Magnetite pole figures obtained for samples from low deformation domain. a) Itatiaiuçu and b) Córrego do Feijão mine. A great dispersion of distribution of poles to maincrystallographic {100} octahedral {111} and {110} can be observed. In b, a subtle maximum is observed for octahedral plane near the Z direction of reference frame. Pole figuresobtained from Mainprice (1990), lower hemisphere projection.
M. Mendes, L. Lagoeiro / Journal of Structural Geology 40 (2012) 29e4338
such as subgrain rotation. Notwithstanding, experimental works bySiemes et al. (2010) have shown that in fact there is a decrease ingrain size for increasing strain in iron oxide rocks. Therefore theincrease in the deformation toward the east should be accompa-nied by an increase in temperature to explain the larger grain sizesof hematite grains in the east side compared to those in the westdomains. Similarly to the grain size, the grain aspect ratio alsoincreases and this might be related to de development of hematiteplatelets in response to the increase of the deformational intensity,with the growing of hematite crystals parallel to the shearing plane.In addition to the grain size distribution as well as to the aspectratio, the shape of grain boundaries also varies greatly from onedomain to the other. In the lower temperature domains, wheremagnetite minerals predominate, grain boundaries of irregularshape prevail, probably because in this domain the dominantdeformation mechanism evolves a combination of microfracturingand pressure solution.
Taking into account the CPO andmisorientation data obtained, itwas possible to make some inferences concerning to the mecha-nisms involved in the deformation of hematite rocks in the QF area.The west domain has hematite aggregates with a weak CPO char-acteristic of the low deformation and temperature domains. Themisorientation angles show a similar distribution to the theoreticalcurve, what also suggests a random distribution of the hematitegrains (Fig. 10a). Aggregates from this area preserve a high propor-tion of magnetite to hematite. Evidence indicates that the defor-mation of iron formations started with the transformation ofmagnetite to hematite (Lagoeiro,1998; Barbosa and Lagoeiro, 2010).The observed dispersion of the CPO for the hematite aggregatesmight be in part related to the inheritance of the original crystallo-graphic orientation of magnetite crystal (Fig. 8a and Fig. 9). Thetransformation of magnetite to hematite occurs along the crystal-lographic planes {111} of the formerand thenewly-formedhematitegrains share their basal planes with the octahedral planes of the
magnetite crystals (Fig. 11). Microfracturing occurs in these contactregions allowingfluids to percolate along these interphases, causingthe dissolution of magnetite and precipitation of new hematiteplatelets near magnetite crystals (Fig. 2b and Fig. 11a). The newhematite grainswhich grewwith their basal (0001) plane parallel tothe foliation, and consequently, with crystallographic directions[0001] parallel to the Z-axis and one of the [a] direction or poles to{m} planes parallel to X-direction of the sample, began to deform byglide on their basal plane (Fig. 12b). This is an indicative of theoperation of crystal plastic deformation mechanism in the low (orweak) deformed samples. In addition, the phase transformation andthe oriented growth of elongated hematite crystals might haveenhanced the deformation in these rocks contributing significantlyto the strain softening in iron formations, as was previouslyconsideredbyRosière et al. (2001).However, thedeformationbyslipalong the basal planes is limited to hematite grains which greworientated in an easy slip orientation. Concerning the recrystalliza-tion process, optical evidence, such as undulose extinction or thedevelopment of subgrains, is not observed in the aggregates of thelow deformation domains. The misorientation data strengthen theconclusion that a mechanism of recrystallization involvingprogressive subgrain rotation is unrealistic. Evidence of a tiltmechanism (Fig. 12c), which would occur with the rotation ofneighbor lattices around the hematite <a> axis and which isbelieved to be associated with hematite recrystallization is notobserved, as can be seen by the dispersion of the rotation axesplotted for the hematite grains in both the crystal and the samplereference systems.Highmisorientation angles indicate a greatmisfitbetween the lattices of correlated and uncorrelated grains. There-fore, if recrystallization occurred in some stage of deformation ofiron formations, it was overcome by subsequent processes.
In the central area of the QF, a decrease in the magnetiteproportion and a consequent increase in the hematite content areobserved. Residual magnetite crystals are almost completely
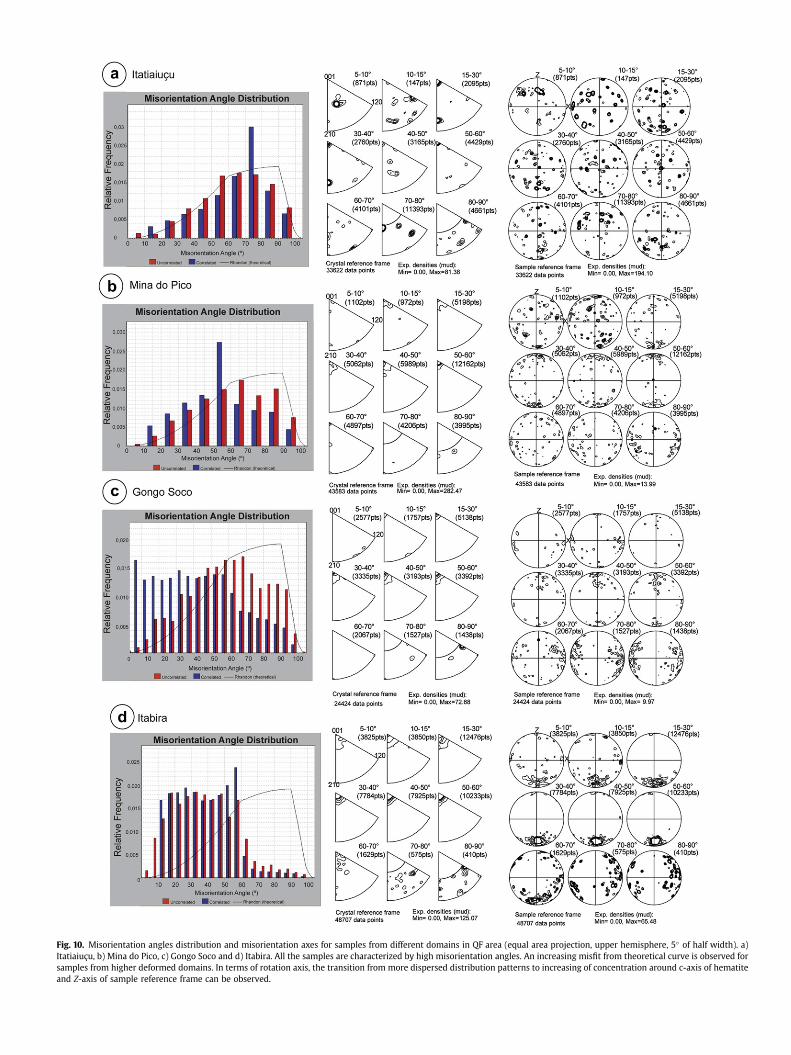
Fig. 10. Misorientation angles distribution and misorientation axes for samples from different domains in QF area (equal area projection, upper hemisphere, 5� of half width). a)Itatiaiuçu, b) Mina do Pico, c) Gongo Soco and d) Itabira. All the samples are characterized by high misorientation angles. An increasing misfit from theoretical curve is observed forsamples from higher deformed domains. In terms of rotation axis, the transition from more dispersed distribution patterns to increasing of concentration around c-axis of hematiteand Z-axis of sample reference frame can be observed.
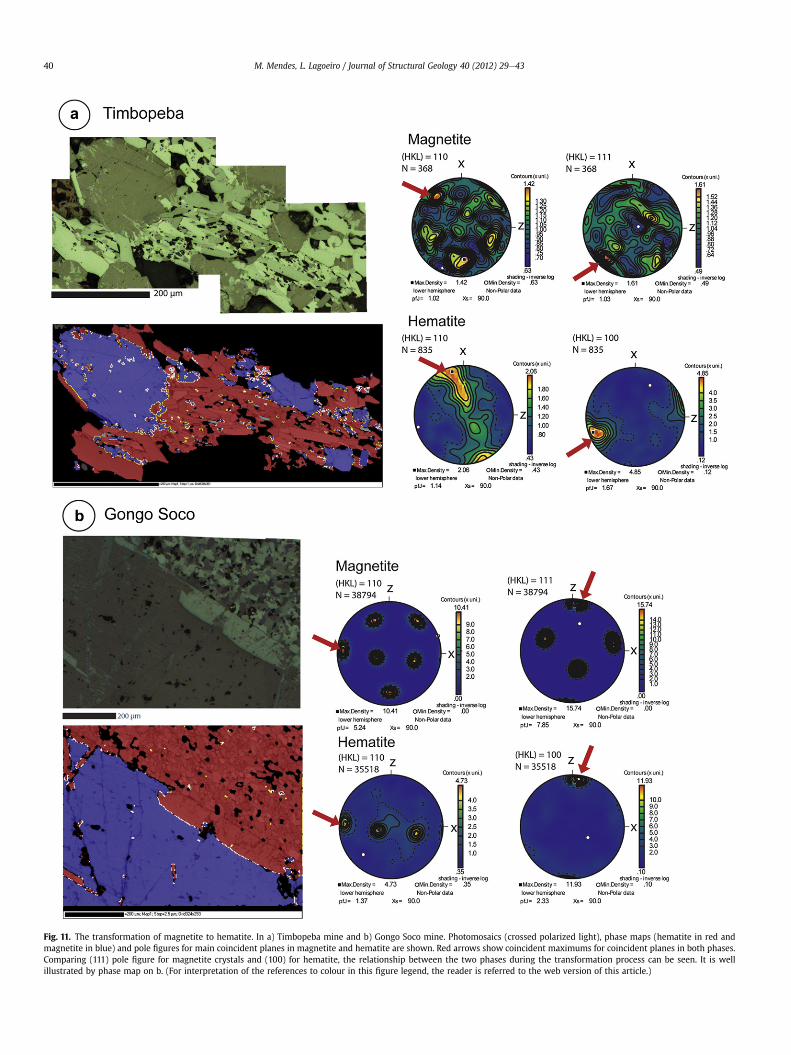
Fig. 11. The transformation of magnetite to hematite. In a) Timbopeba mine and b) Gongo Soco mine. Photomosaics (crossed polarized light), phase maps (hematite in red andmagnetite in blue) and pole figures for main coincident planes in magnetite and hematite are shown. Red arrows show coincident maximums for coincident planes in both phases.Comparing (111) pole figure for magnetite crystals and (100) for hematite, the relationship between the two phases during the transformation process can be seen. It is wellillustrated by phase map on b. (For interpretation of the references to colour in this figure legend, the reader is referred to the web version of this article.)
M. Mendes, L. Lagoeiro / Journal of Structural Geology 40 (2012) 29e4340
M. Mendes, L. Lagoeiro / Journal of Structural Geology 40 (2012) 29e43 41
transformed to hematite. The CPO patterns become more defined(Fig. 6 and Fig. 8bed) and misorientation angle distribution histo-grams show an increasing misfit of the distribution of misorienta-tion angles and the theoretical curve. This represents a shift fromthe more random distribution of hematite aggregate in the west topreferred oriented crystals in the east side. As we can infer from theCPO patterns obtained for the hematite aggregates in this domain(Fig. 8bed), the accommodation of the deformation by slip on basalplanes of hematite platelets (Fig. 12b) becomes more efficient. Amore pervasive foliation developed in these higher deformeddomains (Fig. 6). New crystals of hematite have a more pronouncedshape orientation and the platelet grains have their basal planesorientated parallel to the foliation, an easy glide orientation forhematite crystals. The glide occurs in the <a>-direction, along the(0001) hematite planes parallel to the poles to the first or secondorder prismatic planes. This might account for the girdle shape ofthe pole figures of prismatic planes around the x-axis of referenceframe. Hematite crystals do not show any optical sign of crystal-plastic deformation. Misorientation data do not support anyevidence for a subgrain rotation recrystallization, a similar char-acteristic to the low deformation western domains. However,a dynamic recrystalization mechanism involving progressive sub-grain rotation cannot be totally ruled out. This process might haveoccurred, and grain boundary slidingmechanism aswell as rotationaround [c] axis (Fig. 12d), might have caused a scattering in themisorientation angles. There is some concentration of the rotationaxes around the pole to the prism planes (Fig. 10c), but, only forhigh misorientation angles, in which case it is difficult to establishany relationship with a particular recrystallization processes.Concentrations of the rotation axes around the c- and the z-axes ofthe crystal and sample reference system, respectively (Fig. 10b andc), and some dispersion of the poles to the prism planes and the a-axes in pole figures might be due to a rotation of hematite grains
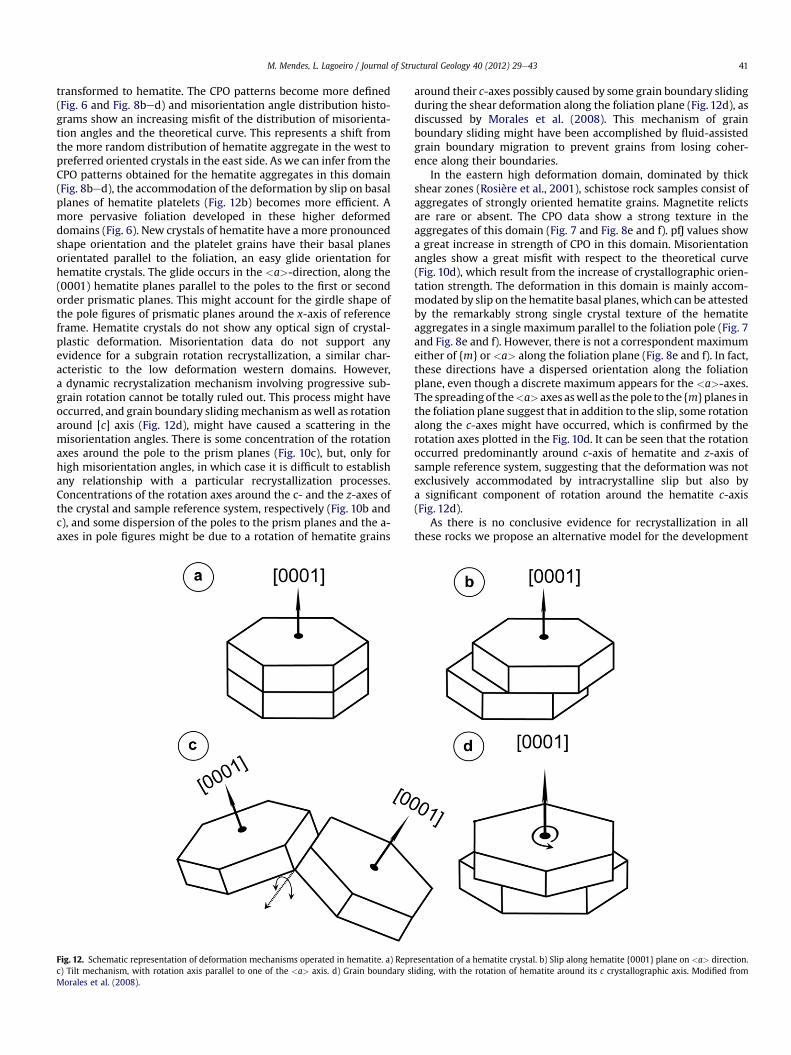
Fig. 12. Schematic representation of deformation mechanisms operated in hematite. a) Reprc) Tilt mechanism, with rotation axis parallel to one of the <a> axis. d) Grain boundary sMorales et al. (2008).
around their c-axes possibly caused by some grain boundary slidingduring the shear deformation along the foliation plane (Fig. 12d), asdiscussed by Morales et al. (2008). This mechanism of grainboundary sliding might have been accomplished by fluid-assistedgrain boundary migration to prevent grains from losing coher-ence along their boundaries.
In the eastern high deformation domain, dominated by thickshear zones (Rosière et al., 2001), schistose rock samples consist ofaggregates of strongly oriented hematite grains. Magnetite relictsare rare or absent. The CPO data show a strong texture in theaggregates of this domain (Fig. 7 and Fig. 8e and f). pfJ values showa great increase in strength of CPO in this domain. Misorientationangles show a great misfit with respect to the theoretical curve(Fig. 10d), which result from the increase of crystallographic orien-tation strength. The deformation in this domain is mainly accom-modated by slip on the hematite basal planes, which can be attestedby the remarkably strong single crystal texture of the hematiteaggregates in a single maximum parallel to the foliation pole (Fig. 7and Fig. 8e and f). However, there is not a correspondent maximumeither of {m} or <a> along the foliation plane (Fig. 8e and f). In fact,these directions have a dispersed orientation along the foliationplane, even though a discrete maximum appears for the <a>-axes.The spreadingof the<a> axes aswell as the pole to the {m} planes inthe foliation plane suggest that in addition to the slip, some rotationalong the c-axes might have occurred, which is confirmed by therotation axes plotted in the Fig. 10d. It can be seen that the rotationoccurred predominantly around c-axis of hematite and z-axis ofsample reference system, suggesting that the deformation was notexclusively accommodated by intracrystalline slip but also bya significant component of rotation around the hematite c-axis(Fig. 12d).
As there is no conclusive evidence for recrystallization in allthese rocks we propose an alternative model for the development
esentation of a hematite crystal. b) Slip along hematite {0001} plane on <a> direction.liding, with the rotation of hematite around its c crystallographic axis. Modified from
M. Mendes, L. Lagoeiro / Journal of Structural Geology 40 (2012) 29e4342
of preferred orientated hematite crystals in the studied rocks. Thenew hematite grains might have been formed by a direct trans-formation from the magnetite grains. Therefore, the new-formedhematite crystals inherited their orientations from the hostmagnetite (Fig. 11). However, only new-crystallized hematite grainswhich grew from magnetite crystals having their {111} planesparallel to the shear plane were oriented favorably for slip on basalplanes. As those favorable oriented grains become more prevalentover the other orientations, a great amount of grains with theirbasal planes parallel to each other start to accommodate thedeformation not solely by slip but also by sliding along boundariesparallel to the (0001) planes. Hematite grains rotated and acquireda stable position at misorientation angles 50e60�, in a moreexpressive way in the higher deformed domains. This angle intervalmight be related to the trigonal symmetry of hematite crystals. Thisin other minerals such as quartz of trigonal symmetry is normallydescribed as a twinning relationship of the Dauphiné type (Tullisand Tullis, 1972) and this, similarly for quartz crystals, mightrepresent for hematite neighboring crystals special boundaries oflower energy configuration.
Experimental triaxial compression in polycrystalline hematite(Siemes et al., 2003) resulted in {a} <m> slip below 800 �C and (c)<a> slip at 800 and 900�. Our results do not confirm the existenceof a slip along prismatic planes. In our samples, slip along basalplanes is the predominant mechanism. Compression tests inhematite single crystals (Siemes et al., 2008) indicated the exis-tence of twinning, {a} <m> slip and (c) <a> slip. However, noevidence of both twinning and prismatic slip was found.
The results obtained here are in agreement with recent torsionexperiments on hematite aggregates (Kunze et al., 2008; Siemeset al., 2010, 2011). Pole figures exhibit similar patterns to thoseillustrated by these authors. According to these authors, there is anincrease in CPO with the increase of temperature and strain duringexperiments. Nevertheless, Siemes et al. (2010, 2011) advocate,through the experiments results, that the texture intensity isdependent of initialmicrostructure of the aggregates. This is a factorthat we cannot control on naturally deformed samples. Values forstress exponent n obtained by Siemes et al. (2010) suggest a combi-nation of intracrystalline dislocation creep and GBS, which is inaccordance with our interpretations, although direct evidence fordynamic recrystallization is hard to find in these rocks.
Our results also agree with the data obtained by Rosière et al.(2001), especially concerning the variations of textural dataobtained according to tectonometamorphic context in the QF area.The deformation occurred by intracrystalline slip along the basalplanes of newly-formed hematite platelets resulting from theanisotropic growth of specular hematite. Nevertheless, in the lightof the results obtained by this study, evidence for recrystallizationprocesses, considered by those authors, could not be conclusive.
7. Conclusions
Based on the observation of the microstructures as well as thedata on hematite crystal fabrics we drew the following conclusions:
� The variation in the temperature and deformation intensity inthe Quadrilátero Ferrífero area caused a diversity of micro-structural and textural features;
� Variation in hematite grain sizes and grain shapes are the resultof the deformational processes that had affected these rocks;
� The phase transformation and the growth of oriented elon-gated hematite crystals might have enhanced the deformationin these aggregates, contributing to the strain softening in ironore bodies;
� The deformation mechanisms varied with the increasing oftemperature and deformation intensity. Initial aggregates fromthe western region of lower deformation intensity, composedof hematite and a great amount of magnetite, deformedmainlybymicrofracturing. These aggregates were submitted to a greatchange, due to the transformation of magnetite to hematite bythe mechanism of dissolution/precipitation creep. With theincrease in deformational and temperature gradients, in thecentral and eastern regions of QF, actuation of crystal plasticmechanism of intracrystalline slip and the grain boundarysliding took place;
� Our set of data does not support the existence of recrystalli-zation processes in these aggregates. Nevertheless we do noteliminate the possibility that this process might have occurredat some point of the evolutional history of these rocks, but wassuperimposed by later processes.
Acknowledgments
The authors are grateful to Gilberto Álvares for essential help onsample preparations and to Heinrich Siemes and Luiz Morales, fortheir thoughtful reviews. Mônica Mendes is grateful to CristianeGonçalves, Humberto Reis, Fernando Alkmim and Luiz Morales forvaluable discussions. This project was funded by CNPq project n�
478776/2009-8.
References
Alkmim, F., Marshak, S., 1998. Transamazonian orogeny in the southern São Fran-cisco craton region, Minas Gerais, Brazil: evidence for Paleoproterozoic collisionand collapse in the Quadrilátero Ferrífero. Precambrian Research 90, 29e58.
Almeida, F.F.M., 1977. O Cráton do São Francisco. Revista Brasileira de Geociências 7,349e364.
Barbosa, P.F., Lagoeiro, L., 2010. Crystallographic texture of the magnetite-hematitetransformation: evidence for topotactic relationships in natural samples fromQuadrilátero Ferrífero, Brazil. American Mineralogist 95, 118e125.
Chemale Jr., F., Rosière, C.A., Endo, I., 1994. The tectonic evolution of the Quad-rilátero Ferrífero, Minas Gerais, Brazil. Precambrian Research 65, 25e54.
Dorr 2nd, J.N., 1969. Physiographic, stratigraphic and structural development of theQuadrilátero Ferrífero, Minas Gerais. US Geological Survey Professional Paper641-A, 1e110.
Herz, N., 1978. Metamorphic rocks of the Quadrilátero Ferrífero, Minas Gerais,Brazil. US Geological Survey Professional Paper 641-C, 1e81.
Kunze, K., Siemes, H., Rybacki, E., Jansen, E., Brokmeier, H.G., 2008. Microstructureand texture from experimentally deformed hematite ore. In: Richter, S.,Schwedt, A. (Eds.), EMC 2008. Materials Science, 14th European MicroscopyCongress, vol. 2. Springer-Verlag, Berlin Heidelberg, pp. 827e828.
Lagoeiro, L., 1998. Transformation of magnetite to hematite and its influence on thedissolution of iron oxide minerals. Journal of Metamorphic Geology 16,415e423.
Mainprice, D., 1990. An efficient Fortran program to calculate seismic anisotropyfrom the lattice preferred orientation of minerals. Computers & Geosciences 16,385e393.
Marshak, S., Alkmim, F.F., 1989. Proterozoic contraction/extension tectonics ofthe southern São Francisco region, Minas Gerais, Brazil. Tectonics 8,555e571.
Michibayashi, K., Mainprice, D., 2004. The role of pre-existing mechanical anisot-ropy on shear zone development within oceanic mantle lithosphere: anexample from the Oman ophiolite. Journal of Petrology 45 (2), 405e414.
Morales, L.F.G., Lagoeiro, L.E., Endo, I., 2008. Crystallographic fabric developmentalong a folded polycrystalline hematite. Journal of Structural Geology 30,1218e1228.
Morales, L.F.G., Lagoeiro, L.E., Endo, I., 2008b. First results on the LPO-derivedseismic properties of iron ores from the Quadrilátero Ferrífero region, south-eastern Brazil. Tectonophysics 460, 21e33.
Pires, F.R.M., 1995. Textural and mineralogical variations during the meta-morphism of the Proterozoic Itabira Iron formation in the Quadrilátero Fer-rífero, Minas Gerais, Brazil. Anais da Academia Brasileira de Ciências 67 (1),77e105.
Prior, D.J., Boyle, A.P., Brenker, F., Cheadle, M.C., Day, A., Lopez, G., Potts, G.J.,Reddy, S., Spiess, R., Timms, N., Trimbby, P., Wheeler, J., Zetterstrom, L., 1999.The application of electron backscatter diffraction and orientation contrastimaging in the SEM to textural problems in rocks. American Mineralogist 84,1741e1759.

M. Mendes, L. Lagoeiro / Journal of Structural Geology 40 (2012) 29e43 43
Rosière, C.A., Quade, H., Brokmeier, H.G., Jansen, E.M., 2001. Microstructures,textures and deformation mechanisms in hematite. Journal of StructuralGeology 23, 1429e1440.
Rosière, C.A., Rios, F.J., 2004. The origin of hematite in high-grade ores based oninfrared microscopy and fluid inclusion studies: the example of ConceiçãoMine, Quadrilátero Ferrífero, Brazil. Economic Geologists 99, 611e624.
Rosière, C.A., Spier, C.A., Rios, F.J., Suckau, V.E., 2008. The itabirites of the Quad-rilátero Ferrífero and related high-grade iron ore deposits: an overview. Societyof Economic Geologists Reviews 15, 223e254.
Siemes, H., Schaeben, H., Rosière, C.A., Quade, H., 2000. Crystallographic andmagnetic preferred orientation of hematite in banded iron ores. Journal ofStructural Geology 22 (11/12), 1747e1761.
Siemes, H., Klingenberg, B., Rybacki, E., Naumann, M., Schäfer, W., Jansen, E.,Rosière, C.A., 2003. Texture, microstructure, and strength of hematite oresexperimentally deformed in the temperature range 600e1100 �C and atstrain rates between 10�4 and 10�6 s�1. Journal of Structural Geology 25,1371e1391.
Siemes, H., Klingenberg, B., Rybacki, E., Naumann, M., Schäfer, W., Jansen, E.,Kunze, K., 2008. Glide systems of hematite single crystals in deformationexperiments. Ore Geology Reviews 33, 255e279.
Siemes, H., Rybacki, E., Kunze, K., Klingenberg, B., Naumann, M., Jansen, E.,Brokmeier, H.-G., 2010. Development of microstructure and texture of hematiteores deformed to large strain in torsion: can texture identify the prevailingstrength and creep mechanisms during deformation? Advanced EngineeringMaterials 12, 1003e1007.
Siemes, H., Rybacki, E., Klingenberg, B., Rosière, C.A., 2011. Development ofa recrystallized grain size piezometer for hematite based on high-temperaturetorsion experiments. European Journal of Mineral 23, 293e302.
Tullis, J., Tullis, T., 1972. Preferred orientation of quartz produced by mechanicalDauphiné twinning: thermodynamics and axial experiments. AmericanGeophysical Union Monograph 16, 67e82.
Wheeler, J., Prior, D.J., Jiang, Z., Spiess, R., Trimby, P.W., 2001. The petrologicalsignificance of misorientations between grains. Contributions to Mineralogyand Petrology 141, 109e124.