microsoft access 5: reports & other useful functions · · 2016-06-14microsoft access 5:...
TRANSCRIPT
Access 5: Reports Page 1 of 14 10/9/2012:mms
Microsoft Access 5: Reports & Other Useful Functions
You can print out simple records of your data by using the Office menu. However, if you want to create a customized report from one or more tables or queries with calculations, graphics, and a customized header or footer, you can use the Report function of Access. You can present detailed or summarized information from various elements of your database in your report. Reports can do the followings:
You can apply attractive formatting to help make your report easier to read and understand.
You can include headers and footers that include identifying information at the top and bottom of every page (such as the date and time, grand totals, subtotals, page numbers, etc.)
You can group and sort your information.
You can insert graphics to enhance the appearance of your report with clip art, photos, or scanned images.
Many features and terms we have dealt with in the Form element apply to Reports as well such as bound and unbound controls or calculated fields. However, you cannot edit the data in the report. Click on the Create tab to explore the Reports group.
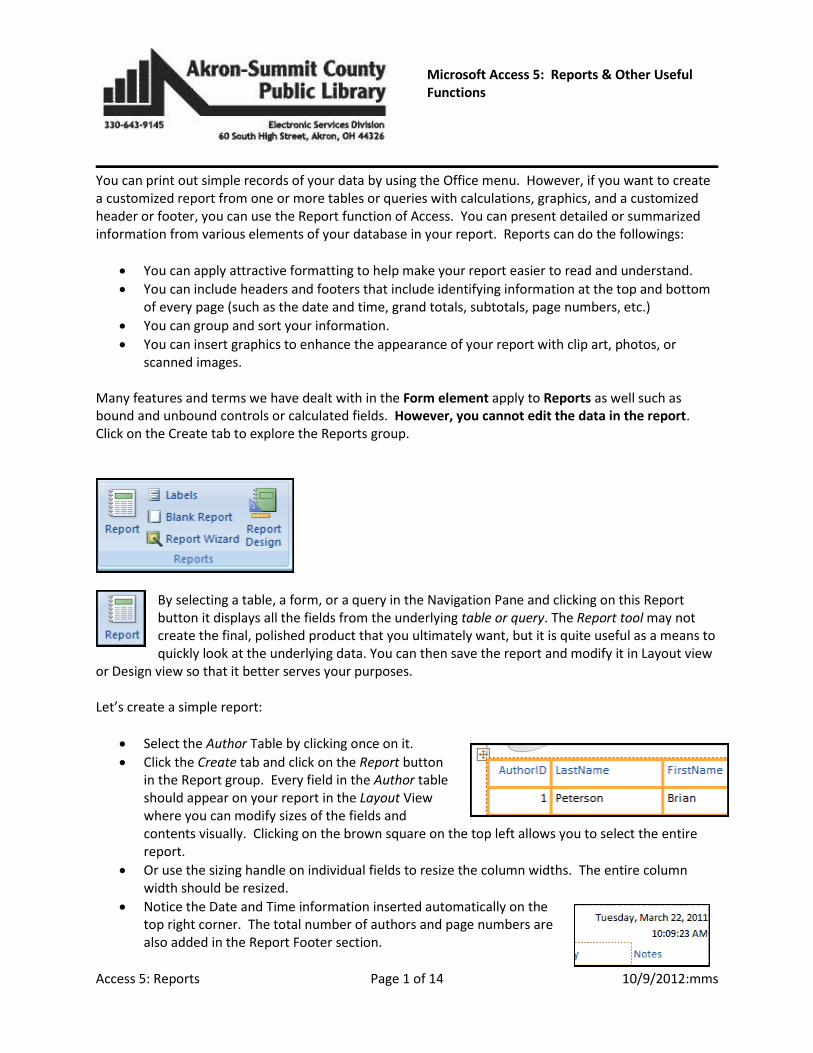
By selecting a table, a form, or a query in the Navigation Pane and clicking on this Report button it displays all the fields from the underlying table or query. The Report tool may not create the final, polished product that you ultimately want, but it is quite useful as a means to quickly look at the underlying data. You can then save the report and modify it in Layout view
or Design view so that it better serves your purposes. Let’s create a simple report:
Select the Author Table by clicking once on it.
Click the Create tab and click on the Report button in the Report group. Every field in the Author table should appear on your report in the Layout View where you can modify sizes of the fields and contents visually. Clicking on the brown square on the top left allows you to select the entire report.
Or use the sizing handle on individual fields to resize the column widths. The entire column width should be resized.
Notice the Date and Time information inserted automatically on the top right corner. The total number of authors and page numbers are also added in the Report Footer section.

Access 5: Reports Page 2 of 14 10/9/2012:mms
Switching to the Design view will give you a better idea of each Report sections explained on page 3 below. First, de-select all fields by clicking on an empty area on the design grid. Try adjusting the width of the Notes field alone and move the date/time information to right-align with the Notes column. Adjust the Design view grid to eliminate the extra empty space on the report.
Switch to the Print view and select the Landscape orientation under the Page Layout.
You will be asked to save the report upon quitting. Save the report as “Author”.
Report Views Commands on the Status bar on right at the bottom of the screen
Commands on the Home tab under the View button
Access 5: Reports Page 3 of 14 10/9/2012:mms
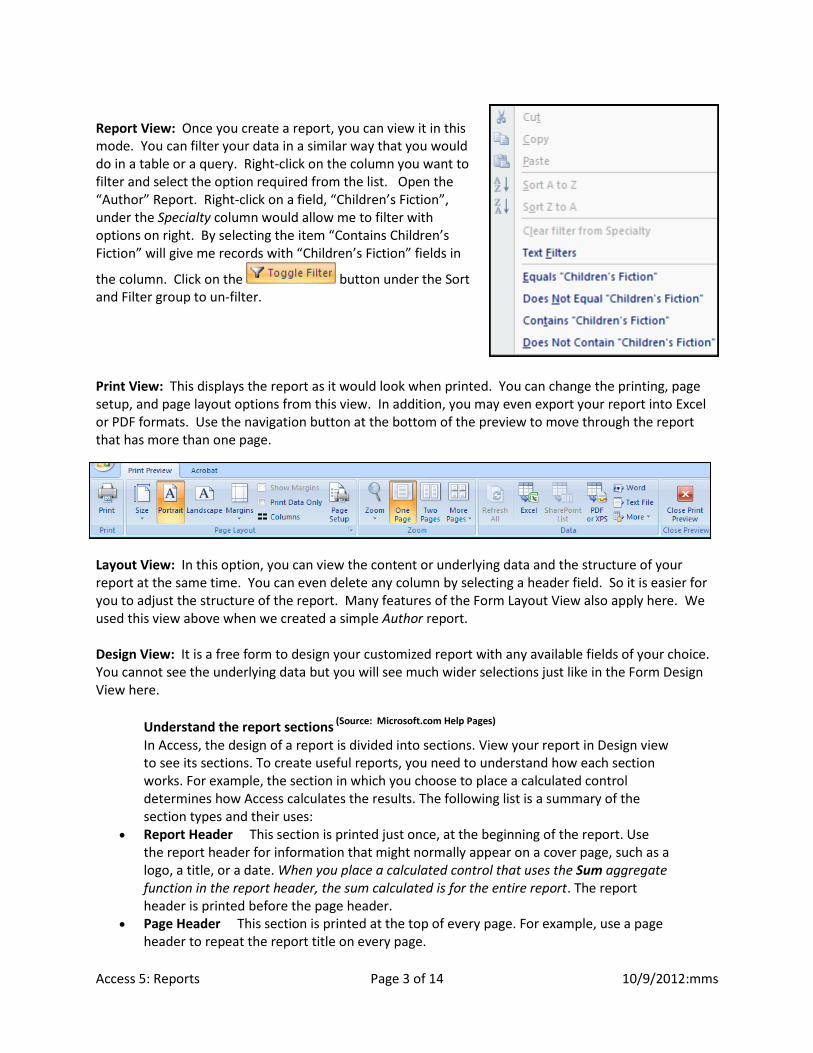
Report View: Once you create a report, you can view it in this mode. You can filter your data in a similar way that you would do in a table or a query. Right-click on the column you want to filter and select the option required from the list. Open the “Author” Report. Right-click on a field, “Children’s Fiction”, under the Specialty column would allow me to filter with options on right. By selecting the item “Contains Children’s Fiction” will give me records with “Children’s Fiction” fields in
the column. Click on the button under the Sort and Filter group to un-filter. Print View: This displays the report as it would look when printed. You can change the printing, page setup, and page layout options from this view. In addition, you may even export your report into Excel or PDF formats. Use the navigation button at the bottom of the preview to move through the report that has more than one page.
Layout View: In this option, you can view the content or underlying data and the structure of your report at the same time. You can even delete any column by selecting a header field. So it is easier for you to adjust the structure of the report. Many features of the Form Layout View also apply here. We used this view above when we created a simple Author report. Design View: It is a free form to design your customized report with any available fields of your choice. You cannot see the underlying data but you will see much wider selections just like in the Form Design View here.
Understand the report sections (Source: Microsoft.com Help Pages)
In Access, the design of a report is divided into sections. View your report in Design view to see its sections. To create useful reports, you need to understand how each section works. For example, the section in which you choose to place a calculated control determines how Access calculates the results. The following list is a summary of the section types and their uses:
Report Header This section is printed just once, at the beginning of the report. Use the report header for information that might normally appear on a cover page, such as a logo, a title, or a date. When you place a calculated control that uses the Sum aggregate function in the report header, the sum calculated is for the entire report. The report header is printed before the page header.
Page Header This section is printed at the top of every page. For example, use a page header to repeat the report title on every page.

Access 5: Reports Page 4 of 14 10/9/2012:mms
Group Header This section is printed at the beginning of each new group of records. Use the group header to print the group name. For example, in a report that is grouped by product, use the group header to print the product name. When you place a calculated control that uses the Sum aggregate function in the group header, the sum is for the current group. Let’s place a group for the “Specialty” section. Click on the “Add a group” button
in the lower half of the Report in the Design View. Select “Specialty” from the drop-down menu. Next, click on the
“more” button. Then, click on the drop-down arrow next to the
button and count the total on the “Specialty” field and check the box that says “show in group footer”. You will see that the same specialty field is grouped and counted with results in the group footer section. Use the “Save As” function to save this report as “Author w/ Specialty” Report. (Note: Grouping or Sorting can be done both in Layout View and in Design View. If you carry out grouping in the Layout View, the field you are grouping on is shifted to the furthest left column automatically. If you add another subgroup, that field is then placed right next to the main field. If you add grouping in the Design View, the order of fields will not change.)
Detail This section is printed once for every row in the record source. This is where you place the controls that make up the main body of the report.
Group Footer This section is printed at the end of each group of records. Use a group footer to print summary information for a group.
Page Footer This section is printed at the end of every page. Use a page footer to print page numbers or per-page information.
Report Footer This section is printed just once, at the end of the report. Use the report footer to print report totals or other summary information for the entire report. Note In Design view, the report footer appears below the page footer. However, when the report is printed or previewed, the report footer appears above the page footer, just after the last group footer or detail line on the final page.
This can be a very quick way to build a report, especially if you plan to put only a few fields on your report. When you click on the Blank Report button, a blank report is displayed in Layout view, and the Field List pane is displayed on the right side of the Access window. In the Field List pane, click the plus sign next to the table or tables containing the fields that you want to see on the report. Drag each field onto the report one at a time or double-click on the field, or hold down CTRL and select several fields, and then drag them onto the report at the same time. You will have to place your own calculated fields to appear on the report.
To enhance your blank report, use the tools in the Controls group on the Format tab to add a logo, title, page numbers, or the date and time to the report.
Access 5: Reports Page 5 of 14 10/9/2012:mms
It is similar to the Blank Report button where you can create a customized report from scratch in a Design View. You can create more advanced design changes to a report, such as adding custom control types and writing codes.
Let’s create another simple report from one of our queries available: Author Age query.
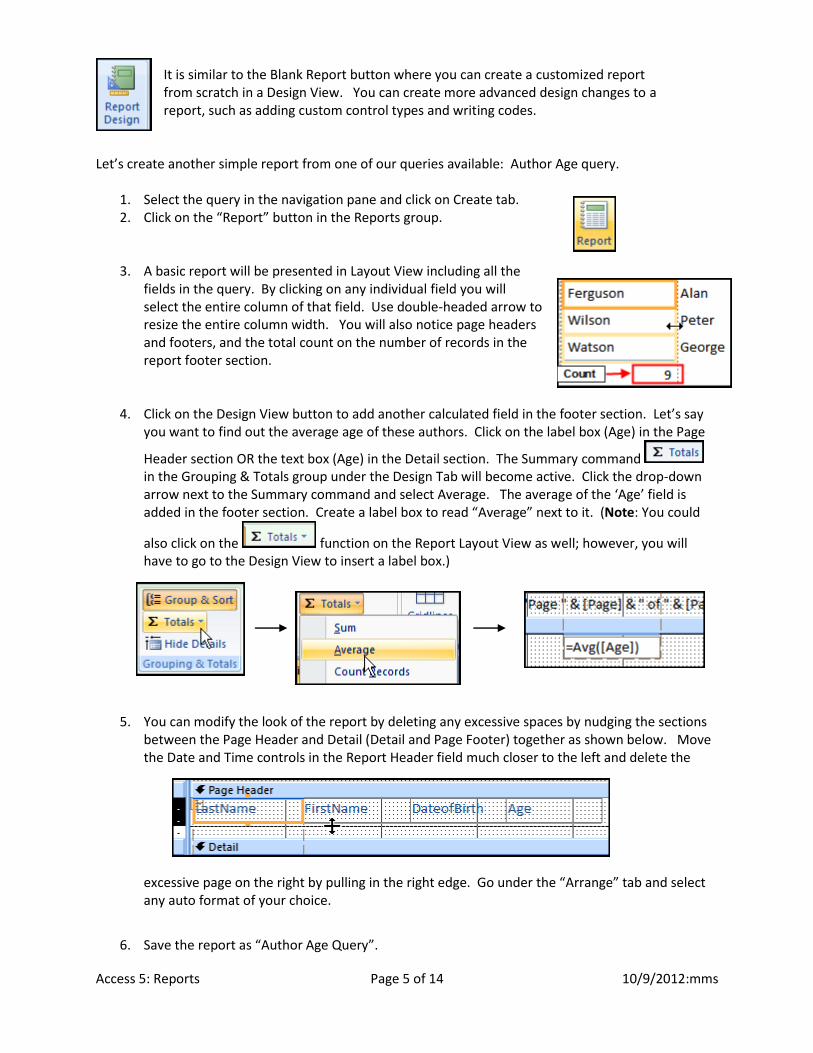
1. Select the query in the navigation pane and click on Create tab. 2. Click on the “Report” button in the Reports group.
3. A basic report will be presented in Layout View including all the fields in the query. By clicking on any individual field you will select the entire column of that field. Use double-headed arrow to resize the entire column width. You will also notice page headers and footers, and the total count on the number of records in the report footer section.
4. Click on the Design View button to add another calculated field in the footer section. Let’s say you want to find out the average age of these authors. Click on the label box (Age) in the Page
Header section OR the text box (Age) in the Detail section. The Summary command in the Grouping & Totals group under the Design Tab will become active. Click the drop-down arrow next to the Summary command and select Average. The average of the ‘Age’ field is added in the footer section. Create a label box to read “Average” next to it. (Note: You could
also click on the function on the Report Layout View as well; however, you will have to go to the Design View to insert a label box.)
5. You can modify the look of the report by deleting any excessive spaces by nudging the sections between the Page Header and Detail (Detail and Page Footer) together as shown below. Move the Date and Time controls in the Report Header field much closer to the left and delete the
excessive page on the right by pulling in the right edge. Go under the “Arrange” tab and select any auto format of your choice.
6. Save the report as “Author Age Query”.

Access 5: Reports Page 6 of 14 10/9/2012:mms
Practice: Select “Calculate on Title, Author, and Publishers Details” Query in the navigation pane and create a report by using the Report button. Insert a “sum” function for the “Number of Copies” field. Adjust the height of the Label boxes in the Page Header Section to 0.5” in the Property Sheet pane. Use one of the Auto Format Styles under the Arrange tab. Save the report under the same name.
Use this Label Wizard to easily create labels for a wide variety of standard label sizes. In the
Navigation Pane, click once on the table or query that will be the record source for your labels. On the Create tab, in the Reports group, click Labels. Follow the directions on the pages of the Label Wizard. You can customize the display of your label along the way. On the last page, click Finish.
Practice: Select the Author table in the navigation pane on the left and click on the Label command under the Create tab in the Report group. Follow the directions to use the Avery 5160 Label in the Label wizard. Customize it to include the fields shown on the right by double-clicking on each field. Type in comma(s) and spaces between each field as you would like them to appear on your label. Hit Enter to place a field in the next line. Save the label as “Labels Author”. Use Print Preview mode to see how your labels would look before printing.
You can use the Report Wizard to be more selective about what fields appear on your report. You can also specify how the data is grouped and sorted, and you can
use fields from more than one table or query, provided you have specified the relationships between the tables and queries beforehand. Let’s create a report by using the wizard.
1. On the Create tab, in the Reports group, click Report Wizard. 2. The Report Wizard page will open. Include the Subject Name field from the Subject Table and
the Title, Number of Copes, Price, and Publication Year fields from the Book table. (To include multiple tables in your report, do not click Next or Finish until all additional fields that you want to include in the report are added. Repeat the steps to select additional tables or queries to include all the fields you want to appear in the report.) Then, click Next and you will see that your report will be grouped by the Subject field, the first field you placed in your choice. Click Next twice.
3. On the next Sort Order screen, sort by ascending Title and click Next. 4. Select one of the layout styles (Stepped, Block or Outline) on the next screen and click Next. 5. Select the style of your choice and click Next. 6. On the last page, accept the title “Subject” and click Finish. You will view the finished report in
the Report View. 7. Switch to view the report in the Design view. Adjust the widths of the fields in the header
section as needed. Notice, the widths of boxes in both the header and detailed sections will be adjusted as a pair. Let’s place the percentage values of collection on the “Number of Copies” field in the Report Footer section.
8. Click on the “Number of Copies” box. Click on the “Group &
Sort” button under the Design tab. Group, Sort and Total commands will open in the lower pane of the
window. Click on the “More” button . Select the
drop-down arrow next to the “with no totals” command. Select the “Number of Copies” field in the “Total
0.5”

Access 5: Reports Page 7 of 14 10/9/2012:mms
On” drop-down list and check the box to show group totals as % of Grand Total. The % field should immediately be filled in the Report Footer section. Place a label box and type in “Percentage of Total Collection” in the “Subject ID Footer” section.
9. Next, click on the Price field and let’s add another group for
the price. Click on the “More” button . Select the drop-down arrow next to the “with no totals” command. Select the “Price” field in the “total on” drop-down list and check the boxes to show “Grand Total”.
10. Last, change the Grand Total formula to sum up prices for all multiple copies. In the Report Footer section, in the sum box, change the formula to read: =sum([price]*[number of copies]); format this box to show “currency”. Align this box with the “price” boxes in the Detailed and the Page Header Sections. Move the associated label box to the furthest left and type in “Grand Total”. Nudge each section as necessary to show the entire report on one page.
[Alternatively, in the Design View, you can add summary fields by using the Summation command. Click on any field that you want to count or sum. Click on the “Number of Copies” field and the “Price” fields one at a time. Then click on the Summation command and select “Sum”. The sum of the number of copies will be added to the Report Footer section. Do the same for the “price” field. You will have a summary field that would add up “Price” fields. Click in that box and type in the remaining part of the formula to look like: =sum([price]*[number of copies]) to multiply with the “Number of Copies” field. Create appropriate label boxes for the “Subtotal” (in the SubjectID Footer section) and the “Grand Total” (in the Report Footer section) to go with these summary fields. See the sample in the “Subject1” report.] Note that after you place information on footers and headers in Report and Page sections; do not turn off those buttons in the show/hide group under the Arrange tab. Doing so will delete all information from those sections permanently.
Report Design Tools
Design Ribbon: All the tools available in Form Design Ribbon are here.
Access 5: Reports Page 8 of 14 10/9/2012:mms
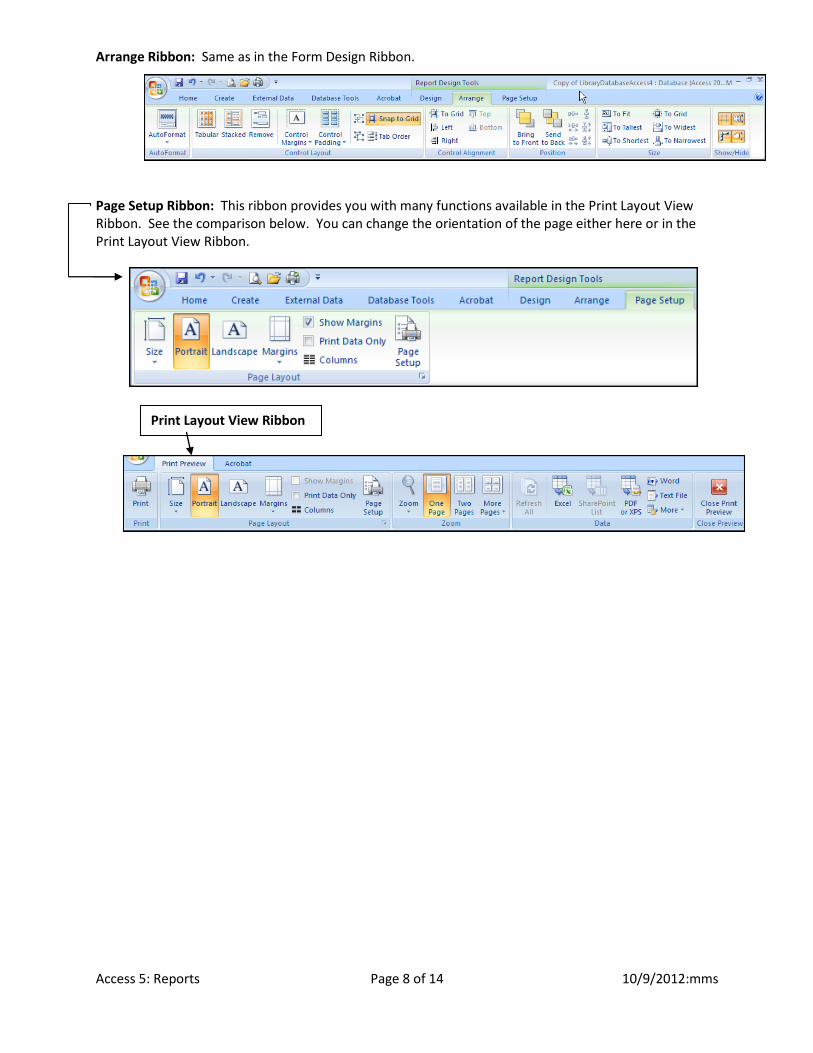
Arrange Ribbon: Same as in the Form Design Ribbon.
Page Setup Ribbon: This ribbon provides you with many functions available in the Print Layout View Ribbon. See the comparison below. You can change the orientation of the page either here or in the Print Layout View Ribbon.
Print Layout View Ribbon
Access 5: Reports Page 9 of 14 10/9/2012:mms
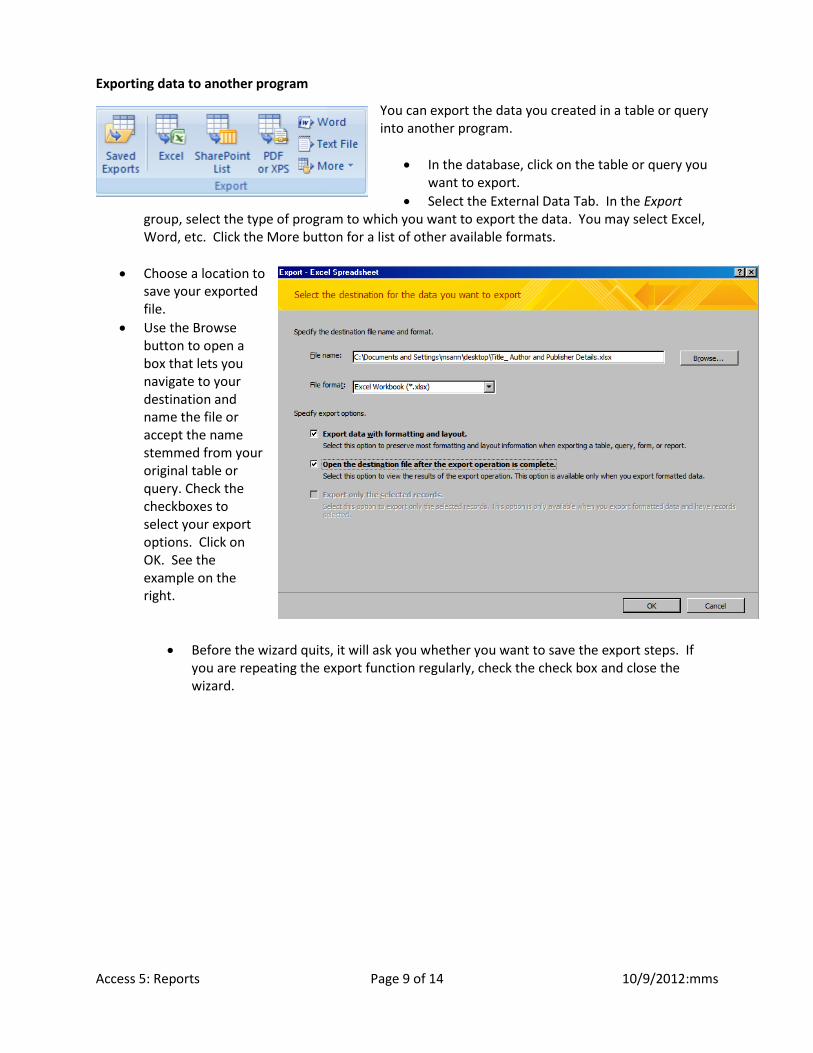
Exporting data to another program
You can export the data you created in a table or query into another program.
In the database, click on the table or query you want to export.
Select the External Data Tab. In the Export group, select the type of program to which you want to export the data. You may select Excel, Word, etc. Click the More button for a list of other available formats.
Choose a location to save your exported file.
Use the Browse button to open a box that lets you navigate to your destination and name the file or accept the name stemmed from your original table or query. Check the checkboxes to select your export options. Click on OK. See the example on the right.
Before the wizard quits, it will ask you whether you want to save the export steps. If you are repeating the export function regularly, check the check box and close the wizard.

Access 5: Reports Page 10 of 14 10/9/2012:mms
Switchboards You have learned 4 objects that comprise your Database. You may want to make your day-to-day library database searching and managing tasks even simpler by making the objects you created easier to access. To do so, you can create and manage database switchboards. A Switchboard is a MS Office Access 2007 form that facilitates navigation and access to different parts of an application. It works as an interface between the user and the application. It can contain command buttons that execute specified actions such as opening a form or a report. It also makes it harder for users to accidentally perform “bad” things such as deleting your data or reorganizing your tables, the essential object of your database. You can modify switchboards by modifying their properties. Among other forms we created in Access Level 4, we are also using 3 new forms we created in the Appendix section of Access Level 4 handout.
1. New Author 2. New Publisher 3. New Subject
Let’s create a primary switchboard using the Switchboard Manager.
1. Click on the Database Tools Ribbon tab, and then click Switchboard Manager in the Database Tools group. If you do not already have a switchboard, Access will ask if you want to create one. Click Yes.
2. The Switchboard Manager window opens with the name Main Switchboard as default. You can change the name by clicking on the Edit button.
3. The Edit Switchboard Page window opens. Change the switchboard name to “Central Library Data Entry And Report Page”. Click on New button to add new items on that switchboard.
4. The Edit Switchboard Item window opens up. In Text box, type “Enter New”. Select “Open Form in Add Mode” in the Command box by clicking on the drop-down arrow in that box. (By selecting the “Add Mode”, you let users add new entries in forms and allow them to edit the new entries only but you will not give them access to previous entries.) Select the name of the form – “New Title” in the Form drop-down box.
5. Click OK. You will get back to the “Edit Switchboard Page” window where you can add more objects by clicking on the “New” button each time to add an object.

Access 5: Reports Page 11 of 14 10/9/2012:mms
6. Follow the steps 4 and 5 and add the following objects. a. Enter New Author:
i. Text – Enter New Author ii. Command – Open Form in Add Mode
iii. Form – New Author b. Enter New Publisher
i. Text – Enter New Publisher ii. Command – Open Form in Add Mode
iii. Form – New Publisher c. Enter New Subject
i. Text – Enter New Subject ii. Command – Open Form in Add Mode
iii. Form – New Subject (You can rearrange the order of the objects on the Switchboard by using the “Move Up” or “Move Down” buttons.)
7. Click the “Close” button on the “Edit Switchboard Page” window. 8. Click the “Close“ button on the “Switchboard Manager” window. You will see a new table that
includes “Switchboard items” and a new form named “Switchboard” in your navigation pane. You can open the “Switchboard” form in the Design View and change color and appearance as desired. Do not delete any control boxes in the Design View; doing so will disconnect the underlying data on the switchboard.
You can always add new objects to your switchboard by clicking on the Switchboard Manager command in the Database Tools group again. The existing switchboard will open; click Edit to open up the “Edit Switchboard Page” window and then click on “New” button to add more objects on the same switchboard. Practice adding 3 more objects (Reports) at home.
a. Open Total Holding Report i. Text – Open Total Holding Report
ii. Command – Open Report iii. Report – Calculate on Title, Author and Publisher Details
b. Open Subject Spending Report i. Text – Open Subject Spending Report
ii. Command – Open Report iii. Report – Subject
c. Open Author Report i. Text – Open Author Report
ii. Command – Open Report iii. Report – Author w/ Specialty
The entire switchboard appearance can also be built by using the combination of the Form Design and the Button Control to open a form or report or even a query without using the Switchboard Manager. After all, the switchboard built by the Switchboard Manager is simply a form with various controls to pull different data from your objects (Tables, Queries, Forms
[Delete a switchboard: In the Database window, delete both objects: the Switchboard Items Table and the Switchboard Form.]

Access 5: Reports Page 12 of 14 10/9/2012:mms
Let’s apply a few more options to safeguard the database from unintentional changes by users. You can apply many useful options under the Access Options button.
1. Click the Microsoft Office Button on the top left. 2. Click on the Access Options Button. 3. Select the Current Database on the left pane.
a. Application Title: Displays the title in the title bar of the database window. Type in “Central Library Database”.
b. Application Icon: Lets you select an icon button from the .icn files from your computer for your Database.
c. Display Form: Click the drop-down arrow and select the “Switchboard”. Doing so will automatically display the switchboard when the user opens the database.
d. Document Window Options: Access 2007 uses tabbed documents to easily move between several database objects open at the same time. (If you open 2003 Access with .mdb extension in the Access 2007, the radio button would be at the “overlapping windows”. You can select to switch to the “Tabbed Documents”.)
e. Compact on Close: Checking that box will automatically compact the database each time it is closed.
f. Picture Property Storage Format: Selecting the first option “Preserve source image format” will make the file size smaller and will enable the full use of the new AutoFormats.
g. Display Navigation Pane: Un-checking the display navigation pane box will hide the navigation pane on the left. Users can still display the pane later by hitting F11 on the keyboard and hide again by hitting F11 again.
i. Navigation Options Button: Clicking on this will open a window where you can customize your view in the navigation pane. For example, if you want to hide Tables for the users, select Object Type under Categories and clear the check box next to Tables under Groups. Also clear the check box next to Show Hidden Objects under the Display Options. From now on, if a user selects the Object Type group, tables are not visible (even with F11).
Access 5: Reports Page 13 of 14 10/9/2012:mms
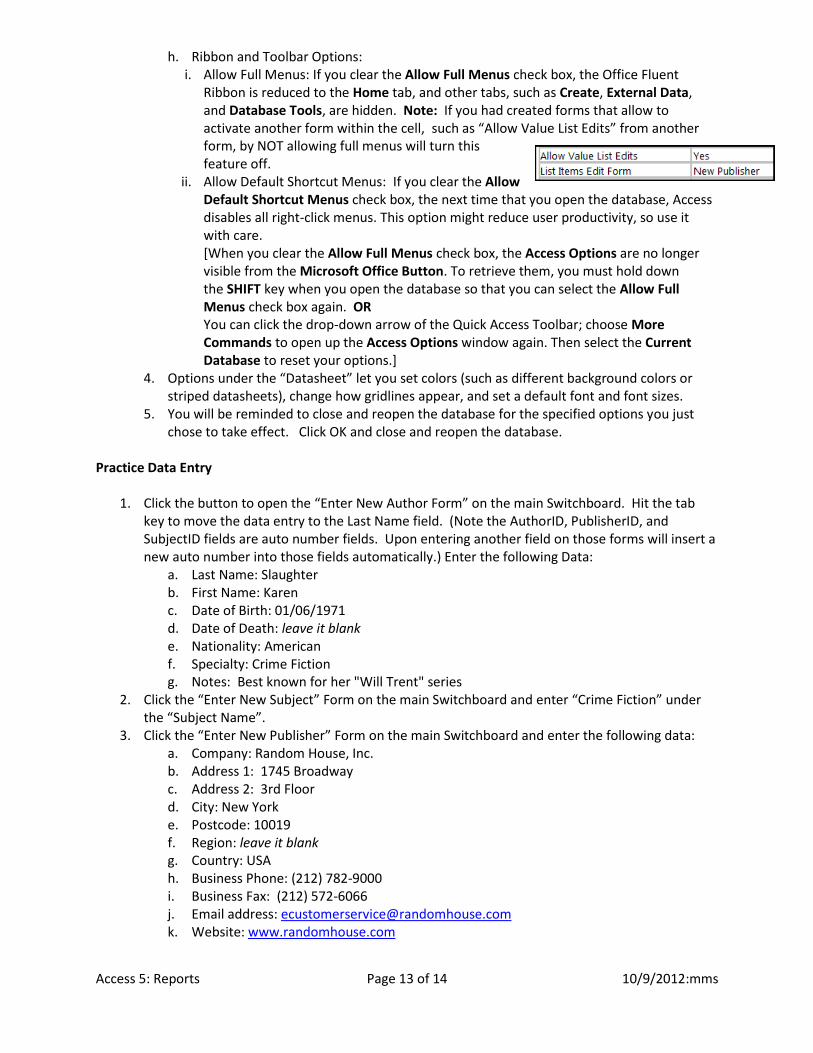
h. Ribbon and Toolbar Options: i. Allow Full Menus: If you clear the Allow Full Menus check box, the Office Fluent
Ribbon is reduced to the Home tab, and other tabs, such as Create, External Data, and Database Tools, are hidden. Note: If you had created forms that allow to activate another form within the cell, such as “Allow Value List Edits” from another form, by NOT allowing full menus will turn this feature off.
ii. Allow Default Shortcut Menus: If you clear the Allow Default Shortcut Menus check box, the next time that you open the database, Access disables all right-click menus. This option might reduce user productivity, so use it with care. [When you clear the Allow Full Menus check box, the Access Options are no longer visible from the Microsoft Office Button. To retrieve them, you must hold down the SHIFT key when you open the database so that you can select the Allow Full Menus check box again. OR You can click the drop-down arrow of the Quick Access Toolbar; choose More Commands to open up the Access Options window again. Then select the Current Database to reset your options.]
4. Options under the “Datasheet” let you set colors (such as different background colors or striped datasheets), change how gridlines appear, and set a default font and font sizes.
5. You will be reminded to close and reopen the database for the specified options you just chose to take effect. Click OK and close and reopen the database.
Practice Data Entry
1. Click the button to open the “Enter New Author Form” on the main Switchboard. Hit the tab key to move the data entry to the Last Name field. (Note the AuthorID, PublisherID, and SubjectID fields are auto number fields. Upon entering another field on those forms will insert a new auto number into those fields automatically.) Enter the following Data:
a. Last Name: Slaughter b. First Name: Karen c. Date of Birth: 01/06/1971 d. Date of Death: leave it blank e. Nationality: American f. Specialty: Crime Fiction g. Notes: Best known for her "Will Trent" series
2. Click the “Enter New Subject” Form on the main Switchboard and enter “Crime Fiction” under the “Subject Name”.
3. Click the “Enter New Publisher” Form on the main Switchboard and enter the following data: a. Company: Random House, Inc. b. Address 1: 1745 Broadway c. Address 2: 3rd Floor d. City: New York e. Postcode: 10019 f. Region: leave it blank g. Country: USA h. Business Phone: (212) 782-9000 i. Business Fax: (212) 572-6066 j. Email address: [email protected] k. Website: www.randomhouse.com
Access 5: Reports Page 14 of 14 10/9/2012:mms
Upon closing those 3 forms above, all information added on those forms will be saved automatically and now if you open the first button on the Switchboard to enter new title with existing author, subject and publisher names, the added author, subject, and the publisher names should appear on the drop-down lists on those fields.
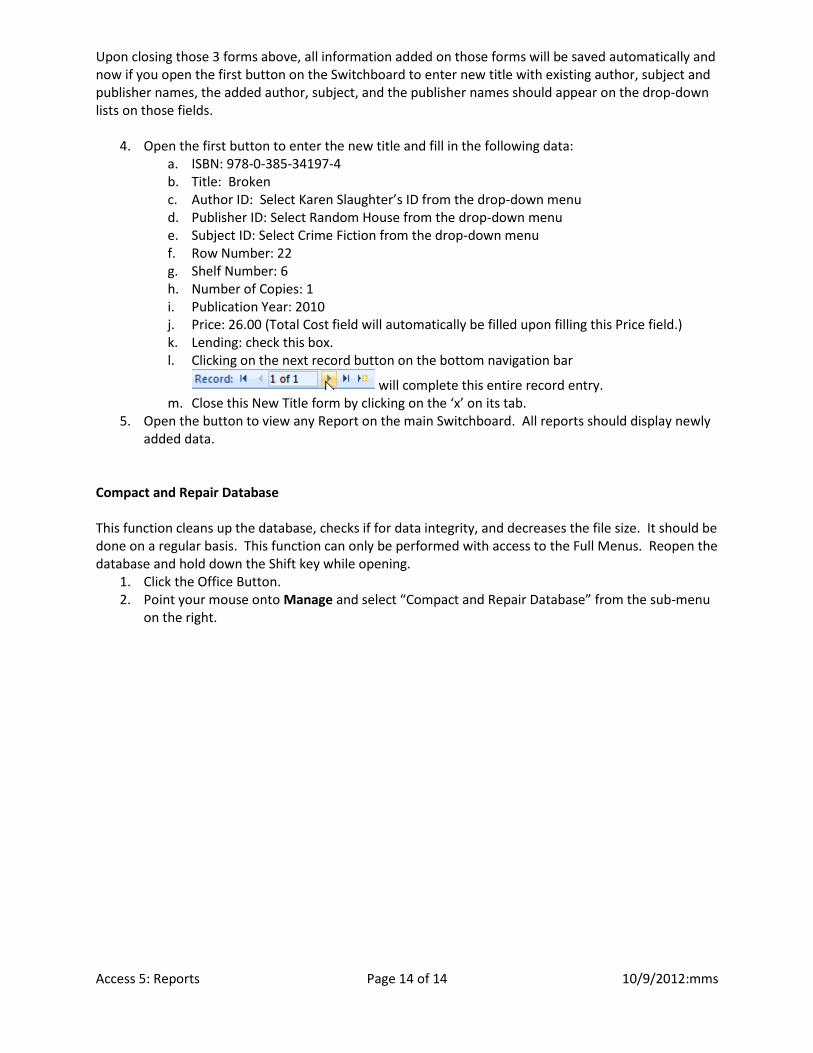
4. Open the first button to enter the new title and fill in the following data: a. ISBN: 978-0-385-34197-4 b. Title: Broken c. Author ID: Select Karen Slaughter’s ID from the drop-down menu d. Publisher ID: Select Random House from the drop-down menu e. Subject ID: Select Crime Fiction from the drop-down menu f. Row Number: 22 g. Shelf Number: 6 h. Number of Copies: 1 i. Publication Year: 2010 j. Price: 26.00 (Total Cost field will automatically be filled upon filling this Price field.) k. Lending: check this box. l. Clicking on the next record button on the bottom navigation bar
will complete this entire record entry. m. Close this New Title form by clicking on the ‘x’ on its tab.
5. Open the button to view any Report on the main Switchboard. All reports should display newly added data.
Compact and Repair Database This function cleans up the database, checks if for data integrity, and decreases the file size. It should be done on a regular basis. This function can only be performed with access to the Full Menus. Reopen the database and hold down the Shift key while opening.
1. Click the Office Button. 2. Point your mouse onto Manage and select “Compact and Repair Database” from the sub-menu
on the right.