microinks accounts project
TRANSCRIPT

8/7/2019 MicroInks Accounts Project
http://slidepdf.com/reader/full/microinks-accounts-project 1/42
MICRO INKS LIMITED
1 | P a g e
Financial Analysis of Construction Industry:
Company Name: MICRO INKS LTD
MICROINKS LTD
Guided By, Submitted
Mr. Dharmesh Shah
Roll No: P1025
Submitted To
NR Institute of PGDBM first year
(Academic Year 2010-11)

8/7/2019 MicroInks Accounts Project
http://slidepdf.com/reader/full/microinks-accounts-project 2/42
MICRO INKS LIMITED
2 | P a g e
PREFACE
Ink is essence of life. Life without ink is hard to conceive. Centuries ago, it was used to
express thoughts and communicate. And even today, its impact on our life is remarkable, crucial
and indelible.
Micro Inks Corporation is the first step towards establishing a powerful global presence
by Hindustan Inks & Resins Ltd. Micro Inks creates a variety of inks viz. web heat-set inks, new
colors and black inks, sheet fed inks, publication gravure inks and many more. Micro Inks is all
set to be amongst the top five in the US ink industry.
This project report has helped me get an exposure to the practical aspects of organizations
functions. My experience at Micro Inks has been useful to understand the application of my
academic knowledge in an organization and has added to the pool of my professional knowledge.
With the help of financial statements an exposure to the business world is gained. From
the company µMICRO INKS¶ I learnt many accounting concepts and principles, which will be
useful for a long period of time. This project report presents a study of a general working of an
organization and its financial statements. In spite of our best efforts, there may be omission and
errors for which we take full responsibility.
The report consists of all the information regarding the company, starting from its present
standing in the Market and as well as in construction industry. With this objective in mind I
humbly hope that this shall further extend the knowledge we possess about the construction
industry.

8/7/2019 MicroInks Accounts Project
http://slidepdf.com/reader/full/microinks-accounts-project 3/42
MICRO INKS LIMITED
3 | P a g e
ACKNOWLEDGEMENT
I would like to express my most sincere thanks to respected MR. DHARMESH SHAH
PROF. of NRIBM for giving me an unmatchable opportunity to learn and progress. This will
surely enable me to move forward in the field of management. It was a great practical experience
where I could learn how the books were implied into industries.
I even express deep sense of gratitude towards my guide Prof. DHARMESH SHAH
who showed me the right path when I faltered or had any doubts.
My deepest thanks to all the people who directly or indirectly supported me in making
this financial project report with object oriented and useful for others.
Ashish Navagamiya
NRIBM
8/7/2019 MicroInks Accounts Project
http://slidepdf.com/reader/full/microinks-accounts-project 4/42
MICRO INKS LIMITED
4 | P a g e
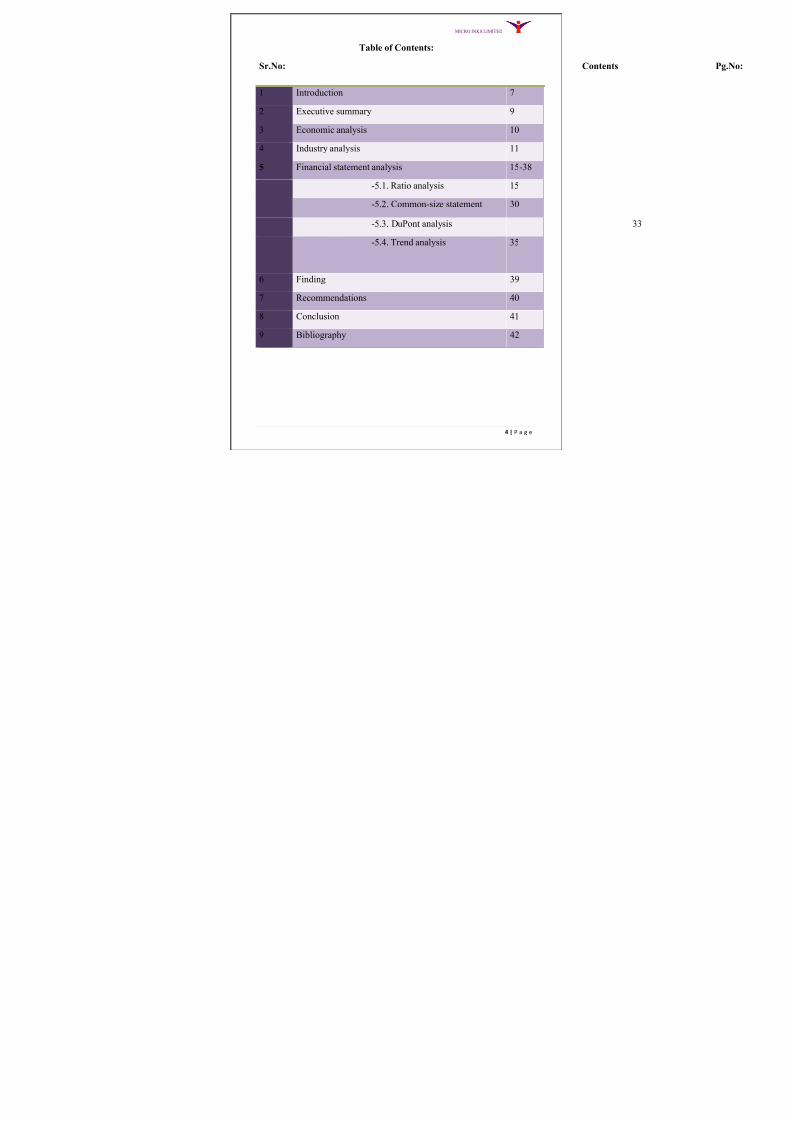
Table of Contents:
Sr.No:
1 Introduction 7
2 Executive summary 9
3 Economic analysis 10
4 Industry analysis 11
5 Financial statement analysis 15-38
-5.1. Ratio analysis 15
-5.2. Common-size statement 30
-5.3. DuPont analysis
-5.4. Trend analysis
35
6 Finding 39
7 Recommendations 40
8 Conclusion 41
9 Bibliography 42

8/7/2019 MicroInks Accounts Project
http://slidepdf.com/reader/full/microinks-accounts-project 5/42
MICRO INKS LIMITED
5 | P a g e
Table of List
Sr.No: Particulars Table
No:
Pg.No:
1 Current Ratio 5.1 15
2 Inventory turnover Ratio 5.2 16
3 Debtors turnover Ratio 5.3 17
4 Fixed assets turnover Ratio 5.4 18
5 Gross profit Ratio 5.5 19
6 Net profit Ratio 5.6 20
7 Book value per share Ratio 5.7 21
8 Earning per share Ratio 5.8 22
9 Dividend per share Ratio 5.9 23
10 Debt-equity Ratio 5.10 24
11 Asset turnover Ratio 5.11 25
12 Proprietary Ratio 5.12 26
13 Cash reserve Ratio 5.13 27
14 Quick Ratio 5.14 28
15 Return on capital equity 5.15 29
8/7/2019 MicroInks Accounts Project
http://slidepdf.com/reader/full/microinks-accounts-project 6/42
MICRO INKS LIMITED
6 | P a g e
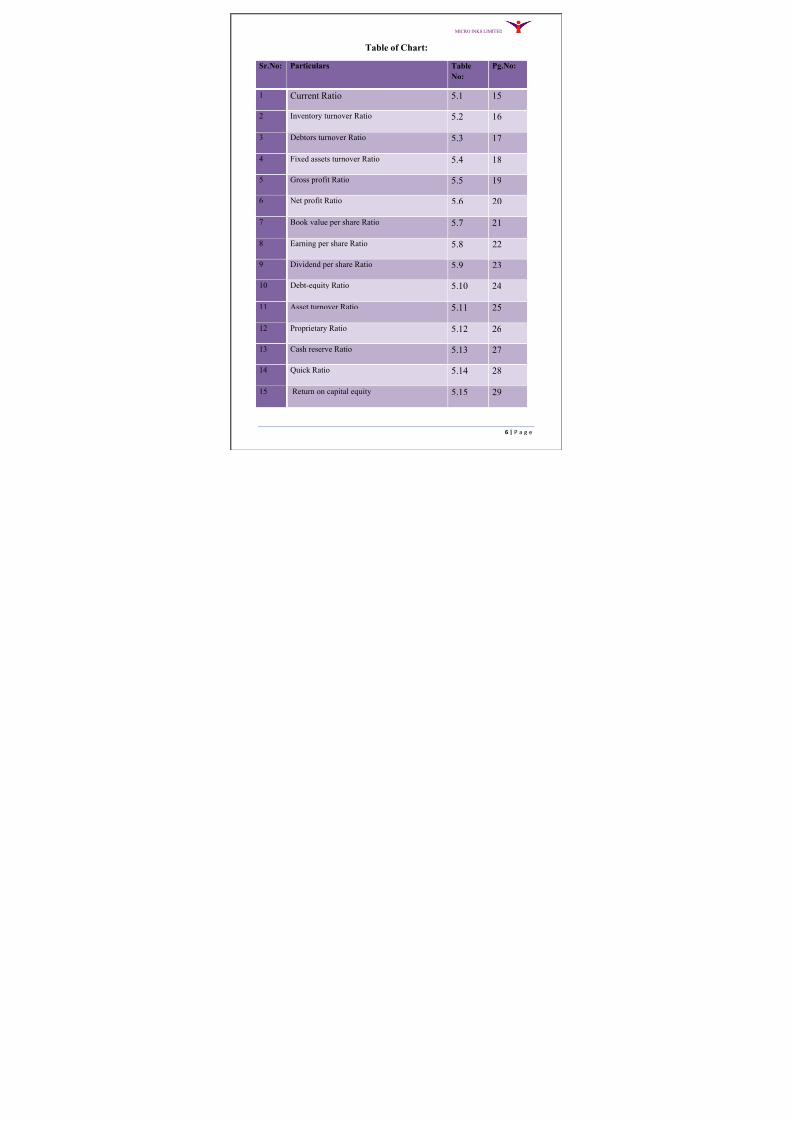
Table of Chart:
Sr.No: Particulars Table
No:
Pg.No:
1 Current Ratio 5.1 15
2 Inventory turnover Ratio 5.2 16
3 Debtors turnover Ratio 5.3 17
4 Fixed assets turnover Ratio 5.4 18
5 Gross profit Ratio 5.5 19
6 Net profit Ratio 5.6 20
7 Book value per share Ratio 5.7 21
8 Earning per share Ratio 5.8 22
9 Dividend per share Ratio 5.9 23
10 Debt-equity Ratio 5.10 24
11 Asset turnover Ratio 5.11 25
12 Proprietary Ratio 5.12 26
13 Cash reserve Ratio 5.13 27
14 Quick Ratio 5.14 28
15 Return on capital equity 5.15 29

8/7/2019 MicroInks Accounts Project
http://slidepdf.com/reader/full/microinks-accounts-project 7/42
MICRO INKS LIMITED
7 | P a g e
COMPANY INFORMATION
Micro Inks Ltd (MICRO) is a part of US $ 239 million Bilakhia
group, which has diverse interests in printing inks, resins,
flushed pigments and crop protection chemicals. Today, through
the years of growth, MICRO has transformed itself into a multi-
dimensional, multi-national company offering a comprehensive
range of quality products, efficient customer service and a wide
distribution network.
MICRO is the undisputed market leader in the country commanding a market share of 30%+ in
the US $ 200 million domestic inks industry. In the process, it also created an enviable track
record of one of the fastest growing company and took its annual sales figures galloping from a
mere US $ 5 million in 1993 - 94 to an astonishing increase to US $ 146 million. The meteoric
ascent of MICRO to the position of a market leader was primarily the result of the efforts of the
people at the helm of affairs - The Bilakhia Group.
Through the years of growth, MICRO has transformed itself into a multi-dimensional, multi-
location company offering a comprehensive range of quality products, efficient customer service
and a wide distribution network. In India, It is a marketing powerhouse with 12 branches, 5
technical centers and around 500 distributors. Today, MICRO has spread its wings globally with
a distribution network in more than 50+ countries.
MICRO is also the only Printing Inks Company in India, and amongst two or three companies in
the world, to have successfully implemented SAP / R3 solution, integrating its marketing offices
through satellite links. Together all the elements will work as a single force to offer value to its
customers.
Today the company with a modest beginning has grown and consolidated its strengths, skills andpeople to achieve a unique enterprise. One which is on its way to becoming a major player in the
global market. A reality, which it achieved through a well thought out and executed business
strategy.

8/7/2019 MicroInks Accounts Project
http://slidepdf.com/reader/full/microinks-accounts-project 8/42
MICRO INKS LIMITED
8 | P a g e
Setting up operations in the world's most highly competitive ink market, USA with a company
called Micro Inks Corporation is the first step towards MICRO'S vision of leaving behind an
impression of being the most dynamic inks company in the world.
Here the Company's core strategy is to offer better value to its customers on the price quality
matrix and participating in their programs to deliver better value to the customers' customer. At
MICRO they starve for having customers' delight and not only customers' satisfaction.
To make this strategy a success, the Company has stepped up its R&D efforts in order to develop
superior products. On a parallel front, Micro Inks has developed technology for backward
integration into flushed colours, pigments, resins and additives - the key raw materials for inks.
By doing so, MICRO is today the only company in the world to be self sufficient in all the
critical raw materials of Printing Inks.
The next thing on its agenda was to accelerate its inks manufacturing capacities to keep pace
with the global demand. This was done with by MICRO with the setting up of one of the world's
largest ink manufacturing facilities at a single location, in India.
This plant at Silvassa has a world-size capacity of 60,000 metric tonnes. Here MICRO
manufactures a wide range of inks with innovative and unique process technologies that have
never been attempted before in the industry. Apart from this, another world size plant has been
set up at Vapi, which produces a wide range of flushed colours, pigments and resins in a single-
stream plant for 'seamless' manufacturing of inks.
Finally, all this is to be backed by the best of technical support and customer service. All
translating ultimately into one fact, MICRO is poised to make an indelible mark on the world.
8/7/2019 MicroInks Accounts Project
http://slidepdf.com/reader/full/microinks-accounts-project 9/42
MICRO INKS LIMITED
9 | P a g e
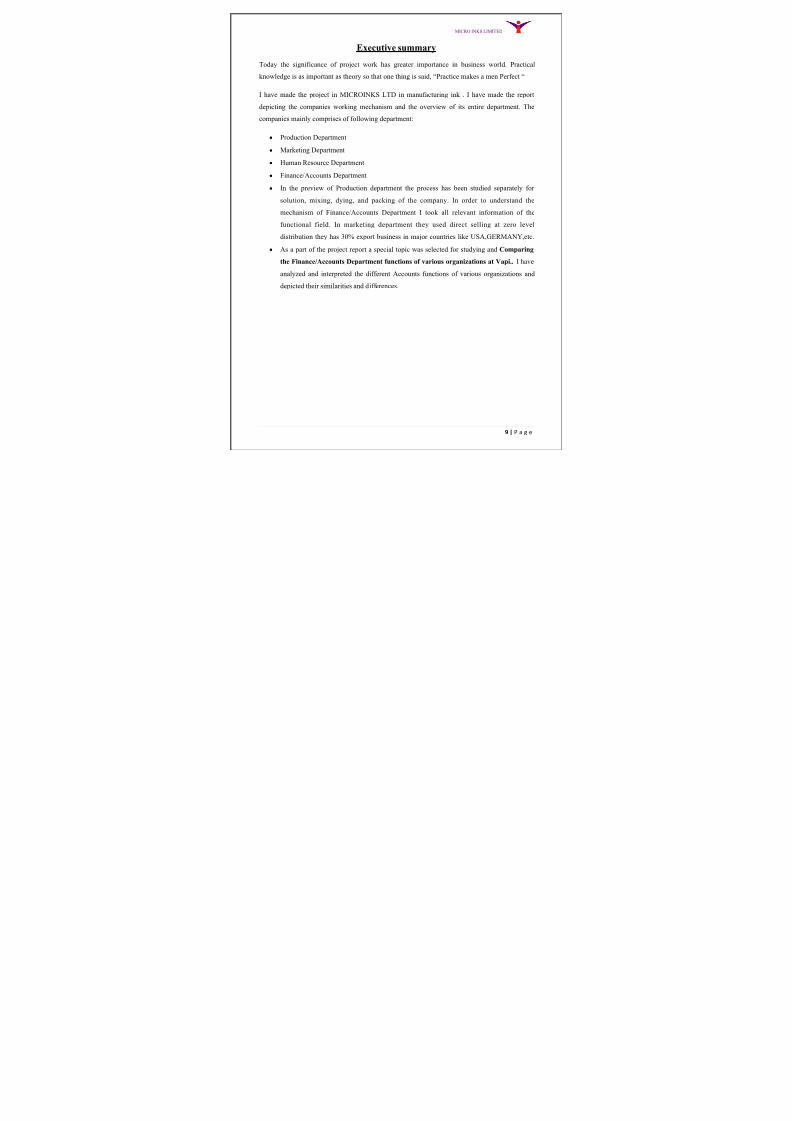
Executive summary
Today the significance of project work has greater importance in business world. Practical
knowledge is as important as theory so that one thing is said, ³Practice makes a men Perfect ³
I have made the project in MICROINKS LTD in manufacturing ink . I have made the report
depicting the companies working mechanism and the overview of its entire department. The
companies mainly comprises of following department:
y Production Department
y Marketing Department
y Human Resource Department
y Finance/Accounts Department
y In the preview of Production department the process has been studied separately for
solution, mixing, dying, and packing of the company. In order to understand the
mechanism of Finance/Accounts Department I took all relevant information of the
functional field. In marketing department they used direct selling at zero level
distribution they has 30% export business in major countries like USA,GERMANY,etc.
y As a part of the project report a special topic was selected for studying and Comparing
the Finance/Accounts Department functions of various organizations at Vapi.. I have
analyzed and interpreted the different Accounts functions of various organizations and
depicted their similarities and differences.
8/7/2019 MicroInks Accounts Project
http://slidepdf.com/reader/full/microinks-accounts-project 10/42
MICRO INKS LIMITED
10 | P a g e
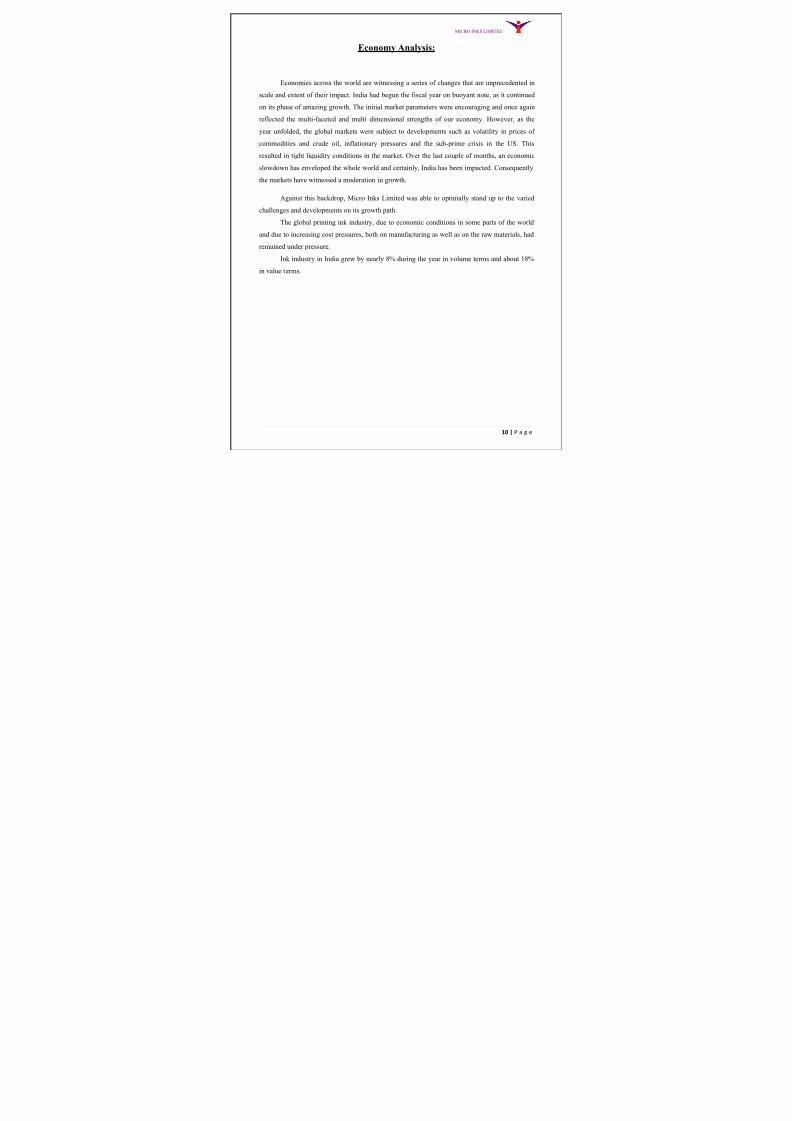
Economy Analysis:
Economies across the world are witnessing a series of changes that are unprecedented in
scale and extent of their impact. India had begun the fiscal year on buoyant note, as it continued
on its phase of amazing growth. The initial market parameters were encouraging and once again
reflected the multi-faceted and multi dimensional strengths of our economy. However, as the
year unfolded, the global markets were subject to developments such as volatility in prices of
commodities and crude oil, inflationary pressures and the sub-prime crisis in the US. This
resulted in tight liquidity conditions in the market. Over the last couple of months, an economic
slowdown has enveloped the whole world and certainly, India has been impacted. Consequently,
the markets have witnessed a moderation in growth.
Against this backdrop, Micro Inks Limited was able to optimally stand up to the varied
challenges and developments on its growth path.
The global printing ink industry, due to economic conditions in some parts of the world
and due to increasing cost pressures, both on manufacturing as well as on the raw materials, had
remained under pressure.
Ink industry in India grew by nearly 8% during the year in volume terms and about 18%
in value terms.
8/7/2019 MicroInks Accounts Project
http://slidepdf.com/reader/full/microinks-accounts-project 11/42
MICRO INKS LIMITED
11 | P a g e
Industry Analysis:
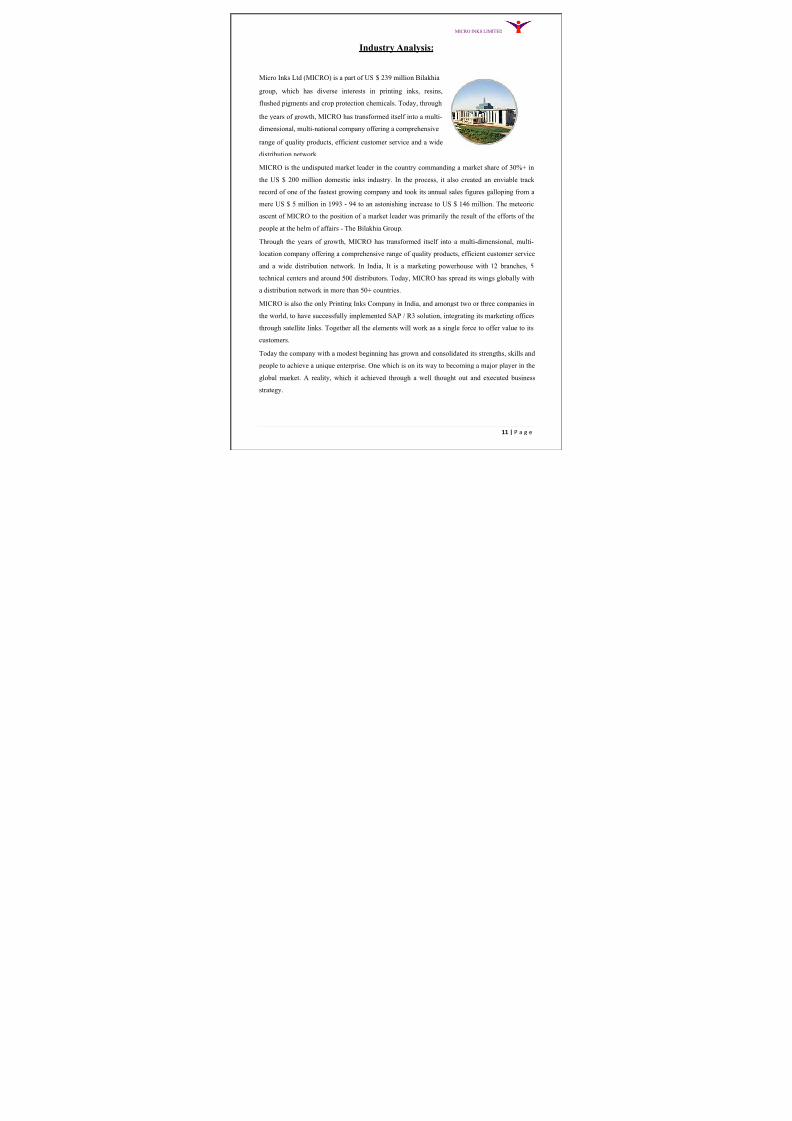
Micro Inks Ltd (MICRO) is a part of US $ 239 million Bilakhia
group, which has diverse interests in printing inks, resins,
flushed pigments and crop protection chemicals. Today, through
the years of growth, MICRO has transformed itself into a multi-
dimensional, multi-national company offering a comprehensive
range of quality products, efficient customer service and a wide
distribution network.
MICRO is the undisputed market leader in the country commanding a market share of 30%+ in
the US $ 200 million domestic inks industry. In the process, it also created an enviable track
record of one of the fastest growing company and took its annual sales figures galloping from a
mere US $ 5 million in 1993 - 94 to an astonishing increase to US $ 146 million. The meteoric
ascent of MICRO to the position of a market leader was primarily the result of the efforts of the
people at the helm of affairs - The Bilakhia Group.
Through the years of growth, MICRO has transformed itself into a multi-dimensional, multi-
location company offering a comprehensive range of quality products, efficient customer service
and a wide distribution network. In India, It is a marketing powerhouse with12 branches,
5
technical centers and around 500 distributors. Today, MICRO has spread its wings globally with
a distribution network in more than 50+ countries.
MICRO is also the only Printing Inks Company in India, and amongst two or three companies in
the world, to have successfully implemented SAP / R3 solution, integrating its marketing offices
through satellite links. Together all the elements will work as a single force to offer value to its
customers.
Today the company with a modest beginning has grown and consolidated its strengths, skills and
people to achieve a unique enterprise. One which is on its way to becoming a major player in the
global market. A reality, which it achieved through a well thought out and executed business
strategy.
8/7/2019 MicroInks Accounts Project
http://slidepdf.com/reader/full/microinks-accounts-project 12/42
MICRO INKS LIMITED
12 | P a g e
Setting up operations in the world's most highly competitive ink market, USA with a company
called Micro Inks Corporation is the first step towards MICRO'S vision of leaving behind an
impression of being the most dynamic inks company in the world.
Here the Company's core strategy is to offer better value to its customers on the price quality
matrix and participating in their programs to deliver better value to the customers' customer. At
MICRO they starve for having customers' delight and not only customers' satisfaction.
To make this strategy a success, the Company has stepped up its R&D efforts in order to develop
superior products. On a parallel front, Micro Inks has developed technology for backward
integration into flushed colours, pigments, resins and additives - the key raw materials for inks.
By doing so, MICRO is today the only company in the world to be self sufficient in all the
critical raw materials of Printing Inks.
The next thing on its agenda was to accelerate its inks manufacturing capacities to keep pace
with the global demand. This was done with by MICRO with the setting up of one of the world's
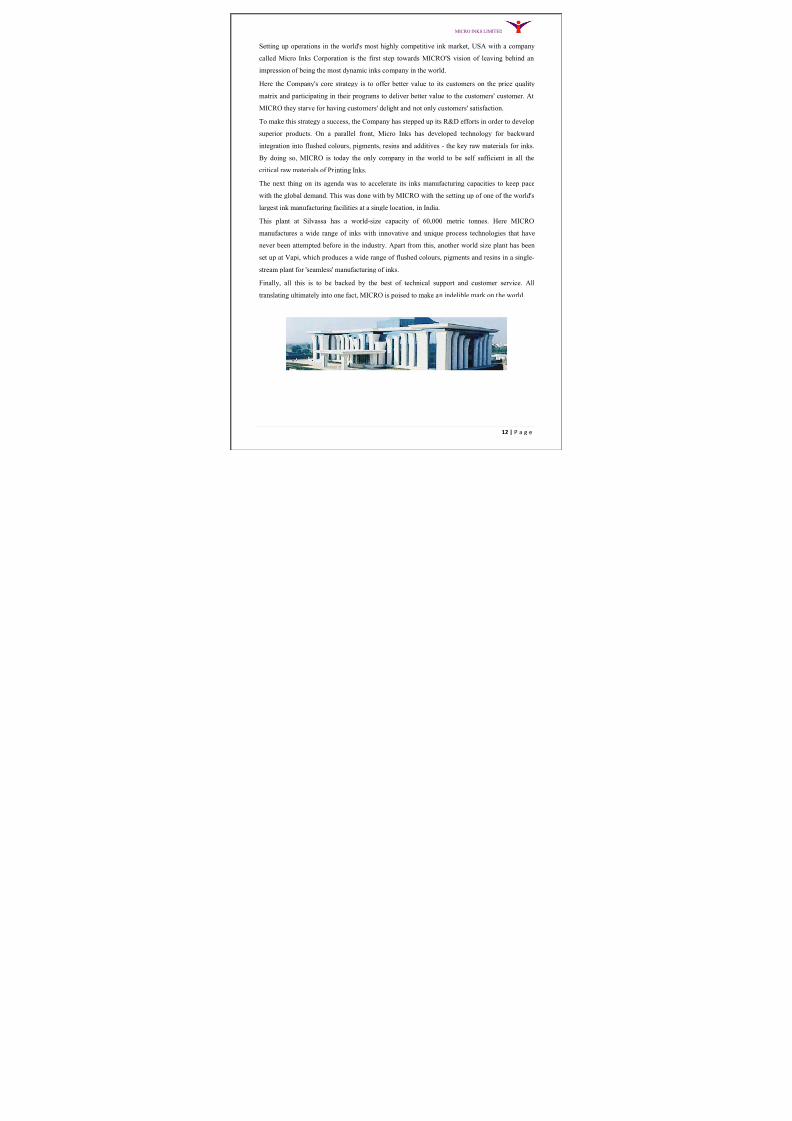
largest ink manufacturing facilities at a single location, in India.
This plant at Silvassa has a world-size capacity of 60,000 metric tonnes. Here MICRO
manufactures a wide range of inks with innovative and unique process technologies that have
never been attempted before in the industry. Apart from this, another world size plant has been
set up at Vapi, which produces a wide range of flushed colours, pigments and resins in a single-
stream plant for 'seamless' manufacturing of inks.
Finally, all this is to be backed by the best of technical support and customer service. All
translating ultimately into one fact, MICRO is poised to make an indelible mark on the world.

8/7/2019 MicroInks Accounts Project
http://slidepdf.com/reader/full/microinks-accounts-project 13/42
MICRO INKS LIMITED
13 | P a g e
SWOT Analysis
SWOT analysis is one of the important tasks of every company. L & T follows the rule of
emphasizing on others strengths, eliminating their weakness, seize the best opportunities and
counter the threats.
Strengths:
Right products, quality and reliability.
Superior product performance vs. competitors.
Brand image
High degree of customer satisfaction.
Dedicated workforce aiming at making a long-term career in the field.
Lower response time with effective service.
Products have required accreditations.
Opportunities:
Profit margins will be good. End-users respond to new ideas.
Could extend to overseas broadly.
New specialist application.
Could seek better supplier deals.
Fast-track career development opportunities on an industry-wide basis.
An applied research to create to new create opportunities for developing techniques.
Weakness:
Some gaps in range for certain sectors.
Not very popular in the international market.
Delivery staff needs training.

8/7/2019 MicroInks Accounts Project
http://slidepdf.com/reader/full/microinks-accounts-project 14/42
MICRO INKS LIMITED
14 | P a g e
Processes, systems, etc«
Management cover insufficient.
Sectored growth is constrained by low unemployment levels and competition for staff.
Threats:
Legislation could impact.
Existing core business distribution risk.
Vulnerable to reactive attack by major competitors.
Lack of infrastructure in rural areas could constrain investments.
High volume/low cost market is intensely competitive.
8/7/2019 MicroInks Accounts Project
http://slidepdf.com/reader/full/microinks-accounts-project 15/42

8/7/2019 MicroInks Accounts Project
http://slidepdf.com/reader/full/microinks-accounts-project 16/42
MICRO INKS LIMITED
16 | P a g e
(2) Inventory turnover Ratio:
Meaning: This ratio establishes a relationship between costs of goods sold and average
inventory (average stock). The objective of computing this ratio is to determine the efficiency
with which the inventory is utilized.
Formula: Inventory turnover Ratio= Cost of goods sold/ Average Inventory.
Table: 5.2
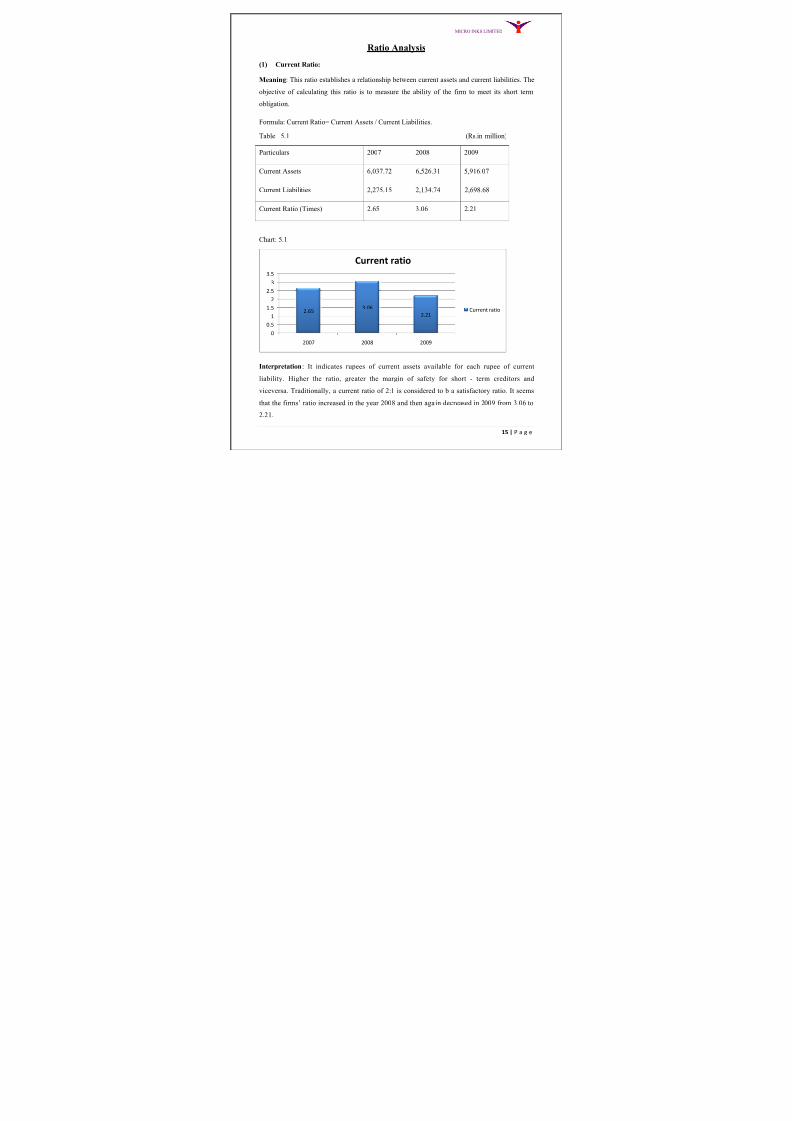
Particulars 2007 2008 2009
COGS 10167.03 11236.09 11659.02
Avg.Inventory 2073.92 2078.635 2045.075
I.T ratio 4.90 5.41 5.70
Chart: 5.2
Interpretation: This ratio is important to know the speed of turnover of inventory in
manufacturing firm. It can be said that the inventory is used efficiently, if the ratio is high more
investment is made in inventory and therefore measures should be taken to decrease inventory.
Here, it has been increased in all the year.
4.9
5.415.7
4.5
5
5.5
6
2007 2008 2009
Inventory turnover ratio
Inventory turnover ratio

8/7/2019 MicroInks Accounts Project
http://slidepdf.com/reader/full/microinks-accounts-project 17/42
MICRO INKS LIMITED
17 | P a g e
(3) Debtors Turnover Ratio:
Meaning: This ratio establishes a relationship between net credit sales and average trade debtors.
The objective of calculating this ratio is to determine an efficiency with which the trades debtors
are manage.
Formula: Debtors Turnover Ratio=Net credit sales/ Average debtors.
Table: 5.3
Particulars 2007 2008 2009
Net credit sales 12292.65 13428.01 13804.84
Average debtors 3247.3 3761.05 3317.63
Debt t/o ratio (Times) 3.79 3.57 4.16
Chart: 5.3
Interpretation: This ratio measures how rapidly receivables are collected. A high ratio is
indicative of shorter time-lag between credit sales and cash collection. A low ratio shows that
debts are not being collected rapidly. In 2008 the ratio was low which shows ineffective
collection policy. But in 2009 the ratio goes high. This shows the company¶s collection policy is
effective.
3.79
3.57
4.16
3.2
3.4
3.6
3.8
4
4.2
4.4
2007 2008 2009
Debtors turn over rario
Debtors turn over rario
8/7/2019 MicroInks Accounts Project
http://slidepdf.com/reader/full/microinks-accounts-project 18/42
MICRO INKS LIMITED
18 | P a g e
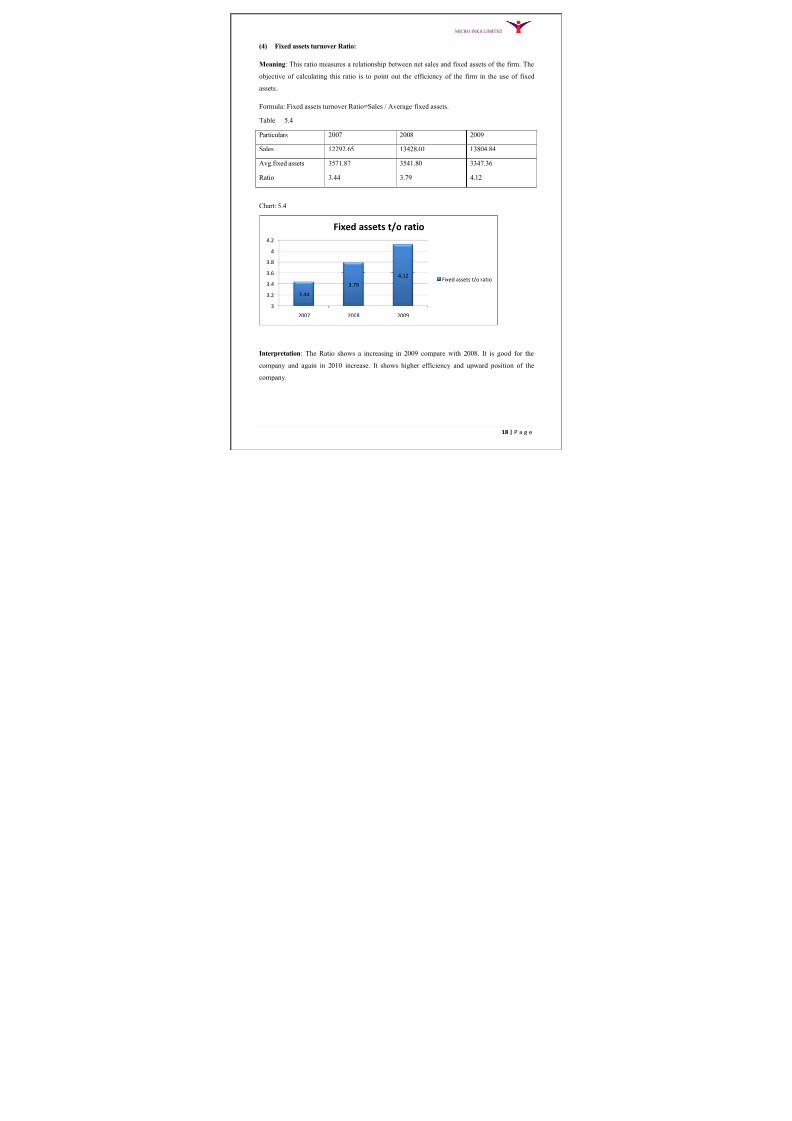
(4) Fixed assets turnover Ratio:
Meaning: This ratio measures a relationship between net sales and fixed assets of the firm. The
objective of calculating this ratio is to point out the efficiency of the firm in the use of fixed
assets.
Formula: Fixed assets turnover Ratio=Sales / Average fixed assets.
Table: 5.4
Particulars 2007 2008 2009
Sales 12292.65 13428.01 13804.84
Avg.fixed assets 3571.87 3541.80 3347.36
Ratio 3.44 3.79 4.12
Chart: 5.4
Interpretation: The Ratio shows a increasing in 2009 compare with 2008. It is good for the
company and again in 2010 increase. It shows higher efficiency and upward position of the
company.
3.44
3.79
4.12
3
3.2
3.4
3.6
3.8
4
4.2
2007 2008 2009
Fixed assets t/o ratio
Fixed assets t/o ratio

8/7/2019 MicroInks Accounts Project
http://slidepdf.com/reader/full/microinks-accounts-project 19/42
MICRO INKS LIMITED
19 | P a g e
(5) Gross profit Ratio:
Meaning: This ratio measures the relationship between gross profit & net sales. The main
objective of computing this ratio is to determine the efficiency with which production and/or
purchase operations are carried on.
Formula: Gross profit Ratio= Gross profit/ Net sales*100.
Table: 5.5 (Rs.in million)
Particulars 2007 2008 2009
Gross profit 2125.62 2191.92 2145.82
Net sales 12292.65 13428.01 13804.84
GP Ratio (%) 17.29 16.32 15.54
Chart: 5.5
Interpretation: This ratio measures the percentage of each sales rupee remaining after the firms
has paid for its goods. A high ratio of gross profit to sales is a sign of good management as it
implies that the cost of production of the firm is relatively low. It may also be indicative of
higher sales price without a corresponding increase in the cost of goods sold. Here, it has been
increasing during three years.
17.29
16.32
15.54
14.5
15
15.5
16
16.5
17
17.5
2007 2008 2009
G.P RATIO
G.P RATIO

8/7/2019 MicroInks Accounts Project
http://slidepdf.com/reader/full/microinks-accounts-project 20/42
MICRO INKS LIMITED
20 | P a g e
(6) Net profit Ratio:
Meaning: This ratio measures the relationship between net profit and net sales. The main
objective of computing this ratio is to determine the overfull profitability due to various factors
such as operational efficiency trading on equity.
Formula: Net profit Ratio= Profit after tax (PAT)/Net sales*100.
Table: 5.6
Particulars 2007 2008 2009
PAT 681.17 902.95 1125.49
Net sales 12292.65 13428.01 13804.84
NP Ratio (%) 5.54 6.72 8.15
Chart: 5.6
Interpretation: This ratio indicates an average net margin earned on sales. A high net profit
margin would ensure adequate return to the owners as well as enable a firm to withstand adverse
economic conditions when selling price is declining, Here, it has been increased during three
years with the margin gap of 1.56 to 1.57.
5.546.73
8.15
0
1
2
3
4
5
6
7
8
9
2007 2008 2009
net profit ratio
net profit ratio
8/7/2019 MicroInks Accounts Project
http://slidepdf.com/reader/full/microinks-accounts-project 21/42
MICRO INKS LIMITED
21 | P a g e
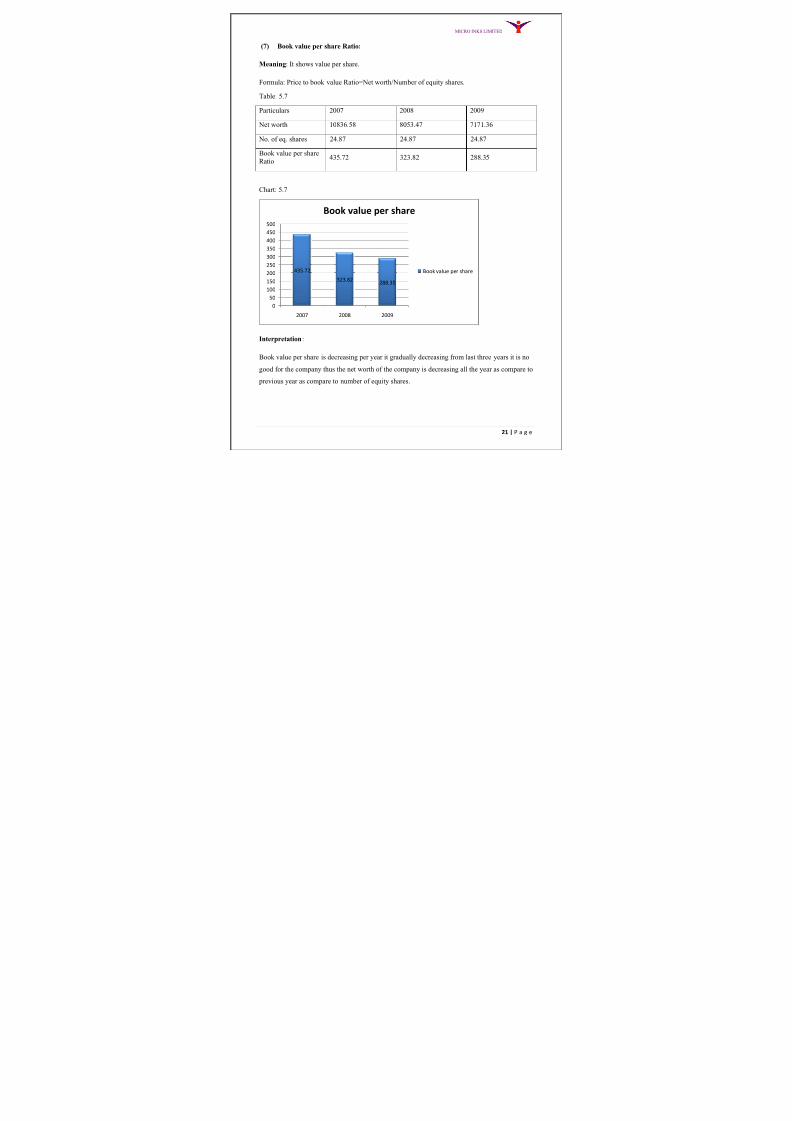
(7) Book value per share Ratio:
Meaning: It shows value per share.
Formula: Price to book value Ratio=Net worth/Number of equity shares.
Table: 5.7
Particulars 2007 2008 2009
Net worth 10836.58 8053.47 7171.36
No. of eq. shares 24.87 24.87 24.87
Book value per shareRatio
435.72 323.82 288.35
Chart: 5.7
Interpretation:
Book value per share is decreasing per year it gradually decreasing from last three years it is nogood for the company thus the net worth of the company is decreasing all the year as compare to
previous year as compare to number of equity shares.
435.72
323.82288.35
0
50
100
150
200
250
300
350
400
450
500
2007 2008 2009
Book value per share
Book value per share

8/7/2019 MicroInks Accounts Project
http://slidepdf.com/reader/full/microinks-accounts-project 22/42
MICRO INKS LIMITED
22 | P a g e
(8) Earnings per share Ratio:
Meaning: It shows return or income per share, whether or not disturbed as dividends
Formula: Earnings per share Ratio=Net profit to equity share holders/No.of shares.
Table: 5.8
Particulars 2007 2008 2009
Net profit to equity 1510.6 1988.86 2689.76
No.of eq.shares 24.87 24.87 24.87
Earnings per shareratio (%)
60.74 79.95 108.15
Chart: 5.8
Interpretation:
y It has drastically increased in comparison of last year.
y Equity shareholders are satisfied at this stage as they are getting more return in
comparison of last year.
y Share holder get more satisfied as net profit equity increase all the year compare to
previous year.
60.74
79.95
108.15
0
20
40
60
80
100
120
2007 2008 2009
Earning per share
Earning per share
8/7/2019 MicroInks Accounts Project
http://slidepdf.com/reader/full/microinks-accounts-project 23/42
MICRO INKS LIMITED
23 | P a g e
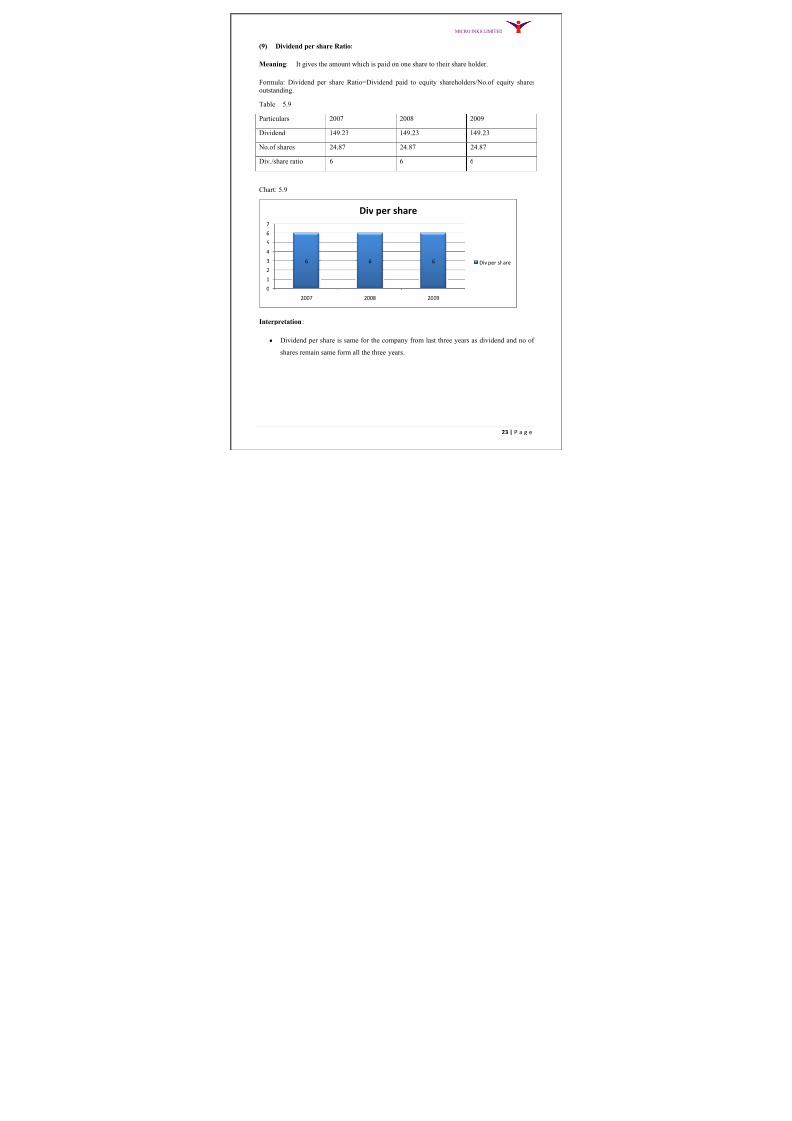
(9) Dividend per share Ratio:
Meaning: It gives the amount which is paid on one share to their share holder.
Formula: Dividend per share Ratio=Dividend paid to equity shareholders/No.of equity shares
outstanding.
Table: 5.9
Particulars 2007 2008 2009
Dividend 149.23 149.23 149.23
No.of shares 24.87 24.87 24.87
Div./share ratio 6 6 6
Chart: 5.9
Interpretation:
y Dividend per share is same for the company from last three years as dividend and no of
shares remain same form all the three years.
6 6 6
0
1
2
3
4
5
6
7
2007 2008 2009
Div per share
Div per share

8/7/2019 MicroInks Accounts Project
http://slidepdf.com/reader/full/microinks-accounts-project 24/42
MICRO INKS LIMITED
24 | P a g e
(10) Debt-equity Ratio:
Meaning: The relationship between borrowed funds and owner¶s funds and owner¶s capital is a
popular measure of the long term financial solvency of a firm. This relationship shown by the
debt-equity ratio only.
Formula: Debt-equity Ratio=Long term debt/Shareholder¶s equity.
Table: 5.10 (Rs.in million)
Particulars 2007 2008 2009
Long term debt 3117.84 3427.90 1594.89
Shareholder¶s eq. 7718.74 4625.57 5576.47
Debt-equity Ratio(Times)
0.4 0.74 0.29
Chart: 5.10
Interpretation:
y Debt equity ratio has decrease as compare to previous year
y It is good for the company as they have to pay less.
y This happens as long term debt is decreasing compare to previous years.
0.4
0.74
0.29
0
0.1
0.2
0.3
0.4
0.50.6
0.7
0.8
2007 2008 2009
Debt equity ratio
Debt equity ratio

8/7/2019 MicroInks Accounts Project
http://slidepdf.com/reader/full/microinks-accounts-project 25/42
MICRO INKS LIMITED
25 | P a g e
(11) Asset turnover ratio:
Meaning: This is a measure of how well assets are being used to produce revenue total asset
turnover. It shows ability to generate sales per rupee of assets.
Formula: total sales/total assets
Table: 5.11 (Rs. in million)
Particulars 2007 2008 2009
Total assets 13498.93 10561.61 10234.62
Total sales 12292.65 13428.01 13804.84
Assets turnover ratio(times) 0.91 1.27 1.35
Chart: 5.11
Interpretation:
y It shows increasing trend and it indicates that more sales is generated from last year y It is good for the company and company should try to utilize its assets to maximize the
sales for the next year also.
0.91
1.27 1.35
0
0.2
0.4
0.6
0.8
1
1.2
1.4
1.6
2007 2008 2009
Assets turnover ratio
Assets turnover ratio
8/7/2019 MicroInks Accounts Project
http://slidepdf.com/reader/full/microinks-accounts-project 26/42
MICRO INKS LIMITED
26 | P a g e
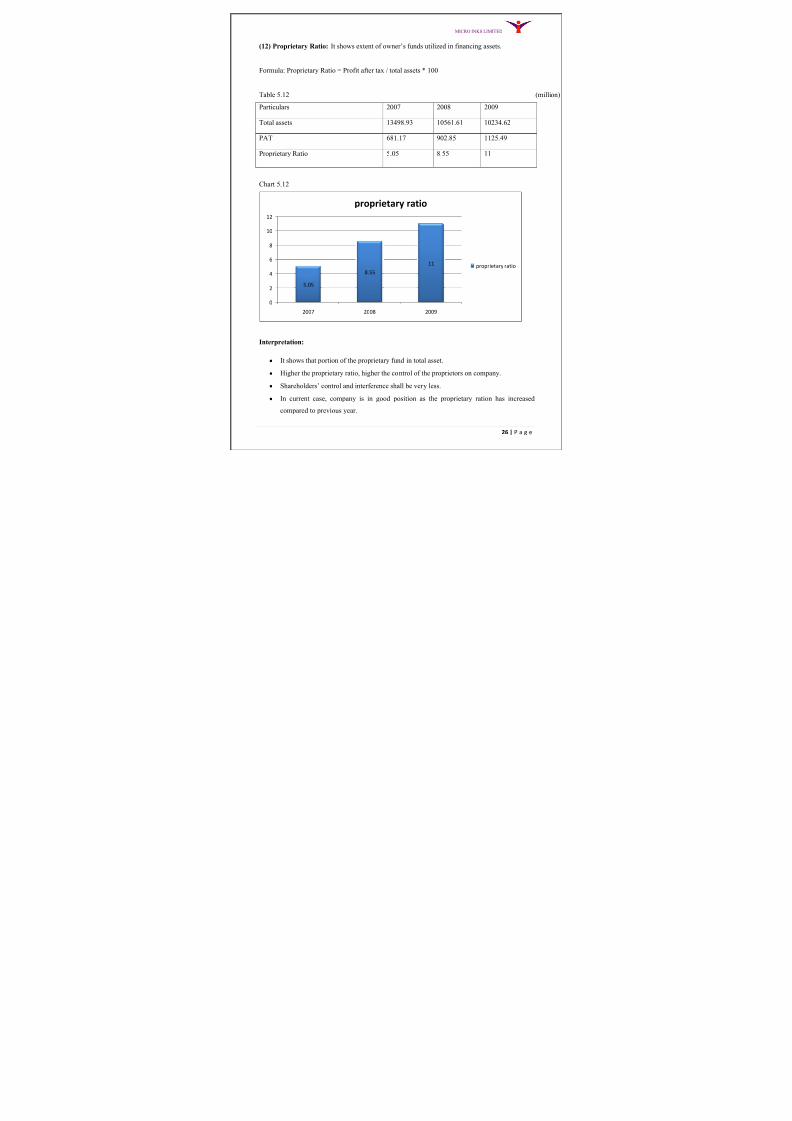
(12) Proprietary Ratio: It shows extent of owner¶s funds utilized in financing assets.
Formula: Proprietary Ratio = Profit after tax / total assets * 100
Table 5.12 (millio
Particulars 2007 2008 2009
Total assets 13498.93 10561.61 10234.62
PAT 681.17 902.85 1125.49
Proprietary Ratio 5.05 8.55 11
Chart 5.12
Interpretation:
y It shows that portion of the proprietary fund in total asset.
y Higher the proprietary ratio, higher the control of the proprietors on company.
y Shareholders¶ control and interference shall be very less.
y In current case, company is in good position as the proprietary ration has increased
compared to previous year.
5.05
8.55
11
0
2
4
6
8
10
12
2007 2008 2009
proprietary ratio
proprietary ratio
8/7/2019 MicroInks Accounts Project
http://slidepdf.com/reader/full/microinks-accounts-project 27/42
MICRO INKS LIMITED
27 | P a g e
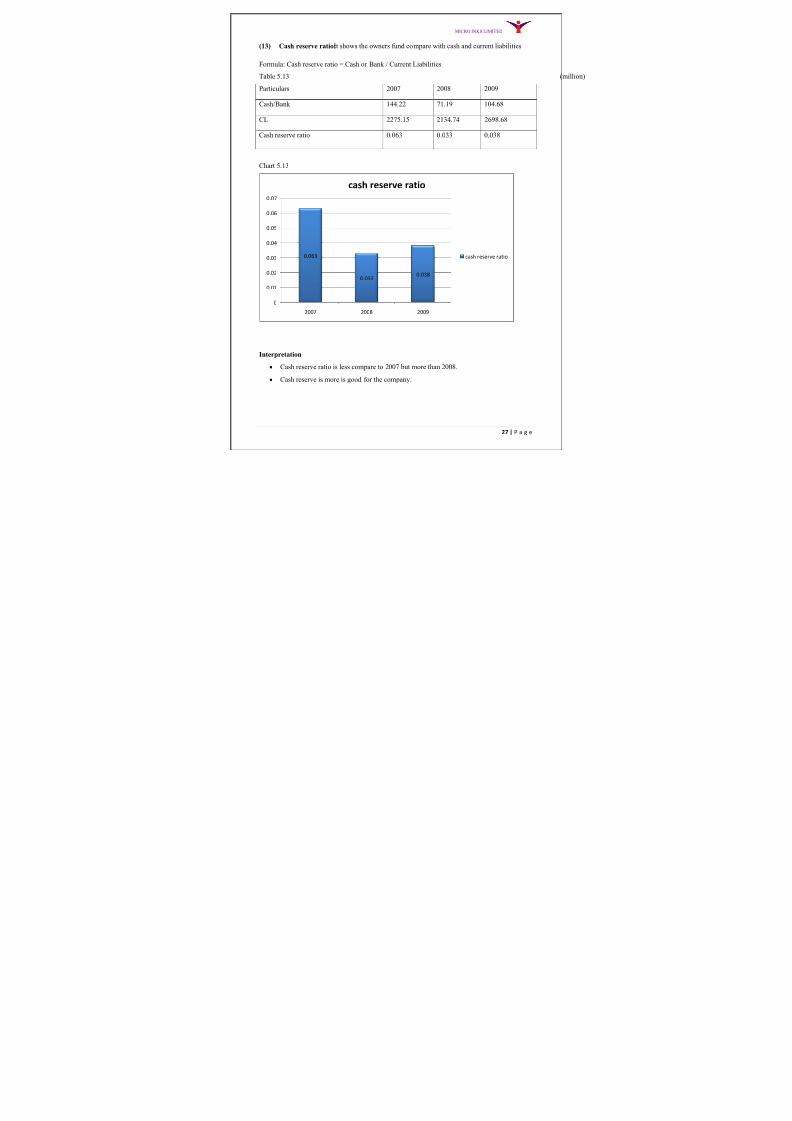
(13) Cash reserve ratio:It shows the owners fund compare with cash and current liabilities.
Formula: Cash reserve ratio = Cash or Bank / Current Liabilities
Table 5.13
Particulars 2007 2008 2009
Cash/Bank 144.22 71.19 104.68
CL 2275.15 2134.74 2698.68
Cash reserve ratio 0.063 0.033 0.038
Chart 5.13
Interpretation
y Cash reserve ratio is less compare to 2007 but more than 2008.
y Cash reserve is more is good for the company.
0.063
0.0330.038
0
0.01
0.02
0.03
0.04
0.05
0.06
0.07
2007 2008 2009
cash reserve ratio
cash reserve ratio
8/7/2019 MicroInks Accounts Project
http://slidepdf.com/reader/full/microinks-accounts-project 28/42
MICRO INKS LIMITED
28 | P a g e
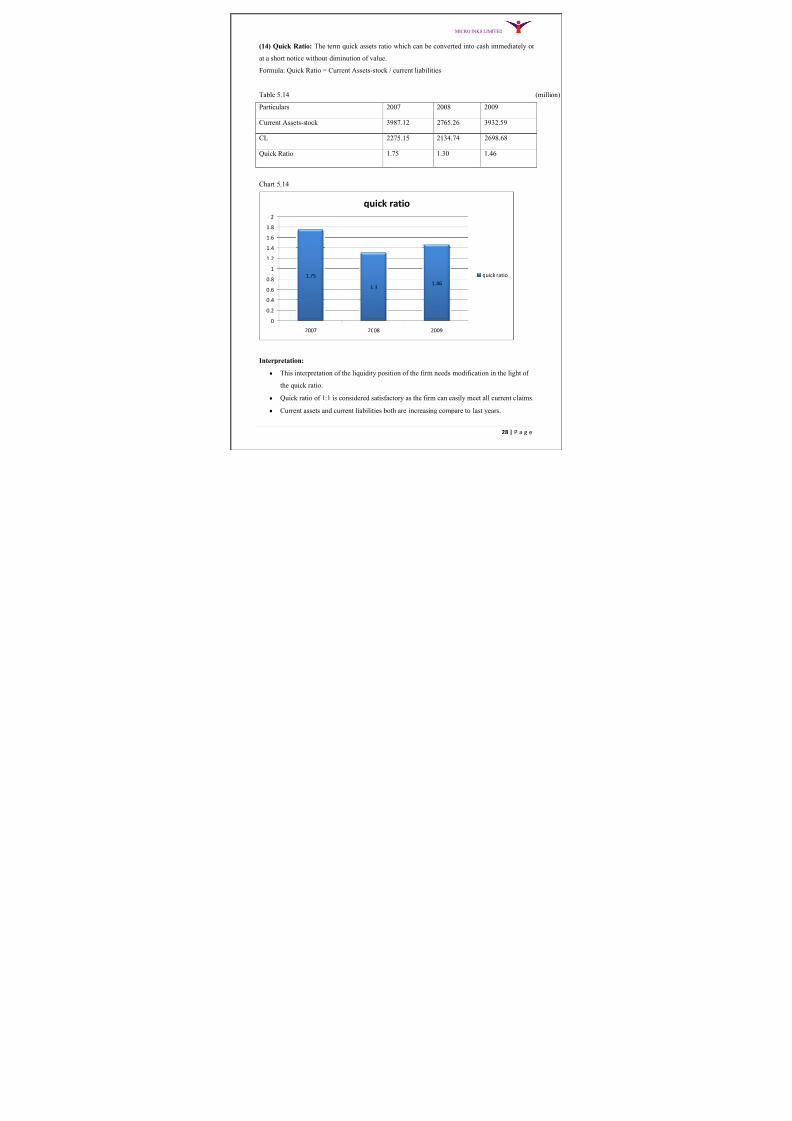
(14) Quick Ratio: The term quick assets ratio which can be converted into cash immediately or
at a short notice without diminution of value.
Formula: Quick Ratio = Current Assets-stock / current liabilities
Table 5.14 (millio
Particulars 2007 2008 2009
Current Assets-stock 3987.12 2765.26 3932.59
CL 2275.15 2134.74 2698.68
Quick Ratio 1.75 1.30 1.46
Chart 5.14
Interpretation:
y This interpretation of the liquidity position of the firm needs modification in the light of
the quick ratio.
y Quick ratio of 1:1 is considered satisfactory as the firm can easily meet all current claims.
y Current assets and current liabilities both are increasing compare to last years.
1.75
1.31.46
0
0.2
0.4
0.6
0.8
1
1.2
1.4
1.6
1.8
2
2007 2008 2009
quick ratio
quick ratio

8/7/2019 MicroInks Accounts Project
http://slidepdf.com/reader/full/microinks-accounts-project 29/42
MICRO INKS LIMITED
29 | P a g e
(15) Return on capital equity: Measures the return on the total equity funds of ordinary
shareholders
Formula: Return on capital equity = Profit after tax / capital equity * 100
Table 5.15 (million)
Particulars 2007 2008 2009
PAT 681.17 902.85 1125.49
CE 10836.58 8053.47 7171.36
Return on capital equity 6.29 11.30 15.69
Chart 5.15
Interpretation:
y Comparing with the previous years return on eq. is increasing.
y It is good for the company as profit after tax is increasing
y ROE increase due to increase in profit as capital equity decreasing gradually compare to
last three years.
6.29
11.3
15.69
0
2
4
6
8
10
12
14
16
18
2007 2008 2009
Return on cap eq.
Return on cap eq.
8/7/2019 MicroInks Accounts Project
http://slidepdf.com/reader/full/microinks-accounts-project 30/42
MICRO INKS LIMITED
30 | P a g e
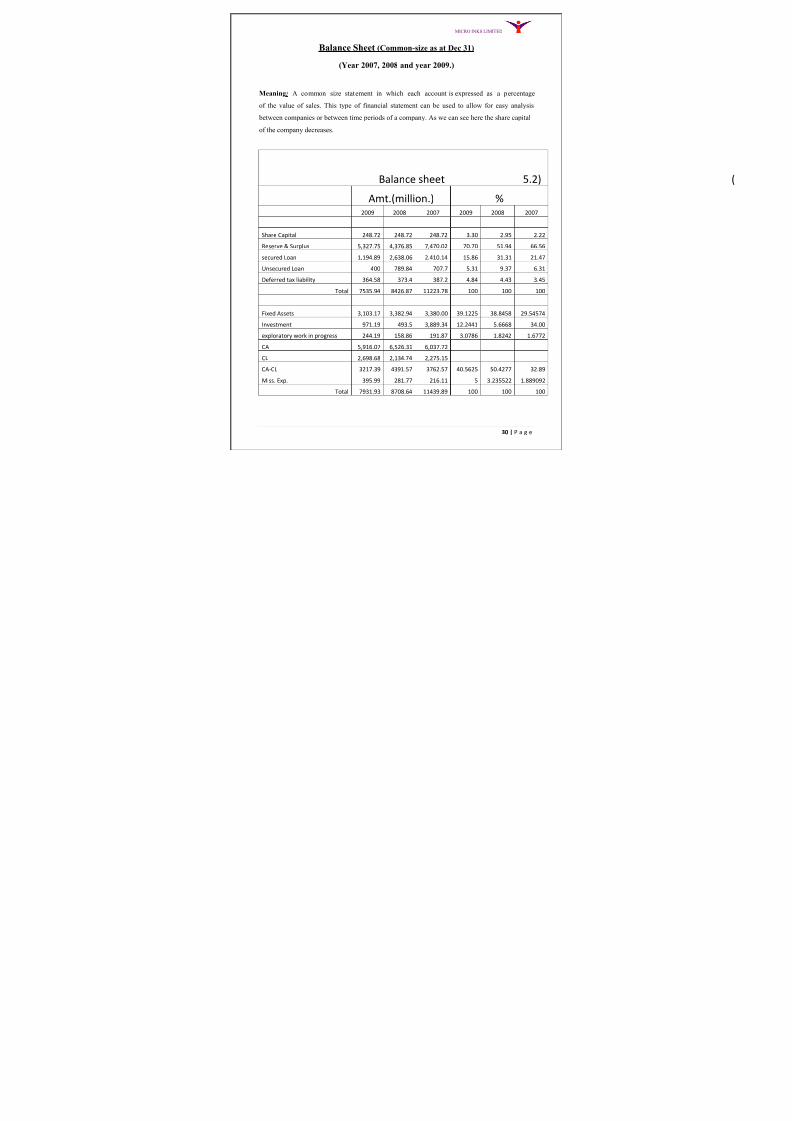
Balance Sheet (Common-size as at Dec 31)
(Year 2007, 2008 and year 2009.)
Meaning: A common size statement in which each account is expressed as a percentage
of the value of sales. This type of financial statement can be used to allow for easy analysis
between companies or between time periods of a company. As we can see here the share capital
of the company decreases.
Balance sheet 5.2)
Amt.(million.) % 2009 2008 2007 2009 2008 2007
Share Capital 248.72 248.72 248.72 3.30 2.95 2.22
Reserve & Surplus 5,327.75 4,376.85 7,470.02 70.70 51.94 66.56
secured Loan 1,194.89 2,638.06 2,410.14 15.86 31.31 21.47
Unsecured Loan 400 789.84 707.7 5.31 9.37 6.31
Deferred tax liability 364.58 373.4 387.2 4.84 4.43 3.45
Total 7535.94 8426.87 11223.78 100 100 100
Fixed Assets 3,103.17 3,382.94 3,380.00 39.1225 38.8458 29.54574
Investment 971.19 493.5 3,889.34 12.2441 5.6668 34.00
exploratory work in progress 244.19 158.86 191.87 3.0786 1.8242 1.6772
CA 5,916.07 6,526.31 6,037.72
CL 2,698.68 2,134.74 2,275.15
CA-CL 3217.39 4391.57 3762.57 40.5625 50.4277 32.89
Miss. Exp. 395.99 281.77 216.11 5 3.235522 1.889092
Total 7931.93 8708.64 11439.89 100 100 100
8/7/2019 MicroInks Accounts Project
http://slidepdf.com/reader/full/microinks-accounts-project 31/42
MICRO INKS LIMITED
31 | P a g e
Interpretation:
y In 2009 the secured loan is more less as compare to the previous year. The secured loan
in 2007, 2008 and 2009 respectively 15.86%, 31.31% 21.47% proportion of total
liabilities.
y The unsecured loan is decrease in 2009 than previous year but more than the preceding to
previous year.
y Because of it is decrease their interest rate by increase secured loan in place of unsecured
loan.
y The fixed asset is increase in 2009 than both previous year but the proportion part is
decrease than 2007
y The investment is also increase than previous year.
y The net current asset is decrease in 2009 than previous year.

8/7/2019 MicroInks Accounts Project
http://slidepdf.com/reader/full/microinks-accounts-project 32/42
MICRO INKS LIMITED
32 | P a g e
Common size of profit and loss account
P & L A/c
Amt.(million.) % 2009 2008 2007 2009 2008 2007
Income
Sales 13,764.81 13,382.78 11,488.01 99.71 99.66 99.67
Other Income 40.03 45.23 38.56 0.29 0.34 0.33
TOTAL 13804.84 13428.01 11526.57 100 100 100
Expense
Materials Consumed 9,076.68 8,674.88 7,949.96 65.75 64.60 68.97
Mfg and Other Exps 2,675.00 2,423.98 2,269.13 19.38 18.05 19.69
Finished Good Stock -92.66 137.23 -52.06 -0.67 1.02 -0.45
dep. 485.67 319.54 310.26 3.52 2.38 2.69
Interest 160.67 761.68 204.31 1.16 5.67 1.77
TOTAL 12305.36 12317.31 10681.6 89.13801 91.72848 92.66937
PBT 1,499.48 1,110.70 824.04 10.86 8.27 7.33
TAX 373.99 207.85 142.87 2.71 1.55 1.24
PAT 1125.49 902.85 681.17 8.152865 6.723632 6.091144
TOTAL 13804.84 13428.01 11505.64 100 100 100
Interpretation
y Considering the sales as base, percentage of all the incomes and expenses are calculated.
y Thus I derive increase or decrease in the profit or loss in comparison of previous year.
y In the above table I can see that profit percentage has increased from 6.72% to 8.15%.
y It shows the good position of the company that profit is increased and it is because that the
sales have increased.

8/7/2019 MicroInks Accounts Project
http://slidepdf.com/reader/full/microinks-accounts-project 33/42
MICRO INKS LIMITED
33 | P a g e
DU POND ANALYSIS
y Meaning: Du Pont analysis of the company is an important factor for analysis of the return
on assets, capital and equity, which are the main indicators of company profitability, stability
and rewards to investor.
y It is necessary and helpful to analyze the company in which an investor is going to invest
his/her money. The usefulness of the integrated analysis lies in the fact that it presents the
overall picture of the performance of a firm as also enables the management to identify the
factors which have a bearing on profitability.
Du Pont of ROE(5.3)
Particular 2009 2008 2007
EAT 433.33 373.56 316.59
EBT 527.03 425 365.18
EAT/EBT (Times) 0.822 0.879 0.867
EBT 527.03 425 365.18
EBIT 521.43 411.66 356.63EBT/EBIT (Times) 1.011 1.032 1.024
EBIT 521.43 411.66 356.63
Sales 2856.87 2396.16 2083.4
Net Profit Ratio (%) 18.252 17.180 17.118
Sales 2856.87 2396.16 2083.4
Assets 871.3 886.52 572.94
Assets turnover (times) 3.278859 2.702883 3.636332
Assets 871.3 886.52 572.94Equity 8676 8651 8640
Financial Leverage (times) 0.10 0.10 0.07
Return on Equity 4.995 4.318 3.664

8/7/2019 MicroInks Accounts Project
http://slidepdf.com/reader/full/microinks-accounts-project 34/42
MICRO INKS LIMITED
34 | P a g e
Interpretation
y EAT/EBT shows increase in comparison of last year. So it is good for the company.
Company should try to maximize it in following years.
y EBT/EBIT has decreased It implies that company is less paying interest to the debenture
holders.
y Net profit ratio has increased from 17% to 19% it shows higher sales and loIr cost of the
company.
y Assets turnover ratio gives an idea about the proportion of sales is increased by
optimizing the use of the assets.
y Financial leverage has same from 2 years.
8/7/2019 MicroInks Accounts Project
http://slidepdf.com/reader/full/microinks-accounts-project 35/42
MICRO INKS LIMITED
35 | P a g e
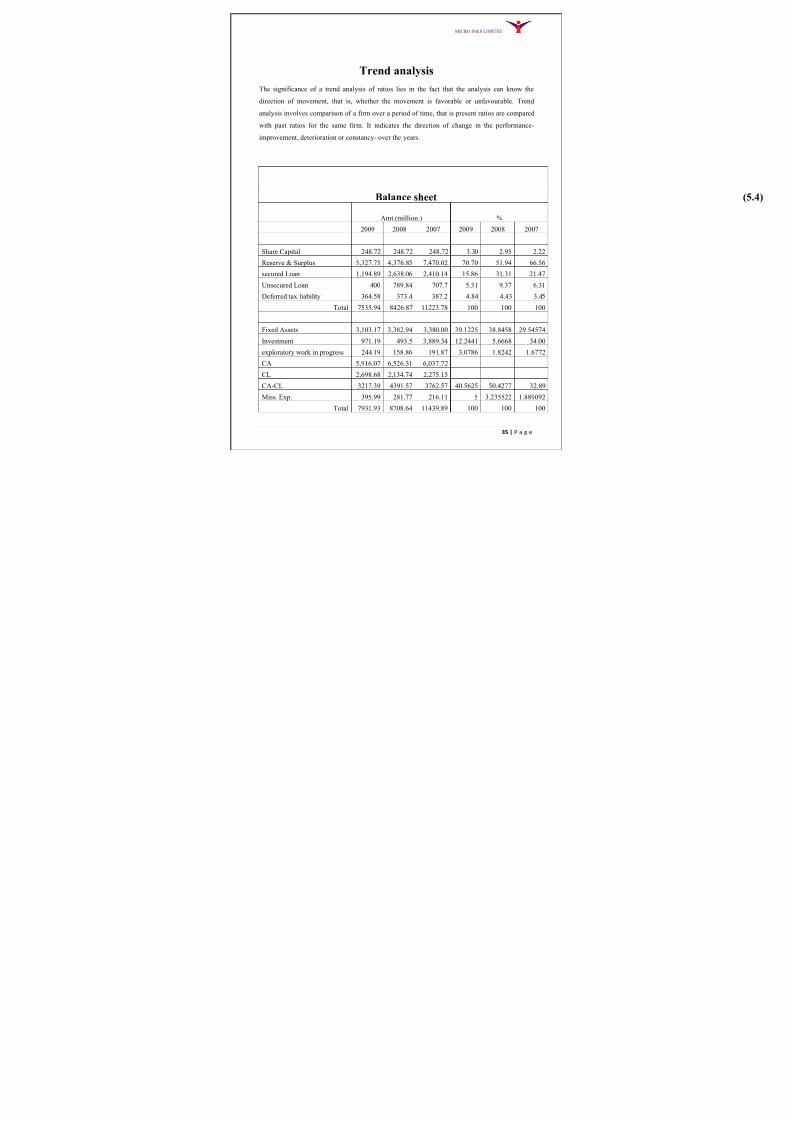
Trend analysis
The significance of a trend analysis of ratios lies in the fact that the analysis can know the
direction of movement, that is, whether the movement is favorable or unfavourable. Trend
analysis involves comparison of a firm over a period of time, that is present ratios are compared
with past ratios for the same firm. It indicates the direction of change in the performance-
improvement, deterioration or constancy- over the years.
Balance sheet
Amt.(million.) %
2009 2008 2007 2009 2008 2007
Share Capital 248.72 248.72 248.72 3.30 2.95 2.22
Reserve & Surplus 5,327.75 4,376.85 7,470.02 70.70 51.94 66.56
secured Loan 1,194.89 2,638.06 2,410.14 15.86 31.31 21.47
Unsecured Loan 400 789.84 707.7 5.31 9.37 6.31
Deferred tax liability 364.58 373.4 387.2 4.84 4.43 3.45
Total 7535.94 8426.87 11223.78 100 100 100
Fixed Assets 3,103.17 3,382.94 3,380.00 39.1225 38.8458 29.54574
Investment 971.19 493.5 3,889.34 12.2441 5.6668 34.00
exploratory work in progress 244.19 158.86 191.87 3.0786 1.8242 1.6772
CA 5,916.07 6,526.31 6,037.72
CL 2,698.68 2,134.74 2,275.15
CA-CL 3217.39 4391.57 3762.57 40.5625 50.4277 32.89
Miss. Exp. 395.99 281.77 216.11 5 3.235522 1.889092
Total 7931.93 8708.64 11439.89 100 100 100
8/7/2019 MicroInks Accounts Project
http://slidepdf.com/reader/full/microinks-accounts-project 36/42
MICRO INKS LIMITED
36 | P a g e
Interpretation
y Considering the year 2007 as a base year, I have calculated trend of the following years
for balance sheet
y I can see above that the trend is continuously increasing.
y It indicates sound position of the company.

8/7/2019 MicroInks Accounts Project
http://slidepdf.com/reader/full/microinks-accounts-project 37/42
MICRO INKS LIMITED
37 | P a g e
P & L A/c
Amt.(million.) %
2009 2008 2007 2009 2008 2007
Income
Sales 13,764.81 13,382.78 11,488.01 99.71 99.66 99.67
Other Income 40.03 45.23 38.56 0.29 0.34 0.33
TOTAL 13804.84 13428.01 11526.57 100 100 100
Expense
Materials Consumed 9,076.68 8,674.88 7,949.96 65.75 64.60 68.97
Mfg and Other Exps 2,675.00 2,423.98 2,269.13 19.38 18.05 19.69
Finished Good Stock -92.66 137.23 -52.06 -0.67 1.02 -0.45
dep. 485.67 319.54 310.26 3.52 2.38 2.69
Interest 160.67 761.68 204.31 1.16 5.67 1.77
TOTAL 12305.36 12317.31 10681.6 89.13801 91.72848 92.66937
PBT 1,499.48 1,110.70 824.04 10.86 8.27 7.33
TAX 373.99 207.85 142.87 2.71 1.55 1.24
PAT 1125.49 902.85 681.17 8.152865 6.723632 6.091144
TOTAL 13804.84 13428.01 11505.64 100 100 100
Interpretation
y Considering the year 2007-08 as a base year, I have calculated trend of the following
years for income-size statement
y I can see above that the trend is continuously fluctuating
y It indicates sound position of the company.
8/7/2019 MicroInks Accounts Project
http://slidepdf.com/reader/full/microinks-accounts-project 38/42
MICRO INKS LIMITED
38 | P a g e
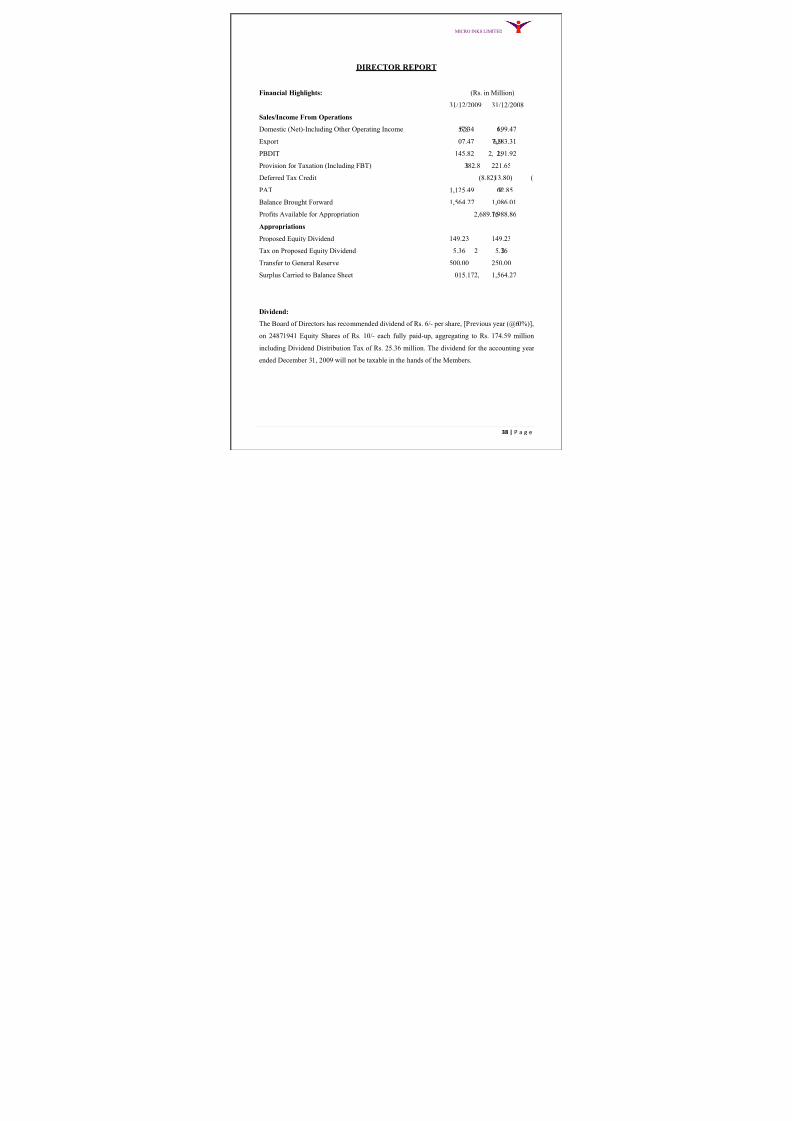
DIRECTOR REPORT
Financial Highlights: (Rs. in Million)
31/12/2009 31/12/2008
Sales/Income From Operations
Domestic (Net)-Including Other Operating Income 6,857.34 6,199.47
Export 6,907.47 7,183.31
PBDIT 2,145.82 2,191.92
Provision for Taxation (Including FBT) 382.81 221.65
Deferred Tax Credit (8.82) (13.80)PAT 1,125.49 902.85
Balance Brought Forward 1,564.27 1,086.01
Profits Available for Appropriation 2,689.761,988.86
Appropriations
Proposed Equity Dividend 149.23 149.23
Tax on Proposed Equity Dividend 25.36 25.36
Transfer to General Reserve 500.00 250.00
Surplus Carried to Balance Sheet 2,015.17 1,564.27
Dividend:
The Board of Directors has recommended dividend of Rs. 6/- per share, [Previous year (@60%)],
on 24871941 Equity Shares of Rs. 10/- each fully paid-up, aggregating to Rs. 174.59 million
including Dividend Distribution Tax of Rs. 25.36 million. The dividend for the accounting year
ended December 31, 2009 will not be taxable in the hands of the Members.

8/7/2019 MicroInks Accounts Project
http://slidepdf.com/reader/full/microinks-accounts-project 39/42

8/7/2019 MicroInks Accounts Project
http://slidepdf.com/reader/full/microinks-accounts-project 40/42
MICRO INKS LIMITED
40 | P a g e
Recommendation
y MICRO is the undisputed market leader in the country commanding a market share of 30%+ in the US $ 200 million domestic inks industry.
y MICRO has transformed itself into a multi-dimensional, multi- location company
offering a comprehensive range of quality products, efficient customer service and a wide
distribution network. In India
y Consolidated Net Sales grew only by 0.1%, due to global recession and led by 11%
growth in domestic market but 16% (in dollar terms) decline in US market, 3% decline in
Rest of the World market (excludingUSA and India) and 6% decline in revenue
y EBIT margins are expected to remain flat or dip from current levels. Micro inks has a
strong deal pipeline which will help drive growth in H2FY11.
y I maintain buy recommendation with a price target of Rs 500,"
y As MICRO INKS LTD is a Listed and Ill organized company
y EPS of the company is 108.15 and ROE of company is 15.69
y It shows the good position of the company. Thus, prospective investors are recommended
to invest their funds in the company.
8/7/2019 MicroInks Accounts Project
http://slidepdf.com/reader/full/microinks-accounts-project 41/42
MICRO INKS LIMITED
41 | P a g e
Conclusion
By making this project I got a very good experience from the project and now I am able to make
the financial analysis of any company and I m happy to make this project. By making this project
i came to know the idea of the actual financial condition of the company.

8/7/2019 MicroInks Accounts Project
http://slidepdf.com/reader/full/microinks-accounts-project 42/42
MICRO INKS LIMITED
Bibliography
M Y Khan, P K Jain Management Accounting ( Fifth Addition) (2010), Tata McGraw Hill
Education Private Limited.
For history of the company of micro inks ltd expected from www.microinks.com
For Final report 2007, 2008, 2009 expected from www.microinks.com
For economic & industrial analysis expected from www.winkepedia.com
Other sources from www.moneycontrol.com