microfinance programmes and the poor: whom are...
TRANSCRIPT
Microfinance Programmes and the Poor: Whom Are They Reaching? Evidence from Ghana
Joseph Kimos Adjei1 and Thankom Arun2
January 2009 BWPI Working Paper 72
Creating and sharing knowledge to help end poverty
1 Boafo Microfinance Services Ltd 2 University of Central Lancashire [email protected] [email protected] Brooks World Poverty Institute ISBN : 978-1-906518-71-4
www.manchester.ac.uk/bwpi
Abstract A key objective of microfinance programmes is to provide financial services to poor people who are excluded from such services by the formal banking system. It is in this perspective that governments, development partners and donor agencies continue to provide support to such institutions, to enable them to deepen their outreach. This paper examines the type of poor people served by one of the leading microfinance institutions in Ghana. By comparing the living standards of clients of Sinapi Aba Trust (SAT) with those of non-clients, representing the general population in its operational areas, the paper concludes that the microfinance institution reaches disproportionately a smaller percentage of very poor people. The study notes that programme placement plays a key role in determining the type of clients reached by SAT, since almost all its branches are located in urban centres. It finds that the objective of financial sustainability being pursued by SAT has eventually caused it to shift the provision of financial services from very poor households to the less poor. Keywords: Microfinance, Depth of outreach, Poverty, Standard of living, Financial sustainability Acknowledgements: We would like to express our gratitude to the management and members of staff of Sinapi Aba Trust and their clients, especially those being served by the Agona Swedru, Offinso and Tamale branches, as well as the non-clients residing in the aforementioned locations for their co-operation in the survey conducted for this paper. Joseph Kimos Adjei is the Managing Director of Boafo Microfinance Services Limited, a joint venture between HFC Bank Limited of Ghana and CHF International of the United States of America. He is a banker by profession and recently completed his PhD in Development and Policy Management at the Institute for Development and Policy Management, School of Environment and Development, The University of Manchester. Thankom Arun is Reader in International Finance, Lancashire Business School, The University of Central Lancashire and Honorary Senior Fellow, School of Environment and Development, The University of Manchester.
Introduction Poverty reduction has been a key objective of most development policies and programmes, including microfinance programmes (Hulme and Mosley, 1996; United Nations, 1997; Copestake et al., 2005; Arun et al., 2006; Adjei et al., 2008). The targeting of such policies and programmes at poor people is, therefore, important in development practice (Zeller et al., 2002). In most developing countries, most commercial banks do not serve several categories of people; these people are usually positively correlated to a greater degree and include poor people, women, rural inhabitants and uneducated people. Von Pischke (1995) describes a frontier between the formal and informal financial sectors. Those outside the frontier do not have regular access to formal financial services. They comprise a heterogeneous population, whose degree of exclusion from financial services may vary, and whose distance from the poverty line in either direction in their respective countries may differ (Hulme and Mosley, 1996). The vision of the founders of microfinance was to supply formal financial services to poor people, who were shunned by banks because their savings were tiny, their loan demand was small, and they lacked loan collateral (Yunus, 2001). Poor people in developing countries lack access to formal financial services and the problem is especially serious in rural areas. This constrains their ability to start businesses, finance emergency needs, acquire assets and insure themselves against illness and disasters (Zeller and Myer, 2002). The professed goal of public support for microfinance is to improve the welfare of poor households, through better access to small loans (Navajas, et al., 2000). In most instances, public funds for microfinance institutions carry a mandate to serve the poorest (Microcredit Summit, 2003). For instance, the Microcredit Summit in 1997 rallied support to seek more than US$20 billion to provide microfinance products and service to 100 million of the poorest households (Navajas et al., 2000; Daley-Harris, 2007). Governments, non-governmental organisations (NGOs) and development partners, including the World Bank, United Nations Development Programme (UNDP), the United States Agency for International Development, and the International Fund for Agricultural Development Fund (IFAD) also provide funding to microfinance institutions to support their operations. It must be noted that one of the criteria for judging the performance and benefits of microfinance institutions is outreach (Zeller and Meyer, 2002). In measuring institutional outreach, it is important to distinguish between the extent or breadth and the depth of outreach.1 If donors and governments have social welfare in mind, then they should find out whether microfinance is the best way to spend public money earmarked for development. This calls for funding to enable researchers and students to undertake more research into the activities of these programme interventions in order to ascertain their effects on participants, in terms of welfare outcomes as well as the type of people they serve. Since rural areas are not as well serviced as urban centres by physical and social infrastructure, their capacity to take advantage of market opportunities is severely curtailed. It is now widely known that, even though microfinance institutions have benefited immensely from donor and governmental support, it may not
1The extent of outreach is represented by the absolute number of households or enterprises (or relative market penetration) in the target population reached by the institution, whilst the depth of outreach indicates how deep into the pool of the underserved the institution has been able to reach.
always be the best way to assist the poorest of the poor (Hulme and Mosley, 1996; Buckley, 1997). It is against this background that some argue that microfinance tends to siphon funds from other projects that might better help poor people. It is imperative for those who provide the funding to know whether poor people are benefiting from the activities of these institutions. As observed by Navajas et al. (2000), most microfinance institutions tend to serve not the poorest of the poor, but rather those near the poverty line. Thus, the empirical question to answer is whether microfinance programmes are reaching the poorest of the poor or the very poor. Microfinance institutions generally stress serving clients outside the frontier of formal finance, although most often relatively few data are available to document the nature of the clientele actually served, especially in Sub-Saharan Africa (Mayoux, 1999; Buss, 2005; Lafourcade et al., 2005). There are also different views among researchers, providing diverse views about the depth of outreach of microfinance programmes. This paper seeks to contribute to the debate on depth of outreach of microfinance programmes for poor people. It investigates the depth of outreach of Sinapi Aba Trust of Ghana in its operational areas, by adopting the poverty assessment tool developed by Henry et al. (2003). The tool adopted for this paper relies on varied poverty indicators, reflecting the multi-dimensional nature of poverty. It also offers an objective method for summarising the overall poverty information of each household and unambiguously ranking these households by their relative poverty levels. The authors argue that the type of clients reached by the programme are determined by programme placement factors as well as the SAT policy of financial sustainability, without necessarily relying on donors to support its lending operations. The remainder of the paper is organised into four sections. Section 2 examines some empirical evidence of the extent to which microfinance programmes are serving the poorest of the poor, whilst Section 3 provides brief information on the case study microfinance institution. Section 5 deals with the data collection method adopted, and Section 5 presents the empirical results. The paper concludes by examining the lessons learned from the study.
Microfinance and the poor
A growing body of evidence suggests that very poor households are either excluded from accessing microfinance programmes (Hulme and Mosley, 1996; Navajas et al., 2002; Datta, 2004). According to these authors, increasingly extremely poor people are seen to be dropping out of credit programmes after having failed to keep up with repayment instalments. Some critics also question the efficacy of micro-credit in reaching extremely poor people. They argue that, while micro-credit has contributed positively to the wellbeing of poor people in general, it has failed to reach the poorest of the poor. Most microfinance institutions tend to serve not the poorest of the poor, but rather those near the poverty line. Whilst it has been demonstrated that microfinance programmes do not help the poorest, some researchers have pointed to several general issues, including the design features that make it work for the poorest (Hickson, 2001). Detailed research undertaken by Montgomery (1996) on the SANASA programme revealed that some design features of savings and credit schemes are able to meet the needs of very poor people. Findings from the study show that easy access to savings and the provision

of emergency loans by the microfinance institutions enable very poor people to cope better with seasonal income fluctuations. While innovation strategies pursued by microfinance institutions have enabled them to make loans more available to poor people, there is still debate over the design of appropriate financial services for the poorest (Johnson and Rogaly, 1997). Similarly, in their research on the impact of 13 microfinance institutions in seven developing countries on poverty and other target variables, Mosley and Hulme (1998, 783) argued that ‘for well-designed schemes impact at all levels of income, is higher than for ill-designed schemes’. Other researchers see ‘targeting’ by microfinance programmes as being effective in reaching the poorest of the poor. Even a well designed microfinance programme is unlikely to have a positive impact on the poorest people unless it specifically seeks to reach them through appropriate product design and targeting (Wright, 2001). Experience has shown that unless there is a targeting tool, the poorest will either be missed or they will tend to exclude themselves because they do not see the programmes as being for them, do not have the correct clothes, etc. (Navajas et al., 2000). According to Martin and Hulme (2003), earlier studies of poverty-reduction programmes have demonstrated that programmes that adopt a livelihood promotion approach, such as microcredit and skills training, can benefit poor households, but do not directly benefit the hardcore poor (Zaman, 1998; Hashemi, 2001). Martin and Hulme go on to argue that:
such programmes have the advantage of being relatively cost effective but they come with a ‘price’, by excluding the chronically poor. They examine evidence from BRAC Income Generation for Vulnerable Groups Development (IGVGD) programme that seeks to reach Bangladesh’s ‘hardcore poor’ by combining elements of livelihood protection (food aid) and livelihood promotion (skills training and microfinance). By combining both approaches, it is possible to deepen the reach of poverty reduction schemes, so that the hardcore poor can derive direct benefits and some of them can escape absolute poverty (Martin and Hulme, 2003, 661).
They find, however, that although IGVGD can reach deeper than merely promotional schemes, and can benefit the chronic poor, it cannot totally replace programmes of pure social protection. A small proportion of the population will always need more traditional ‘social welfare’ support to avoid persistent deprivation. By combining loans with savings and insurance products, microfinance can further help to minimise the use of loans for consumption. Montgomery (1996) suggests that financial products, such as savings facilities, insurance and small consumption loans with flexible repayment periods, might be more suitable to the needs of the poorest. They would increase the short-term impacts, in terms of the productivity of the asset which the loan financed. Despite the growth of microfinance, programmes specifically designed to target the poor are still not very widespread. It is still being debated whether reaching the poorest people with these programmes is even desirable. The ability of microfinance programmes to reach the poorest is limited, because they lack the necessary skills, such as accounting ability and entrepreneurship, to create and sustain a business. To make the programme effective for the poorest would require greater resources for literacy and basic training programmes. Therefore, credit-based programmes should be one component of a poverty reduction strategy. An argument could also be made that focusing on those near the poverty line would still help society as a whole and, at the same time, increase the chances of the programme becoming self-sufficient (Gulli, 1998).

According to Morduch (2006), recent studies show that microfinance mainly serves moderately poor and low-income households, though with weaker outreach to the very poor. The author states further that studies completed as part of legislation mandated by the US Congress, for example, show that:
in Peru, Kazakhstan and Uganda, roughly 15 per cent of microfinance customers were among the poorest half of the poor as defined by the official poverty lines in their countries; and in Bangladesh, 44 per cent were found to be among the poorest, a figure lower than expected (Morduch, 2006, 11).
It has also been revealed that group lending methodologies used by most microfinance institutions have more potential for deeper outreach than individual lenders did (GHAMFIN, 2007). Thus group lending methodologies have more potential for deep outreach, because they substitute joint liability for physical collateral. Microfinance may or may not be a good development gamble. Again, depth of outreach tends to be very high in situations where the microfinance institution operates in more rural and remote areas than in an urban setting, where the majority of the clients are less poor.
Case study institution
SAT is the largest NGO providing microfinance services in Ghana and a partner of the Opportunity International Network. The name ‘Sinapi Aba’ is the local language version of the biblical word ‘mustard seed’. It reflects its mission to serve as a mustard seed through which opportunities for enterprise development and income generation are given to the economically disadvantaged in society, to transform their lives. The organisation serves as the bank for over 50,000 poor clients, offering credit, savings, insurance and holistic training services, with women constituting about 92 percent of the organisation’s client base (SAT, 2007; Adjei et al., 2008). SAT adopts a group-based lending methodology called Trust Banks designed to reach the self-employed poor. Some of the criteria of membership of the Trust Bank include attendance and participation in the initial orientation programme and weekly meetings as well as ownership of business over a period of six months. Products and services offered by the organization include loans, savings deposits, client welfare (insurance) scheme and non-financial services including entrepreneurial skills. The operations of SAT has been financially self sustainable and most often combines debt capital with its equity to support its lending operations (Planet Rating, 2007).
Survey design The survey was undertaken from February to June 2007 in Ghana. It covered two groups of respondents, made up of 231 clients of SAT and 305 non-clients residing in the same operational areas of SAT. Respondents were selected from nine districts, located within the three main geographical zones of the country made up of the coastal areas, forest and savannah. Clients of SAT were selected by using a multi-stage sampling method. Since SAT has branches in all the ten political and administrative regions, the country was initially divided into three main zones, made up of coastal, forest and savannah, in accordance with Ghana Statistical Service (GSS) definitions (GSS, 2007); each zone covers at least three regions. Thereafter, three branches of SAT, each located in the three zones, were selected for the study. A list of clients was requested from the three branches. From this list, a systematic random sample was adopted to select 232 clients. This approach was adopted in

order to avoid selecting respondents from only a few or particular groups.2 Thus, the use of the systematic random sampling method helped to generate a representative sample of all groups in each of the selected branches of SAT. Due to the problem of obtaining a list of non-clients from which a sample could be selected, a random walk technique was employed to select these respondents. It must be recognised that sampling non-client households would have been a time-consuming exercise if an accurate list of all households had to be created within each survey area. To overcome this problem, the study employed a two-stage technique called the Expanded Programme for Immunisation (EPI) cluster survey design method. Although this method is less precise than sampling from a true population list, its greatest efficiency is an appropriate trade-off for the loss of precision. In contrast to the sampling frame for client households, the EPI requires no preparatory work, other than defining the boundaries of each survey site (Henry et al., 2003). The random selection of non-client households was done at the same time as the survey of clients was conducted.
Multiple dimensions of poverty
In undertaking this study, various living standard indicators depicting the multi-dimensional nature of poverty were used to ascertain the relative poverty levels of both groups of respondents. In this regard, the study adopted a tool developed by Henry et al. (2003), allowing the measurement of the depth of poverty outreach of microfinance institutions worldwide. The tool was used to construct a household-level poverty index, based on indicators drawn from a simple household survey. The poverty status of clients of SAT was assessed and compared with a representative sample of non-clients. The study thus presents the poverty profile of clients of SAT relative to a representative sample of non-clients; it also identifies the relative depth of SAT poverty outreach in its operational areas. Due to the multi-dimensional nature of poverty, reliance on any one poverty dimension, such as food security, access to housing/accommodation or education, is deemed to be inappropriate and inadequate. Rather, to capture the different dimensions of poverty, various indicators were adopted, based on those used by the Ghana Statistical Service for data collection for the GLSS (GSS, 2007) and others developed by Henry et al. (2003). The indicators selected for this study are related to human resources, food security and vulnerability, dwelling and related indicators, as well as the ownership of household assets. The choice of the indicators was based on a number of criteria, including the ease and accuracy with which information on the indicators could be elicited in the household survey and the significance of the correlation of the indicator with per capita expenditure on clothing and footwear, which is the poverty benchmark indicator3 used for this study. Other important considerations were the suitability and the
2 Clients belonged to various groups who receive loans at the same time and such group members either tend to undertake similar businesses or reside in the same area or have certain things in common. 3 Per capita expenditure on clothing and footwear was chosen as the benchmark indicator because it bears a stable and highly linear relationship to total consumption expenditure, a comprehensive and widely acceptable measure of poverty.
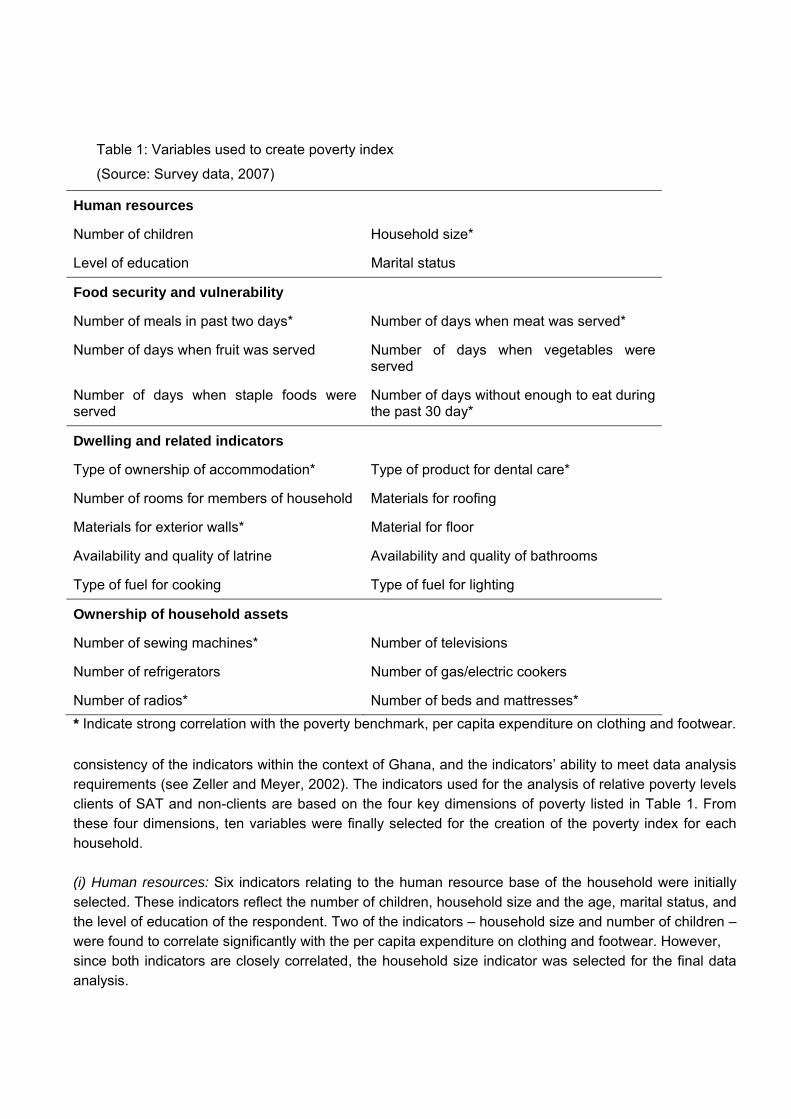
Table 1: Variables used to create poverty index
(Source: Survey data, 2007)
Human resources
Number of children Household size*
Level of education Marital status
Food security and vulnerability
Number of meals in past two days* Number of days when meat was served*
Number of days when fruit was served Number of days when vegetables were served
Number of days when staple foods were served
Number of days without enough to eat during the past 30 day*
Dwelling and related indicators
Type of ownership of accommodation* Type of product for dental care*
Number of rooms for members of household Materials for roofing
Materials for exterior walls* Material for floor
Availability and quality of latrine Availability and quality of bathrooms
Type of fuel for cooking Type of fuel for lighting
Ownership of household assets
Number of sewing machines* Number of televisions
Number of refrigerators Number of gas/electric cookers
Number of radios* Number of beds and mattresses* * Indicate strong correlation with the poverty benchmark, per capita expenditure on clothing and footwear.
consistency of the indicators within the context of Ghana, and the indicators’ ability to meet data analysis requirements (see Zeller and Meyer, 2002). The indicators used for the analysis of relative poverty levels clients of SAT and non-clients are based on the four key dimensions of poverty listed in Table 1. From these four dimensions, ten variables were finally selected for the creation of the poverty index for each household. (i) Human resources: Six indicators relating to the human resource base of the household were initially selected. These indicators reflect the number of children, household size and the age, marital status, and the level of education of the respondent. Two of the indicators – household size and number of children – were found to correlate significantly with the per capita expenditure on clothing and footwear. However, since both indicators are closely correlated, the household size indicator was selected for the final data analysis.

(ii) Food security and vulnerability: In this instance, six indicators were initially selected for the study. These indicators relate to hunger and frequency of consumption of luxury and staple foods, most of which were very important in explaining differences in the level of poverty between the two groups of respondents. Indicators relating to the frequency of consumption of meat, the number of meals taken during the past two days and frequency of not having enough food to eat during the past 30 days were found to correlate significantly with the poverty indicator and were, thus, chosen for the data analysis. (iii) Dwelling and related indicators: Dwelling indicators were found to be homogenous in the survey areas, for both clients and non-clients. This is not surprising considering the fact that both groups of respondents reside in the same operational areas of SAT. The only indicator which was found to correlate significantly with the poverty benchmark was the type of material used for the external walls of the respondent’s place of residence. Other related indicators which showed high correlation with the poverty benchmark were the type of ownership of accommodation and the type of product for dental care. (iv) Household assets: These indicators play an important role in the determination of poverty levels of people in Ghana. A total of six assets were initially selected, out of which three of them – number of sewing machines, number of radios owned and the number of beds and mattresses – were found to correlate significantly with the poverty benchmark and were, therefore, selected for the data analysis.
Descriptive statistics
Tables 2 and 3 present the descriptive statistics of the socio-economic characteristics of the two groups of respondents. Analysing the data for significant differences, with respect to the socio-economic characteristics, between clients and non-clients can improve our understanding of why the two groups might differ or otherwise, in terms of poverty levels. These results provide a background that will contribute to the interpretation of the quantitative poverty-related findings. Differences between the two groups have been tested by using both t-test of differences between means and the chi-square test for cross tabulations. Chi-square tests were applied to variables that are measured on either a nominal or ordinal scale, while the t-tests were also applied on interval and ratio data. The statistics above show that under the human resource dimension, the variables which depict significant differences between the client and the non-client groups are marital status, age, number of children and household size. In terms of levels of education, there are no significant differences between the two groups. For the food and vulnerability dimension, significant differences exist between the two groups of respondents for all the key variables, except the number of days on which staple foods were served. This result is not surprising considering the fact that staple foods are the basic food items normally consumed by all respondents, irrespective of one’s poverty status, while the consumption of the other food items classified as ‘luxury’, including meat, diary products, fruits and vegetables, distinguishes very poor people from those who are less poor or non-poor.
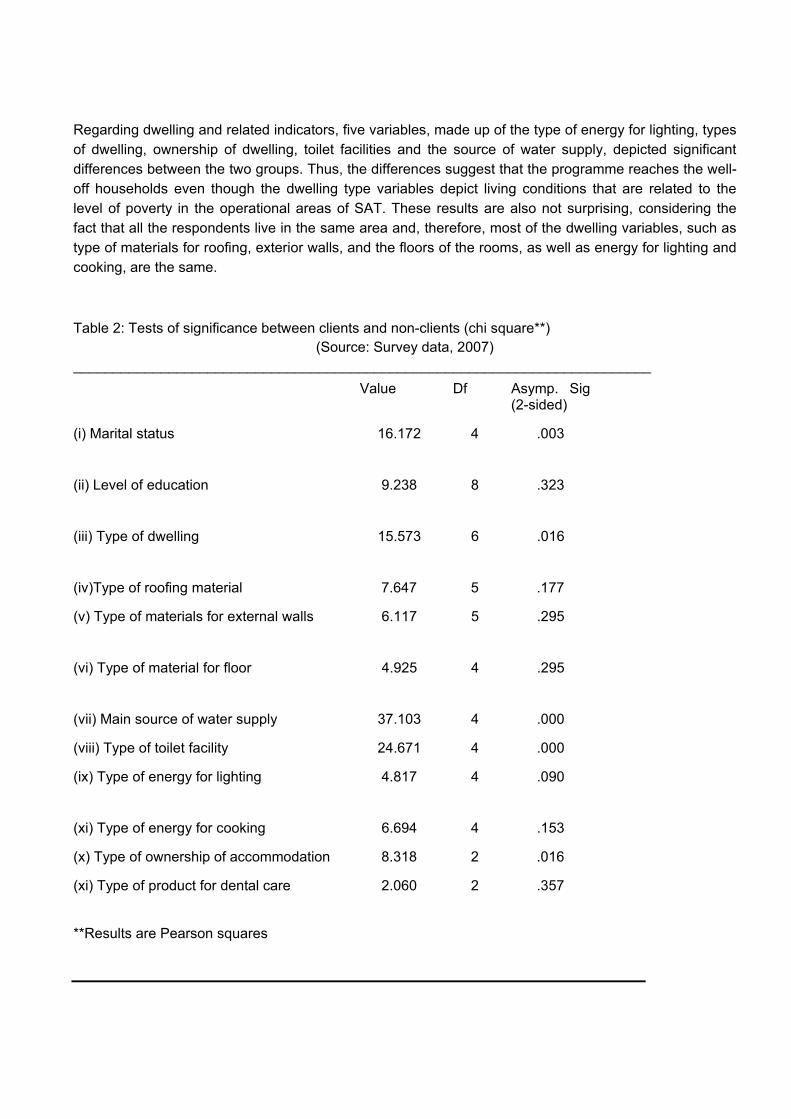
Regarding dwelling and related indicators, five variables, made up of the type of energy for lighting, types of dwelling, ownership of dwelling, toilet facilities and the source of water supply, depicted significant differences between the two groups. Thus, the differences suggest that the programme reaches the well-off households even though the dwelling type variables depict living conditions that are related to the level of poverty in the operational areas of SAT. These results are also not surprising, considering the fact that all the respondents live in the same area and, therefore, most of the dwelling variables, such as type of materials for roofing, exterior walls, and the floors of the rooms, as well as energy for lighting and cooking, are the same.
Table 2: Tests of significance between clients and non-clients (chi square**)
(Source: Survey data, 2007) _________________________________________________________________________ Value Df Asymp. Sig
(2-sided)
(i) Marital status 16.172 4 .003
(ii) Level of education 9.238 8 .323
(iii) Type of dwelling 15.573 6 .016
(iv)Type of roofing material 7.647 5 .177
(v) Type of materials for external walls 6.117 5 .295
(vi) Type of material for floor 4.925 4 .295
(vii) Main source of water supply 37.103 4 .000
(viii) Type of toilet facility 24.671 4 .000
(ix) Type of energy for lighting 4.817 4 .090
(xi) Type of energy for cooking 6.694 4 .153
(x) Type of ownership of accommodation 8.318 2 .016
(xi) Type of product for dental care 2.060 2 .357
**Results are Pearson squares

Table 3: Test of significance between clients and non-clients (t-tests) (Source: Survey data, 2007) Levene’s test for equality of variance** T-test for equality of means F Sig. t Df Sig. (2-
tailed) Mean diff.
Std. error diff.
(i) Age
.027
.870 2.953 534 .003 2.621 .888
(ii) Household size
.396
.529 3.534 534 .000 .571 .162
(iii) Number of children
4.251
.040 2.823 534 .005 .359 .127
(iv) Number of meals during past 2 days
.303
.582 .889 534 .375 .095 .107
(v) Number of days meat served in last 7 days
1.652
.199 5.296 534 .000 .620 .119
(iv) Number of days diary, eggs served in last 7 days
.005
.943 3.704 534 .000 .391 .106
(vii) Number of days fruits & vegetables served in last 7 days
3.116
.078 7.866 534 .000 .980 .125
(viii) Number of days staple only served in last 7 days
.051
.822 -1.107 534 .269 -.151 .137
(ix) Number of days without enough to eat in last 30 days
8.741
.003 -4.211 534 .000 -1.047 .249
(x) Number of rooms for household
25.066
.000 4.555 534 .000 .679 .149
(xi) Number of sewing machines owned
44.627
.000 3.575 534 .000 .143 .040
(xii) Number of televisions owned
9.305
.002 1.424 534 .155 .064 .045

Table 3 (cont.)
F Sig. t Df Sig. (2-tailed)
Mean diff.
Std. error diff.
(xiii) Number of refrigerators owned
39.561
.000 4.260 534 .000 .262 .062
(xiv) Number of gas/electric cookers owned
15.496
.000 1.979 534 .048 .048 .024
(xv) Number of radios owned 68.946
.000 5.836 534 .000 .231 .040
(xvi) Number of beds & mattresses owned
78.253
.000 5.525 534 .000 .299 .054
(xvii) Expenditure on clothing & footwear
16.232
.000 3.540 534 .000 95,617 27,010
**Equal variances are assumed for each variable. With respect to the asset-based dimension, four out of the six variables, made up of number of sewing machines, refrigerators, beds and mattresses owned, showed significant differences between the two groups. It must be emphasised that two of these assets – sewing machines and refrigerators – could be classified as productive assets, since they are most often used by the poor to generate income to support household expenditure. However, when one considers items such as television, gas or electric cookers, it could be realised that the programme reach depends on the level of poverty, and this assertion is supported by the fact that one of the criteria of membership of the programme is ownership of an existing business. Finally, there was also a significant difference between the two groups of respondents in respect of expenditure on clothing and footwear, the poverty benchmark chosen for the assessment of the relative poverty levels of the respondents. Comparatively, clients of SAT spent more on these items than non-clients. In general, there were significant differences between clients and non-clients with respect to the various poverty-related dimensions selected for the study, including the poverty benchmark of per capita expenditure on clothing and footwear. The differences were, however, more pronounced in respect of variables for which the individual had little or no control over their acquisition. The differences also provide evidence of the level of relative poverty between the two groups. This has been further confirmed in this study, with the use of the principal component analysis (PCA) method to calculate the poverty score or index for each household.

Poverty index of households
The poverty index for each household of both groups of respondents has been derived using the PCA method based on four dimensions of poverty, as depicted in Table 1. These dimensions are human resources, food security and vulnerability, dwelling and related indicators, and ownership of household assets. It must be emphasised that the choice of these variables for the calculation of the poverty scores is due to their acceptability globally as indicators of poverty, based on the CGAP poverty assessment tool (Henry et al., 2003). Due to the multi-dimensional nature of poverty, this approach is very sensitive in discriminating between different levels of poverty. With the use of the PCA method, the poverty scores were generated and these scores were assigned to each household; based on this, they were then ranked. The lower the poverty score, the worse off the household, and vice versa. The histogram in Figure 1 shows the distribution of the poverty scores in a standardised form. The scores derived from the PCA method range from -3.71 to 3.19. Approximately 70 percent of all households fall in the range between -1 and 1, whilst about 51 percent of households fall below zero, that is, those with negative scores. In terms of poverty distribution, it is observed that the distribution is normal, indicating an even spread of poverty scores across households within the survey areas.
Household poverty index4.002.000.00-2.00-4.00
Fre
qu
ency
60
50
40
30
20
10
0
Mean =-1.99E-16�Std. Dev. =1.00�
N =536
Figure 1: Histogram showing poverty scores of respondents’ households (Source: Survey data)
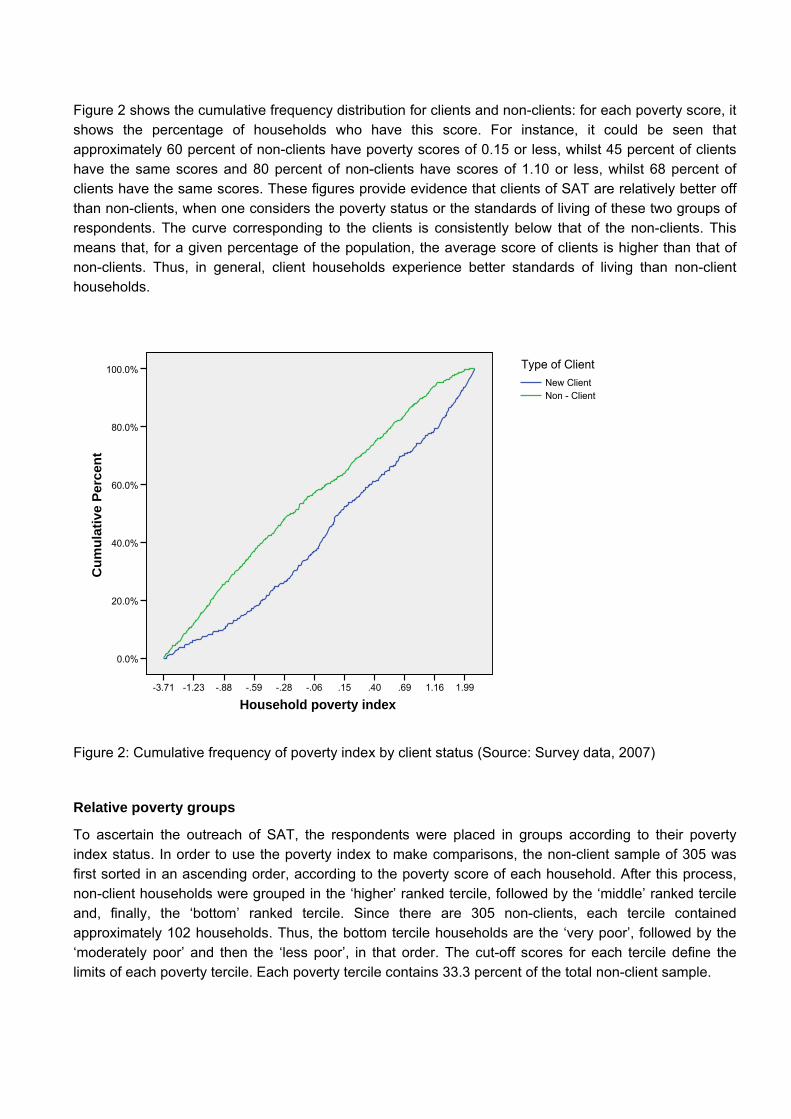
Figure 2 shows the cumulative frequency distribution for clients and non-clients: for each poverty score, it shows the percentage of households who have this score. For instance, it could be seen that approximately 60 percent of non-clients have poverty scores of 0.15 or less, whilst 45 percent of clients have the same scores and 80 percent of non-clients have scores of 1.10 or less, whilst 68 percent of clients have the same scores. These figures provide evidence that clients of SAT are relatively better off than non-clients, when one considers the poverty status or the standards of living of these two groups of respondents. The curve corresponding to the clients is consistently below that of the non-clients. This means that, for a given percentage of the population, the average score of clients is higher than that of non-clients. Thus, in general, client households experience better standards of living than non-client households.
Household poverty index1.991.16.69.40.15-.06-.28-.59-.88-1.23-3.71
Cum
ulat
ive
Perc
ent
100.0%
80.0%
60.0%
40.0%
20.0%
0.0%
Non - ClientNew Client
Type of Client
Figure 2: Cumulative frequency of poverty index by client status (Source: Survey data, 2007)
Relative poverty groups
To ascertain the outreach of SAT, the respondents were placed in groups according to their poverty index status. In order to use the poverty index to make comparisons, the non-client sample of 305 was first sorted in an ascending order, according to the poverty score of each household. After this process, non-client households were grouped in the ‘higher’ ranked tercile, followed by the ‘middle’ ranked tercile and, finally, the ‘bottom’ ranked tercile. Since there are 305 non-clients, each tercile contained approximately 102 households. Thus, the bottom tercile households are the ‘very poor’, followed by the ‘moderately poor’ and then the ‘less poor’, in that order. The cut-off scores for each tercile define the limits of each poverty tercile. Each poverty tercile contains 33.3 percent of the total non-client sample.

Client households were also categorised into terciles, based on their poverty scores using the non-client cut-off points. The outcome of this analysis is shown in Table 4, the distribution of SAT clients being as follows: 15 percent were classified as ‘very poor’, 39 percent as ‘moderately poor’ and 46 per cent as ‘less poor’. These results indicate that clients of SAT are under-represented in the very poor category, but over-represented in both the moderately poor and less poor categories of the population within the survey areas. Thus, even though SAT is reaching the very poor, the programme reaches more of the moderately poor and less poor of the population in its operational areas.
Table 4: Distribution of client and non-client households across poverty groups (Source: Survey data, 2007) ____________________________________________________________________ Poverty group % Client % Non-client households households Very poor 15 33 Moderately poor 39 33 Less poor 46 33 _____________________________________________________________________
Discussion of findings The results of the analysis indicate that, in general, SAT microfinance programme targets a disproportionately smaller proportion of the very poor in its operational areas. Thus, only 15 percent of its clients fall into the poorest category, whilst 46 percent of the target clients fall within the less poor category. These results are not surprising when one considers the context within which SAT is operating – including its mission and objectives as well as products and service range; client selection criteria; and, finally, its geographical focus. Since the programme’s mission is to provide opportunities for enterprise development and income generation to the economically disadvantaged in society in order to transform their lives, with the objective of providing them credit and other financial and non-financial services for small and micro-business ventures, one should expect the organisation to target economically active poor people to the disadvantage of very poor people in its operational areas. This finding is consistent with that of Montgomery and Weiss (2005, 7), who argue that ‘most microfinance institutions probably do not consider their institutional mission to be serving the poorest of the poor’. The results are also consistent with recent studies carried out by GHAMFIN (2006) and Opoku (2005). The former concluded that the pattern of poverty outreach of NGOs in Ghana ‘resemble the tick sign, thus, tilting towards the average to the non-poor categories’ (GHAMFIN, 2006, 36). It was found that both Rural and Community Banks (RCBs) and NGOs have wider spreads from the lowest to the highest quintiles in terms of poverty scores. In the study by Opoku (2005, cited in Brody et al., 2005, 117-119), which compared the poverty levels of mature and new clients of SAT using the means test statistics, it was concluded that ‘SAT might be taking on better-off clients’ and that there was ‘a possibility of mission drift’. The above finding is supported by the fact that one of the criteria for membership of the programme is to own a business which has been in existence for not less than six months. This criterion disqualifies the

majority of the poor, who possess neither the entrepreneurial skills nor the required resources to set up businesses on their own. Consequently, a majority of the poor are denied access to both financial and non-financial services provided by SAT. Thus, the denial of access of this majority of the poor to SAT’s programme stems from its policy of ‘exclusion’ of this group of people.
Due to the fact that most micro loans are uncollateralized, MFIs have found that loan default quickly turns into uncontrollable epidemic unless they keep it at very low levels. Since new micro business start-ups are risky, MFIs have found, with few exceptions, that they cannot keep default within controllable bounds if they lend to borrowers who are new to micro-enterprise and who do not have other income sources to repay the loans if the new business is not successful (Hashemi, 2006, 2).
It must, however, be noted that this policy seems rational if SAT wants to stay in existence and serve the growing numbers of poor customers in the future. It is even more important for institutions such as SAT, which relies mainly on debt and equity capital for its operations. However, it seems that strictly adhering to this policy means that most of the poorest and vulnerable people will be excluded from the financial services offered by SAT. Another factor that might account for the under-representation of a majority of the very poor from SAT’s programme could be linked to the products and services offered by the organisation. Financial services provided by SAT include micro-loans, savings and insurance products, as well as non-financial services such as business management skills and other forms of training. However, what the majority of very poor people desperately require is social protection schemes, such as food, grants or guaranteed employment, before they are in a position to make good use of loans and make some savings, or graduate into microfinance programmes, such as that of SAT (Sharif, 1997; Hashemi, 2006). So far, no microfinance institution in Ghana is providing such products and services, so the majority of the poorest will continue to be denied access to financial services for a very long time, unless social protection schemes, such as the Livelihood Empowerment Against Poverty (LEAP) social grant scheme and the National Youth and Employment Programme (NYEP), are linked to some of these microfinance providers. Again, the factors that determine the location of SAT’s branches might also account for the depth of outreach within its operational areas. Even though SAT sees itself as more rural-focused, almost all its branch offices are located either in the regional or district capitals, which happen to be urban-biased. As a result, most of the clients are concentrated in the urban and peri-urban centres, where poverty levels are relatively lower. The location of branches is further influenced by the presence of market centres, where there are ready markets for the products and services supplied by their clients. It must be emphasised that these market centres are mostly located in places where the poverty levels are low compared to the villages and towns that feed them. This finding is consistent with studies which show that the majority of poor people live in rural areas of developing countries (World Bank, 2000).
The arguments put forward by researchers, including Von Pischke (1995) and Sharif (1997), that microfinance institutions seeking sustainability objectives are inclined to focus on a wealthier clientele – to guarantee full repayment of costlier credit services by virtue of the full-cost pricing policies – is quite consistent with the operations of SAT. As noted earlier in this paper, SAT’s operations have been financially sustainable over the past years, and this sustainability objective might cause it to focus on

borrowers who will repay their loans. The financial sustainability objective could cause a shift from providing small loans to very poor households to the less poor in its operational areas.
The findings of this study are also consistent with the works of other researchers in most developing countries (Hulme, 1999, 2000; CGAP, 2004). Using the same poverty assessment tool for Kenya Women’s Finance Trust (KWFT) clients, it was found that microfinance institutions coverage is skewed towards the better off. The proportion of their clients in the poorest tercile (i.e. 33 percent by national standards) is approximately 16 percent. In the middle less-poor tercile it is approximately 33 percent, with some 51 percent of their clientele in the better-off tercile (CGAP, 2004). Hulme (1997; 1999) also argues that microfinance institutions virtually never work with the poorest people – i.e., people with mental and physical disabilities, elderly people, street children, destitute people and refugees – and many microfinance institutions have a high proportion of clients who are non-poor, if one takes the official national poverty line as the criterion. Clients of most MFIs tend to be clustered around the poverty line, being predominantly ‘moderate poor’ (top 50th percentile of households below the poverty line) or vulnerable non-poor (households above the poverty line but vulnerable to slipping back into poverty). Finally, since the SAT programme extends micro-loans to individuals through groups whose members co-guarantee such loans, the groups tend to select individuals who they believe will be able to repay their respective loans on a timely basis. This group selection procedure is likely to work against individuals from households with extremely low levels of income or no regular source of income. This exclusion policy on the part of the various groups could account for the above situation, whereby SAT tends to provide financial services to the relatively well-to-do individuals in its operational area (Montgomery and Weiss, 2005). It must, however, be noted that the clients of SAT are not among the wealthy in its operational areas, based on the fact that none of the clients interviewed owned either a washing machine or car, which are examples of typical assets owned by the wealthy in the various communities. In fact, some of the clients do not even possess household durables like sewing machines, television and refrigerators, which goes to confirm that they are among the poor in their various communities, even though they are relatively better off than most other people in terms of their poverty levels.
Conclusion
Whilst it is clear that there are intrinsic biases in the poverty assessment tool, because of its focus on relative poverty and the choice of expenditure on clothing and footwear as the core poverty indicator, the tool is nevertheless a good indicator within that constraint. The poverty assessment tool used for the analysis of the depth of outreach of SAT in its operational areas relies on varied poverty indicators, reflecting the multi-dimensional nature of poverty. It also offers an objective method for summarising the overall poverty information of each household and unambiguously ranking these households by their relative poverty levels. Even though the method adopted for the analysis does not provide information on the absolute level of poverty of the two groups of respondents, it must be noted that, in most cases, it is the relative, rather than the absolute, poverty that is of concern to policymakers and researchers. The findings of the study confirm the assertion that the poor are not a homogenous group of people. Thus, poor people can be categorised on the basis of the severity of their poverty into, for instance, less poor, moderately poor and very poor. The analyses indicate that, in general, the SAT microfinance

programme targets a disproportionately smaller number of the very poor in its operational areas. These results are informed by the mission and objectives of the organisation, the products and services it offers, as well as its policy of branch placement. As argued by Opoku (2005 cited in Brody et al, 2005, 119) in a similar study of SAT’s microfinance programme, ‘it is important to stress that there were some indications of mission drift to better-off clients. … [It is] recommended that SAT develops a monitoring system to assess more accurately the poverty levels of its clients’.
References Adjei, J. K., Arun, T. G. and Hossain, F. (2009). ‘The role of microfinance in asset-building and poverty reduction’, BWPI Working Paper Series, Brooks World Poverty Institute, University of Manchester, forthcoming.
Arun, T., Imai, K., and Sinha, F. (2006). ‘Does microfinance reduce poverty in India? Propensity score matching based on a national-level household data’. Development Economics and Public Policy Working Paper Series No. 17, IDPM, University of Manchester. Brody, A., Greeley, M and Wright-Revelledo, K. (2005). Money with a Mission, Volume 2: Managing the Social Performance of Microfinance. Rugby, UK: ITDG Publishing. Buckley, G. (1997). ‘Microfinance in Africa: Is it either the problem or the solution?’. World Development, 25(7), 1081-1091. Buss, T. F. (2005). ‘Microcredit in Sub-Saharan Africa: A symposium’, Journal of Microfinance, 7(1), 1-6. Consultative Group to Assist the Poor (CGAP) (2004). ‘Building inclusive financial systems. Donor guidelines in good practice in microfinance’. Washington, DC: CGAP. Copestake, J., Greeley, M., Johnson, S., Kabeer, N. and Simanowitz, A. (2005). Money with a Mission, Volume 1: Microfinance and Poverty Reduction. Rugby, UK: ITDG Publishing. Daley-Harris, S. (2007). The State of the Microcredit Summit Campaign Report 2007. Washington, DC: The Microcredit Summit Campaign. Available online: http://www.microcreditsummit.org/pubs/reports/socr/EngSOCR2007.pdf (accessed 12 May, 2008). Datta, D. (2004). ‘Microcredit in rural Bangladesh: Is it reaching the poorest?’. Journal of Microfinance, 6(1), 55-81. Ghana Microfinance Network (GHAMFIN) (2006). Performance Benchmarks of Microfinance Institutions in Ghana. Accra, Ghana: GHAMFIN. Ghana Microfinance Network (GHAMFIN) (2007). Microfinance Poverty Outreach and Performance Assessment: A Study of Rural Microfinance Institutions and Government Programmes in Ghana. Accra, Ghana: GHAMFIN. Ghana Statistical Service (GSS) (2007). Patterns and Trends of Poverty in Ghana, 1991-2006. Accra, Ghana: GSS. Gulli, H. (1998). Microfinance and Poverty: Questioning the Conventional Wisdom. The Inter-American Development Bank. Washington DC. Hashemi, S. M. (2001). ‘Linking microfinance and safety nets programs to include the poorest: The case of IGVGD in Bangladesh’. CGAP Focus Note 21. Hashemi, S. M. (2006). ‘Graduating the poorest into microfinance: Linking safety nets and financial services: Does microfinance reach the poor?’. CGAP Focus Note 34.

Henry, C., Sharma, M., Lapenu, C. and Zeller, M. (2003). Microfinance Poverty Assessment Tool, Technical Tools Series 5. Washington, DC: IFPRI/CGAP/World Bank. Available online: http://www.cgap.org/publications/other (accessed 12 December, 2005). Hickson, R. (2001). ’Financial services for the very poor – Thinking outside the box’. Small Enterprise Development, 12(2), 55-67. Hulme, D. (1997). ‘Finance for the poor or poorest? Financial innovation, poverty and vulnerability’. In Wood, G. and Sharif, I. (Eds.), Who Needs Credit? Poverty and Finance in Bangladesh. Dhaka: University Press. Hulme, D. (1999). ‘Client exits (drop-outs) from East African microfinance institutions’. Kampala: MicroSave. Hulme, D. (2000). ‘Is microcredit good for poor people? A note on the dark side of microfinance’. Small Enterprise Development, 11(1), 26-28. Hulme, D and Mosley, P. (1996). Finance against Poverty, Volumes I and II. London: Routledge. Johnson, S. and Rogaly, B. (1997). Microfinance and Poverty Reduction. Oxford: Oxfam Publications. Lafourcade, A. J., Isern, P., Mwangi, P. and Brown, M. (2005). ‘Overview of outreach and financial performance of microfinance institutions in Africa’. Microfinance Information eXchange (MIX), CGAP. Available online at www.mixmarket.org (accessed 18 March, 2006). Martin, I. and Hulme, D. (2003). ‘Programmes for the poorest: Learning from the IGVGD programmes in Bangladesh’. World Development, 31(3), 647-665. Mayoux, L. (1999). ‘Collective strategies reconsidered: Social capital, women’s empowerment and sustainability in West African micro-finance programs’. Paper presented at DSA Conference on NGOs in Global Future, Birmingham, UK, and ICA Women’s Committee Conference, Paris. Microcredit Summit (2003). ‘State of the Microcredit Summit campaign report 2002’. Available online at: www.microcreditsummit.org/pubs/reports/socr02_en.pdf (accessed 25 July 2007). Montgomerry, R. (1996). ‘Disciplining or protecting the poor?: Avoiding the social costs of peer pressure in micro-credit schemes’. Journal of International Development, 8(2), 289-305. Montgomerry, R. and Weiss, J. (2005). ‘Great expectations: Microfinance and poverty reduction in Asia and Latin America’. ADBI Research Paper Series, 63.Tokyo, Japan: ADBI Publishing., Morduch, J. (1999). ‘Does microfinance really help the poor? New evidence from flagship programs in Bangladesh’. Princeton, NJ: Princeton University, mimeo. Morduch, J. (2006). ‘Smart subsidies’. ESR Review, 8(1), 10-16. Mosley, P. and Hulme, D. (1998). ‘Micro-enterprise finance: Is there a conflict between growth and poverty alleviation?’. World Development, 26(5), 783-790. Navajas, S. M., Schreiner, R., Gonzalez-Vega, C. and Rodriguez-Meza, J. (2000). ‘Microcredit and the poorest of the poor: Theory and evidence from Bolivia. World Development, 28(2), 333-346. Opoku, L. (2005). ‘Achieving the double bottom line : A case study of Sinapi Aba Trust client impact monitoring system, Ghana’. In Brody, A., Greeley, M. and Wright-Revolledo (Eds.), Money with a Mission: Managing the Social Performance of Microfinance. Rugby, UK: ITDG Publishing.
Planet Rating (2007). ‘Sinapi Aba Trust, Ghana’. Available online: www.planetrating.com (accessed 23 November 2007). Sharif, I. (1997). ‘Poverty and finance in Bangladesh: A new policy agenda’. In Wood, G. and Sharif, I. (Eds.), Who Needs Credit? Poverty and Finance in Bangladesh. Dhaka: The University Press. Sinapi Aba Trust (SAT) Corporate webpage. Available online: http://www.sinapiaba.com (accessed 12 November 2005, 16 October 2007 and 15 July 2008). United Nations (1997). Role of Microcredit in the Eradication of Poverty: Report of the Secretary-General. New York: United Nations. Von Pischke, J. D. (1995). ‘Managing the trade-off between outreach and sustainability by measuring the financial performance of micro-enterprise lenders’. Paper prepared for conference on Finance Against Poverty: Challenges and Advance in Banking with the Poor, University of Reading, UK, 27-28 March. World Bank (2000). World Development Report 2000/2001: Attacking Poverty, New York: Oxford University Press. Wright, G. (2001). ‘Dropouts and graduates: Lessons from Bangladesh’. Microbanking Bulletin 6, 14-16. Yunus, M. (2001). Banker to the Poor: The Autobiography of Muhammad Yunus, Founder of Grameen Bank. New York: Oxford University Press. Zaman, H. (1998). ‘Who benefits and to what extent? An evaluation of BRAC’s micro-credit program’. University of Sussex, UK, DPhil Thesis. Zeller, M. and Meyer, R. L. (2002). The Triangle of Microfinance: Financial Sustainability, Outreach and Impact. Baltimore, MD: John Hopkins University Press for IFPRI. Zeller, M., Sharma, M., Henry, C. and Lapenu, C. (2002). ‘An operational tool for evaluating poverty outreach of development policies and projects’. In Zeller, M. and Meyer, R.L. (Eds.). The Triangle of Microfinance: Financial Sustainability, Outreach and Impact. Baltimore, MD: John Hopkins University Press.

The Brooks World Poverty Institute (BWPI) creates and shares knowledge to help end global poverty. BWPI is multidisciplinary, researching poverty in both the rich and poor worlds. Our aim is to better understand why people are poor, what keeps them trapped in poverty and how they can be helped - drawing upon the very best international practice in research and policy making. The Brooks World Poverty Institute is chaired by Nobel Laureate, Professor Joseph E. Stiglitz.
Executive Director Professor Tony Addison Research Director Professor Michael Woolcock Associate Director Professor David Hulme Contact: Brooks World Poverty Institute The University of Manchester Humanities Bridgeford Street Building Oxford Road Manchester M13 9PL United Kingdom Email: [email protected] www.manchster.ac.uk/bwpi
www.manchester.ac.uk/bwpi