microcrystalline testing used in combination with raman...
TRANSCRIPT

1
Microcrystalline testing used in combination with Raman micro-spectroscopy for absolute identification of novel psychoactive substances Leonie Elie1*, Mathieu Elie1, Gareth Cave2, Marleen Vetter1, Ruth Croxton1, Mark Baron1 1School of Chemistry, University of Lincoln, Brayford Pool, Lincoln, LN6 7TS, UK., E-mail: [email protected]; Phone: (+44) 1522 886855; Fax: (+44) 1522 886842 2 School of Science & Technology, Nottingham Trent University, Clifton Lane, Nottingham, NG11 8NS *Corresponding author ABSTRACT Two new psychoactive substances, namely 4-methylmethcathinone (mephedrone) and 5,6-methylenedioxy-2-aminoindane (MDAI) were analysed with a novel combination of microcrystalline tests followed by Raman micro-spectroscopy to facilitate their absolute identification. The discrimination power of the proposed combination was successfully demonstrated through the analysis of the positional isomers 2- and 3-methylmethcathinone. The addition of mercury dichloride as a microcrystalline test reagent produced specific microcrystals of each tested analyte. The robustness of the method was evaluated in the presence of common cutting agents (caffeine and benzocaine) as well as on street samples. The crystal lattice structures of mephedrone, 2-methylmethcathinone and MDAI mercury dichloride microcrystals were determined by single crystal X-ray diffraction. This confirmed the presence of both drug and reagent together in the lattice and accounts for the distinct habit of the observed microcrystals. Raman spectra of the formed microcrystals differed from those obtained from their standard salt form by loss and/or gain of some vibrational modes. Particularly important was the appearance of the mercury chloride link to each tested drug molecule which showed as strong bands at low wavenumbers. Its presence was corroborated by its detection in the crystal lattice. It was therefore concluded that microcrystalline testing followed by Raman micro-spectroscopy satisfies the technique combination requirement for psychoactive substances recommended by the Scientific Working Group for the Analysis of Seized Drugs (SWGDRUG) and provides a rapid and cheap analysis route. The proposed technique combination also aids the development of new microcrystalline tests as it allows for confirmation of the uniqueness of the developed microcrystals almost in-situ rather than growing single crystals for often long periods of time needed for single crystal X-ray diffraction analysis.

2
KEYWORDS Raman micro-spectroscopy, Microcrystalline test, Forensic Science, New Psychoactive Substances

3
INTRODUCTION Microcrystalline testing in forensic drug analysis is a rapid and cheap micro-chemical confirmation method for the identification of psychoactive substances. Microcrystals are crystals which develop to a size between 1 and 1000 µm, and are formed between a substance (e.g. a drug of abuse) and a suitable reagent (e.g. transition metal ions). Compounds are usually dissolved in water and crystals develop by solvent evaporation or direct precipitation[1]. The habit of the formed microcrystals obtained from an unknown sample is compared to that of microcrystals produced with reference standards. Microcrystals in forensic drug analysis can be classed as addition products or mixed crystals as both sample and reagent are responsible for the crystal development[2]. The Scientific Working Group for the analysis of seized drugs (SWGDRUG) categorises analytical techniques according to their maximum potential discriminating power from A to C. Category A holds the highest discrimination power and includes amongst others mass spectrometry (MS) and vibrational spectroscopy, while category C holds the lowest with techniques such as colour tests and UV/FL spectroscopy[3]. The working group has positioned microcrystalline tests into category B alongside chromatography techniques meaning that they hold a certain discriminating power but do not provide structural information and thus must be used in conjunction with another, ideally more powerful technique such as those from category A to achieve unequivocal identification. Widely available vibrational spectroscopy techniques such as Fourier transform infrared (FTIR) or Raman spectroscopy are popular category A choices for drug samples in solid and liquid form, and have been proven useful in the discrimination of substituted cathinone isomers and other psychoactive substances[4–7]. It is of advantage for drug analysis that Raman spectroscopy can be used in the presence of water and that it can be interfaced with microscopy. Especially noteworthy is the use of surface enhanced Raman scattering (SERS) which was demonstrated to give reliable qualitative and quantitative results when psychoactive substances were analysed [8–10]. Street drugs are often cut with diluents, for example legal high samples purchased online or in head shops are often cut with caffeine or benzocaine[11]. These cutting agents can make identification difficult using spectroscopy techniques such as FTIR or Raman spectroscopy if no separation of the ingredients has been done beforehand, much so that SWGDRUG downgrades vibrational spectroscopy from category A to B if used on mixtures[3]. In the combined spectra obtained identification features can be obscured and therefore a separation of analytes is required beforehand to achieve absolute identification[12]. Favoured separation techniques are gas and liquid chromatography (GC and LC) which are typically hyphenated with MS[11,13–16]. However, the hyphenation of chromatography techniques with non-mass spectral detectors has been successfully investigated over the last years. GC with infrared spectroscopy (GC-IRD) has recently been used to analyse novel psychoactive substances and enabled differentiation between regioisomers of

4
methamphetamine, piperazines, phenethylamines and cathinones[17–22]. Furthermore, electrochemistry techniques offer a rapid yet very selective alternative for the detection of psychoactive substances and have been proven particularly useful in the analysis of novel psychoactive substances, either using electrochemical sensors on their own or paired with chromatography[23–27]. Purification methods such as liquid-liquid (LLE) and solid phase extraction (SPE) are performed prior to analysis and constitute a semi-specific separation process. Crystallisation is a liquid-solid extraction (LSE) which is commonly used by organic chemists to purify synthesised substances in order to remove undesired precursors, by-products or other impurities. Microcrystalline testing of psychoactive substances therefore qualifies as a type of extraction technique. Although more sophisticated instrumental techniques are available, microcrystalline testing remains to play an important role in forensic drug analysis, for example in the recently published compendium by the McCrone Research Institute, USA which received Government funding to update and modernise existing tests[28]. The use of the technique is also supported by the United Nations Office on Drugs and Crime (UNODC) who added microcrystalline tests as part of their recommended methods for analysis of a variety of compounds (e.g. cathinones, piperazines, amphetamines and cocaine), as does the American Society for Testing and Materials (ASTM) for Forensic Science who regularly publishes guidelines for forensic scientists including standard procedures on carrying out microcrystalline tests[29–35]. With the emergence of novel psychoactive substances the search for discriminatory techniques which can distinguish between a variety of naturally and synthetically produced isomers, microcrystalline testing offers a valuable alternative analytical technique[36]. The presented methodology of microcrystalline tests followed by Raman micro-spectroscopy is a proof-of principle investigation into the discrimination power of microcrystalline tests for the analysis of NPS and their isomers as well as cutting agents present in mixtures. This constitutes a novel strategy in drug analysis using microcrystalline tests as both identification tests and extraction tool. Single crystal X-ray diffraction (SC-XRD), a SWGDRUG category A technique, was chosen as the validation method as it has the power to detect molecules and their arrangement within a crystal lattice. Historically, microcrystalline tests have been developed without any conclusive evidence that the drug molecule was incorporated into the crystal lattice, however more recently it has been the customary way of establishing that microcrystals are forming out of a mix of drug and reagent solution, and indeed contain the drug molecule combined with the microcrystalline test reagent proving that the drug molecule as a whole is responsible for the interpretable result of the test, unlike solely targeted moieties as can be seen in colour tests[37–
40]. Indeed, the combination of several reagents in flow-chart analysis style can lead to the identification of groups of compounds as the technique often only relates to a functional group rather than being specific for individual molecules[41–45].

5
This study utilises a series of compounds, namely 4-methylmethcathinone (“mephedrone”) and its positional isomers 2- and 3-methylmethcathinone as well as 5,6-methylenedioxyaminoindane (“MDAI”). Mephedrone and MDAI have been found in ‘legal high’ products in the last years[46]. Mephedrone is a cathinone derivative with effects similar to stimulants such as cocaine and amphetamine[47]. It was controlled in the UK in 2010 under the Misuse of Drugs Act 1971 (S.I. 2010/1207). MDAI was discovered in the 1990’s by the Nichols group and is said to mimic the psychoactive behaviour of 3,4-methylenedioxymethamphetamine (MDMA) and is currently not scheduled in the UK[48,49]. The proposed methodology was applied to both pure drug standards and model mixtures with common cutting agents as well as ‘legal high’ products in order to evaluate its robustness and to validate the combination of microcrystalline testing with Raman micro-spectroscopy for absolute identification of NPS. EXPERIMENTAL Chemicals Mephedrone (4-methylmethcathinone; 4-MMC) and mercury dichloride were purchased from Sigma-Aldrich (Gillingham, UK); 2-methylmethcathinone (2-MMC), 3-methylmethcathinone (3-MMC), and 5,6-methylenedioxy-2-aminoindane freebase (MDAI) were from LGC Standards (Teddington, UK). Hydrochloric acid (≈ 37%, analytical reagent grade) was purchased from Fisher (Loughborough, UK). All water used was deionised to > 15 MΩ resistance. Between November 2010 and April 2012 eight samples of MDAI products were purchased online from various vendors. One sample containing mephedrone was purchased online in March 2010; another sample was submitted anonymously to the University of Lincoln analytical laboratories in summer 2012. Preparation of microcrystalline tests on slides Microcrystalline tests were carried out on standard microscope glass slides (Fisher) and used as obtained. 5 µL of each drug and reagent solution (10 g L-1 H2O) were mixed directly on the slides and crystallisation was systematically encouraged by moving a pipette tip gently around the drop for a few seconds. Crystal development was observed under low and high magnifications using calibrated transmitted light microscopy set for Koehler illumination at 400x overall magnification. Images were captured using a Canon EOS Rebel T2i digital SLR camera fitted with a Meiji Techno adapter ring, camera attachment and 1.9x magnification photo-eye piece. All experiments were carried out under standard laboratory conditions of temperature, pressure and humidity without any variation in microcrystal development.

6
Raman analysis Raman analysis was performed on a Horiba Jobin Yvon LabRAM 300 with a 300 mm focal length spectrometer, equipped with a BX41 confocal microscope attachment from Olympus and fitted with a green laser at 532 nm from Laser Quantum. The 50x objective was used for all spectroscopy analysis. The laser power was measured with a handheld LaserCheck from Coherent (Dieburg, Germany). Settings such as scan range, laser power (10.4 to 0.001 mW), hole (300 µm), slit (100 µm) and exposure time were optimised for each microcrystal type. Raw data was made up of spectra recorded in two cycles; a minimum of three replicate spectra (raw data) were recorded for each substance. All spectra were processed using the LabRAM associated LabSPEC software (Version 5.64.15, 2008) by performing baseline correction and normalisation. Raman group wavenumbers were assigned using text book literature[50]. Preparation of microcrystals for SC-XRD Mephedrone microcrystals were grown by mixing 100 µL of aqueous solutions of 10 g L-1 of each mephedrone and mercury dichloride in a round glass cuvette (X Systems from Abbott Laboratories Wiesbaden, Germany) which was then covered with parafilm and pierced once with a needle to avoid dust contamination but allow slow evaporation. Cuvettes were stored away from vibrations in order to not disturb the crystal formation. Crystals were large enough to harvest after approx. 7 days with a length of approx. 1 mm. Crystals developed in complex paddle wheel structures which were separated using Hampton Research micro tools (California, USA). Microcrystals of 2-MMC were grown by depositing 10 µL of aqueous solutions (10 g L-1) of drug and mercury dichloride on a slide. Nucleation was assisted by gently mixing the content of the drops with a pipette tip. Crystals ready for harvesting developed after approx. 15 min. MDAI crystals were grown by filling a 0.6 mm ID flat capillary tube of approx. 10 mm length (VitroCom, CM Scientific, Shipley, UK) with 50 µL of aqueous solutions (10 g L-1) of MDAI hydrochloride and mercury dichloride. MDAI hydrochloride was prepared from the LGC freebase standard by adding 10 µL of concentrated hydrochloric acid to 1 mL of water with 10 mg suspended MDAI freebase; the suspension was vortexed until dissolved (≈ 10 s). Nucleation to form crystals was assisted by inserting a nickel chromium wire (Consolidated Electronic Wire & Cable, www.conwire.com) into the tube and gently moving it around. Microcrystals of approx. 100 µm in diameter formed within one hour. Crystals were harvested by observing the tube under a Meiji ML 5000 microscope (Axbridge, UK) at low magnification. The tube was opened with a diamond pen and suitable crystals were transferred onto a glass slide using micro tools.
7
All single crystals were pushed into silicon oil (Fisher, UK) and mounted onto a nylon CryoLoop of 20 µm diameter (Hampton Research) for analysis by SC-XRD on an Agilent Technologies, Xcalibur, Sapphire3 equipped with a fine-focus sealed molybdenum X-ray tube and Oxford Cryostream. The structure was solved and refined using the programs SHELXS-97 (Sheldrick, 1990) and SHELXL-97 (Sheldrick, 1997) respectively. The program X-Seed (Barbour, 1999) was used as an interface to the SHELX programs. As crystals for single crystal XRD were grown considerably fast to represent best those obtained from microcrystalline tests in the field they were small and undergrown which resulted in poor X-ray diffraction. RESULTS AND DISCUSSION Microcrystalline tests for the detection of both mephedrone (4-MMC) and MDAI have been developed by Elie et al. using mercury dichloride as reagent[46]. Mephedrone forms paddle-wheel clusters of square-cut blades while MDAI hydrochloride produces trapezoidal blades (Figure 1 and 2); both microcrystalline tests develop within a few minutes. Microcrystals formed for 2-MMC as flat blades and rods, sometimes as smaller clusters of serrated plates with varying angles and thickness from the edge of the drop after 15 minutes and 3-MMC produced amorphous crystalline material originating from a point at the solvent front after approx. 20 minutes (Figure 1). Subsequently, microcrystalline tests can be used to distinguish between the positional isomers 2-, 3- and 4-MMC although absolute identification can currently only be achieved for the latter. To the best of the authors’ knowledge the distinction of MMC positional isomers by microcrystalline test has not been reported previously. Microcrystals and salt crystals of reference substances behaved differently upon exposure to the 532 nm laser. Microcrystals did not withstand laser intensities larger than 1.01 mW for the duration of an analysis of 20 s for MDAI and 60 s for mephedrone, respectively, whereas the reference material did not exhibit any changes. Upon impact of the green laser, microcrystalline structure was locally destroyed which inhibited the amplification of Raman scattering. Subsequently, the range for analysis was chosen to be between 200 and 1800 cm-1 in order to minimise laser exposure of the fragile microcrystals by focussing on the fingerprint region only. The measurement range for MDAI crystals was further limited to 200- 1690 cm-1 as it meant that the spectrometer of the dispersive Raman did not need repositioning during the analysis thus significantly decreasing the run time and therefore preserving the integrity of the microcrystals during analysis.

8
The Raman spectra of each methylmethcathinone isomer and its respective mercury dichloride microcrystal displayed band shifts and intensity differences caused by the coupling of vibrations of neighbouring molecules in the newly formed crystal lattices compared to the standard salts (Figure 1)[51,52]. The solid state mephedrone microcrystal determined by SC-XRD has a monoclinic C 2/c space group which consists of a (Hg2Cl4) unit with four mephedrone molecules associated via short contacts between one amino group and two chlorides (Fig S1i). These units are arranged in translational symmetry along the c-axis. The metal-halide chains form a reagent framework which is interlaced with mephedrone molecules. It is assumed that the framework expands along the c-axis more rapidly while assembly along a- and b-axes are less favoured due to the sterical hindrance of protruding mephedrone molecules. This expansion could subsequently result in the observed rectangular plate [4-MMC HgCl2] microcrystals. In comparison the crystal lattice of [2-MMC HgCl2] has a triclinic P-1 space group. However, similar to [4-MMC HgCl2] it also presents two cathinone-derivative molecules linked via short contacts to mercury dichloride units in the centre of the unit cell and short contacts are established between amino groups and chlorides (Fig S1ii). Mercury dichloride forms a parallel frame along the c-axis enclosing 2-MMC molecules with phenyl groups facing towards the centre and away from the polar mercury chloride frame thus strengthening the crystal structure by π-π stacking in parallel-displaced configuration. The incorporation of mercury reagent and drug molecule into one crystal lattice was corroborated by the observation of strong vibrational modes in the lower wavenumber region of 200-300 cm-1 indicating the presence of a mercury dichloride network in the formed crystals. Wavenumber shifts of the secondary aliphatic amine wagging vibrations in the region of 750-710 cm-1 were observed when 2-MMC and 3-MMC were crystallised with mercury dichloride. This band appears to have shifted to higher wavenumbers in the 4-MMC material. Bands around 840-850 cm-1 which could only be seen in 2-MMC and [2-MMC HgCl2] were assigned to disubstituted benzene ring out-of-plane deformation vibrations. Aromatic =C-H in-plane deformation vibrations between 1050-1200 cm-1 remained largely unchanged for all species. Furthermore, the addition of metal reagent in the crystal lattice induced intensity changes of the -C=C- aromatic in-plane deformation vibrations between the cathinone isomers and their respective microcrystals. Shifts to lower wavenumbers of the α,β-unsaturated keto-group were observed in the case of 2-MMC and 3-MMC and their microcrystals but remained unchanged in 4-MMC and [4-MMC HgCl2]. The morphology of crystals formed between 3-MMC and mercury dichloride [3-MMC HgCl2] did not allow analysis by SC-XRD. However, the presence of the mercury chloride band in the Raman spectra allowed concluding that a similar network of reagent interlinked with 3-MMC molecules is present in the obtained crystalline material.

9
The MDAI standard was converted from the commercially available freebase to the hydrochloride salt (HCl) as street samples were found to solely contain the hydrochloride salt variety[46]. The MDAI freebase standard produces different microcrystals to the hydrochloride salt by forming flat serrated blades of varying dimensions while the salt developed into trapezoidal blades which were overall smoother on the surface but smaller than the freebase crystals[46]. Controls of the MDAI HCl salt were compared to microcrystals obtained with the mercury dichloride reagent and MDAI salt (Figure 2). The MDAI base lattice determined by SC-XRD has a primitive centrosymmetric orthorhombic Pnma space group which consists of one MDAI molecule, and one mercury cation surrounded by three chloride anions in the form of (HgCl3)- (Fig S2). The approximately planar MDAI molecule is positioned at an angle away from mercury dichloride but its functional amino group which is hinged out of plane is cradled between three chloride atoms of two transversely situated (HgCl3)- units. Mercury dichloride forms a straight chain of bonded (HgCl3)- units along which the MDAI molecules arrange themselves. The units of two MDAI molecules associated to (HgCl3)- are packed in translational symmetry along the c-axis forming a mercury dichloride spine. The MDAI-Hg-MDAI unit then stacks in twofold rotation along the b-axis. The fastest growth is assumed to be along the c-axis where strong bonded mercury dichloride chains develop with MDAI molecules assembling alongside it. The b- and a-axes may determine width and depth of the microcrystals with slower packing of MDAI molecules next to each other potentially resulting in the observed blades. Generally, Raman bands in the [MDAI HgCl2] spectra appeared more pronounced than those in the MDAI HCl spectra (Figure 2). The presence of mercury dichloride in the crystal lattice was characterised by a broad band at around 250 cm-1. The band at 714 cm-1 in the MDAI salt spectrum was assigned to -C=C- cis-di-substituted alkene deformation vibrations. Coupling of vibrations caused this band to split into a triplet with bands at 667 cm-1, 699 cm-1 and 724 cm-1
in the [MDAI HgCl2] microcrystals. Amine deformation vibrations caused a band at 780 cm-1 in the MDAI salt while the corresponding band in the [MDAI HgCl2] microcrystals shifted to 799 cm-1. A single band at 861 cm-1 in the MDAI salt due to –C-O-C- aliphatic ether symmetric stretching vibrations and tetra-substituted aromatic ring vibrations appeared as a doublet in the microcrystal spectra with bands at 837 cm-1 and 860 cm-1, respectively. Between 1100 and 1400 cm-1 bands caused by –C-O-C- and =C-O-C- ether symmetric and asymmetric stretching vibrations as well as methoxy C-O stretching vibrations appeared in both salt and microcrystal species, however significant differences in intensity were observed: some weak or nearly absent in the MDAI salt spectra yet strong in the [MDAI HgCl2] microcrystal spectra. The intensity differences were more prominent in repeats of analysed microcrystals yet

10
not consistent allowing to conclude that relative crystal orientation on the slide to be the cause of this phenomenon[52]. MDAI microcrystals formed with mercury dichloride do not have hydrogen bonds between metal reagent and drug molecule. The arrangement of drug-originating hydrogen-bond donor amine groups towards a mercury dichloride reagent spine is based on van-der-Waal’s forces which are thermodynamically more favourable than interactions between the parent molecules, hence allowing the rapid growth of microcrystals rather than a single substance re-crystallisation from the solvent[53,54]. However, mephedrone contacts between amino group and chloride anion had comparable bond lengths to those reported by Steiner on primary ammonium donor groups with chloride anion acceptors indicating that hydrogen bonding is linking the metal framework within the microcrystal[55]. To demonstrate the power of the combination of techniques test mixtures of solid NPS and cutting agent were prepared in ratios of 1:3; 1:1 and 3:1 and subsequently analysed using microcrystalline test and Raman micro-spectroscopy. As well as MDAI and mephedrone, caffeine also crystallises readily with mercury dichloride by forming long needles which usually appear at the edge of the drop[1,46]. Benzocaine does not form distinct crystals with mercury dichloride but can precipitate as amorphous solid (Figure 3). All tested model mixtures developed microcrystals of the respective NPS. All mixtures containing caffeine produced the related microcrystals of needles; however, in some cases the caffeine needles appeared distorted by the presence of MDAI[46]. When mephedrone was present, caffeine needles always developed after the mephedrone crystals which were at that point in time partly consumed and developed broken edges and irregular surfaces. This affected the quality of Raman spectra by creating drifting and noisier baselines. However, this did not affect the identification of mephedrone from the spectra since effects of these physical phenomena were greatly reduced by applying baseline correction. Altogether, the Raman spectra of NPS microcrystals were not changed by the presence of a cutting agent, neither when present as another microcrystal (e.g. caffeine) nor dissolved seemingly un-associated in the solvent (e.g. benzocaine). The similarity of Raman spectra between pure standards as well as those mixed with adulterants can be seen in Figure 3. Raman spectra obtained from microcrystals developing alongside the precipitate of benzocaine and mercury dichloride are not shown as they did not differ from those present in this paper. Finally, eight internet purchased MDAI products and two legal high samples containing mephedrone were analysed using the microcrystalline test/ Raman micro-spectroscopy combination. All MDAI products produced trapezoidal blades confirming the presence of the MDAI hydrochloride salt. Mephedrone-reagent microcrystals developed as expected with identical habit to that exhibited by the standard. Raman spectra of microcrystals obtained from

11
“legal high” products matched those obtained from standards without any shifts or other band changes. CONCLUSION Two microcrystalline tests were investigated in order to validate that the combination of microcrystalline testing followed by Raman micro-spectroscopy hold the power for unequivocal identification of NPS. The development of microcrystals represents an extraction of active ingredients by forming specific and unique crystals for each compound. The crystal lattice structures of both MDAI and mephedrone microcrystals as well as crystals formed between the structural isomer 2-MMC and mercury dichloride were solved using single crystal X-ray diffraction. All NPS molecules were found in their respective microcrystal confirming that the drug molecule as a whole is responsible for the formation of a specific microcrystal. It also confirms that microcrystalline testing is a solid identification method as it produces specific crystals containing exclusively drug and reagent proving the uniqueness of the crystal habit under set conditions, and that a separation of the analyte from the matrix took place. Finally, it confirms that the specific use of the mercury dichloride reagent enables rapid, cheap and definite discrimination between 2-, 3- and 4-MMC. Although the lattice structures of crystals formed between 3-MMC and mercury dichloride could not be determined the presence of the metal-chloride band in associated Raman spectra, it still allows to conclude that the reagent was incorporated in the crystal lattice which in turn strengthens the argument for habit comparison of microcrystalline testing given that the observed crystals varied greatly in habit for the analysed cathinone isomers. Subsequently, the incorporation of metal reagent as well as presence of the psychoactive analyte can be easily proven via Raman micro-spectroscopy. The combination of microcrystalline testing and Raman micro-spectroscopy therefore presents a robust analytical strategy for routine analysis which satisfies the requirements set by SWGDRUG of using two independent techniques while being quick and simple to set up. It also potentially removes the issue of SWGDRUG downgrading vibrational spectroscopy from category A to B when used on mixtures as the microcrystalline test acts as an extraction tool for Raman spectroscopy as well as an identification method in its own right. The robustness of the proposed combination of analytical techniques was established by successfully identifying psychoactive compounds in model mixtures and street samples. Raman spectra obtained from microcrystals exhibited some band differences to those of microcrystals formed with the pure salts. This can be seen as a confirmation step for the analysed NPS similar to transformed fragmentation patterns in mass spectrometry when derivatisation of the analyte is carried out. The comparison of pure standard, standard-microcrystal and sample-microcrystal gives a unique set of bands resulting in absolute

12
confirmation of the identification result obtained by microcrystalline testing. Spectra of microcrystals formed from drug standards could subsequently be entered in a database accompanied by images of crystal habits to create a searchable portfolio for routine analysis. ACKNOWLEDGMENT The authors would like to thank the University of Lincoln for supporting the research in forensic drug analysis.

13
Bibliography
[1] C. Fulton. Modern Microcrystalline Tests for Drugs, Wiley, 1969.
[2] M. Elie, L. Elie. Encyclopedia of Analytical Chemistry, John Wiley & Sons, Ltd, Chichester, UK, 2006.
[3] SWGDRUG. Scientific Working Group for the Analysis of Seized Drugs (SWGDRUG) Recommendations, 2016.
[4] J. D. Power, P. McGlynn, K. Clarke, S. D. McDermott, P. Kavanagh, J. O’Brien. The analysis of substituted cathinones. Part 1: Chemical analysis of 2-, 3- and 4-methylmethcathinone. Forensic Sci. Int., 2011, 212, 6–12.
[5] R. Christie, E. Horan, J. Fox, C. O’Donnell, H. J. Byrne, S. McDermott, J. Power, P. Kavanagh. Discrimination of cathinone regioisomers, sold as “legal highs”, by Raman spectroscopy. Drug Test. Anal., 2013, 6, 651–657.
[6] S. Assi, A. Guirguis, S. Halsey, S. Fergus, J. L. Stair. Analytical Methods Analysis of “ legal high ” substances and common adulterants using handheld spectroscopic. Anal. Methods, 2014, 7, 736–746.
[7] L. E. Jones, A. Stewart, K. L. Peters, M. McNaul, S. J. Speers, N. C. Fletcher, S. E. J. Bell. Infrared and Raman screening of seized novel psychoactive substances: a large scale study of >200 samples. Analyst, 2016, 141, 902–909.
[8] S. Mabbott, E. Correa, D. P. Cowcher, J. W. Allwood, R. Goodacre. Optimization of Parameters for the Quantitative Surface-Enhanced Raman Scattering Detection of Mephedrone Using a Fractional Factorial Design and a Portable Raman Spectrometer. Anal. Chem., 2013, 85, 923–931.
[9] S. Mabbott, O. Alharbi, K. Groves, R. Goodacre. Application of surface enhanced Raman scattering to the solution based detection of a popular legal high, 5,6-methylenedioxy-2-aminoindane (MDAI). Analyst, 2015, 140, 4399–4406.
[10] S. Mabbott, A. Eckmann, C. Casiraghi, R. Goodacre. 2p or not 2p: tuppence-based SERS for the detection of illicit materials. Analyst, 2013, 138, 118–22.
[11] M. P. Elie, L. E. Elie, M. G. Baron. Keeping pace with NPS releases: fast GC-MS screening of legal high products. Drug Test. Anal., 2013, 5, 281–90.
[12] M. Baron, M. Elie, L. Elie. An analysis of legal highs: do they contain what it says on the tin? Drug Test. Anal., 2011, 3, 576–81.
[13] C. E. J. Emanuel, B. Ellison, C. E. Banks. Spice up your life: screening the illegal components of “Spice” herbal products. Anal. Methods, 2010, 2, 614–616.
[14] J. Lobo Vicente, H. Chassaigne, M. V. Holland, F. Reniero, K. Kolář, S. Tirendi, I. Vandecasteele, I. Vinckier, C. Guillou. Systematic analytical characterization of new psychoactive substances: A case study. Forensic Sci. Int., 2016, 265, 107–115.
[15] N. Nic Daeid, K. A. Savage, D. Ramsay, C. Holland, O. B. Sutcliffe. Development of gas chromatography-mass spectrometry (GC-MS) and other rapid screening methods for the analysis of 16 “legal high” cathinone derivatives. Sci. Justice, 2014, 54, 22–31.

14
[16] S. Assi, S. Fergus, J. L. Stair. Identification of Novel Psychoactive Substances Using Hyphenated Mass spectrometric Techniques. Curr. Trends Mass Spectrom., 2012.
[17] H. M. Maher, T. Awad, C. R. Clark. Differentiation of the regioisomeric 2-, 3-, and 4-trifluoromethylphenylpiperazines (TFMPP) by GC-IRD and GC-MS. Forensic Sci. Int., 2009, 188, 31–9.
[18] K. M. Abdel-Hay, J. DeRuiter, C. Randall Clark. GC-MS and GC-IRD studies on the six ring regioisomeric dimethoxybenzoylpiperazines (DMBzPs). Forensic Sci. Int., 2013, 231, 54–60.
[19] T. Belal, T. Awad, J. DeRuiter, C. R. Clark. GC-IRD methods for the identification of isomeric ethoxyphenethylamines and methoxymethcathinones. Forensic Sci. Int., 2009, 184, 54–63.
[20] A. M. Al-Hossaini, T. Awad, J. DeRuiter, C. R. Clark. GC-MS and GC-IRD analysis of ring and side chain regioisomers of ethoxyphenethylamines related to the controlled substances MDEA, MDMMA and MBDB. Forensic Sci. Int., 2010, 200, 73–86.
[21] S. Davis, K. Blakey, K. Rands-Trevor. GC-MS and GC-IRD analysis of 2-, 3- and 4-methylmethamphetamine and 2-, 3- and 4-methylamphetamine. Forensic Sci. Int., 2012, 220, 67–73.
[22] T. Awad, T. Belal, J. DeRuiter, K. Kramer, C. R. Clark. Comparison of GC-MS and GC-IRD methods for the differentiation of methamphetamine and regioisomeric substances. Forensic Sci. Int., 2009, 185, 67–77.
[23] J. P. Smith, J. P. Metters, C. Irving, O. B. Sutcliffe, C. E. Banks. Forensic electrochemistry: the electroanalytical sensing of synthetic cathinone-derivatives and their accompanying adulterants in “legal high” products. Analyst, 2014, 139, 389–400.
[24] J. P. Smith, J. P. Metters, O. I. G. Khreit, O. B. Sutcliffe, C. E. Banks. Forensic electrochemistry applied to the sensing of new psychoactive substances: Electroanalytical sensing of synthetic cathinones and analytical validation in the quantification of seized street samples. Anal. Chem., 2014, 86, 9985–9992.
[25] F. Tan, J. P. Smith, O. B. Sutcliffe, C. E. Banks. Regal electrochemistry: sensing of the synthetic cathinone class of new psychoactive substances (NPSs). Anal. Methods, 2015, 7, 6470–6474.
[26] L. R. Cumba, A. V. Kolliopoulos, J. P. Smith, P. D. Thompson, P. R. Evans, O. B. Sutcliffe, D. R. do Carmo, C. E. Banks. Forensic electrochemistry: indirect electrochemical sensing of the components of the new psychoactive substance “Synthacaine.” Analyst, 2015, 5536–5545.
[27] K. Y. Zuway, J. P. Smith, C. W. Foster, N. Kapur, C. E. Banks, O. B. Sutcliffe. Detection and quantification of new psychoactive substances (NPSs) within the evolved “legal high” product, NRG-2, using high performance liquid chromatography-amperometric detection (HPLC-AD). Analyst, 2015, 140, 6283–6294.
[28] K. M. Brinsko, D. Golemis, M. B. King, G. J. Laughlin, D. Ph, S. B. Sparenga. A Modern Compendium of Microcrystal Tests for Illicit Drugs and Diverted Pharmaceuticals,

15
Chicago, USA, 2015.
[29] United Nations Office on Drugs and Crime. Recommended methods for the Identification and Analysis of Synthetic Cathinones in Seized Materials. 2015.
[30] United Nations Office on Drugs and Crime. Recommended methods for the Identification and Analysis of Cocaine in Seized Materials. 2012.
[31] United Nations Office on Drugs and Crime. Recommended methods for the identification and analysis if Amphetamine, Methamphetamine and their ring-substituted analogues in seized materials. 2006.
[32] United Nations Office on Drugs and Crime. Recommended methods for the Identification and Analysis of Piperazines in Seized Materials. 2013.
[33] ASTM International. ASTM E1968 - 01 Standard Guide for Microcrystal Testing in the Forensic Analysis of Cocaine. 2001.
[34] ASTM International. ASTM E1969 - 01 Standard Guide for Microcrystal Testing in the Forensic Analysis of Methamphetamine and Amphetamine. 2001.
[35] ASTM International. ASTM E2125 - 01 Standard Guide for Microcrystal Testing in the Forensic Analysis of Phencyclidine and Its Analogues. 2001.
[36] J. P. Smith, O. B. Sutcli, C. E. Banks. An overview of recent developments in the analytical detection of new psychoactive substances (NPSs). Analyst, 2015, 140, 4932–4948.
[37] M. R. Wood, T. A. Brettell, R. A. Lalancette. The gold(III) tetrachloride salt of L-cocaine. Acta Crystallogr. C., 2007, 63, m33–5.
[38] M. R. Wood, H. W. Thompson, T. A. Brettell, R. A. Lalancette. The hydrated and anhydrous gold(III) tetrachloride salts of L-ecgonine, an important forensic toxicology marker for cocaine. Acta Crystallogr. C., 2010, 66, m4–8.
[39] M. R. Wood, R. A. Lalancette. Understanding the microcrystal tests of three related phenethylamines: the ortho-metallated (±)-amphetamine formed with gold(III) chloride, and the tetrachloridoaurate(III) salts of (+)-methamphetamine and (±)-ephedrine. Acta Crystallogr. C., 2013, 69, 388–93.
[40] M. R. Wood, R. A. Lalancette, I. Bernal. Crystallographic investigations of select cathinones: emerging illicit street drugs known as `bath salts’. Acta Crystallogr. Sect. C Struct. Chem., 2015, 71, 32–38.
[41] C. L. O’Neal, D. J. Crouch, A. a. Fatah. Validation of twelve chemical spot tests for the detection of drugs of abuse. Forensic Sci. Int., 2000, 109, 189–201.
[42] Y. Tsumura, T. Mitome, S. Kimoto. False positives and false negatives with a cocaine-specific field test and modification of test protocol to reduce false decision. Forensic Sci. Int., 2005, 155, 158–164.
[43] A. Choodum, N. N. Daeid. Rapid and semi-quantitative presumptive tests for opiate drugs. Talanta, 2011, 86, 284–92.
[44] R. C. A. Isaacs. A structure-reactivity relationship driven approach to the identification of a color test protocol for the presumptive indication of synthetic cannabimimetic drugs of

16
abuse. Forensic Sci. Int., 2014, 242, 135–41.
[45] E. Cuypers, A. Bonneure, J. Tytgat. The use of presumptive color tests for new psychoactive substances. Drug Test. Anal., 2016, 136–140.
[46] L. Elie, M. Baron, R. Croxton, M. Elie. Microcrystalline identification of selected designer drugs. Forensic Sci. Int., 2012, 214, 182–8.
[47] S. Gibbons, M. Zloh. An analysis of the “legal high” mephedrone. Bioorg. Med. Chem. Lett., 2010, 20, 4135–9.
[48] D. E. Nichols, W. K. Brewster, M. P. Johnson, R. Oberlender, R. M. Riggs. Nonneurotoxic tetralin and indan analogues of 3,4-(methylenedioxy)amphetamine (MDA). J. Med. Chem., 1990, 33, 703–10.
[49] C. T. Gallagher, S. Assi, J. L. Stair, S. Fergus, O. Corazza, J. M. Corkery, F. Schifano. 5,6-Methylenedioxy-2-aminoindane: from laboratory curiosity to “legal high”. Hum. Psychopharmacol., 2012, 27, 106–12.
[50] G. Socrates. Infrared and Raman Characteristic Group Frequencies: Tables and Charts, John Wiley & Sons, Ltd, Chichester, UK, 2001.
[51] M. Donahue, E. Botonjic-Sehic, D. Wells, C. Brown. RAMAN-Understanding Infrared and Raman Spectra of Pharmaceutical Polymorphs. Am. Pharm. …, 2011, 14, 1–12.
[52] S. N. White. Laser Raman spectroscopy as a technique for identification of seafloor hydrothermal and cold seep minerals. Chem. Geol., 2009, 259, 240–252.
[53] C. Aakeröy, K. Seddon. The hydrogen bond and crystal engineering. Chem. Soc. Rev., 1993, 22, 397–407.
[54] P. Vishweshwar, J. A. McMahon, J. A. Bis, M. J. Zaworotko. Pharmaceutical co-crystals. J. Pharm. Sci., 2006, 95, 499–516.
[55] T. Steiner. Hydrogen-Bond Distances to Halide Ions in Organic and Organometallic Crystal Structures: Up-to-date Database Study. Acta Crystallogr. Sect. B Struct. Sci., 1998, 54, 456–463.

17

18
Figure 1
Chemical structures of 2-, 3- and 4-MMC depicted with corresponding microcrystals formed upon addition of mercury dichloride. Raman spectra of A 2-MMC HCl (1), B [2-MMC HgCl2], C 3-MMC HCl (2), D [3-MMC HgCl2], E 4-MMC HCl (3) and F [4-MMC HgCl2] obtained with 532 nm laser at 1.0-5.2 mW power, 300 μm confocal hole, 100 μm slit width, 2 cycles and between 5 to 30 seconds exposure time. All spectra have been baseline corrected and normalised. Table contains tentative band assignment with the following abbreviations: def… deformation; vib… vibration; sym… symmetric; asym… asymmetric; str… stretching.
Figure 2
Chemical structure of MDAI depicted with corresponding microcrystal formed upon addition of mercury dichloride. Raman spectra of A MDAI HCl and B [MDAI HgCl2] obtained with 532 nm laser at 1.0-10.4 mW power, 300 μm confocal hole, 100 μm slit width, 2 cycles and 10 seconds exposure time. All spectra have been baseline corrected and normalised. Table contains tentative band assignment with the following abbreviations: def… deformation; vib… vibration; sym… symmetric; asym… asymmetric; str… stretching.
19

20
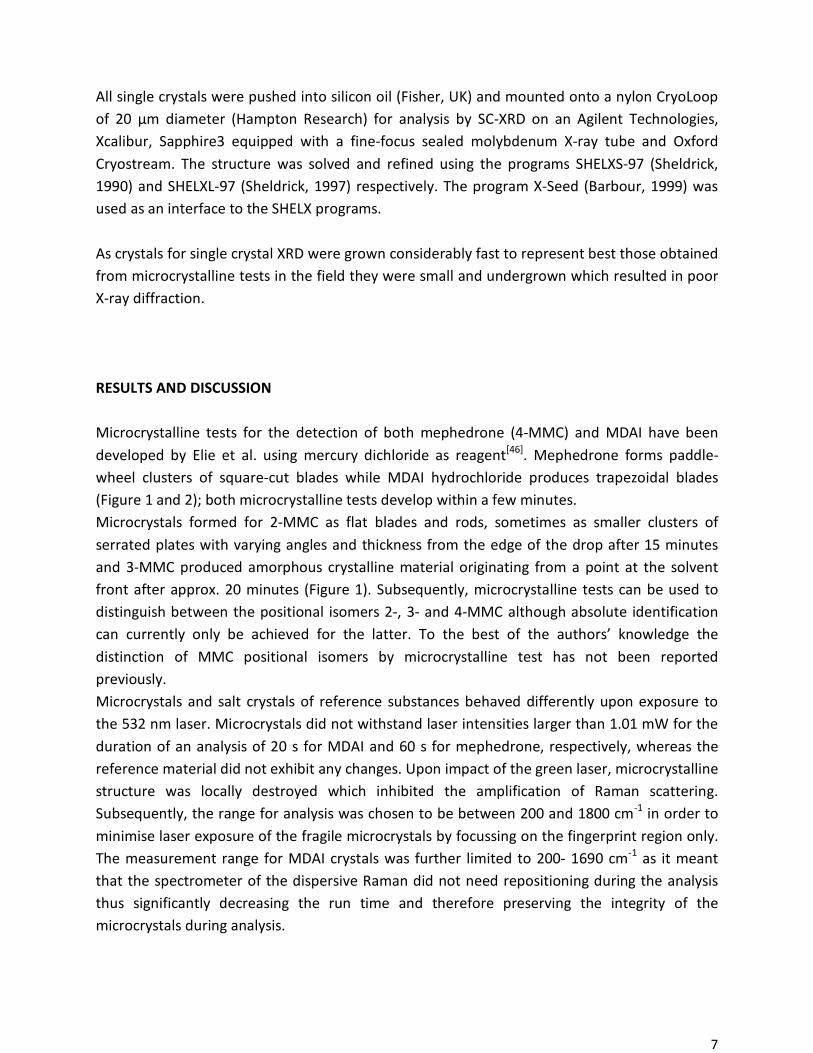
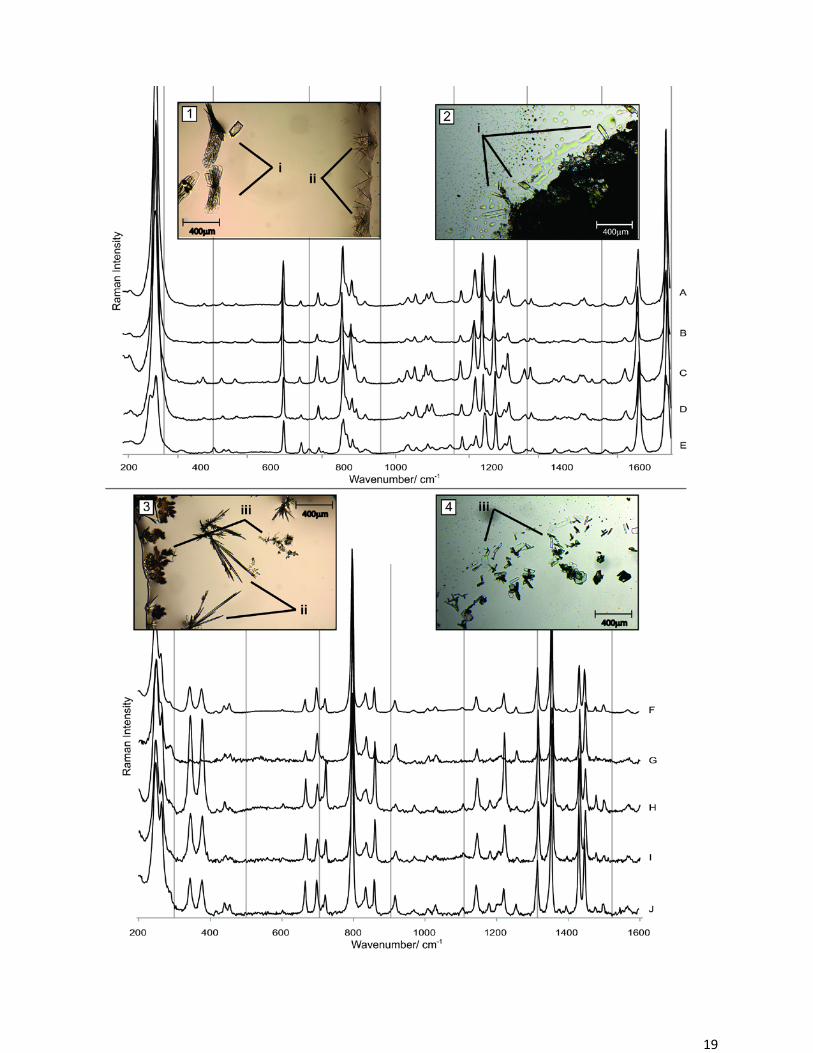
Figure 3
Comparing Raman spectra obtained from pure drug-reagent microcrystals of 4-MMC and MDAI to those obtained when the adulterant caffeine was present in the mix as well as to street samples of 4-MMC and MDAI, respectively, with 532 nm laser at 1.0-5.2 mW power, 300 μm confocal hole, 100 μm slit width, 2 cycles and between 5 to 30 seconds exposure time. All spectra have been baseline corrected and normalised. Raman spectra A [4-MMC HgCl2] and F [MDAI HgCl2] correspond to the standard substance without added adulterants; Raman spectra B, C and D are a result of microcrystals obtained when 4-MMC, and G, H and I when MDAI were mixed with caffeine at ratios of 1:3, 1:1 and 3:1, respectively. Raman spectra E and J correspond to microcrystals obtained from street samples of mephedrone and MDAI, respectively. Depicted microcrystals were obtained from mixtures of drug and adulterant at a ratio of 1:1 and correspond to (1) [4-MMC HgCl2] (i) developing alongside [caffeine HgCl2] microcrystals (ii); (2) [4-MMC HgCl2] (i) developing in the presence of benzocaine precipitate (no Raman spectra shown); (3) [MDAI HgCl2] (iii) developing alongside [caffeine HgCl2] microcrystals (ii); (4) [MDAI HgCl2] (i) developing in the presence of benzocaine precipitate (no Raman spectra shown). Crystals were observed under 40x magnification.

21
Fig S1
Unit cell structure for (i) [4-MMC HgCl2] and (ii) [2-MMC HgCl2] obtained by single crystal X-ray diffraction. Reagent atoms and functional groups have been annotated.

22
Fig S2
Unit cell structure for [MDAI HgCl2] obtained by single crystal X-ray diffraction. Reagent atoms and functional groups have been annotated.