microbiological process reportmedium is inoculated with the test organism and in-cubated for a...
TRANSCRIPT

Microbiological Process Report
Analytical MicrobiologyIII. Turbidimetric Methods
JOHN J. GAVIN
Food Research Laboratories, Inc., Long Island City, New York
Received for publication November 23, 1956
PRINCIPLEIn these methods, graded concentrations of the
substance to be assayed are added to a series of testtubes or flasks containing liquid nutrient medium. Thismedium is inoculated with the test organism and in-cubated for a suitable length of time. The response ofthe test organism, as evidenced by the development ofturbidity, is measured by either visual observation ofan end point (all-or-none response) or by use of aphotoelectric photometer (graded response). By com-paring the response of the test organism to the sub-stance being assayed, with that of the test organism toa known standard preparation, the potency of thesample may be determined.
TYPES OF TURBIDIMETRIC METHODSTurbidimetric assay procedures may be classified in
either of two categories based on the type of growthresponse obtained. In the first group are methods inwhich the test organism gives an all-or-none response.The second group consists of methods in which the testorganism gives a graded response. Methods of the firsttype are qualitative, while those of the second arequantitative.
Qualitative MethodsIn qualitative methods, the response of the test
organism is measured between two concentrations of adilution series. A fixed volume of culture medium isplaced in each tube of the series and sterilized. Variousdilutions of the substance to be assayed are then addedto the series of tubes. The tubes are inoculated with thetest organism, a predetermined constant inoculum, andincubated for a period of time. They are observed forgrowth as evidenced by the development of turbidityin the individual tubes. The end point lies between theconcentration at which growth 6ccurs and the concen-tration at which there is no growth. If dilutions of aknown standard preparation are assayed at the sametime and under the same conditions, an estimation ofthe potency of the sample may be obtained.The degree of precision obtained is dependent upon
235
the concentration of the substance in the dilution series.The narrower the increments, the greater the precisionbecomes. A twofold dilution series will give a moreprecise estimation of the concentration of the samplethan will a tenfold scale. The series of increments ischosen by the individual analyst in the light of hisparticular requirements.The advantages of the qualitative methods are:(1) They are more sensitive than other methods. Low
concentrations of active material can be detected.(2) They can be used to evaluate materials when
there are no standards available. They are valuabletools in the preliminary screening of compounds forvarious types of activity.
(3) An index of activity, for a compound or a series ofcompounds, for a large number of microorganisms canreadily be obtained in a relatively short period of time.The disadvantages are:(1) Measurement is limited to a point between two
concentrations of a dilution series. The precision is thusrelated to the range of concentrations used in the series.
(2) The end point may shift upon repeated assay,even under identical test conditions.
(3) Turbid or highly colored solutions interfere withthe determination of the response.
(4) Samples must be sterile. The presence of micro-organisms not affected by the material being assayedwould cause the development of turbidity which wouldinvalidate the results obtained.
(5) Substances in sample solutions other than thecompound being assayed, may interfere with the assay.This occurs, particularly, when samples of naturalproducts are tested.
Quantitative Methods
In quantitative methods, under the conditionsselected for each assay, the response of the test organ-ism is a direct function of the concentration of thecompound being assayed. The growth response isgraded in proportion to the dose concentration. As thisresponse is also proportional to the optical densitychanges in the various tubes of the series, it may be
on April 6, 2020 by guest
http://aem.asm
.org/D
ownloaded from

J. J. GAVIN[
measured by means of a suitable photoelectric photom-eter. By including a known standard preparation,assayed at the same time and under the same condi-tions, the potency of the sample is determined. Theturbidity values of the tubes in the standard series areplotted against their respective dose concentration.Interpolation of the turbidity values of the tubes of thesample series on this curve permits the concentration ofthe sample to be calculated.
Quantitative methods may be subdivided into twoclasses. In one class are the methods in which totalgrowth is measured. In the other are the methods inwhich the rate of growth is compared. When totalgrowth is measured, the incubation period is such thatmaximum turbidity, for the appropriate concentrationrange, is obtained. 3Methods based on the measurementof the rate of growth of the test organism have short,predetermined incubation periods or incubation isterminated when a definite turbidity value is reached ina control tube. Methods measuring the rate of growthare more susceptible to the influence of the variousfactors involved in microbiological assay procedures.They are more affected by substances likely to be pres-ent in crude samples than are those methods measuringtotal growth. Snell (1950) stated that it is usually moredifficult to devise a short term assay than to devise alonger term assay of equal accuracy.The advantages of quantitative assays are:(1) The methods are more sensitive to low dilutions
than diffusion methods.(2) As results are obtained at several concentration
levels, the methods lend themselves readily to statisticalanalysis.
(3) The methods are adaptable to rapid assays.Results can be obtained in short periods of time.The disadvantages are:(1) Turbid or highly colored solutions interfere witl
the determination of the response.(2) Samples should be sterile. When rapid assay pro-
cedures (that is, 3 to 4 hr incubation) are used, samplesneed not be sterile.
(3) The presence of solvents or other substances aremore likely to interfere with these methods than withdiffusion methods.
(4) A questionable disadvantage is the necessity ofincluding a standard curve each time an assay is run.In many cases, using diffusion methods, a compositestandard curve can be prepared utilizing data from aseries of assays. After this curve is prepared, it is notnecessary to include a standard series for each assay.On occasion, the slope and accuracy of the master curveis checked. However, McMahan (1944) pointed out thateven the precision of the Oxford plate method is in-creased by the use of a daily standard curve instead of amaster composite standard curve.
MEASUREMENT OF TURBIDITY
The development of turbidity in the assay tubes maybe measured by either visual inspection or the use of asuitable instrument. End point determinations, whereonly the presence or absence of growth is noted, areusually visual observations. The graded response pro-cedures utilize some type of instrument for assessingthe amount of growth at each assay level. It is obviousthat comments are not necessary regarding visualobservations. Only instrumental measurements will beconsidered.The use of the adjective "turbidimetric," in connec-
tion with these methods, is technically incorrect, as ispointed out by Treffers (1956). The designation,"photometric," is correct. HowNever, as almost anyphotoelectric photometer will serve as a turbidimeterwithout any change in the instrument (Willard, et al.,1949), this distinction will not be made here.A variety of instruments, both filter photometers and
spectrophotometers, have been employed in measuringgrowth response. They may be classified as either one-cell or two-cell instruments. For example, of the filterphotometers in common use, the Evelyn is a one-cellinstrument while the Klett-Summerson, the Lumetronand the Fischer Electrophotometer are two-cell instru-ments. Among the spectrophotometers, the Colemanand the Beckman are one-cell instruments.These photometers measure the amount of trans
mitted light relative to incident light. The basic differ-ence between the filter photometer and the spectro-photometer is that the former uses a color filter forisolating the desired wavelength from the light sourcewhile the latter employs a monochromator. The spectro-photometer is capable of isolating a much narrowerband of light than the filter photometer and as thepurity of light available is better than that from filters,the per cent transmittance is determined more pre-cisely.The filter isolates a band of light, 30 to 50 ,t wide.
This band should be centered as close as possible to theminimum transmittancy of the sample. In microbio-logical procedures, the correct filter should be chosen foreach culture medium used. The ideal filter is the onewhere the medium shows the minimum absorptionThis means that the filter selected for use with a particu-lar culture medium is that which minimizes the effectsof the color of the solution (Hirschberg, 1950). Forspectrophotometers, the wavelength at which this mini-mum absorption takes place is chosen.With one-cell instruments, it is necessary to maintain
a constant light source while the readings of the stand-ard and the unknown are being taken. If the circuits in atwo-cell instrument are properly chosen, variations inlight intensity are cancelled out. This is a definite
236 [VOL. 5
on April 6, 2020 by guest
http://aem.asm
.org/D
ownloaded from
ANALYTICAL MICROBIOLOGY. III
advantage. In addition, the null point method of bal-ancing the cells against eath other is said to eliminateerrors due to temperature changes and cell fatigue(Hirschberg, 1950). Certain of these two-cell instru-ments may be balanced so that the total range of tur-bidity is spread over the entire scale of the instrument.
Instrumental errors are similiar in filter photometersand spectrophotometers. The instrument, itself, shouldnot be a serious source of error as carefully designedinstruments are capable of greater precision of measure-ment than the reproducibility of the turbidities to bemeasured. Willard et al. (1949) list the significantinstrumental errors as:
(1) Nonlinearity of response of the light sensitivedevices and associated measuring circuits.
(2) Variations in the intensity of the light source.(3) Stray light striking cells.(4) Temperature rise in measuring photocell.(5) Dust, scratches and imperfections in the optical
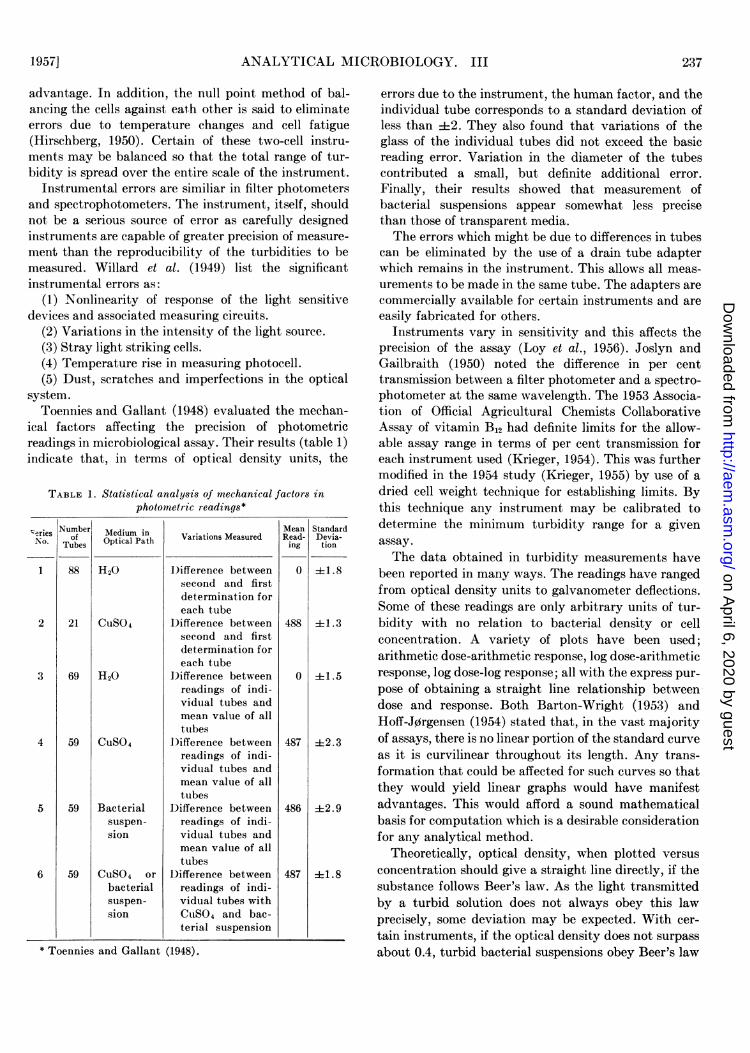
system.Toennies and Gallant (1948) evaluated the mechan-
ical factors affecting the precision of photometricreadings in microbiological assay. Their results (table 1)indicate that, in terms of optical density units, the
TABLE 1. Statistical analysis of 'mechanical factors inphotometric readings*
Medium inOptical Path
H20
CuS04
H20
CuS04
Bacterialsuspen-sion
CUS04 orbacterialsuspen-sion
Variations Measured
Difference betweensecond and firstdetermination foreach tube
Difference betweensecond and firstdetermination foreach tube
)ifference betweenreadings of indi-vidual tubes andmean value of alltubes
Difference betweenreadings of indi-vidual tubes andmean value of alltubes
Difference betweenreadings of indi-vidual tubes andmean value of alltubes
Difference betweenreadings of indi-vidual tubes withCuS04 and bac-terial suspension
* Toennies and Gallant (1948).
MeanRead-ing
0
488
0
487
486
487
StandardDevia-
errors due to the instrument, the human factor, and theindividual tube corresponds to a standard deviation ofless than ±2. They also found that variations of theglass of the individual tubes did not exceed the basicreading error. Variation in the diameter of the tubescontributed a small, but definite additional error.Finally, their results showed that measurement ofbacterial suspensions appear somewhat less precisethan those of transparent media.The errors which might be due to differences in tubes
can be eliminated by the use of a drain tube adapterwhich remains in the instrument. This allows all meas-urements to be made in the same tube. The adapters arecommercially available for certain instruments and areeasily fabricated for others.
Instruments vary in sensitivity and this affects theprecision of the assay (Loy et al., 1956). Joslyn andGailbraith (1950) noted the difference in per centtransmission between a filter photometer and a spectro-photometer at the same wavelength. The 1953 Associa-tion of Official Agricultural Chemists CollaborativeAssay of vitamin B12 had definite limits for the allow-able assay range in terms of per cent transmission foreach instrument used (Krieger, 1954). This was furthermodified in the 1954 study (Krieger, 1955) by use of adried cell weight technique for establishing limits. Bythis technique any instrument may be calibrated todetermine the minimum turbidity range for a given
tion assay.The data obtained in turbidity measurements have
±1.8 been reported in many ways. The readings have rangedfrom optical density units to galvanometer deflections.Some of these readings are only arbitrary units of tur-
1.3 bidity with no relation to bacterial density or cellconcentration. A variety of plots have been used;arithmetic dose-arithmetic response, log dose-arithmetic
1.5 response, log dose-log response; all with the express pur-pose of obtaining a straight line relationship betweendose and response. Both Barton-Wright (1953) andHoff-Jorgensen (1954) stated that, in the vast majority
+2.3 of assays, there is no linear portion of the standard curveas it is curvilinear throughout its length. Any trans-formation that could be affected for such curves so thatthey would yield linear graphs would have manifest
±2.9 advantages. This would afford a sound mathematicalbasis for computation which is a desirable considerationfor any analytical method.
Theoretically, optical density, when plotted versus±1.8 concentration should give a straight line directly, if the
substance follows Beer's law. As the light transmittedby a turbid solution does not always obey this lawprecisely, some deviation may be expected. With cer-tain instruments, if the optical density does not surpassabout 0.4, turbid bacterial suspensions obey Beer's law
s-eriesNo.
2
3
4
5
6
Numberof
Tubes
88
21
69
59
59
59
I1957]~- 237
on April 6, 2020 by guest
http://aem.asm
.org/D
ownloaded from

J. J. GAVIN
(Snell, 1950). Monod (1949) in his discussion' on thegrowth of bacteria stated, in practice, the best instru-ments for the measurement of bacterial turbidity arethose calibrated in terms of optical density. In general,with well dispersed cultures, the optical density remainsproportional to bacterial density throughout the posi-tive phases of growth of the culture. This had beenpreviously noted in vitamin assay when Roberts andSnell (1946) constructed calibration curves relatinggalvanometer readings of an instrument to the dryweight of the cells of the test organism. They foundthat the optical density or the galvanometer readingscould be used directly. Boyd et al. (1948) demonstratedthat turbidity and optical density are proportional tocell count. With yeasts, light absorption is approxi-mately a linear function of concentration (Atkin et al.,1942). Treffers (1956) preferred the use of opticaldensity units over per cent transmission in his graphicaltreatment of antibiotic assays. He stated that' opticaldensity is directly proportional to the'microbial massand, under standardized conditions to microbial num-bers, in the appropriate concentration ranges.
Actually, the majority of the individuals in this fieldrecord turbidity measurements in terms of the instru-ment available to them. The activity is represented byplotting the data in the manner which gives the bestlinear relationship.
FACTORS WHICH INFLUENCE TURBIDIMETRIC METHODS
The factors which influence turbidimetric methodsare, as with other types of methods, many and varied.Certain of these factors concern all procedures, whileothers affect only a single type. For example, in everymethod it is necessary to consider the effect of pH onthe test organism and on the activity of the substancebeing assayed. However, the color of the test solutionand its effect on the assay will be of particular impor-tance in turbidimetric procedures, while the diffusionrate of a compound will affect only diffusion methods.The following discussion is concerned with the general
factors which have an effect on turbidimetric pro-cedures. In addition, in order to develop a satisfactoryassay procedure, it is necessary to have a knowledge ofthe physical and chemical properties of the material tobe assayed and to be familiar with the growth character-istics of the test organism.
Substance to Be AssayedIn order to use a turbidimetric procedure for the
assay of a particular substance, the material must meetcertain requirements. These are:
(1) It should affect the growth response of some1 Adelberg and Rabinovitz (1956) recommend careful study
of Monod's essay by anyone intending to apply quantitativemicrobiology to biochemical problems.
microorganism in a manner which is reflected bychanges in the turbidity of the culture medium;
(2) It should be soluble in water, or some solventmiscible with water which will'not interfere with theassay in the concentration used;
(3) It should not cause turbidity in the test solutionor form a precipitate when in contact with the culturemedium, (if filtration or centrifugation does not aid inthe clarification of the sample solution, another pro-cedure must be chosen);
(4) It should not cause the test solution to becomedarkly colored, (in certain cases, color interference canbe eliminated by use of small volumes of test solution,0.02 to 1.0 ml; by selection of a colorimeter filter in arange where the color of the test solution will notregister (Toennies and Gallant, 1948; Hawk et al.,1954); or, when a limited number of tubes are involved,removal of the colored culture medium by centrifuga-tion of the cells and subsequent resuspension in salinebefore the turbidity values are obtained (Hopkins andPennington, 1947); the color may also be compensatedfor by the use of color blanks);
(5) It should be sterile (this is not a problem in theassay of heat stable substances or in assays of shortduration, that is, incubation periods of from 90 min to6 hr).
If the above requirements are not fulfilled or compen-sated for as noted, another type of method must bechosen.
Culture Medium and Sample Solutions
Of the factors related to the successful performance ofa turbidimetric assay, the culture medium is of greatestimportance. This is partially due to the incorporation ofthe sample solution as an intrinsic part of the culturemedium. The sample solution may be responsible for:
(1) The introduction of extraneous materials whichchange the composition of the basal medium and/oraffect the growth response of the test organism;
(2) The alteration of the clarity and color of the basalmedium;
(3) A decrease in the buffering capacity of the basalmedium;
(4) A change in the salt concentration of the basalmedium.
In highly purified mixtures, such as antibiotic dosageforms and vitamin mixtures, the problem is not great asthe exact formulation is generally known. Naturalproducts present a more formidable challenge. In somecases, there is little or no information concerning thecomposition of the material or its effect on testorganisms.The prime factor is the introduction of extraneous
materials which might change the composition of thebasal medium. The addition of inhibitory or stimula-
[VOL. 5238
on April 6, 2020 by guest
http://aem.asm
.org/D
ownloaded from

ANALYTICAL MICROBIOLOGY. III
tory substances, other than that being assayed for,will, of course, result in invalid assays. Adequate ex-traction procedures must be employed, in preparingsuch samples for assay, to minimize undesirable effects.With high potency materials, dilution alone is effec-
tive in eliminating interfering materials. Other tech-niques such as solvent extraction, inactivation ofcompounds known to interfere with a specific assay, orchoice of a test organism highly sensitive to the sub-stances being assayed and relatively insensitive to otheractive substances (Kramer and Kirschbaum, 1955;Grove and Randall, 1955) might be used.Dunn (1947), in the assay of amino acids in food-
stuffs, assumed that basal medium adjusted on thebasis of the nutritional requirements of the test organ-ism would nullify almost completely the potentialinfluence of any substance likely to be present in theadded sample. He was able to improve certain assaysby adjusting the composition of the culture media inaccordance with his observations as to the optimalbalance of nutrients needed for a constant response to aparticular amino acid.
Sterilization of the culture medium can have anadverse effect on turbidimetric assays. Heat steriliza-tion may cause major changes, such as color formation,destruction of certain nutrients, and the lowering of thepH, in the test medium. These undesirable changes maybe due, in part, to the amino acid-sugar reaction de-scribed by Friedman and Kline (1950a, b). They foundwhen proteins and amino acids are heated in the pres-ence of glucose, the material was browned with a cor-responding decrease in the nutritional value as measuredby microbiological assay.The solution to this problem, in certain cases, is
shorter periods of exposure of the culture medium toheat. This has been done by several investigators(Roberts and Snell, 1946; Boyd et al., 1948; Barton-Wright, 1953; Parrish et al., 1955), In many assay pro-cedures, the conditions used may eliminate the need forcomplete sterilization. For example, in a short termassay, sterilization may not be needed due to the rapidgrowth of the test organism in a short period of time. Orthe incubation temperature used with certain testorganisms might preclude rigid heat treatment.
Stokstad et al. (1956) have stated that assays withlactobacilli are almost immune to interference bycontaminants because of the rapidity of growth, theimmediate acidification of the medium and essentiallyanaerobic conditions. This combination repressespractically all contaminants except lactobacilli.
There are other cases where complete sterilization isnecessary. When slow growing organisms, such asTetrahymena with an incubation period as long as six toeight days, are used, precautions must be taken to avoidcontamination. Separate sterilization of glucose solu-
tions or reduction of the glucose content of the culturemedium (The Difco Manual, 1953) will aid in over-coming the problem of color changes.
Proper buffering of the culture medium before steri-lization will prevent any substantial drop in its pH.Care must be taken in the selection of the type andquantity of buffer used, as it will depend, in part, on itseffect on the test organism. An advantage of theturbidimetric procedure over the acidimetric method isthat the medium can be buffered to a greater extentand allow heavier growth of acid producing microorgan-isms before pH levels, which are inhibitory to theseorganisms, are reached.The effect of sterilization seems to be a particular
problem with growth factor assays rather than withantimicrobial activity assays. With antimicrobial assaymedia, there is some color change and a lowering of pH,but this commonly occurs when most culture media areautoclaved. Destruction of nutrients might take place,but not to the apparent detriment of the assay pro-cedure. This difference may be attributed to the com-position of the media. Media for the assay of antimicro-bial substances are composed of natural materials whilegrowth factor assay media are synthetic or semi-synthetic and thus more susceptible to heat.The color and clarity of the medium may be affected
by:(1) Sterilization, as indicated above;(2) Incorporation of components which (a) are turbid
or highly colored, (b) precipitate or cause precipitationwhen added to the medium, or (c) react under the con-ditions of the assay to produce solutions that are notsuitable for optical measurements;
(3) Incubation conditions;(4) The test organism, itself.Sterilization and incubation of the culture medium
cause a certain amount of darkening. If the color of thebasal medium is quite dark when it is prepared, sub-sequent darking will make it unsuitable for turbidi-metric measurement. Although turbidity values maybe obtained, the assay range is limited and inconsistent.Invalid assays result from use of optically dense culturemedium.
Certain ingredients of the mediurm may not dissolvereadily. Other components, such as the "Tweens," whenpresent in high concentrations, cause considerableturbidity. Care must be taken in the preparation ofculture medium to produce a medium suitable for usein a sensitive optical system.The test organism, itself, may affect the color of the
culture medium. Toennies and Gallant (1948) found,after centrifugation, noninoculated tubes showed morecolor than inoculated ones. They regarded this as evi-dence that the test organism absorbs or consumes someof the color of the test medium. This should not be of
1957] 239
on April 6, 2020 by guest
http://aem.asm
.org/D
ownloaded from

J. J. GAVIN
particular concern as the tubes of the standard seriesshould reflect similar changes with increasing numbersof cells.
Inoculation of the Assay Tubes
There are three methods by which the assay tubesmay be inoculated. These are:
(1) By seeding each assay tube with one or two dropsof the inoculum suspension, using a capillary pipette ora syringe;
(2) By seeding each assay tube with a definite volumeof the inoculum suspension;
(3) By seeding the test medium in bulk with a definitevolume of the inoculum suspension, then dispensing apredetermined volume of the seeded test medium intoeach assay tube.When the dropwise method is used there is some
variation in the distribution of the test organism to thetubes. However, Snell (1948) has indicated, in mostcases, the concentration of the limiting factor present,and not the fluctuation in drop size, is responsible forthe final amount of growth obtained. This may be truein assays where the total growth response is determined,but in short-term assays, where the rate of growth iscompared, such variation in the inoculum could affectthe reproducibility of the results.The first two methods also suffer the disadvantage
of being tedious and time consuming.The third method is preferred as it insures equal
inoculation for each tube of the assay series and is lesstedious than the other methods. In addition, con-siderable time can be saved when it is necessary to assayseveral samples.
Incubation
The temperature of incubation is dependent upon thetest organism and the nature of the substance to beassayed. It should be close to the optimum temperaturefor the growth of the test organism or in a range thatwill permit a good growth response.The actual temperature which is selected for any
given assay procedure is not as critical as the mainte-nance of a constant temperature. Variability in differentsections of the incubator may be a serious source ofdiscrepancy between replicate tubes as each tube rep-resents a separate population. This is of maj or impor-tance in short-term assays as rigid control of all assayconditions is essential. If valid assays are to be obtained,each tube in the series should be subjected to identicalenvironmental conditions.Much of the variation in temperature conditions can
be eliminated by use of a circulating water bath incu-bator. The water bath must be designed to minimizevibration as it has been shown (Lewis et al., 1947) thatvariation in growth response can be attributed to thisfactor.
The length of the incubation period, although some-what arbitrary, is also conditioned by the test organismand the material being assayed. Turbidimetric pro-cedures have been developed in which the incubationtime, using a bacterium as the test organism, is as shortas 90 minutes (Lee et al., 1944). On the other hand, usinga protozoon as the test organism, an assay may take aslong as 6 to 8 days (Hoff-J0rgensen, 1954).
In the assay of chlortetracycline, Beigelman (1949)reported that the error of assay is diminished when theincubation period is less than 12 hours. Lewis et al.(1947) found more variation, in the assay of subtilin,with an 18 hr incubation period than when a 4 hr periodwas used. When thiamine is assayed, using Lactobacillusfermenti, the pyrimidine and thiazole moieties show nogrowth promoting activity if the incubation period is18 hr. With longer incubation periods, some activityfrom these products is apparent (Snell, 1950).
In the majority of vitamin and amino acid assays, thelength of incubation is of minor importance. The con-centration of the growth factor in each assay tubelimits the response of the test organism. Growth, asevidenced by turbidity, ceases when the supply of thenutrient being assayed is exhausted. No significantchange in the turbidity of the tube occurs when thispoint is reached.There are certain exceptions where it is necessary to
control the length of incubation. \Yhen the rate ofgrowth rather than the total growth is determined thedosage levels of nutrient will be in a range where, underthe particular assay conditions, a delineation of growthbetween the various tubes of the series will be noted.However, if the conditions set for the incubation periodare exceeded, a graded response may not occur. Suchassays must be terminated when a specific condition,either an arbitrary turbidity value or a definite periodof time, is reached. The growth response may be stoppedby the addition of a bactericidal agent (such as formal-dehyde) to each assay tube, by chilling the tubes at lowtemperatures, by steaming, or by autoclaving the tubes.Autoclaving is not recommended as the turbidity ofcultures sterilized by steam pressure may be markedlychanged.
If a procedure is based on growth inhibition, thelength of the incubation period will depend uponwhether the substance is bactericidal or bacteriostatic.In the former case, assay results should not be affectedby this factor. However, as noted previously for growthfactors, when rapid assay procedures are used, it be-comes important. The substance being assayed althoughbactericidal in nature, may not exert a bactericidaleffect in the range of dosage levels chosen for the assay.It might only be bacteriostatic, thus, when the incuba-tion period is extended over a longer period of time,bacteriostasis ceases and inhibition is not noted. Steps,such as those indicated above for short-term growth
240 [voL. 5
on April 6, 2020 by guest
http://aem.asm
.org/D
ownloaded from

ANALYTICAL MICROBIOLOGY. III
factor assays, must be taken to stop growth at theproper time.
In the case of bacteriostatic substances, the inhibitioneffect is limited, in general, to a certain time period.Any extension beyond that limit will result in invalidassays as the end point shifts on prolonged incubation.This makes the length of the incubation period criticalfor comparison of results from assay to assay.
Oxygen RelationshipsCertain test organisms, for example, protozoa, yeast
and strict aerobic bacteria require oxygen to yield agood growth respoinse. The work of Rahn and Richard-son (1941) indicated that the rate of oxygen diffusion instationary cultures is not sufficient to provide an entireculture of an aerobic organism with oxygen. When thisis considered in the light of analytical techniques, itmeans that a factor, other than the one being assayed,might limit the growth of the test organism.
In fact, whein Tetrahymena gelii is used as a testorganism, death of the culture occurs when the tubes arenot slanted to provide aeration (Dewey et al., 1950). Inthe assay of thiocytic acid, poorly aerated cultures ofTetrahymena pyriformis give erratic results (Stokstadet al., 1956).
Snell (1950) has stated that although yeast willgrow aniaerobically, a heavier growth response is ob-tained when the cultures are aerated. Aerobic bacteria,such as Proteus vulgaris, Acetobacter suboxydans, andCorynebacterium bovis will only grow when sufficientoxygen is present.
Aeration of cultures may be accomplished by me-chanical shaking or by providing a favorable ratio ofsurface to assay medium volume. The use of flasks orslanted test tubes provides a large surface area with aminimum depth so that oxygen diffuses readily through-out the test medium.
Interaction of the constituents of the culture mediumduring autoclaving generally results in a favorableoxidation-reduction potential for microaerophilic andfacultative aerobic bacteria (Snell, 1950; Lees andToothill, 1952). In certain cases, reducing agents maybe added to the medium to control this variable. Theslope of the dose response curve for microaerophilicbacteria may be improved by the use of narrow testtubes in order to increase the depth of the medium andcreate more favorable conditions (Lees and Toothill,1952). Use of large volumes of test medium in testtubes 18 by 200 mm will achieve the same effect.When anaerobic test organisms are used, conditions
for their growth may be established by the routinemethods for cultivating these microorganisms, that is,use of anaerobic jars. As most of these methods arecumbersome, it is easier to incorporate reducing agentsinto the assay medium to control the potential.
GlasswareA major, but sometimes overlooked, factor in the
successful performance of turbidimetric methods is thecleanliness of the glassware used in the procedures.Kersey and Fink (1954), in their discussion of the assayof antibiotics in biologic materials, stated that con-tamination of glassware may well invalidate conclusionsdrawn in an otherwise satisfactory manner. Loy et al.(1950) indicated that lack of recognition of this factor,as the cause of erratic results was an important deter-rent in the development of a suitable assay for vitaminB12.
Cleaning of glassware may be accomplished in manyways. Soaps and detergents, dichromate cleaning solu-tion and acid washes, followed by rinsing and heatinghave been used in various combinations. A successfulmethod of preparing glassware for the determination ofone substance may not be applicable to all assay pro-cedures. For example, Stapert and Stubberfield (1954)found that while tubes cleaned with detergent could beused for most vitamin assays, it was necessary to use 65per cent vol/vol sulfuric acid solution to clean glass-ware used in the assay of vitamin B12.Thorough rinsing of glassware must follow the use of
chemical agents in cleaning procedures. Many commonlaboratory cleansers can affect the test organism. Inpolymyxin assays Reese and Eisenberg (1949) foundthat less than 0.05 per cent Alconox in the culture brothwill inhibit Brucella bronchiseptica. Soap has the oppo-site effect in these assays (Bliss et al., 1949). The occur-rence of "skipping" (false positive tubes) was found to bedue to inactivation of polymyxin by soap. When specialprecautions were taken in the rinsing of the laboratoryglassware, the frequency of "skipping" was greatlyreduced. From these examples, it can be seen that eitherthe test organism or the substance being assayed maybe affected. In order to obtain valid and consistentturbidimetric assays, all glassware should be chemicallyand biologically clean.
Accuracy of ResultsThe limits of error reported in the literature for
turbidimetric assays have ranged from i2 per cent(Kersey, 1950) to +20 per cent (Darker et al., 1948).The majority of the reports indicate that limits of +410per cent is about average for this type of procedure.However, an experienced analyst exercising rigid controlof the factors which contribute to within day and be-tween day variability, should be able to approach +5per cent in quantitative turbidimetric methods.The use of replicate tubes in these assays should in-
crease the precision of measurement and aid in esti-mating the assay error. At a symposium on analyticalmicrobiology (Gavin, 1956) Gaunt stated that replica-tion increases the precision of measurement by a factorwhich is the square root of the number of replicates.
1957] 241
on April 6, 2020 by guest
http://aem.asm
.org/D
ownloaded from

J. J. GAVIN
A pitfall in the use of replicates has been pointed outby Bliss (1952). He stated that unless the assay isarranged in randomized groups, the variation betweenduplicates may underestimate the assay error with adiscrepancy as much as tenfold. Variation in replicatetubes will only indicate the error of assay to the degreethat randomization has been used in the preparationof the tubes, their positioning in the autoclave andincubator, and in the reading of results.
Control of the various factors discussed above, aidedby an assay design which minimizes the influence of biasin the set-up of the assay, should lead to reliable andreproducible results. The application of statisticalanalysis makes it possible to determine the validity of anassay, the contribution to over-all error made by aparticular variable and the degree of reliability of theassay results obtained. Thus each analyst is able toevaluate any of the procedures he might use.
Advantages and Disadvantages of the Turbidimetric TypeAssay
The advantages of the turbidimetric type assay are:(1) The method is more sensitive to low concentra-
tions of active material than other methods of assay(that is, diffusion, acidimetric and so forth).
(2) The method can be adapted to give accurateresults in short periods of time.
(3) The method can be used to evaluate materials forwhich a standard is not available.
(4) By proper application of statistical procedures,both the precision and the accuracy of the method canbe determined.
(5) The method can be used to obtain an index ofactivity for a variety of compounds against severalorganisms in a relatively short period of time.The disadvantages of the turbidimetric type assay are:(1) Turbid or highly colored solutions cannot be
assayed by this method.(2) In most cases, the sample being assayed must be
sterile.(3) The method requires more manipulation and is
more tedious than diffusion methods.(4) The method is more susceptible to variations in
environmental conditions than diffusion methods.(5) The method is more susceptible to the influence of
organic solvents and extraneous substances in samplepreparations than diffusion methods.
REFERENCES
ADELBERG, E. A. AND RABINOVITZ M. 1956 Metabolism ofamino acids and proteins. Ann Rev. Biochem., 25, 349-367.
ATKIN, L., SCHULTZ, A. S., AND FREY, C. N. 1942 Measure-ment of yeast growth. Arch. Biochem., 1, 9-16.
BARTON-WRIGHT, E. C. 1953 The microbiological assay ofthe vitamin B complex and amino acids. Pitman PublishingCorporation, New York, N. Y.
BEIGELMAN, P. M. 1949 In vitro determination of bacterialsensitivity to Aureomycin. Proc. Soc. Exptl. Biol Med.,72, 89-92.
BLISS, C. I. 1952 The statistics of bioassay. AcademicPress, Inc., New York, N. Y.
BLISS, E. A., CHANDLER, C. A., AND SCHOENBACK, E. B. 1949In vitro studies of polymyxin. Ann. N. Y. Acad. Sci.,51, 944-951.
BOYD, M. J., LOGAN, M. A., AND TYTELL, A. A. 1948 Amicrobiological procedure for the assay of amino acidswith Clostridium perfringens (Welchii) BP6K. J. Biol.Chem., 174, 1027-1035.
DARKER, G. D., BROWN, H. B., FREE, A. H., BIRO, B., ANDGOORLEY, J. T. 1948 The assay of bacitracin. J. Am.Pharm. Assn., Sci. Ed., 37, 156-160.
DEWEY, V. C., PARKS, R. E., JR., AND KIDDER, G. W. 1950Growth responses of Tetrahymena gelii to changes in thebasal media. Arch. Biochem., 29, 281-290.
Difco Manual of Dehydrated Culture Media and Reagents, 1953Media for the assay of vitamins and amino acids. p. 2149th ed. Difco Laboratories, Inc., Detroit, Michigan.
DUNN, M. S. 1947 Amino acids in food and analyticalmethods for their determination. Food Technol., 1,269-286.
FRIEDMAN, L. AND KLINE, 0. L. 1950a The amino acid-sugar reaction. J. Biol. Chem., 184, 599-606.
FRIEDMAN, L. AND KLINE, 0. L. 1950b The relation of theamino acid-sugar reaction to the nutritive value of proteinhydrolysates. J. Nutrition, 40, 298-307.
GAVIN, J. J. 1956 Symposium on analytical microbiology.Bact. Reviews, 20, 201-204.
GROVE, D. C. AND RANDALL, W. A. 1955 Assay methods ofantibiotics. A laboratory manual. p. 82. Medical Encyclo-pedia, Inc., New York, New York.
HAWK, P. B., OSER, B. L., AND SUMMERSON, W. H. 1954Practical physiological chemistry. 13th ed. p. 1186. TheBlakiston Company, Inc., New York, New York.
HIRSCHBERG, E. 1950 The use of optical instruments invitamin assay. Vitamin Methods (ed. by P. Gy6rgy) Vol.1, 507-537. Academic Press, New York, New York.
HOFF-J0RGENSEN, E. 1954 Microbiological assay of vitaminB12. Methods of biochemical analysis (ed. by D. Glick) Vol.1, 81-113. Interscience Publisher, Inc., New York, NewYork.
HOPKINS, R. H. AND PENNINGTON, R. J. 1947 The assay ofthe vitamin B6 complex. Biochem. J., 41, 110-114.
JOSLYN, D. A. AND GAILBRAITH, M. 1950 A turbidimetricmethod for the assay of antibiotics. J. Bacteriol., 59,711-716.
KERSEY, R. C. 1950 A turbidimetric assay for Terramycin.J. Am. Pharm. Assn., Sci. Ed., 39, 252-253.
KERSEY, R. C. AND FINK, F. C. 1954 Microbiological assayof antibiotics. Methods of biochemical analysis (ed. byD. Glick), Vol. 1, 53-79. Interscience Publishers, Inc.,New York, New York.
KRAMER, J. AND KIRSCHBAUM, A. 1955 A turbidimetricassay for Tyrothricin. Antibiotics and Chemotherapy,5, 561-565.
KRIEGER, C. H. 1954 Report on vitamin B12 (Microbiologi-cal method). J. Assoc. Offic. Agr. Chemists, 37, 781-792.
KRIEGER, C. H. 1955 Report on vitamin B12 (Microbiologi-cal method). J. Assoc. Offic. Agr. Chemists, 38, 711-721.
LEE, S. W., FOLEY, E. J., EPSTEIN, J., AND WALLACE, J. H.,JR. 1944 Improvements in the turbidimetric assay forpenicillin. J. Biol. Chem., 152, 485-486.
LEES, K. A. AND TOOTHILL, P. R. 1952 The assay of vitaminB12. Relationship between growth response of Lactobacillus
242 [VOL. 5
on April 6, 2020 by guest
http://aem.asm
.org/D
ownloaded from

THERMAL DESTRUCTION OF SPORES
leichmannii 313 in tubes and diffusion of oxygen into themedium. Biochem. J., 50, 455-459.
LEWIS, J. C., HUMPHREYS, E. M., THOMPSON, P. A., DIMICK,K. P., BENEDICT, R. G., LANGLYKKE, A. F., AND LIGHT-BODY, H. 1). 1947 The microbiological assay of subtilin.Arch. Biochem., 14, 437-450.
Loy, H. W., JR., HAGGERTY, J. F., AND KLINE, 0. L. 1950 Acause of variation in the microbiological assay for vitaminB12. Arch. Biochem., 29, 451.
Loy, H. W., JR., PARRISH, W. P., AND SCHIAFFINO, S. S. 1956The use of turbidity measurements in microbiologicalmethods for vitamins. J. Assoc. Offic. Agr. Chemists,39, 172-179.
MCMAHAN, J. R. 1944 An improved short term turbidimetricassay for penicillin. J. Biol. Chem., 153, 249-258.
MONOD, J. 1949 The growth of bacterial cultures. Ann.Rev. Microbiol., 3, 371-394.
PARRISH, W. P., Loy, H. W., AND KLINE, O. L. 1955 A studyof the yeast method for vitamin B6. J. Assoc. Offic. Agr.Chemists, 38, 506-513.
RAHN, 0. AND RICHARDSON, G. L. 1941 Oxygen demand andoxygen supply. J. Bacteriol., 41, 225-249.
REESE, E. T. AND EISENBERG, G. AM. 1949 Polymyxin:assay procedures. Ann. N. Y. Acad. Sci., 51, 968-979.
ROBERTS, E. C. AND SNELL, E. E. 1946 Improved medium
for microbiological assay with Lactobacillus casei. J.Biol. Chem., 163, 499-509.
SNELL, E. E. 1948 Use of microorganisms for assay of vita-mins. Physiol. Rev. 28, 255-282.
SNELL, E. E. 1950 Microbiological methods in vitamin re-search. Vitamin methods (ed. by P. Gy6rgy) Vol. 1, 327-505. Academic Press, Inc., New York, New York.
STAPERT, E. M. AND STUBBERFIELD, L. 1954 A note oncleaning culture tubes for the USP vitamin B12 micro-biological assay. J. Am. Pharm. Assn., Sci. Ed., 43, 382.
STOKSTAD, E. L. R., SEAMAN, G. R., DAVIS, R. T., AND HUT-NER, S. H. 1956 Assay of thioctic acid. Methods of bio-chemical analysis (ed. by D. Glick) Vol. 3, 23-47. Inter-science Publishers, Inc., New York, New York.
TOENNIES, G. AND GALLANT, D. L. 1948 Bacterimetricstudies. I. Factors affecting the precision of bacterialgrowth responses and their measurement. J. Biol. Chem.,174, 451-463.
TREFFERS, H. P. 1956 The linear representation of dosageresponse curves in microbial antibiotic assays. J. Bac-teriol., 72, 108-114.
WILLARD, H. H., MERRITT, L. L., JR., AND DEAN, J. A. 1949Instrumental methods of analysis. pp. 10-44. D. VanNostrand Company, Inc., New York, New York.
The Nonlogarithmic Rate of Thermal Destruction of Sporesof Bacillus coagulans" 2
HILMER A. FRANK3 AND L. LEON CAMPBELL, JR.
Laboratory of Food Microbiology, Department of Horticultutre, State College of Washington, Pullman, WVashington
Received for publication December 12, 1956
Mlany of the data concerning the destruction ofbacteria and their spores by deleterious agents havebeen presented with the assumption that the "logarith-mic order of death of bacteria" has been adequatelyvalidated (Bigelow, 1921; Esty and Williams, 1924;Rahn, 1945a, b; Stumbo et al., 1950; Lee, 1953; Schmidtet al., 1955; El-Bisi and Ordal, 1956a, b). Some investi-gators, however, have reported data which do notagree with this point of view (Falk and Winslow, 1926;Williams, 1929; Davis and Williams, 1948; Reed et al.,1951; Sugiyama, 1951; Reynolds and Lichtenstein,1952; Kaplan et al., 1953; La Baw and Desrosier, 1954).The concept of a logarithmic order of death has led to
1 Scientific Paper No. 1542 Washington Agricultural Ex-periment Stations, Pullman, Washington, Project Nos. 1222and 1290.
2 This investigation was supported in part by funds pro-vided for biological and medical research by the State ofWashington Initiative No. 171 and by a contract with the U. S.Department of Agriculture authorized by the Research andMarketing Act of 1946.
3 Postdoctoral Research Fellow of the National CancerInstitute, U. S. Public Health Service, 1955-1957.
the evolution of a useful tool, the death rate constantand its reciprocal, D, the thermal resistance value(Stumbo, 1948a). This constant, D, or its equivalent,has been used to express the resistance of an organismunder specified conditions and has been employed inthe derivation of methods for thermal process evalua-tion and calculation (Stumbo, 1949, 1953; Tischer andHurwicz, 1954; Levine, 1956).
This investigation was initiated as a result of observedinconstancy of the D values of a putrefactive anaerobe(PA) strain 3679 caused by changes in initial concentra-tion and/or length of heating time. Because of difficultyin obtaining accurate colony counts of this gas forminganaerobe, Bacillus coagulans strain 43 P was chosen asthe test organism for the rate of destruction studies.This organism exhibits no dormancy following heattreatment, thus survivors can be enumerated accuratelyby conventional plating procedures, and has fairlyheat resistant spores. Furthermore, Youland andStumbo (1953), using the "tube method," obtainedconstant D values with this strain of B. coagulans, for 4initial concentrations at 4 temperatures. The thermo-
7243
on April 6, 2020 by guest
http://aem.asm
.org/D
ownloaded from