microbial production of alkaline pectinase …etd.lib.metu.edu.tr/upload/12618355/index.pdf · in...
TRANSCRIPT

MICROBIAL PRODUCTION OF ALKALINE PECTINASE FROM
HAZELNUT SHELL
A THESIS SUBMITTED TO THE GRADUATE SCHOOL OF NATURAL AND APPLIED SCIENCES
OF MIDDLE EAST TECHNICAL UNIVERSITY
BY
SİBEL UZUNER
IN PARTIAL FULFILLMENT OF THE REQUIREMENTS FOR
THE DEGREE OF DOCTOR OF PHILOSOPHY IN
FOOD ENGINEERING
DECEMBER 2014


Approval of the thesis:
MICROBIAL PRODUCTION OF ALKALINE PECTINASE FROM HAZELNUT SHELL
submitted by SİBEL UZUNER in partial fulfillment of the requirements for the degree of Doctor of Philosophy in Food Engineering Department, Middle East Technical University by, Prof. Dr. Gülbin Dural Ünver _______________ Dean, Graduate School of Natural and Applied Sciences Prof. Dr. Alev Bayındırlı _______________ Head of Department, Food Engineering Assoc. Prof. Dr. Deniz Çekmecelioğlu _______________ Supervisor, Food Engineering Dept., METU Examining Committee Members: Prof. Dr. Faruk Bozoğlu _______________ Food Engineering Dept., METU Assoc. Prof. Dr. Deniz Çekmecelioğlu _______________ Food Engineering Dept., METU Prof. Dr. Alev Bayındırlı _______________ Food Engineering Dept., METU Assoc. Prof. Dr.Gülsün Evrendilek _______________ Food Engineering Dept., Abant Izzet Baysal University Assoc. Prof. Dr. Irfan Turhan _______________ Food Engineering Dept., Akdeniz University
Date: 29.12.2014

iv
I hereby declare that all information in this document has been obtained and presented in accordance with academic rules and ethical conduct. I also declare that, as required by these rules and conduct, I have fully cited and referenced all material and results that are not original to this work.
Name, Last name: Sibel Uzuner
Signature:

v
ABSTRACT
MICROBIAL PRODUCTION OF ALKALINE PECTINASE FROM HAZELNUT SHELL
Uzuner, Sibel
Ph. D., Department of Food Engineering
Supervisor : Assoc. Prof. Dr. Deniz Cekmecelioglu
December 2014, 217 pages
Utilization of cheap and abundant materials for enzyme production is one of the
strategies that can reduce the product costs. Besides, use of renewable agro-food
industrial wastes as a raw material provides not only low cost and sustainable value-
added products but also is a solution to waste disposal problem.
In this study, fermentation medium composition and conditions for maximal
production of pectinase enzyme from Bacillus subtilis in submerged fermentation
were investigated. The potential use of crude enzyme for clarification of carrot juice
was also evaluated. In order to enhance utilization of the hazelnut shells as carbon
source in pectinase production, various pretreatment methods including dilute acid,
alkaline, and ozone pretreatments were tested prior to enzymatic hydrolysis step.
After conversion of hazelnut shells to fermentable sugars, the “Plackett-Burman”
(PB) design was used for screening of the eight factors; pH, fermentation time,
temperature, inoculum volume (%v/v) and of pectin, yeast extract (YE), magnesium
sulphate [MgSO4], and dipotassium hydrogen phosphate [K2HPO4]. Five variables
(pH, time, temperature, yeast extract concentration and K2HPO4), which were
determined to be significant by PB design, were further optimized using Box-
Behnken response surface method to maximize the PG activity.

vi
The produced crude enzyme was tested in clarification of carrot juice, highly
nutritious and worldwide consumed food material, afterwards. The carrot juice was
treated with different concentration of crude pectinase (0.1-0.5%), pH (4-7), and
time (2-6 h) for clarification.
Among the pretreatment methods tested, the dilute acid pretreatment (3.42 (w/w)%
acid, 31.7 min, 130 oC) was chosen the best with higher sugar conversion (62.8%
saccharification yield) than sodium hydroxide and ozone pretreatment methods.
The pectinase optimization results indicated that a maximal PG activity of 5.60
U/mL was achieved at pH 7.0, 72 h, and 30 oC using 0.5% (w/v) of yeast extract
and 0.02% (w/v) of K2HPO4.
The results of clarification revealed that 100% clarity was achieved at 0.5% (w/v)
enzyme load, 7.0 pH, and 6 h of clarification yield (%) with commercial enzyme
reached only 78.18±3.14 %.
This study also proved that crude enzyme was equally effective as the purified
commercial enzyme.
Keywords: Alkaline pectinase enzyme, bioconversion, carrot juice, depectinization,
optimization

vii
ÖZ
FINDIK KABUĞUNDAN MİKROBİYAL ALKALİ PEKTİNAZ ÜRETİMİ
Uzuner, Sibel
Doktora, Gıda Mühendisliği Bölümü
Tez Yöneticisi: Doç. Dr. Deniz Çekmecelioğlu
Aralık 2014, 217 sayfa
Enzim üretiminde ucuz ve bol bulunan maddelerin kullanımı ürün maliyetini
düşürebilecek stratejilerden biridir. Üstelik ham madde olarak yenilenebilir gıda-
tarım atıklarının kullanımı yalnızca düşük maliyetli ve sürdürülebilir katma değerli
ürünler sağlamakla kalmaz aynı zamanda atık tasfiyesi için de çözüm
olabilmektedir.
Bu çalışmada, Bacillus subtilis kullanarak derin kültür fermentasyon yönteminde
pektinaz enzimi üretimini arttırmak amacıyla fermentasyon ortam kompozisyonu
ve koşulları araştırılmıştır. Ham enzimin havuç suyunu berraklaştırma potansiyeli
de değerlendirilmiştir. Pektinaz üretiminde fındık kabuğunun karbon kaynağı
olarak kullanımını iyileştirmek amacıyla enzimatik hidroliz öncesi seyreltik asit,
alkali ve ozon gibi farklı ön işlemler denenmiştir.
Fındık kabuklarının fermente edilebilir şekerlere dönüştürülmesinden sonra, pH,
fermentasyon süresi, sıcaklık, inokulüm hacmi (%v/v), pektin, maya özütü,
magnezyum sülfat [MgSO4] ve dipotasyum hidrojen fosfat [K2HPO4] derişimi gibi
8 faktörün etkilerini araştırmada “Plackett-Burman” (PB)’ tasarımı kullanılmıştır.
PB tasarımıyla önemli bulunan beş faktör (pH, zaman, sıcaklık, maya özütü
derişimi ve K2HPO4 derişimi), PG aktivitesini arttırmak amacıyla Box-Behnken
yüzey yanıt yöntemiyle optimize edilmiştir.
viii
Üretilen ham enzim daha sonar oldukça besleyici ve en çok tüketilen gıdalardan
biri olan havuç suyunu berraklaştırmada denenmiştir. Havuç suyu, farklı ham enzim
derişimi (0.1-0.5%), 4-7 pH ve 2-6 saat süre ile muamele edilmiştir.
Denenen ön işlemler arasında sodyum hidroksit ve ozondan daha yüksek şeker
dönüşümü değerlerine (% 62.8 sakarifikasyon verimi) sahip olan seyreltik asit ön
işlemi (%3.42 asit, 31.7 dakika, 130 oC) en iyi yöntem olarak seçilmiştir.
Pektinaz optimizasyon sonuçları, pH 7.0, 30 oC, 50.5 maya özütü, % 0.02 K2HPO4
ve 72 saat sonunda en yüksek PG aktivitesinin 5.60 U/mL olduğunu göstermiştir.
En yüksek berraklaştırma verimi %0.5 enzim ile pH 7.0 ve 6 saat süre sonunda %
100 olarak elde edilirken, ticari enzim ile berraklaştırma verimi % 78.18±3.14’e
ulaşmıştır.
Ayrıca, bu çalışma ham enzimin saflaştırılmış ticari enzimle aynı derecede etkili
olduğunu da kanıtlamıştır.
Anahtar Kelimeler: Alkali pektinaz enzimi, biyodönüşüm, havuç suyu, enzimatik
durultma, optimizasyon

ix
To my beloved parents…

x
ACKNOWLEDGEMENTS
First and foremost, my deepest gratitude is to my advisor, Assoc. Prof. Dr. Deniz
Çekmecelioğlu for his endless support, understanding and encouragement
throughout this study. I have been privileged to have an advisor who gave me the
freedom to explore on my own.
I would like to express sincere thanks to Assoc. Prof. Dr. Ratna Sharma Shivappa
for her great support, hospitality, kindness, and providing a great laboratory
environment during my reseaarch at North Carolina University Agricultural and
Biological Engineering Department.
I would like to express my appreciation to my Ph.D. Examining Committee
members, Prof. Dr. Alev Bayındırlı and Assoc. Prof. Dr. Gülsün Akdemir
Evrendilek for their enlightening comments and directions.
I would like to thank METU Council of Scientific Research, (BAP-03-14-2011-
002) for funding this study, and Department of Food Engineering, METU for
experimental support and to The Scientific and Technological Council of Turkey
for granting the Science Fellowships and Grant Program (TÜBİTAK-BIDEB)
during my research study.
I owe a debt of gratitude to my lab friend and office mate Ali Übeyitoğulları who
actually suffered with me especially during writing my thesis. I am thankful to the
valuable members of our research group, Abduvali Valiev, Oya Nihan Uncu, Gözde
Ören Yardımcı and Önay Burak Doğan for their support and invaluable assistance.
I would also like to thank to all my colleagues and friends; Elif Yolaçaner, Alev
Emine İnce, Özlem Yüce, Armağan Cabadağ, Hande Baltacıoğlu, Sezen Sevdin,
Ece Bulut, and Sinem Acar, for their friendship and the invaluable stimuli that made
me focus on my work again. Life would be boring without them.

xi
I would like to express my deepest and biggest appreciation to my parents, Sema-
Erol Uzuner and also to my sister, Selin Uzuner. I would like to thank them for
always believing in me.

xii
TABLE OF CONTENTS
ABSTRACT ............................................................................................................ v
ÖZ .......................................................................................................................... vii
ACKNOWLEDGEMENTS .................................................................................... x
TABLE OF CONTENTS ...................................................................................... xii
LIST OF TABLES ............................................................................................. xviii
LIST OF FIGURES .............................................................................................. xxi
LIST OF ABBREVIATIONS ............................................................................. xxv
CHAPTERS
1. INTRODUCTION ............................................................................................... 1
2. LITERATURE REVIEW .................................................................................... 5
2.1 Pectin ........................................................................................................ 5
2.2 Pectinolytic Enzymes (Pectinases) .......................................................... 6
2.2.1 Application of Pectinases ...................................................................... 8
2.3 Pectinase Production ................................................................................. 8
2.3.1 Production of Pectinases Using Agro-Industrial Wastes .................... 13
2.4 Usability of Hazelnut By-Product As An Agro-Industrial Wastes ......... 14
2.5 Conversion of Lignocellulosic Biomass to Fermentable Sugars ............ 16
2.6 Pretreatment Methods for Lignocellulosic Biomass ............................... 19
2.6.1 Physical Methods ................................................................................ 20
2.6.2 Physical-Chemical Methods ................................................................ 21
2.6.3 Chemical Methods............................................................................... 22
2.6.4 Biological Methods ............................................................................. 24

xiii
2.7 Formation of Fermentation Inhibitors .................................................... 24
2.7.1 Sugar Degradation Products ............................................................... 25
2.7.2 Lignin Degradation Products .............................................................. 26
2.8 Elimination of Inhibitors from Fermentation Medium ........................... 26
2.9 Enzymatic Hydrolysis ............................................................................ 28
2.10 Optimization of Pectinase Production .................................................... 29
2.11 Objectives of The Study ......................................................................... 31
3. MATERIALS AND METHODS ...................................................................... 33
3.1 Materials ................................................................................................. 33
3.1.1 Lignocellulosic Biomass ..................................................................... 33
3.1.2 Microoganisms, Growth and Fermentation Media ............................. 33
3.1.3 Chemicals and Enzymes .................................................................... 34
3.1.4 Buffers and Solutions......................................................................... 34
3.2 Methods .................................................................................................. 34
3.2.1 Analytical Methods ............................................................................. 34
3.2.1.1 Chemical Analysis of Biomass ................................................ 34
3.2.1.1.1 Moisture Content ............................................................................. 35
3.2.1.1.2 Ash Content ..................................................................................... 35
3.2.1.1.3 Amount of Extractives .................................................................... 36
3.2.1.1.4 Fat Content ...................................................................................... 36
3.2.1.1.5 Crude Fiber ..................................................................................... 36
3.2.1.1.6 Cellulose and Hemicellulose Content ............................................. 37
3.2.1.1.7 Acid Insoluble (Klason) and Acid Soluble Lignin Content ............ 38
3.2.2 Total Reducing Sugar ......................................................................... 40
3.2.3 Inhibitory Compounds ........................................................................ 40
3.2.4 Pectinase Assay................................................................................... 40

xiv
3.2.5 Determination of Cell Density ............................................................ 41
3.2.6 Determination of Protein Content .................................................... 41
3.2.7 Clarity Test (%) ................................................................................... 42
3.2.8 Pectin Degradation (Alcohol test) Test ............................................... 42
3.3 Pretreatment Methods ............................................................................. 43
3.3.1 Dilute-Acid Pretreatment .................................................................... 43
3.3.1.1 Solid/liquid Ratio ................................................................................... 46
3.3.2 Alkaline Pretreatment .......................................................................... 46
3.3.3 Ozone Pretreatment ............................................................................. 47
3.4 Enzymatic Hydrolysis ............................................................................. 48
3.5 Pectinase Production By Submerged Fermentation (SmF) .................... 49
3.5.1 Effect of Substrate Type ...................................................................... 50
3.5.2 Effect of pH on Pectinase Activity and Stability ................................ 51
3.5.3 Effect of Temperature on Pectinase Activity and Stability ................. 51
3.6 Extraction of Carrot Juice ....................................................................... 51
3.7 Experimental Design ............................................................................... 52
3.7.1 Experimental Design for Dilute Acid Pretreatment ............................ 52
3.7.1.1 The Conventional One Factor At A Time Approach ........................ 53
3.7.1.2 Response Surface Methodology ....................................................... 53
3.7.1.2.1 Model Validation ............................................................................. 55
3.7.1.3 Artificial Neural Network (ANN) Modeling .................................... 56
3.7.2 Optimization of Alkaline Pretreatment ............................................... 58
3.7.3 Experimental Design and Optimization of Ozone Pretreatment ......... 60
3.7.3.1 BBD Design .................................................................................... 61
3.7.3.2 Full-Factorial Design .................................................................. 63
3.7.4 Optimization of Pectinase Production ................................................. 63

xv
3.7.4.1 Plackett Burman Design (PBD) ....................................................... 64
3.7.4.2 BBD Design and Optimization .................................................. 67
3.7.5 Optimization of Clarification Process................................................. 70
3.8 Statistical Analysis ................................................................................. 71
3.9 Cost Analysis .......................................................................................... 72
4. RESULTS AND DISCUSSION ....................................................................... 73
4.1 Composition of Raw Material ................................................................ 73
4.2 Effect of Pretreatment Methods on Fermentable Sugar Production ....... 74
4.2.1 Effect of Dilute Acid Pretreatment ..................................................... 74
4.2.1.1 Effect of Particle Size on Reducing Sugar Concentration................ 74
4.2.1.2 Effect of Solid/Liquid Ratio On Reducing Sugar Yield ................... 75
4.2.1.3 Screening The Factors Affecting Dilute Acid Pretreatment............. 76
4.2.1.4 Response Surface Optimization ........................................................ 81
4.2.1.5 Artificial Neural Network (ANN) Modeling .................................... 93
4.2.1.5.1 Training Data Set ........................................................................... 93
4.2.1.5.2 Testing of Data Set ......................................................................... 96
4.2.1.5.3 Comparison of RSM and ANN ..................................................... 96
4.2.1.6 Combined Dilute Acid Pretreatment and Enzymatic Hydrolysis ..... 99
4.2.1.7 Effect of Dilute Acid Pretreatment on Amount of Inhibitory
Compounds ...................................................................................................... 103
4.2.2 Effect of Alkaline Pretreatment ........................................................ 105
4.2.2.1 Alkaline Pretreatment of Hazelnut Shells and Response Surface
Modeling for Optimization .............................................................................. 109
4.2.2.1.1 Effect of Alkali Pretreatment Conditions on Solid Recovery ..... 109
4.2.2.1.2 Effect of Alkali Pretreatment Conditions on Delignification .......... 115

xvi
4.2.2.1.3 Effect of Alkali Pretreatment Factors on Reducing Sugar Yield
Combined with Enzymatic Hydrolysis ............................................................ 119
4.2.3 Effect of Ozone Pretreatment ............................................................ 125
4.2.3.1 Effect of Ozonolysis on Biomass Recovery in Hazelnut Shell........ 125
4.2.3.2 Effect of Ozonolysis on Lignin Content in Hazelnut Shell ............ 125
4.2.3.3 Effect of Ozonolysis on Enzymatic Saccharification ..................... 128
4.2.4 Comparison of All Pretreatment Methods .............................................. 131
4.3 Selection of the Best Carbon Source of PG Production by B.subtilis ....... 132
4.4 Evaluation of Key Variables Affecting Enzyme Production ..................... 133
4.4.1. Plackett Burman Design (PBD) ............................................................. 133
4.4.2 Effect of Fermentation Time .............................................................. 140
4.4.3 Optimization of Fermentation Medium Components and Conditions for
Pectinase Production by Response Surface Method (RSM) ............................ 141
4.4.3 Biochemical Characterization of the Crude Pectinase ...................... 150
4.4.3.1 Effect of pH on The Activity and Stability of Pectinase ................ 150
4.4.3.2 Effect of Temperature on Pectinase Activity and Stability ........... 152
4.4.3.3 Molecular Weight of Pectinase ....................................................... 154
4.5 Application of Crude Pectinase in Carrot Juice Clarification ............... 155
4.5.1 Optimization of Clarification Variables Using Crude Pectinase Enzyme
...........................................................................................................156
4.5.2 Effects of Enzyme Concentration, pH and Time .............................. 159
5. CONCLUSIONS ............................................................................................. 165
6. RECOMMENDATIONS ................................................................................ 167
REFERENCES .................................................................................................... 169
APPENDICES
A. CHEMICALS, ENZYMES AND SUPPLIER INFORMATION .................. 187

xvii
B. COMPOSITION OF BUFFERS AND SOLUTIONS ................................... 189
C. STANDARD CURVE FOR TOTAL REDUCING SUGAR ......................... 191
D. STANDARD CURVE FOR TOTAL PHENOLIC COMPOUNDS .............. 193
E. STANDARD CURVE FOR ENZYME ACTIVITY ...................................... 195
F. GROWTH CURVE OF Bacillus spp. ............................................................. 197
G. LOWRY PROTEIN ASSAY ......................................................................... 199
H. SAMPLE HPLC CHROMATOGRAM ......................................................... 201
I. ANOVA RESULTS OF ALKALI PRETREATMENT .................................. 203
J. PARETO CHART OF PLACKETT BURMAN DESIGN ............................. 205
K. ANOVA RESULTS OF PECTINASE ACTIVITY ...................................... 207
L. CONTOUR PLOTS OF PECTINASE PRODUCTION ................................ 209
M. ANOVA RESULTS OF CLARIFICATION OF CARROT JUICE ............. 211
VITA ................................................................................................................... 213

xviii
LIST OF TABLES
TABLES
Table 2.1 Composition of pectin in different fruits and vegetables ........................ 5
Table 2.2 Pectinases produced by microorganisms ................................................ 9
Table 2.3 List of commercial pectinases, their suppliers ...................................... 10
Table 2.4 Microbial sources of alkaline pectinases and their applications ........... 12
Table 2.5 Composition of some agricultural lignocellulosic materials ................ 15
Table 2.6 Advantages and disadvantages of different pretreatment methods of
lignocellulosic biomass ......................................................................................... 18
Table 2.7 Origin of various inhibitors and their maximum allowable concentrations
for ethanol fermentation ........................................................................................ 27 Table 3.1 Coded and uncoded variables of dilute acid pretreatment by Box-
Behnken surface design ......................................................................................... 54
Table 3.2 Coded and uncoded variables of alkaline pretreatment by using response
surface design. ....................................................................................................... 59
Table 3.3 Box-Behnken design matrix for identifying key process variables ...... 62
Table 3.4 Experimental levels of the variables studied in the full factorial design
............................................................................................................................... 63
Table 3.5 Coded and uncoded variables of independent factors in PBD.............. 65
Table 3.6 Plackett Burman Design for screening major factors of pectinase
production. ............................................................................................................. 66
Table 3.7 Experimental design for optimization of pectinase production using Box-
Behnken response surface method (RSM). ........................................................... 68
Table 3.8 Coded and uncoded variables of clarification by using response surface
design ..................................................................................................................... 70 Table 4.1 Constituents of the hazelnut shell used in the experiments, expressed as
percent of wet basis. .............................................................................................. 73

xix
Table 4.2 Reducing sugar concentration with respect to particle size (3.42%, w/w,
acid, 130 oC, 31.7 min). ........................................................................................ 75
Table 4.3 Saccharification yields for various agro-residues at different dilute acid
pretreatment conditions. ........................................................................................ 80
Table 4.4 Significance of term coefficients for BBD using coded values; X1:
Temperature (oC); X2: Acid Concentration (w/w); X3:Time (min) ……………...82
Table 4.5 ANOVA results for dilute acid pretreatment using coded values ..... ...83
Table 4.6 Experimental design for optimization of dilute acid pretreatment using
response surface method (RSM) ........................................................................... 84
Table 4.7 Verification experiments of dilute acid pretreatments ......................... 91
Table 4.8 Artificial neural network (ANN) models and their MSE, R2 and RPD
values from training data ....................................................................................... 94
Table 4.9 Performance of Neural Network model ............................................... 96
Table 4.10 BBD matrix of three factors and experimental data, RSM and ANN for
determined values of maximum reducing sugar concentration............................. 97
Table 4.11 Dilute acid pretreatment of various agro-residues for the production of
hemicellulosic-derived products. ........................................................................ 104
Table 4.12 Total reducing sugar of hazelnut shell pretreated with different NaOH
concentration at different temperatures for 24 h ................................................. 107
Table 4.13 Total reducing sugar of hazelnut shell pretreated with different NaOH
concentration, time and solid-liquid ratio at 121 oC, 15 psi (autoclave). ............ 108
Table 4.14 BBD matrix of conditions for alkali pretreatment of hazelnut shells and
corresponding solid recovery (%) and lignin reduction (%) ............................... 110
Table 4.15 ANOVA results and estimated regression coefficients for the coded
solid recovery model ........................................................................................... 111
Table 4.16 ANOVA results and estimated regression coefficients for the coded
lignin reduction model ........................................................................................ 116
Table 4.17 Comparison of reducing sugars recovered in pretreated hazelnut shell
solids and reducing sugar yield after enzymatic hydrolysis(E.H)....................... 121
Table 4.18 Box-Behnken design matrix* for identifying key process variables and
solid recovery (%), acid insoluble lignin (%) and total reducing sugar (mg/g) in
ozone treated samples. ........................................................................................ 127

xx
Table 4.19 Total reducing (RD) sugar* from saccharification of hazelnut shell
pretreated with ozonolysis. .................................................................................. 129
Table 4.20 Analysis of variance results for reducing sugar production based on full
factorial design conditions ................................................................................... 130
Table 4.21 Independent variables with their coded and uncoded levels used in PBD
............................................................................................................................. 134
Table 4.22 Plackett Burman Design for screening of factors for B.subtilis and
B.pumilus ............................................................................................................. 136
Table 4.23 pH value and pectin substances of various fruit/vegetables ............. 137
Table 4.24 Regression analysis* for Plackett Burman design variables for B.subtilis
............................................................................................................................. 138
Table 4.25 Plackett Burman Design for screening of factors for B.subtilis ....... 139
Table 4.26 Experimental design for optimization of pectinase production using
response surface method (RSM) ......................................................................... 142
Table 4.27 ANOVA results of BBD in coded values ......................................... 144
Table 4.28 Summary of the Pectinase Concentration from B.subtilis ................ 156
Table 4.29 BBD experimental design (in coded variables) employed for
clarification of carrot juice .................................................................................. 156
Table 4.30 ANOVA results and estimated regression coefficients for the coded
clarification of carrot juice model ....................................................................... 158
Table I.1 Revised ANOVA table of alkali pretreatment for solid recovery ....... 203
Table I.2 Revised ANOVA table of alkali pretreatment for lignin reduction .... 204 Table K.1 Revised ANOVA table of pectinase activity ..................................... 207
Table M.1 Revised ANOVA table of clarification of carrot juice .......................211

xxi
LIST OF FIGURES
FIGURES
Figure 2.1 Mode of action of pectinases ................................................................ 7
Figure 2.2 Action of pretreatment on lignocellulosic biomass ............................ 17
Figure 2.3 Classification of lignocellulose-pretreatment methods....................... 20 Figure 3.1 Schematic of dilute acid pretreatment set up ...................................... 43
Figure 3.2 Flow chart of dilute acid pretreatment method. .................................. 45
Figure 3.3 Schematic of ozonolysis reactor set up .............................................. 48
Figure 3.4 Schematic of pectinase production steps ............................................ 50
Figure 3.5 Flow chart of carrot juice extraction and clarification processes ....... 52 Figure 4.1 Reducing sugar yield with respect to solid/liquid ratio (3%, w/w, acid,
130 oC, 30 min) ..................................................................................................... 76
Figure 4.2 Hydrolysis of hazelnut shell at various temperatures (3%, w/w, 37.5
min) ....................................................................................................................... 77
Figure 4.3 Hydrolysis of hazelnut shell at various acid concentrations (130 oC, 37.5
min) ....................................................................................................................... 78
Figure 4.4 Hydrolysis of hazelnut shells at various time (130 oC, 3%, w/w, acid)
............................................................................................................................... 79
Figure 4.5 Response surface plot for the effects of acid concentration, and time on
reducing sugar (temperature is constant at 120 °C) .............................................. 86
Figure 4.6 Response surface plot for the effects of temperature and time on
reducing sugars (acid concentration is constant at 3%, w/w). .............................. 87
Figure 4.7 Response surface plot for the effects of temperature and acid
concentration on reducing sugars (time is constant at 37.5 min). ......................... 88
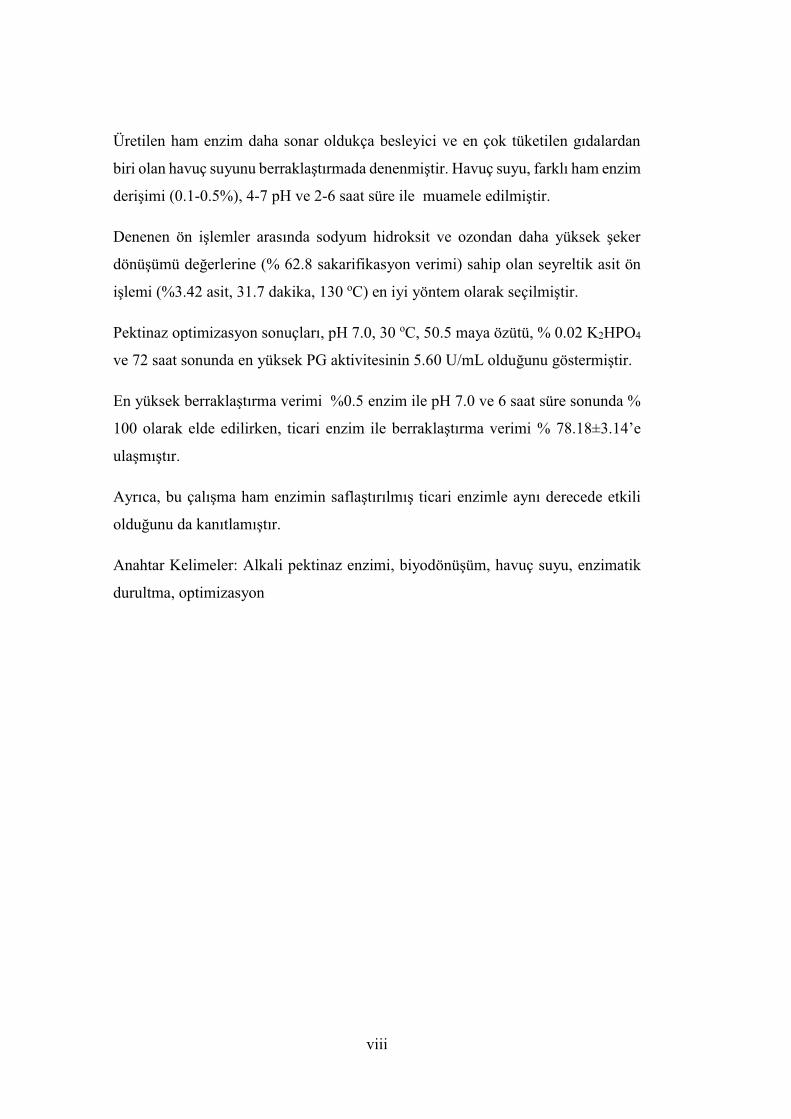
Figure 4.8.a Contour plots showing interactive effect of time and acid
concentration (%, w/w) on reducing sugar concentration ..................................... 89

xxii
Figure 4.8.b Contour plots showing interactive effect of time and temperature on
reducing sugar concentration
……………………………………...........................……………....................….89
Figure 4.8.c Contour plots showing interactive effect of acid concentration (%,
w/w) and temperature on reducing sugar concentration ........................................ 92
Figure 4.9 Predicted vs. experimental reducing sugar concentration for validation
of the response surface model. .............................................................................. 92
Figure 4.10 Schematic representation of ANN to simulate the dilute acid
pretreatment of hazelnut shells. ............................................................................. 95
Figure 4.11 Combined training, validation and testing predicted versus actual
experimental values for an ANN with 6 neurons in the hidden layer and RSM ... 98
Figure 4.12 Effect of solid/liquid ratio on the enzymatic hydrolysis time of hazelnut
shells. ..................................................................................................................... 99
Figure 4.13 Enzymatic hydrolysis at various solid concentration (5, 10 and 15% )
of hazelnut shell and enzyme loadings (50 oC, pH 5.0, 20 h at 130 rpm) .......... 101
Figure 4.14 Acid hydrolysis and combination of acid and enzymatic hydrolysis at
5% solid concentration and various enzyme loadings (50 oC, pH 5.0, 20 h at 130
rpm) ..................................................................................................................... 102
Figure 4.15 Response surface plots for the effects of alkaline pretreatment
conditions on solid recovery ................................................................................ 113
Figure 4.16 Experimental versus RSM predicted values for solid recovery (%)114
Figure 4.17 Response surface plots for the effects of alkaline pretreatment
conditions on lignin reduction ............................................................................. 117
Figure 4.18 Experimental versus RSM predicted values for lignin reduction (%)
............................................................................................................................. 123
Figure 4.19 Response surface plots for the effects of alkaline pretreatment
conditions on reducing sugar yield (g/g dry biomass) ......................................... 123
Figure 4.20 Experimental versus RSM predicted values for total reducing sugar
yield (g/g dry biomass) ........................................................................................ 124
Figure 4.21 Effect of Carbon sources on PG activity at 30 oC pH 7.0 and 130 rpm
after 72 h fermentation ........................................................................................ 124

xxiii
Figure 4.22 Time course of pectinase production by B.subtilis at pH 7.0, 30 oC and
with shaking at 130 rpm. ..................................................................................... 124
Figure 4.23 Surface plots showing the effect of a) [K2HPO4] and yeast extract
concentration, b) [K2HPO4] and time, c) [K2HPO4] and pH, d) [K2HPO4] and
temperature, e) yeast extract concentration and time, f) yeast extract concentration
and temperature, g) yeast extract concentration and pH, h) time and temperature, i)
time and pH and j) temperature and pH on pectinase production. ...................... 147
Figure 4.24 Effect of pH on the pectinase activity ............................................. 151
Figure 4.25 Effect of pH on the pectinase activity ............................................. 152
Figure 4.26 Temperature dependence of pectinase activity ............................... 153
Figure 4.27 Temperature dependence of pectinase stability .............................. 154
Figure 4.28 Surface plots showing the effect of pH and time on clarification of
carrot juice ........................................................................................................... 160
Figure 4.29 Surface plots showing the effect of enzyme concentration and time on
clarification of carrot juice. ................................................................................. 161
Figure 4.30 Surface plots showing the effect of enzyme concentration and pH on
clarification of carrot juice. ................................................................................. 162
Figure 4.31 Verification of the model obtained by RSM ................................... 163 Figure C.1 The standard curve for DNS method ............................................... 191
Figure D.1 Gallic acid standard curve for determination of total phenol content
............................................................................................................................. 193
Figure E.1 D-Galacturonic acid standard curve for determination of enzyme
activity ................................................................................................................. 195
Figure F.1 Growth curve of B.subtilis................................................................ 197
Figure F.2 Growth curve of B.pumilus .............................................................. 197
Figure G.1 BSA standard curve used in Lowry Method for the determination of
total protein concentration................................................................................... 199
Figure H.1 Chromatograms: A: furfural standard, B: After acid hydrolysis. .... 201
Figure H.2 Chromatograms: A: HMF and acetic acid, B: After acid hydrolysis
............................................................................................................................. 201
Figure J.1 Pareto chart of Plackett Burman Design for B.subtilis ..................... 205

xxiv
Figure L.1 Contour plots showing the effect of a) [K2HPO4] and yeast extract
concentration, b) [K2HPO4] and time, c) [K2HPO4] and pH, d) [K2HPO4] and
temperature, e) yeast extract concentration and time, f) yeast extract concentration
and temperature, g) yeast extract concentration and pH, h) time and temperature, i)
time and pH and j) temperature and pH on pectinase production ....................... 209

xxv
LIST OF ABBREVIATIONS
AIL Acid Insoluble Lignin
ASL Acid Soluble Lignin
AFEX Ammonia Fiber Explosion
ANN Artificial Neural Network
ANOVA Analysis Of Variance
BBD Box Behnken Design
BSA Bovine Serum Albumin
DNA Deoxyribonucleic Acid
DNS 3,5-dinitrosalicylic Acid
FPU Filter Paper Unit
GRAS Generally Regarded As Safe
HMF Hydroxymethylfurfural
HPLC High Performance Liquid Chromatography
kDa Kilo Dalton
LHW Liquid Hot Water
MAE Mean Absolute Error
MLP Multi-layer Perceptron
MSE Mean Squared Error
NaOH Sodium Hydroxide
NRRL Northern Regional Research Laboratory
OPEFB Oil Palm Empty Fruit Bunch Fiber
PAL Pectic Acid Lyases
PATE Pectic Acid Trans Eliminase
PBD Plackett Burman Design
PE Pectin Esterases

xxvi
PG Polygalacturonase
PGL Polygalacturonate Lyases
PMG Polymethylgalacturonase
PMGL Polymethylgalacturonate Lyases
RMSE Root Mean Square Error
RPD Root Percent Deviation
RSM Response Surface Methodology
Rpm Revolutions per Minute
SDS-PAGE Sodium Dodecyl Sulfate Polyacrylamide Gel Electrophoresis
SLR Solid-liquid Ratio
SmF Submerged Fermentation
SSF Solid-state Fermentation
U Unit

1
CHAPTER 1
INTRODUCTION
Enzymes are key components of textile, paper, pulp, pharmaceutical and food
industries. The total value of the food and beverage enzyme market is estimated as
$320 million in 2013. Among the food enzymes, pectinases (or pectinolytic
enzymes) account for 25% of food enzymes which are produced from microbial
sources. Pectinases are also used in diverse applications such as extraction and
clarification of fruit juices (Lee et al., 2006; Sandri et al., 2011), bleaching of paper
pulp (Ahlawat et al., 2008), degumming of fibers (Sharma & Satyanarayana, 2012),
oil extraction (Najafian et al., 2009), coffee and tea fermentation (Kashyap et al.,
2001; Murthy &Naidu, 2011). One of the drawbacks of pectinase application in
food, pharmaceutical and chemical industry is their high cost. Therefore it is of
great importance to reduce the cost of enzyme production and optimize enzyme
production conditions in order to meet the increasing demand. Production of
enzymes with low production cost is still a new challenge area. A significant cost
reduction may be achieved by using high yielding strains, optimal fermentation
conditions and cheap raw materials as a carbon source for growing microorganisms.
Various agro-industrial by-products can be successfully utilized for microbial
pectinolytic enzyme production since these by-products are relatively inexpensive,
renewable, and widely available in nature. The agro-industrial byproducts are
composed of complex polysaccharides, which are used for microbial growth to
enhance the production of industrially important enzymes. The agro-industrial
byproducts consist of many and varied wastes from agriculture and food industry,
which in total account for over 25 million tonnes of waste per year in Turkey. These
by-products still have a limited industrial use and cause potential environmental
threat. Identification and bioconversion of new locally available agro-wastes is

2
advantageous to enhance both economic and environmental benefits. From the
biotechnological point of view, a wide variety of hazelnut shells, which can be
potential source of sugars such as xylose and glucose are available as potential
candidate for production of value added bioproducts like bio-ethanol/bio-fuels,
enzyme, organic acids, etc. The classification, mechanism and application of
pectinolytic enzymes are well described and the definition of pectinases produced
from fungal and bacterial sources are reviewed in Chapter 2.
To best of our knowledge no work has been reported on pectinase production from
hazelnut shells as carbon source using Bacillus subtilis, which adds extra novelty
to our work. Therefore, this thesis will be one of the initial studies working in this
field.
The hypothesis is if a more fermentable sugar is recovered from hazelnut shells,
then B.subtilis will grow faster and produce more PG activity. The goal of this
research was to study the potential and performance of biomass product for
pectinase production and to increase pectinase activity through increasing
fermentable sugar recovery with high-efficiency pretreatment methods such as acid,
alkali and ozone. Dilute acid, alkaline and ozone as pretreatment methods were used
to increase sugar recovery from hazelnut shells. The effect of pretreatment on
enzymatic hydrolysis, final sugar yield, and pectinase fermentation were studied.
All of the pretreatment methods used in this study were optimized with respect to
total reducing sugar yield (Chapter 3).
Fermentation medium and conditions were screened to select important factors
which affect pectinase production. The key factors of fermentation medium and
conditions for submerged fermentation are mentioned in Chapter 3. To investigate
the clarification step, an experimental design was also set up and its results were
analyzed with the statistical tools in Chapter 3.
Enzyme production conditions were optimized according to selective factors such
as pH, time, temperature, yeast extract concentration and K2HPO4. Additionally,
the constructed model was numerically optimized and validated by selecting
various factors about pectinase production. The screening, optimization and

3
validation results of pectinase production are presented in Chapter 4. Furthermore
characterization of the enzyme with respect to its optimum pH and temperature and
the effect of these on the stability were also investigated and expressed in Chapter
4.
Raw juice is clarified to avoid turbidity, haze, and sediments in the final products
before commercialization. There are several studies on optimization of enzymatic
clarification of fruit juices using commercial pectinases of fungal origin. To the best
of our knowledge, there is not any report on optimization of enzymatic clarification
of fruit juices using crude pectinase produced from hazelnut shells. To determine
the effectiveness of crude pectinase, the parameters such as enzyme concentration,
temperature and time were optimized during clarification of carrot juice (Chapter
4).

4

5
CHAPTER 2
LITERATURE REVIEW
2.1 Pectin
Pectin is a complex polysaccharide made of linear chains of α-(1–4)-linked D-
galacturonic acid D-xylose (xylogalacturonan) or D-apiose (apiogalacturonan),
branching from the D-galacturonic acid backbone. They are important components
of cell wall and middle lamella, and can be found in fruits and vegetables (Saad et
al., 2007). The pectic substances account for about 0.5–4% of the weight of fresh
material (Table 2.1). The raw juice is rich in insoluble particles mainly made up of
pectic substances (Jayani et al., 2005).
Table 2.1 Composition of pectin in different fruits and vegetables (Jayani et al.
2005)
Fruit/Vegetable Tissue Pectic substance (%)
Apple Fresh 0.5-1.6
Orange pulp Dry matter 12.4-28.0
Strawberries Fresh 0.6-0.7
Banana Fresh 0.7-1.2
Peaches Fresh 0.1-0.9
Tomatoes Dry matter 2.4-4.6
Carrot Dry matter 6.9-18.6

6
2.2 Pectinolytic Enzymes (Pectinases)
Enzymes cleaving pectic substances are called pectinolytic enzymes or pectinases
which are of great industrial importance (Fogarty &Kelly, 1983; Saad et al., 2007).
Pectin provides strength and structure to plant cells (Kaur et al., 2004).
Pectinases can be classified as pectinesterases, depolymerizing enzymes and
protopectinases on the basis of their role in the degradation of pectin (Jayani et al.,
2005). Different pectic enzymes and their mode of action are illustrated in Figure
2.1. Pectinesterases or pectin methyl hydrolases (PE) catalyze hydrolytic removal
of the methyl ester group of pectin, forming pectic acid. Depolymerizing enzymes
are the enzymes hydrolyzing or cleaving glycosidic linkages (Kashyap et al., 2001).
Hydrolysis of glycosidic linkages requires polymethylgalacturonase (PMG) and
polygalacturonase (PG). PMG catalyzes the hydrolytic cleavage of α-1,4-glycosidic
bonds and is classified as endo-PMG that causes random cleavage of α-1,4-
glycosidic linkages of pectin, preferentially highly esterified pectin, and exo-PMG
that causes sequential cleavage of α-1,4-glycosidic linkage of pectin from the non-
reducing end of the pectin chain (Kashyap et al., 2001). PG which catalyzes
hydrolysis of α-1,4-glycosidic linkages in pectic acid (polygalacturonic acid), are
the most abundant pectinolytic enzymes (Jayani et al., 2005). This enzyme is also
classified as endo-PG, known as poly (1,4-α-D-galacturonide) glycanohydrolase,
which catalyzes random hydrolysis of α-1,4-glycosidic linkages in pectic acid and
exo-PG known as poly (1,4-α-D-galacturonide) galacturonohydrolase, catalyzes
hydrolysis in a sequential fashion of α-1,4-glycosidic linkages on pectic acid
(Kashyap et al., 2001).
Cleavage of α-1,4-glycosidic linkages by trans-elimination, which results in
galacturonide with an unsaturated bond between C4 and C5 at the non-reducing end
of the galacturonic acid is formed by polymethylgalacturonate lyases (PMGL) and
polygalacturonate lyases (PGL). PMGL catalyzing the breakdown of pectin by
trans-eliminative cleavage are classified as endo-PMGL, known as poly

7
(methoxygalacturonide) lyase, which catalyzes random cleavage of α-1,4-
glycosidic linkages in pectin, and exo-PMGL, which catalyzes stepwise breakdown
of pectin by trans-eliminative cleavage. On the other hand PGL catalyzing the
cleavage of α-1,4 glycosidic linkage in pectic acid by trans- elimination are also
classified as endo-PGL, known as poly (1,4-α-D-galacturonide) endolyase, which
catalyzes random cleavage of α-1,4-glycosidic linkages in pectic acid, and exo-
PGL, known as poly (1,4-α-D galacturonide) exolyase, which catalyzes sequential
cleavage of α-1,4-glycosidic linkages in pectic acid. Protopectinases solubilize
protopectin forming highly polymerized soluble pectin (Kashyap et al., 2001).
Figure 2.1 Mode of action of pectinases: (a) R = H for PG and CH3 for PMG; (b)
PE; and (c) R = H for PGL and CH3 for PL. The arrow indicates the place where
the pectinase reacts with the pectic substances. PMG, polymethylgalacturonases ;
PG, polygalacturonases ; PE, pectinesterase ; PL, pectin lyase (Jayani et al., 2005).
a)
b)
c)

8
2.2.1 Application of Pectinases
Pectinases have potential applications in fruit, paper and textile industries.
Pectinases are mainly used for increasing filtration efficiency and clarification of
fruit juices (Joslyn et al., 1952; Brawman, 1981) and used in maceration,
liquefaction and extraction of vegetable tissues (Charley, 1969; Bohdziewiez &
Bodzek, 1994). Pectinases play a crucial role in fruit juice industries in order to
increase fruit juice yield and clarity (Alkorta et al., 1988). Pectinases are used in
extraction and clarification of fruit juices (Lee et al., 2006; Sin et al., 2006; Sandri
et al., 2011), bleaching of paper pulp (Ahlawat et al., 2008), degumming of fibers
(Sharma & Satyanarayana, 2012), oil extraction (Najafian et al., 2009), coffee and
tea fermentation (Kashyap et al., 2001; Murthy & Naidu, 2011). Novel use of
pectinases in DNA extraction from plants and production of pectic oligosaccharides
as functional/prebiotic food components also emerges (Combo et al., 2012;
Sabajanes et al., 2012).
2.3 Pectinase Production
Pectinolytic enzymes are produced from plants and microorganisms such as
bacteria, yeasts and moulds (Khairnar et al., 2009). The major sources of plant
pectinases are tomatoes and oranges (Torres et al., 2005). In contrast to plant and
animal sources, pectinases derived from microorganisms have advantages such as
cheap production, easier gene manipulations, faster product recovery, free of
harmful substances over plant and animal derived pectinases (Chaudhri &
Suneetha, 2012). The important producers of pectinases as reported in the literature
are given in Table 2.2. Almost all the commercial pectinolytic enzymes are
produced by the fungi, namely, Aspergillus sp., Aspergillus japonicus, Rhizopus
stolonifer, Alternaria mali, Fusarium oxysporum, Neurospora crassa, Penicillium
italicum ACIM F-152, and many others (Jayani et al., 2005). Some of the bacterial

9
species producing pectinases are Agrobacterium tumefaciens, Bacteroides
thetaiotamicron, Ralstonia solanacearum, and Bacillus sp. (Jayani et al., 2005).
Table 2.2 Pectinases produced by microorganisms (Kashyap et al., 2001)
Microorganism Type of pectinase
Optimum
pH
Optimum temperature (oC)
Fungal pectinase
Aspergillus niger
CH4
Endo-pectinase
Exo-pectinase
4.5-6.0 < 50
Penicillium
frequentans
Endo-PG 4.5-4.7 50
Sclerotium rolfsii Endo-PG 3-5 55
Rhizoctonia solani Endo-PG 4.8 50
Mucor pusilus PG 5 40
Bacterial pectinase
Bacillus sp. RKG PGL 10.0 -
Bacillus sp. NT-33 PG 10.5 75
Bacillus polymxa PG 8.4-9.4 45
Bacillus pumilis PATE 8.0-8.5 60
Bacillus sp. DT7 PMGL 8.0 60
Bacillus subtilis PAL 9.5 60-65
PG: Polygalacturonase, PGL: Polygalacturonate lyase, PATE: Pectic acid
transeliminase, PMGL: Polymethyl galacturonate lyase, PAL: Pectic acid lyases

10
A few commercial pectinases have been launched successfully worldwide as shown
in Table 2.3.
Table 2.3 Commercial pectinases and their suppliers (Pedrolli et al., 2009)
Product Trade
Name
Supplier Source
Microorganism
Recommended
pH/Temp.
Action
Pattern
Grindamyl 3PA Danisco,
Denmark
A.niger 4.0/55 oC PL
Pectinase CCM Biocon, India A.niger 4.0/50 oC
6.0/40 oC
PG
PL
Pectinex 3XL Novozyme
Denmark
A.niger 4.7/50 oC
5.0-6.5/35 oC
PG
PL
Rapidase C80 Gist Brocades
Holland
A.niger 4.0/55 oC
6.0/40-45 oC
PG
PL
The production of pectinase from microorganisms involves the following steps:
isolation and screening of the microorganism, growth of microorganism on a
culture medium, fermentation, purification steps. Pectinolytic enzymes are
produced in two different methods: submerged fermentation (SmF) and solid-state
fermentation (SSF). Bacterial pectinases are generally alkaline in nature and are

11
carried out by SmF, since SSF is generally suitable for fungi which require a low
water activity (0.6) compared to bacteria (0.95). SSF provides higher enzyme yields
than SmF method (Pedrolli et al., 2009). However, the industrial application of SSF
suffers from complicated product purification resulting from heterogeneous
fermentation medium, difficulty of scale up, and losses of enzyme in the solid
residues (Gupta et al., 2008; Pedrolli et al., 2009). Besides, SSF requires long
fermentation periods (e.g. 5-6 days) (Ustok et al., 2007). SmF is easier to control at
a large scale and has been already successfully used for production of various
metabolites since 1940s. In SmF method, pectinase production can be remarkably
enhanced compared to SSF, although several studies have shown that SSF gives
higher enzyme yields. Some of the alkaline pectinases from microbial sources
documented in the literature are listed in Table 2.4. As can be seen from Table 2.4,
agro-food wastes were employed for production of alkaline pectinase using many
bacteria but especially Bacillus spp.
There are several studies comparing SmF to SSF and reporting promising enzyme
activity with SmF method (Rangarajan et al., 2010). Rangarajan et al. (2010)
compared pectinase production using Aspergillus niger in SmF and SSF methods
both in shaker flask and reactor levels using orange peel as carbon source and
varying amounts of organic and inorganic nitrogen sources. A maximal exo-
pectinase activity of 5128 U/g and endo-pectinase activity of 793 U/g were reported
with 4% soybean meal in SSF method, whereas maximal exo-pectinase activity of
5834 U/g and endo-pectinase activity of 951 U/g were achieved with SmF method
using 4% peptone and 3% soybean meal, respectively. A similar trend was reported
at reactor levels. Aspergillus niger has been used as pectinase producer in SmF
system by others (Mojsov, 2010; Zeni et al., 2011). Use of Bacillus species in
pectinase production by SmF resulted in promising results as reported by Sharma
and Satyanarayana (2006), Ahlawat et al. (2009), and Joshi et al. (2013).

12 12
T
able
2.4
Mic
robi
al so
urce
s of a
lkal
ine
pect
inas
es a
nd th
eir a
pplic
atio
ns
Mic
roor
gani
sm/
bact
eria
pH r
ange
Su
bstr
ate
Indu
stri
al a
pplic
atio
ns
Ref
eren
ce
B.po
lym
yxa
8.4-
9.4
Min
eral
e m
ediu
m
- (N
agel
& V
augh
n, 1
961)
B.pu
mili
s 8-
8.5
- -
(Dav
e &
Vau
ghn,
197
1)
B.su
btili
s 8.
5 C
arro
t V
eget
able
mec
erat
ion
(Che
sson
& C
odne
r, 19
78)
Baci
llus s
p.st
rain
s 6.
0-7.
0 W
heat
bra
n Fr
uit/v
eget
able
juic
e
extra
ctio
n
(Soa
res e
t al.,
200
1)
Baci
llus s
p.D
T-7
8 W
heat
bra
n, ri
ce b
ran
and
appl
e pu
ree
- (K
ashy
ap e
t al.,
200
3)
Baci
llus g
ibso
nii
7-12
Su
gar b
eet p
ulp
- (L
i et a
l., 2
005)
B.pu
milu
s dcs
r1
10.5
M
iner
ale
med
ium
-
(Sha
rma
& S
atya
nara
yana
,
2006
)
Baci
llus f
irm
us-I-
4071
6.
0 Po
tato
pee
l -
(Bay
oum
i et a
l., 2
008)
Baci
llus s
phae
ricu
s 6.
8 -
-
(Jay
ani e
t al.,
201
0)
Baci
llus s
ubtil
is C
M5
7.0
- C
arro
t jui
ce e
xtra
ctio
n
(Sw
ain
& R
ay, 2
010)

13
However, several researchers have reported enhanced enzyme production by
bacterial strains under SSF. Improved production of alkaline and thermotolerant
pectinase has been reported by Bacillus sp. DT7 under SSF using wheat bran
(Kashyap et al., 2003). Nadaroglu et al. (2010) investigated production of pectin
lyase by Bacillus pumilus (P9) using solid state fermentation. They also determined
the action of pectin lyase in fruit juice production. It was determined that yields of
fruits juices significantly improved compared with control.
Jayani et al. (2010) reported that Bacillus sphaericus, a bacterium isolated from
soil, produced a good amount of polygalacturonase activity (6.2 ±1.3 U/mL) after
72 h of incubation in production medium at 30°C and pH 6.8. Maximum enzyme
production was with citrus pectin as carbon source and with casein hydrolysate and
yeast extract together as nitrogen source (6.4±0.8 U/mL). Jayani et al. (2010)
suggested that this enzyme with good activity at neutral pH would be potentially
useful to increase the yield of banana, grape, or apple juice.
In the light of above, some of the researchers prefer to use some basal (synthetic)
medium to produce pectinase production. However, basal medium or
supplementary solutions may increase the cost of pectinase production. Therefore,
current studies have been focused on agro-food wastes as the low-cost materials.
2.3.1 Production of Pectinases Using Agro-Industrial Wastes
In the industrial market, pectinases occupy almost 25% of the global enzyme sales
(Jayani et al., 2005). Therefore in order to meet this high demand, it is highly
important to produce pectinase enzyme in a cost effective and productive way
(Gogus, 2006). Utilization of cheap and abundant materials for enzyme production
to reduce product costs is one of the critical issues that the researchers have recently
considered. Currently, degradation of the agricultural and food wastes by
microorganisms is popular for the production of valuable compounds such as

14
proteins, polysaccharides, oligosaccharides, vitamins, hormones, enzymes and
other raw materials for medicinal and industrial uses (El-Sheekh et al., 2009).
Decreasing the capital investment by using low cost agricultural and fruit
processing industrial waste as raw materials not only helpful to reduce the cost of
production but also aids in solving disposal problems (Patill & Dayanand, 2006).
Also for SmF to be commercially viable, pectinases have been produced on low
cost carbon sources such as citrus limetta peel (Joshi et al., 2013), orange peel
extract (Rangarajan et al., 2010), mix of apple pulp and corn flour (Mojsov, 2010),
wheat bran (Ahlawat et al., 2009), pumpkin oil cake (Pericin et al., 2007) and other
agricultural wastes. Selection of appropriate source of carbon, nitrogen and other
nutrients is also a critical stage in the development of an efficient and economic
enzyme production process (Sharma & Satyanarayana, 2012). Besides, 30-40% of
the enzyme production cost belongs to cost of the medium (Ustok et al., 2007).
Thus, the solid agricultural substances are effective source of carbon, nitrogen, and
minerals for enzyme production (Sharma & Satyanarayana, 2012).
2.4 Usability of Hazelnut By-Product As An Agro-Industrial Wastes
Lignocellulosic biomass is composed of three main components; cellulose,
hemicellulose and lignin. Cellulose is the most abundant, and comprises 35-50% of
the plant cell wall, whereas hemicellulose comprises 20-35%, and lignin comprises
12-37% (Yat et al., 2008). Hemicelluloses are heterogeneous and the composition
of hemicelluloses within a substance depends on that source. Hemicelluloses vary
significantly among hardwoods and softwoods according to the type and content in
the wood cell walls. Generally, hardwoods contain a high proportion of xylose units
and more acetyl groups than softwoods. By contrast, softwoods have a high
proportion of mannose units and more galactose units (Sixta, 2006). Hemicellulose
can be broken down into sugars, mainly xylose, as well as a few minor sugars,
through a pretreatment process. Cellulose and hemicellulose are sugar rich fractions
of interest for use in fermentation processes, since microorganisms may use the

15
sugars for growth and production of value added compounds such as ethanol, food
additives, enzymes, organic acids, and others. The average values of the main
components in some lignocellulosic wastes are shown in Table 2.5.
Table 2.5 Composition of some agricultural lignocellulosic materials
Composition (%, dry basis)
Lignocellulose
waste
Cellulose Hemicellulose Lignin References
Corn fiber 15 35 8 (Saha, 2003)
Hazelnut shell 25-30 25-30 30-40 (Arslan, 2011)
Corn stover 40 25 17 (Saha, 2003)
Rice straw 35 25 12 (Saha, 2003)
Sugarcane
bagasse
40 24 25 (Saha, 2003)
Hazelnut shells are a potential feedstock for fermentation due to their high
carbohydrate content (50-60%). The average structured analysis of hazelnut shell
is as follows: hemicelluloses 30.4%, celluloses 26.8%, lignin 42.9% and extractive
matter 3.3% (Demirbaş, 2006).
Hazelnut is Turkey’s most important agricultural crop since Turkey is one of the
main producer and exporter of hazelnuts in the world. Turkish hazelnuts account
for 65-76% of the world hazelnut market followed by Italy, Spain, the USA, China,
Iran, Greece and Russia (Koksal et al., 2006; Fischbach & Brasseur, 2012). The

16
shells account for about 44.5% of whole hazelnut and produced annually at
250,000-600,000 tonne in the Black Sea region of Turkey alone (Arslan &
Saraçoglu, 2010; Demirbaş, 2002). Hazelnut shells still have a limited industrial
use and mostly used as fuels in the Black Sea region.
2.5 Conversion of Lignocellulosic Biomass to Fermentable Sugars
Pretreatment, enzymatic hydrolysis, and fermentation are the three areas receiving
the most attention through research. Of these, pretreatment is of significant
importance because as a process step, it is upstream of both enzymatic hydrolysis
and fermentation (Mosier et al., 2005).
The presence of lignin and hemicellulose makes the access of cellulose enzymes
difficult, thus the efficiency of the hydrolysis is reduced. The cellulose is embedded
in a matrix of lignin and hemicelluloses and this arrangement presents a major
accessibility problem to cellulose enzymes. Therefore, a pretreatment (Figure 2.2)
is necessary in order to improve the digestibility of the biomass for a subsequent
enzymatic hydrolysis step (Mosier et al., 2005).
Hydrolysis can be improved by removal of lignin and hemicellulose, reduction of
cellulose crystallinity, and increase of porosity by pretreatment processes. Of these
various pretreatment technologies, some are focused on hemicellulose, some are
focused on disrupting the highly ordered cellulose, and others are focused on
disrupting the lignin-carbohydrate complex (Sun, 2002).

17
Figure 2.2 Action of pretreatment on lignocellulosic biomass- adapted from Mosier
et al., 2005.
A good pretreatment will disrupt the biomass enough to allow for the maximum
hydrolysis of both the hemicellulose and cellulose components into monomeric
sugars with minimal generation of enzymatic hydrolysis and fermentation inhibitors
(Hu et al., 2008). Table 2.6 highlights the advantages and disadvantages of the
pretreatment technologies. As can be seen from Table 2.6, alkali and ozone
pretreatment methods disrupted lignin structure of lignocellulosic biomass.
However, using green solvents are not cost-effective pretreatment methods for
lignin removal from lignocellulosic biomass. Searching novel technologies or
improving these pretreatment methods can be solved some problems such as
economical and environmental concerns and formation of toxic compounds
described in the following section 2.5.

18
Tab
le 2
.6 A
dvan
tage
s and
dis
adva
ntag
es o
f diff
eren
t pre
treat
men
t met
hods
of l
igno
cellu
losi
c bi
omas
s (B
rode
ur e
t al.,
201
1)
Pret
reat
men
t met
hod
Adv
anta
ges
Dis
adva
ntag
es
Alk
ali
Effic
ient
rem
oval
of l
igni
n
Low
inhi
bito
r for
mat
ion
Hig
h co
st o
f alk
alin
e ca
taly
st
Alte
ratio
n of
lign
in st
ruct
ure
Aci
d H
igh
gluc
ose
yiel
d
Solu
biliz
es h
emic
ellu
lose
Hig
h co
sts o
f aci
ds a
nd n
eed
for r
ecov
ery
Hig
h co
sts o
f cor
rosi
ve re
sist
ant e
quip
men
t
Form
atio
n of
inhi
bito
rs
Gre
en so
lven
ts
Lign
in a
nd h
emic
ellu
lose
hyd
roly
sis
Mild
pro
cess
ing
cond
ition
s (lo
w te
mpe
ratu
res)
Abi
lity
to d
isso
lve
high
load
ings
of d
iffer
ent b
iom
ass t
ype
Hig
h so
lven
t cos
ts
Nee
d fo
r sol
vent
reco
very
and
recy
cle
Ozo
ne
Red
uces
lign
in c
onte
nt
No
toxi
c co
mpo
unds
gen
erat
ion
Larg
e am
ount
of o
zone
requ
ired
Stea
m
Cos
t eff
ectiv
e
Lign
in tr
ansf
orm
atio
n an
d he
mic
ellu
lose
solu
biliz
atio
n
Hig
h yi
eld
of g
luco
se a
nd h
emic
ellu
lose
Parti
al h
emic
ellu
lose
deg
rada
tion
Toxi
c co
mpo
und
gene
ratio
n
Aci
d ca
taly
st n
eede
d to
mak
e pr
oces
s ef
ficie
nt
with
hig
h lig
nin
cont
ent m
ater
ial

19
2.6 Pretreatment Methods for Lignocellulosic Biomass
The most often studied pretreatment technologies are summarized in four categories
which include physical pretreatments, chemical pretreatments, physio-chemical
(combination) pretreatments, and biological pretreatments (Figure 2.3) (Sun &
Cheng, 2002).
According to Lynd (1996), pretreatment is directly associated with the efficiency
of hydrolysis. When the lignocellulosic biomass is instantly used in hydrolysis
glucose yield is less than 20% of theoretical yield, but when pretreatment is applied
before hydrolysis step, glucose yield even surpasses 90% of theoretical yield.
Although the pretreatment is necessary for a higher glucose yield, the cost of the
process should be considered in a detailed way.

20
I. Physical Methods
� Mechanical comminution (grinding&chipping) � Pyrolysis
II. Physical-Chemical Methods
� Steam explosion � Liquid hot water � Ammonia fiber explosion � Carbon dioxide explosion
III. Chemical Methods
� Ozonolysis � Acid Hydrolysis (dilute or concentrated) � Alkaline Hydrolysis � Oxidative Delignification � Wet Oxidation � Organosolv Process
IV. Biological Methods
Figure 2.3 Classification of lignocellulose-pretreatment methods
2.6.1 Physical Methods
Physical methods such as milling (ball milling, hammer milling, colloid milling)
and irradiation (gamma rays, ultrasound, microwaves or electron beam) increase
surface area by reducing the particle size (Palmowski & Muller, 2000; Taherzadeh
& Karimi, 2008). Final particle size of the biomass varies according to applied these
physical methods. The size of materials is usually 10-30 mm after chipping and 0.2-
2 mm after milling or grinding (Sun and Cheng, 2002).

21
They also cause shearing and reduce the degree of polymerization of cellulose,
which can increase hydrolysis yield by 5-25% while reducing digestion time by 23-
59% (Delgenes et al., 2002). Although no product inhibitors are produced during
physical pretreatment, this method has a very high energy requirement, which
makes it economically unsuitable (Hendriks & Zeeman, 2009).
2.6.2 Physical-Chemical Methods
Physical-chemical pretreatments that combine both chemical and physical
processes consist of steam explosion, liquid hot water (LHW), ammonia fiber
explosion (AFEX) and carbon dioxide explosion (McMillan, 1994). Steam
explosion, also known as autohydrolysis, is performed with a saturated steam, at a
temperature range of 160-290 °C and pressure range of 0.69-4.85 MPa during
several seconds or minutes. During this treatment, hemicellulose is solubilized into
oligomeric or monomeric sugars and released into the liquid phase which in turn
increase the accessibility of cellulose found in the solid phase to enzyme activity
(Galbe & Zacchi, 2007). A disadvantage of this method is the formation of
inhibitory compounds from degradation of xylan (Mueller, 2009). These inhibitors
affect the microbial growth, enzymatic hydrolysis and fermentation.
The other commonly used physical-chemical pretreatment methods are liquid hot
water (LHW, thermohydrolysis) and ammonia fiber explosion (AFEX). For LHW,
pressurized hot water is used at a process pressure of more than 5 MPa, and the
temperatures are between 170-230°C. LHW pretreatment provides high pentose
recovery rates without production of inhibitors as in steam explosion (da Costa
Sousa et al., 2009). The major advantage of LHW pretreatment is that it does not
require addition or use of chemicals (Suryawati et al., 2009).
Ammonia-fiber explosion (AFEX) is an alkaline physico-chemical pretreatment
process, in which lignocellulosic materials are exposed to liquid ammonia at high
temperature (60-160 oC) and pressure from 5 to 30 min (Wyman et al., 2005;

22
Teymouri et al., 2005) and then the pressure is swiftly reduced. This process does
not produce any inhibitory compounds. Vlasenko et al. (1997) studied for
comparing acid-catalyzed steam explosion, dilute acid hydrolysis, and AFEX
pretreatments for enzymatic hydrolysis of rice straw. The AFEX pretreatment does
not significantly solubilize hemicellulose compared to acid pretreatment (Vlasenko
et al., 1997). Thus, AFEX treated biomass requires enzymes that can hydrolyze the
hemicelluloses and celluloses to produce fermentable sugars (Jorgensen et al.,
2007).
2.6.3 Chemical Methods
Chemical pretreatment methods include use of acid, alkali, organosolvents,
peroxides and ozone (Keshwani & Cheng, 2009).
Acid pretreatment is applied in two forms, concentrated or dilute. In both, the acid
used is generally sulfuric acid or hydrochloric acid. Since concentrated acid
pretreatment is found to be a harmful and expensive application because of the
toxicity and corrosivity of the chemical (Sivers & Zacchi, 1995), instead of
concentrated acid pretreatment, dilute acid is well-developed and is an effective
method. The dilute acid process is conducted under high temperature and pressure,
and has a reaction time in the range of seconds or minutes (Demirbaş, 2012). Dilute
acid catalyzes the breakdown of long hemicellulose chains to shorter chain
oligomers and then to sugar monomers that the acid can degrade. Rahman et al.
(2007) studied the effect of acid concentration, temperature and time on release of
xylose and glucose and formation of byproducts (acetic acid and furfural) during
hydrolysis of oil palm empty fruit bunch fiber (OPEFB) biomass. The optimum
reaction temperature, time and acid concentration were reported as 119 °C, 60 min
and 2%, respectively. Under these conditions xylose yield was reported as 91.27%.
Roberto et al. (2003) reported optimal conditions of 1% sulfuric acid, 121 oC, and
27 min for rice straw resulting in 77% xylose yield.

23
Alkali, such as calcium hydroxide (lime), sodium hydroxide and ammonia, has been
employed as a pretreatment method for many years. Alkaline pretreatment causes
a swelling effect on the biomass, which is an intra crystalline swelling action
penetrating both amorphous and crystalline structure of cellulose and resulting in
irreversible change in the structure of cellulose (Kang, 2011). Alkaline pretreatment
results in the breakage of bonds between lignin and carbohydrates leading to
disruption of the lignin structure while retaining cellulose and a significant portion
of hemicellulose in the recovered solids (Galbe & Zacchi, 2007; Hendriks &
Zeeman 2009; Jorgensen et al., 2007). Sodium hydroxide pretreatment of coastal
bermuda grass reduced lignin content by 86% and increased glucan and xylan
conversions to 90.4 and 65.1%, respectively (Wang et al., 2010) while lime
pretreatment of switchgrass reduced lignin content by 35.5% (Xu et al., 2010).
Other chemical pretreatments are oxidative delignification and wet oxidation, for
which peroxidase with 2% hydrogen peroxide are used as oxidizing agents; and
water, sodium carbonate or sulfuric acid are added with the presence of oxygen
pressure respectively. Rather than bases or acids, solvent-addition is also tried and
that procedure is named as organosolv process. Whereas almost all the
hemicellulose is hydrolyzed and lignin is solubilized, organosolv pretreatment can
not be opponent to other methods (Lynd et al., 1999) because of the economical
disadvantage of solvent prices.
Ozonolysis is a pretreatment technique, which is reducing the lignin content of
lignocellulosic wastes. Ozone treatment increases the digestibility of the treated
material, and it does not produce toxic residues (Kumar et al., 2009). Ozone is a
very strong oxidizing agent that can be produced by passing oxygen through an
electrical discharge, where the oxygen molecules dissociate to form ozone (Eckert
& Singh, 1975). Ozone has been used to degrade lignin and hemicellulose in many
lignocellulosic materials such as wheat straw (Ben-Ghedalia & Miron, 1981),
bagasse, green hay, peanut, pine (Neely, 1984), cotton straw (Ben-Ghedalia &
Shefet, 1983) and poplar sawdust and rye straw (Garcia-Cubero et al., 2010). A net
reduction of 66.8% of acid insoluble lignin concentration was observed when
sugarcane bagasse was treated with an ozone concentration of 3.44% (v/v) with

24
40% moisture content for 120 min (Travaini et al., 2013). Garcia – Cubero et al.
(2009) observed that ozonolysis increased enzymatic hydrolysis yield from 29 and
16% to 88.6 and 57% in wheat straw and rye straw, respectively with no furfural
and HMF being detected. Kaur et al. (2012) achieved a reduction of over 42% in
cotton stalk lignin content using ozone pretreatment.
2.6.4 Biological Methods
The fourth group of pretreatment type is biological pretreatment. Biological
pretreatments are performed by employing lignin degrading microorganisms like
white-, brown- and soft- rot fungi. These organisms secrete extracellular enzymes
such as lignin peroxidases and laccases that remove lignin from biomass (Christian
et al., 2005). This method is favorable in terms of the needs for low temperature
and no chemicals (Taherzadeh & Karimi, 2008). Nevertheless, the rate of biological
hydrolysis is usually very low, so this pretreatment requires long residence times.
For instance in the study of Hatakka (1983), Pleurotus ostreatus was able to convert
35% of wheat straw into reducing sugars in 5 weeks. As Sun & Cheng (2002)
mentioned while white-rot fungi are able to break down cellulose and lignin, brown-
rot fungi usually destruct only cellulose.
2.7 Formation of Fermentation Inhibitors
Pretreatment of lignocellulosic biomass may produce degradation products with an
inhibitory effect on downstream processes like enzymatic hydrolysis and
fermentation. These inhibitors have toxic effects on the fermenting organisms, thus
reducing the pectinase activity and productivity.

25
2.7.1 Sugar Degradation Products
During pretreatment at high severe conditions, pentose polymers are hydrolyzed
into monomers, which can be further degraded into furfural. After prolonged period
of pretreatment time, furfural can be degraded into levulinic acid. The same process
occurs with hexoses as well, generating hydroxymethylfurfural (HMF) and formic
acid respective of exposure to pretreatment conditions. Equations 1 and 2 below
outline the pathway of sugar degradation (Redding, 2009).
Hemicellulose � Pentose � Furfural � Levulinic Acid (1)
Cellulose and Hemicellulose � Hexose � HMF � Formic Acid (2)
HMF is considered less toxic than furfural and its concentration in (hemi)cellulose
hydrolysates is usually low. It is clear that extensive degradation of (hemi)cellulose
is responsible for the formation of the latter inhibitor compounds. Kinetic studies
have shown that the production of furfural strongly increases with temperature and
reaction time (McKillip & Collin, 2002).
Generally, furfural and HMF have been reported as to cause a lag phase in yeast
growth before sugar consumption begins because the yeast takes up the two
degradation compounds first (furfural faster than HMF) before moving on to
converting sugars to ethanol. Levulinic and formic acids are generally shown as
helpful at levels up to 100 mmol and inhibitory after levels of 100-200 mmol. This
has been confirmed by experiments done by Larsson et al. (1998), which showed
furfural and HMF as not inhibitory to ethanol yield, while weak acids (formic,
levulinic, and acetic) at a combined concentration greater than 100 mmol did inhibit
the ethanol yield.
Lavarack et al. (2002) studied dilute acid hydrolysis of baggase hemicelluloses to
produce xylose, arabinose, glucose, acid-soluble lignin, and furfural. They found

26
that H2SO4 is more efficient as a catalyst than hydrochloric acid for the degradation
of xylose. Saha & Bothast (1999) used dilute acid and enzymatic saccharification
method for conversion of corn fiber to fermentable sugars. They found that corn
fiber pretreated with 0.5% H2SO4 at 121�C for 1 h facilitated commercial enzymes
to highly hydrolyze remaining starch and hemicellulose components without
generation of inhibitors such as furfural and hydroxymethyl furfural (HMF), which
are generally considered inhibitors for fermentative microorganisms.
2.7.2 Lignin Degradation Products
In general, lignin degrades into phenolic compounds with a variety of molecular
weights (Klinke et al., 2004). Details regarding the phenolic inhibition are limited
due to a lack of accurate investigation, but it is suspected that low molecular weight
phenolic compounds are more inhibitory to fermentation and that there are
interaction effects with furfural and HMF, which increase the overall inhibitory
effects of both compounds (Palmqvist & Hahn-Hagerdahl, 2000). Table 2.7
illustrates the maximum allowable concentration of various inhibitors for ethanol
fermentation (Klinke et al., 2004).
2.8 Elimination of Inhibitors from Fermentation Medium
Sugar degradation not only reduces the sugar yield, but the degradation products
such as furfural and other by-products can also inhibit the fermentation process.
Various methods for detoxification of the hydrolyzates have been developed
(Corredor, 2008). To decrease the toxicity caused by the inhibitory compounds,
considerable efforts have been focused on detoxification methods prior to
fermentation, including neutralization, over-liming, evaporation, ion exchange
resins and charcoal adsorption (McMillan, 1994).

27
Tab
le 2
.7 O
rigin
of v
ario
us in
hibi
tors
and
thei
r max
imum
allo
wab
le c
once
ntra
tions
for e
than
ol fe
rmen
tatio
n (K
linke
et a
l., 2
004)
Com
pone
nt
Inhi
bito
r M
axim
um c
once
ntra
tion
(g/l)
R
emar
ks
Hem
icel
lulo
se
Xyl
ose
Man
nose
, gal
acto
se, g
luco
se
Ace
tic a
cid
Furf
ural
HM
F
3
<0.2
5
0.25
Inhi
bitio
n of
ac
etic
ac
id
depe
nds
on
pH
durin
g
ferm
enta
tion
Cel
lulo
se
Glu
cose
HM
F 0.
25
HM
F m
ay f
urth
er d
egra
de t
o
form
ic a
cid
and
levu
linic
aci
d
Lign
in
Aro
mat
ics
Poly
-aro
mat
ics
Ald
ehyd
es
Phen
olic
com
poun
ds
<0.1
V
anill
ic
acid
, ca
proi
c ac
id,
capr
ylic
aci
d, p
elar
goni
c ac
id,
palm
itic
acid

28
2.9 Enzymatic Hydrolysis
Enzymatic hydrolysis is the process by which several enzymes, such as cellulases
and hemicellulases are used to hydrolyze polysaccharides (cellulose and
hemicellulose) into their component monosaccharides (Taherzadeh & Karimi,
2007). Without any pretreatment, the conversion of cellulose into glucose is a slow
and complex process since cellulose is embedded in a matrix of lignin and
hemicellulose in macrofibrils (Figure 2.2) (Kang, 2011).
The products of hydrolysis are usually reducing sugars including glucose. Utility
cost of enzymatic hydrolysis is low compared to acid or alkaline hydrolysis because
enzyme hydrolysis is usually conducted at mild conditions (pH 4.8 and temperature
45 to 50 oC) and does not cause a corrosion problem (Sun, 2002). Enzymatic
hydrolysis has some major factors such as substrate utility, substrate concentration,
enzyme activity, applied pretreatment method and hydrolysis conditions (enzyme
load, pH and temperature) (Taherzadeh & Karimi, 2007). Palmarola-Adrados et al.
(2005) pretreated starch free wheat bran with dilute acid and subsequently
hydrolyzed using a mixture of Celluclast and Ultraflo (1:1) and the overall sugar
yield of this combined hydrolysis method reached 80%. Aswathy et al. (2010)
reported improved efficiency of 71% from combined dilute acid pretreatment and
enzymatic hydrolysis of hyacinth biomass compared to dilute acid alone (57%).
Yan et al. (2012) reported a high enzymatic digestibility of 93.12% from food waste
hydrolysis prior to fermentation within 4 h. The optimum batch enzymatic
conditions were found to be saccharification pH of 4.5, temperature of 55 oC ,
glucoamylase concentration of 120 U/g, α –amylase concentration of 10 U/g, solid-
liquid ratio of 1: 0.75 (w/w) (Yan et al., 2012). Therefore, enzyme mixture or
cocktails act both synergistically to saccharify polysaccharides from lignocellulosic
biomass to fermentable sugars and more economical.

29
2.10 Optimization of Pectinase Production
It is essential to improve the efficiency of the fermentation process by increasing
the yield while decreasing the cost of the enzyme production. Cost of enzyme
production is highly affected by raw material, medium composition and cultivation
conditions. Numerous studies have been conducted on the microbial production of
pectinases using synthetic media, whereas few have been published about cost-
effective production of the enzymes. A cost-effective substrate must be renewable,
abundant and containing the majority of the nutrients essential to the
microorganism, if not, it would be necessary to supplement them externally at an
additional cost. It is also known that 30-40% of the enzyme production cost belongs
to cost of the medium (Ustok et al., 2007). The selection of an appropriate source
of carbon, nitrogen and other nutrients is one of the most critical stages in the
development of an efficient and economic enzyme production process. Thus,
reduction in the production costs can be achieved by usage of inexpensive
lignocellulosic materials as a substrate, such as wheat bran, sugarcane bagasse,
corncob, rice bran, wheat straw, rice straw, saw dust, orange peel, lemon peel etc
(Smith & Aidoo, 1988; Pilar et al., 1999).
Optimization by traditional one-factor at a time method generally used in
biotechnology involves varying a single factor while keeping the others constant.
Thus, it is time consuming and expensive, when a various variables are to be
evaluated. To overcome this difficulty and to evaluate the interactions between
parameters, response surface methodology (RSM) has been widely used to decrease
time and cost by providing fewer numbers of experiments (Haaland, 1989). RSM
was widely used in the optimization of fermentation process (Kaushik et al., 2006).
The growth and enzyme production are strongly influenced by medium components
thus optimization of media components and culture conditions is necessary to
improve a biological process (Djekrif-Dakhmouche et al., 2006). Based on the
literature, there are few studies about statistical methods that have been applied for

30
optimization of pectinase by using Bacillus spp. (Sharma & Satyanarayana, 2006,
Swain & Ray, 2010, Mukesh Kumar et al., 2012, Andrade et al., 2012).
Sharma & Satyanarayana (2006) aimed to enhance the production of an alkaline
and thermostable pectinase from Bacillus pumilus dcsr1 in submerged
fermentation. As compared to pectinase production by B. pumilus dcsr1 in
unoptimized medium, a 34-fold increase was recorded in RSM optimized medium
in shake flasks. The pectinase production of 25.330 U/L in the laboratory fermenter
was higher than the enzyme production attained in shake flasks (21.000 U/L). This
could be attributed to uniform distribution of nutrients and improved aeration.
Swain & Ray (2010) investigated the exo-PG production by Bacillus subtilis CM5
isolated from cow ruminant microflora, which was comparable to marketed
pectinase (Pectinex®, Novozyme, Denmark). The optimum temperature, pH, and
incubation period for optimum exo-PG production (82.0–83.2 units) were found 50
°C, 7.0, and 36 h, respectively. B. subtilis strain CM5 isolated from culturable cow
ruminant microflora produced moderately thermostable exo-PG, which is more
efficient in extracting juice (13.3% more yield) from carrot than standard marketed
pectinase enzyme (Pectinex, Novozyme, Denmark).
Mukesh Kumar et al. (2012) investigated pectinase production and optimization by
bacterial strain MFW7 isolated from fruit market wastes. The bacterium Bacillus
sp. MFW7 produced significant amount of pectinase (1.8 U/mL) after 96 h of
incubation in fermentation medium at 35 °C and pH 6.5. The maximum enzyme
production was obtained with lactose as carbon source, peptone as nitrogen source
and cassava waste as substrate (2.5 U/mL). This study illustrated the usage of
cassava wastes as a substrate for pectinase production. To conclude, this enzyme
may be further scaled up for juice production after careful investigations.
Andrade et al. (2012) reported maximum polygalacturonase production by the
thermophilic Bacillus sp. SMIA-2 cultivated in liquid cultures containing 0.5%
(w/v) apple pectin supplemented with 0.3% (w/v) corn steep liquor, after 36 h with
activity of 39 U/mL.

31
There were many studies in the literature using synthetic media for production of
pectinase by using Bacillus sp. mutant strain. However, no study has been found to
investigate neither usage of hazelnut shells as a substrate for pectinase production
nor optimization of the fermentation medium and conditions to enhance the
pectinase production by using wild-type Bacillus subtilis.
2.11 Objectives of The Study
The aim of this study was to produce alkaline pectinase enzyme using hazelnut
shells as a substrate and to determine its potential in crude form for clarification of
carrot juice.
Numerous studies have been conducted on the production of pectinases from
various microorganisms. However, a few works have been published about cost-
effective production of enzymes. The difficulties to obtain the appropriate substrate
might be the biggest problem to develop such studies. A suitable substrate should
be cost-effective and composed of all necessary nutrients to the microorganism, if
not, it would be necessary to supplement them externally. Lignocellulosic biomass
contains sugar rich fractions such as cellulose and hemicellulose. Various
pretreatment methods and enzymatic hydrolysis are used to produce simple sugars
such as glucose and xylose. Then, microorganisms may use these sugars for growth
and production of pectinase. For this purpose, hazelnut shell as a low-cost substrate
was selected and various pretreatment methods such as dilute acid, alkali and ozone
may be improved and may result in better enzymatic saccharification first and then
pectinase production.
Furthermore, industrial fermentation is moving forwards to a more knowledge-
based and better-controlled process. Hence, for the development of an economically
feasible bioprocess by rational design and optimization, a comprehensive
understanding of the effect of process parameters on the final product has become
inevitable. Different fermentation factors (temperature, time, medium pH,

32
inoculum level) are important. By this study, it was aimed to optimize the
fermentation medium and conditions to enhance the alkaline pectinase production
by using response surface methodology (RSM).
In this context, the potential of produced enzyme in crude form was also examined
in the clarification of carrot juice and compared with Pectinex 3XL which is known
as a commercial pectinase.

33
CHAPTER 3
MATERIALS AND METHODS
3.1 Materials
3.1.1 Lignocellulosic Biomass
Hazelnut shells of Tombul variety were kindly provided by a local plant in Ordu, a
province of Turkey and dried at 70 °C in an oven for 24 h on arrival. The hazelnut
shells were then ground by a laboratory type grinding mill (Thomas-Wiley
Laboratory Mill, Model 4, Arthur H.Thomas Company, Philadelphia, PA, USA) to
pass through a 1 mm sieve for easy reaction with acid. The ground hazelnut shells
were stored inside plastic bags and kept at room temperature until use.
3.1.2 Microoganisms, Growth and Fermentation Media
Bacillus pumilus NRRL NRS-272 and Bacillus subtilis NRRL B-4219 were kindly
provided by the ARS culture collection, Northern Regional Research Laboratory
(NRRL), Peoria, Illinois, USA. Stock cultures of B. pumilus and B.subtilis were
grown on nutrient agar at 30 oC and maintained at 4 oC.
B. subtilis and B. pumilus were maintained on modified media containing, yeast
extract (1 g/L), glucose (10 g/L), K2HPO4 (0.4 g/L), KH2PO4 (0.2 g/L),
MgSO4.7H2O (0.4 g/L), and citrus pectin (2g /L) and incubated at 30 oC for 20 h
with agitation of 130 rpm (Kapoor and Kuhad, 2002). Stock cultures of B. pumilus

34
and B.subtilis were prepared with 20% of glycerol-water and stored at -80 oC for
long term storage.
The submerged fermentation media were prepared in 500 mL Erlenmeyer flasks
with the 100 mL medium consisting of hazelnut shell hydrolyzate, yeast extract
(5g/L), pectin (2 g/L), MgSO47H2O (0.2 g/L), and K2HPO4 (0.2 g/L). Each flask
was inoculated with 3x10⁸ CFU/ 100 mL of inoculum and incubated under shaking
(130 rpm) at 30, 35 and 40 oC for 24, 48 and 72 h.
3.1.3 Chemicals and Enzymes
All chemicals and enzymes used in this study are given in Table A.1.
3.1.4 Buffers and Solutions
The preparation of buffers and solutions used throughout the study is given in Table
B.1.
3.2 Methods
3.2.1 Analytical Methods
3.2.1.1 Chemical Analysis of Biomass
Moisture, ash, fat, extractives, crude fiber, cellulose, hemicellulose, acid insoluble
lignin (AIL) and acid soluble lignin (ASL) contents of hazelnut shells were
determined as described in the following sections.

35
3.2.1.1.1 Moisture Content
Moisture content was determined using the Standard Official Methods of Analysis
of the AOAC (1984). Approximately 1g of ground sample was placed in a pre-
weighed aluminum foil dish and dried to a constant weight in a 105 oC oven.
Analysis was done in triplicate. The moisture content of the sample was calculated
using the following formula:
� �100).((%) ��
�
�
� �
i
fi
WWW
bwMoisture
where; Wi= Weight of wet sample (g), and
Wf= Weight of dry sample (g)
3.2.1.1.2 Ash Content
Total ash content of ground samples was determined by incineration, as described
by AOAC (1984). An oven dried sample of 1 g was placed into crucibles and
combusted at 575 oC for 24 h until constant weight was reached. The amount of ash
was then calculated using the formula:
100%
).((%) 12 ���
�
����
����
��
�TSW
WWbdAshi
where;
W1= Weight (g) of crucible
W2=Final weight (g) after burning
(3)
(4)

36
Wi= Initial weight of sample (g)
TS= Total solids (%)
3.2.1.1.3 Amount of Extractives
Duplicate samples of 5 g oven dry material were extracted with 75 mL of ethanol
and 225 mL of hexane for extracting ethanol and fat soluble solutes, respectively.
The mixtures were allowed to stand 4 h in a reflux condenser and then cooled to
room temperature and weighed.
3.2.1.1.4 Fat Content
The total fat in ground hazelnut shells was determined according to the Soxhlet
method (Hara & Radin, 1978). Approximately five grams of oven dried sample
was weighed into thimbles and placed in a Soxhlet apparatus filled with 300 mL of
hexane and heated for 6 h. The hexane and oil mixture was placed into 105 oC oven
to dry. The fat percent of samples was calculated according to Equation (5),
100(%) 12 ����
���
�w
WWFat
where; w= weight of sample, (g)
W1=weight of balloon, (g)
W2=Weight of fat and balloon, (g)
3.2.1.1.5 Crude Fiber
For crude fiber determination, samples were dissolved in boiling sulphuric acid
(5)

37
solution (0.25 N) for 30 min and subsequently filtered into a crucible and washed
to remove the acid from the retentant inside the crucible. For calcination, samples
were boiled in potassium hydroxide solution (0.31 N) for 30 min and then filtered
and washed. The obtained residue was dried at 105 °C for 24 h and burned at 550
°C until constant weight. This procedure was also repeated for blank. The difference
between the dry organic/inorganic residue weight and the ashed residue weight
were used as fibrous material, and the fiber content was calculated as percentage by
weight, Cfibre, by the formula:
� �� �a
cbC fibre100�
�
where a is the mass (g) of the sample, b is the loss of mass after ashing, and c is the
loss of mass after ashing for the blank.
3.2.1.1.6 Cellulose and Hemicellulose Content
The holocellulose content of the extractive-free samples was determined by the
sodium chlorite method (Browning, 1967). Duplicate samples of 2.5 g were mixed
with 80 mL of distilled water, 0.5 mL of glacial acetic acid and 1 g of 80% sodium
chlorite and the mixture was kept at 70 �C for 6h. Further additions of acid and
chlorite solutions were made hourly. After six hour, the samples were cooled in an
ice bath. The obtained holocellulose was filtered and washed with 200 mL of
ethanol and 25 mL of acetone. Then samples were oven dried overnight in an oven
at 105 �C. The samples were re-weight and the holocellulose content calculated was
on a dry basis.
To determine the cellulose content, duplicate samples of 1.5 g oven dry
holocellulose were weighed and 100 mL of 17.5% sodium hydroxide solution were
added. The extraction was carried out at 20 �C for 2 h with 120 rpm and
subsequently, the samples were filtered. The cellulose retained in the crucible was
further washed with 10 mL of 10% acetic acid and 200 ml distilled water and then
(6)

38
oven dried overnight at 105 �C. The samples were re-weighed and cellulose was
calculated as a percentage of the oven dry sample.
The filtrate containing the hemicellulose was neutralized to pH 5.0 with acetic acid
and 2 L of ethanol were added to precipitate the hemicellulose. The hemicelluloses
were filtered and washed with water and were dried in an oven at 105 �C overnight
and re-weighed. The hemicellulose were calculated as a percentage of the oven dry
sample.
3.2.1.1.7 Acid Insoluble (Klason) and Acid Soluble Lignin
Content
Acid insoluble lignin was determined by the TAPPI standard method (T2220S-74)
(TAPPI, 1989). Dried samples of 1 g were mixed with 15 mL of 72% (w/w) sulfuric
acid and stirred with a glass rod every 15 min for 2 h at 20 oC. At the end of the
initial hydrolysis, samples were transferred from beaker to the flask and diluted
with water to 3% concentration of sulfuric acid completing to a total volume of 575
mL. The resulting hydrolysate was autoclaved at 121�C for 2 h and then cooled to
room temperature, filtered through pre-weighed dry filters. The obtained residue
was dried for 24 h at 105 �C to reach constant weight for Klason lignin calculation
as follows:
%100%
100
(%)1
32 ��
�
fTW
WWcontentligninKlason
where; W1=initial sample weight
W2=Weight of filter paper, acid-insoluble lignin and acid-insoluble ash
W3=Weight of filter paper and acid-insoluble ash
Tf= % total solids content of the prepared sample used in the analysis, on a 105 oC
(7)

39
dry weight basis.
The acid soluble lignin was measured by the TAPPI standard method (TAPPI,
1985). The soluble lignin was determined in the hydrolysate by spectroscopy at 205
nm wavelength. The 4% (w/w) sulfuric acid was used as the reference blank. The
hydrolyzate was diluted appropriately to attain an absorbance between 0.2-0.7. The
amount of acid soluble lignin (ASL) was then calculated as
100(%) �����
�WPathlengthDilutionVolumeUV
ASL filtrateabs
�
where; UV abs= Absorbance for the sample at 205 nm
Volume filtrate= volume of filtrate
W=weight of sample (mg)
=Absorptivity coefficient of biomass at specific wavelength (110g/L cm)
The percentage of lignin reduction was calculated with the following equation:
100*���
����
� �
u
pu
LLL
reductionligninofpercentageThe
where; Lp= weight of Klason lignin in the pretreated biomass
Lu= weight of Klason lignin in the untreated biomass
(9)
(8)
ɛ

40
3.2.2 Total Reducing Sugar
Total reducing sugars were determined colorimetrically using dinitrosalicycilic acid
reagent (Miller, 1959). The DNS reagent was prepared as described in Appendix B.
Reducing sugars were determined by using glucose as standard (Table C.1). Six
different concentrations (0.15, 0.2, 0.4, 0.6, 0.8 and 1.0 g/L) of glucose were
prepared in distilled water. Three ml of diluted samples and 3ml of DNS reagent
were mixed in a test tube. The mixture was heated for 15 min at 90 �C in a water
bath. After the color had developed 1.0 mL of 40% Rochelle salt was added when
the contents of the tubes were still hot and then the tubes were cooled. A blank was
also prepared (3.0 mL each of distilled water, DNS and Rochelle salt solution).
Absorbance was measured with spectrophotometer at 575 nm. Measurements were
carried out in duplicate.
3.2.3 Inhibitory Compounds
Furfural, HMF and acetic acid were determined by a HPLC system (Prostar, Varian,
CA, USA) equipped with a RI detector for HMF and furfural and a PDA (Diode
array) detector for acetic acid. The column was Metacarb 87H column (300 mm X
7.8 mm, varian, S/N: 05517112, Varian) and the operation conditions were 35 °C
with 0.08 N H2SO4 as the eluent flowing at 0.5 mL/min (Xie et al., 2011).
The Folin-Ciocalteu assay was used for determination of total phenol content in the
hydrolyzate samples colorimetrically (Spanos & Wrolstad, 1990) at 760 nm.
Phenolics were expressed as gallic acid equivalents prepared with gallic acid
standards at 6 different concentrations ranging from 10 to 60 mg/L (Figure D.1).
3.2.4 Pectinase Assay
Polygalacturonase (PG) activity was assayed by measuring the release of reducing

41
groups from polygalacturonic acid using the 3,5-dinitrosalicylic acid (DNS) reagent
assay (Miller, 1959). The number of reducing groups was expressed as galacturonic
acid.
Galacturonic acid monohydrate was used as standard (Figure E.1).
Polygalacturonase (PG) activity was evaluated by mixing 0.5 mL of enzymatic
extract and 0.5 mL of polygalacturonic acid solution (1 % w/v polygalacturonic
acid in 0.05 M acetate buffer at pH 7.0) and incubating at 50 °C for 30 min (Kapoor
et al., 2000). The absorbance was measured at 575 nm. The blank was prepared in
the same way except that the crude enzyme. One unit of enzymatic activity (U) was
defined as the amount of enzyme which releases one µmol of galacturonic acid per
minute under assay conditions.
3.2.5 Determination of Cell Density
Cell density was measured turbidometrically at 600 nm wavelength. Growth curves
of B.subtilis and B.pumilus were shown in Appendix F.
3.2.6 Determination of Protein Content
The total protein content of the samples was determined by Lowry et al. (Lowry et
al., 1951); the protein standard used was bovine serum albumin (BSA). The lowry
solution was prepared as described in Appendix G. Sample of 0.5 mL was added to
0.7 mL Lowry Solution, mixed thoroughly and incubated for 20 min at room
temperature in dark, and 0.1 mL Folin’s reagent was later added. After mixing, it
was left for 30 min at room temperature in dark and then absorbance of each sample
was determined at 750 nm against blank.

42
3.2.7 Clarity Test (%)
Carrot juice samples of 200 mL were placed into a flask. After addition of the
produced pectinase, samples were mixed under shaking (120 rpm) at 50 oC. At the
end of enzymatic treatment, the enzyme was inactivated by heating the suspension
at 90 oC for 5 min and centrifuged at 2000x g for 10 min.
The clarity of the juice was determined by measuring the absorbance at 660 nm.
The degree of clarification was expressed by percentage of clarity calculated using
Eqn (10)
� �� �100*
sampleuntreated
samplecontrolsampleuntreated
AbsAbsAbsAbs
Clarity
�
Abs untreated: Sample with no enzyme
Abs control: Sample with no enzyme heated 50 oC
Abs sample: Sample with enzyme heated 50 oC
3.2.8 Pectin Degradation (Alcohol test) Test
An alcohol test was conducted to check for residual pectin after enzymatic treatment
(clarification process). Ethanol-HCl of 100 mL prepared by adding 5 mL of 5%
hydrochloric acid to 95 mL of 96% ethanol were mixed with 5 mL of carrot juice.
For each sample, if breakdown of pectin was observed in 1-minute, depectinization
would be considered incomplete (Acar & Gokmen, 2005).
(10)

43
3.3 Pretreatment Methods
3.3.1 Dilute-Acid Pretreatment
The schematic diagram of the set-up of the dilute acid pretreatment conducted in
autoclave was shown in Figure 3.1. Ground hazelnut shells were pretreated with
dilute sulfuric acid at concentrations of 1, 3, and 5 % (w/w) and a biomass solid
loading of 1/20 (g dry weight/mL). The pretreatments were performed at 110 °C,
120 °C and 130 °C in an autoclave for 15, 37.5 and 60 min. After acid hydrolysis,
the solid residue was separated by centrifugation (MPW-15 mini centrifuge, MPW
Med. Instruments Co., Warsaw, Poland) (2000x g, 30 min) and pH (Hanna portable
pH-meter, HANNA Instruments Inc, USA) of the supernatant was adjusted to 5.0
using 10 M NaOH.
Figure 3.1 Schematic of dilute acid pretreatment set up

44
The flow chart of dilute acid hydrolysis is shown in Fig. 3.2 for better understanding
of mass input and outputs.
Reducing sugar yield (%, w/w) for each pretreatment was calculated as follows:
a= Amount of reducing sugar in hydrolyzate obtained from pretreatment of dry
biomass (g/g)
b=Amount of cellulose and hemicellulose in untreated dry biomass (g/g)
(11)

45
Fi
gure
3.2
Flo
w c
hart
of d
ilute
aci
d pr
etre
atm
ent m
etho
d.

46
3.3.1.1 Solid/liquid Ratio
Solid/liquid ratio was defined as the ratio of dry weight of hazelnut shells to volume
of sulfuric acid. Three different solid/liquid ratios of 1/20, 1/10 and 1/7 (w/v) were
investigated in acid pretreatment for comparing reducing sugar yields.
3.3.2 Alkaline Pretreatment
Ground hazelnut shells were pretreated with sodium hydroxide (NaOH) using two
different methods.
First procedure is so called Method 1, in which ground hazelnut shells were
pretreated by solutions of 1, 3, 5 and 7 % (w/v) NaOH at 30, 45 and 60 oC for 24 h
at a solid/liquid ratio of 5% (g shells/mL NaOH solution).
Ground hazelnut shells were pretreated with 100 mL of NaOH solution at
concentrations of 3, 5, and 7% (w/v) and biomass solid-liquid ratios (SLR) of 5, 10
and 15% (w/v, dry weight basis). The pretreatments were performed in crimp
sealed, glass serum bottles at 121 °C, 15 psi in an autoclave for treatment times of
30, 60 and 90 min. This procedure is so called Method 2.
The pretreated biomass was recovered by filtration and washed with 400 ml of
deionized water in a Buchner funnel-vacuum pump assembly to remove excess
alkali and dissolved by-products that might inhibit enzymes during subsequent
hydrolysis. The residual biomass was analyzed for solid recovery and acid soluble
and insoluble lignin contents using standard methods. After the pretreatment,
samples were centrifuged at 2000x g for 30 min to separate the supernatant. Finally,
total sugar content of the supernatant was measured using DNS method (Miller,
1959). The pH of the pretreated samples was adjusted to 6.5 using 5% (w/w) H2SO4.

47
3.3.3 Ozone Pretreatment
Figure 3.3 shows the ozonolysis reactor set-up used in this study at North Carolina
State University at Biological and Agricultural Engineering Department.
Ozonolysis was performed in a glass column reactor tube (Aceglassware, NJ, USA)
with 5 cm diameter and 30 cm length. One end of the reactor was plugged with
glass wool to support the biomass. Ozone, produced on-site by an ozone generator
(Model: OL80 A Ozone lab instrument, Canada) supplied with industrial grade
oxygen (Airgas National Welders, Raleigh, NC) at a flow rate of 0.25 L/min
maintained using a mass flow controller (Model no:FMA5516, Omega, CT, USA)
was introduced into the reactor from the top. The bottom of the reactor tube was
connected to an ozone destructor through an exit line. Five gram (dry basis) of
ground hazelnut shell was prepared for ozonolysis by adding different amounts of
moisture and allowed to equilibrate for an hour. Three ozone concentration 30, 40,
and 50 mg/L were tested for hazelnut shell. After each experiment, ozonated
hazelnut shell was washed with 200 mL of distilled water. Pretreated samples were
stored in ziplock bags at room temperature until further use for compositional
analysis including total solids, acid insoluble lignin (AIL), acid soluble lignin
(ASL), ash, reducing sugar content and enzymatic hydrolysis.

48
Figure 3.3 Schematic of ozonolysis reactor set up –adapted from Panneerselvam
et al. (2013)
3.4 Enzymatic Hydrolysis
The untreated ground samples and solid residues recovered after sulfuric acid
pretreatment were separately hydrolyzed using Viscozyme L containing cellulase
and xylanase enzymes at 50 �C and 120 rpm for 24 h in 250 mL flasks with enzyme
loadings of 66.6, 100 and 200 U/g dry substrate and solid loadings of 1/20, 1/10
and 1/7 (w/v) (g shells/g liquid). Cellulase and xylanase activity were assayed as
carboxymethly cellulose units (U) (Ghose, 1987) and xylan units from beechwood
(Bailey et al., 1992), respectively. The activities of the enzymes were measured as
Ozone
generator
Industrial
grade
oxygen
Mass flow
controller
Sample
supported
on
glasswool
Ozone

49
2250 U/mL and 1400 U/mL at 50 oC and pH 5.0 after 30 min-incubation for
cellulase and xylanase, respectively. The sodium acetate buffer (Merck, Darmstadt,
Germany) (50 mM) was used to maintain the pH at 5.0. The initial pH was adjusted
to 5.0 because Viscozyme L works well with pH 3.0–5.0. Samples were taken out
every 3h for reducing sugar analysis. Hazelnut shell without any pretreatment was
also subjected to saccharification as the control. After the enzymatic hydrolysis,
samples were heated to 100 �C for 15 min to inactivate the enzymes (Ghose, 1987).
Enzymatic hydrolysis was also performed on alkali and ozone pretreated hazelnut
shells at 5% solid loading (dry basis) in 10 mL volume made up by 50 mM sodium
citrate buffer (pH 4.8), 40 µg/mL tetracycline hydrochloride (an antibiotic added to
avoid microbial contamination), Cellic® Ctec2 cellulase enzyme complex (110
FPU/mL) (density 1.1457 g/mL) at a dosage of 0.5 g enzyme/g biomass and HTec2
xylanase enzyme complex (density 1.1548 g/mL) at a dosage of 0.2 g enzyme/g
biomass. Samples were hydrolyzed in 50 mL centrifuge tubes in a shaking water
bath (Model:89032-226, VWR International, PA, USA) at 50 °C and 150 rpm for
72 h. Untreated biomass with equivalent enzyme loading was also hydrolyzed as
the control. After hydrolysis, the samples were centrifuged at 10,000 rpm for 10
min and the recovered supernatant was used for fermentable sugar yield
determination by measuring reducing sugars. Enzymatic conversion (η) (%) was
then calculated (eqn 12) as;
)12(100/,.
/,.(%))( ��
mLgsolidspretreatedinsugarreducingofConc
mLgehydrolysatinsugarreducingofConcconversionEnzymatic �
3.5 Pectinase Production By Submerged Fermentation (SmF)
The schematic diagram of the set-up of the submerged fermentation (SmF) process
conducted in the shake-flask bioreactors was presented in Figure 3.4. A 500 mL
shake-flask bioreactors containing 100 mL of fermentation medium similar to

50
growth medium but only amended with 5% hazelnut shell hydrolysate instead of
glucose was used for fermentation. Before inoculation, the flasks and medium were
sterilized by autoclaving at 121 oC for 15 min. After sterilization step, fermentation
medium was inoculated with 1 mL of overnight grown bacterial culture containing
106 CFU/mL and incubated under agitation of 130 rpm at 30 oC (Fig. 3.4). After
fermentation, the biomass was separated by centrifugation at 2000xg for 20 minutes
and the supernatant was used as a crude enzyme in the pectinase assay described in
section 3.2.4.
Figure 3.4 Schematic of pectinase production steps
3.5.1 Effect of Substrate Type
Effect of polymeric substrate (pectin) and organic wastes (hazelnut shells and its
hydrolysate) as a carbon source were carried out for selecting substrate.

51
3.5.2 Effect of pH on Pectinase Activity and Stability
To determine the effect of pH on pectinase activity, the enzyme assays were
performed at various pH range of 5.0-9.0 using 50 mM of the following buffers:
sodium acetate (pH 5.0), sodium phosphate (pH 7.0) and carbonate-bicarbonate (pH
9.0).
The pH stability of Bacillus subtilis pectinase was investigated in the pH range of
5.0-9.0 during 7 hours. After incubations, activity was determined by the standard
activity method and was reported as the ratio of enzyme activity after pH treatment
to the initial maximum activity at pH 7.0.
3.5.3 Effect of Temperature on Pectinase Activity and Stability
Effect of temperature on pectinase activity was determined in the range of 40-60oC.
In order to determine the effect of temperature on pectinase stability, enzyme
samples were incubated at 40-60 oC for 7 h. After incubation, the activity was
determined by the standard activity method and was reported as the ratio of enzyme
activity after temperature treatment to the initial maximum activity at 50 oC. From
a semilogarithmic plot of residual activity versus time, the inactivation rate
constants (kd) were calculated (from slopes), and apparent half lives were estimated
using equation 13. The half-life (t1/2) is known as the time where the residual
activity reaches 50%.
t1/2 =ln2kd (13)
3.6 Extraction of Carrot Juice
The carrots used in this study were purchased from a local market in Ankara,
Turkey. The carrot juice extraction illustrated in Figure 3.5 was carried out in the

52
pilot plant of Ankara University. The extract of crude enzyme and Pectinex 3XL
were used in processing of carrot juice. The extract of crude enzyme was obtained
from fermentation step as described in section 3.5.
Carrots
Washing
Pressing
Filtration
Raw juice
Figure 3.5 Flow chart of carrot juice extraction
3.7 Experimental Design
3.7.1 Experimental Design for Dilute Acid Pretreatment
The optimization of dilute acid pretreatment was carried out in several steps. The
first step was the selection of hydrolysis conditions (acid concentration,
temperature, and time) and their levels by using one-factor-at- a-time approach. The
second step was estimation of the optimum values by Box-Behnken design (BBD)
of Response Surface Methodology (RSM) to obtain the maximum reducing sugar
concentration. The third step was the use of Artificial Neural Network (ANN) to
predict reducing sugar concentration in comparison to RSM model.
Washin
ressing
Filtratio
aw jui

53
3.7.1.1 The Conventional One Factor At A Time Approach
One factor at a time approach involves varying one factor while keeping the other
factors at a constant level. The effects of acid concentration, time, and temperature
on hydrolysis conditions of hazelnut shells were examined.
3.7.1.2 Response Surface Methodology
One of the best models to describe chemical processes by analytical methods is
quadratic model in terms of linear and cubic equation. A set of 15 experiments was
carried out in two randomized replicates giving total experimental runs of 30 with
6 center runs. The individual and combined effects of temperature, acid
concentration and treatment time on reducing sugar production were studied using
Box–Behnken response surface method (Box & Behnken, 1960) (BBD) using
MINITAB 16.0 (Minitab Inc. State College, PA, USA) (Table 3.1). All reducing
sugar analyses were conducted in triplicate.

54
Table 3.1 Coded and uncoded variables of dilute acid pretreatment by Box-
Behnken surface design
Factors
Exp.No Temperature (oC) Acid conc. (%) Time (min)
coded uncoded coded uncoded coded uncoded
1 0 120 +1 5 +1 60
2 0 120 +1 5 -1 15
3 +1 130 -1 1 0 37.5
4 +1 130 +1 5 0 37.5
5 -1 110 -1 1 0 37.5
6 0 120 -1 1 +1 60
7 -1 110 0 3 -1 15
8 0 120 -1 1 -1 15
9 -1 110 +1 5 0 37.5
10 -1 110 0 3 +1 60
11 +1 130 0 3 +1 60
12 +1 130 0 3 -1 15
13 0 120 0 3 0 37.5
14 0 120 0 3 0 37.5
15 0 120 0 3 0 37.5

55
A quadratic mathematical model was developed (Equation 14) to fit the
experimental data using the response optimizer function of Minitab:
2333
2222
21113223311321123322110 XbXbXbXXbXXbXXbXbXbXbbY ����������
(14)
where Y is the reducing sugar concentration, b’s are regression coefficients, and
X1,X2,X3 are temperature, acid concentration and treatment time, respectively.
Analysis of variance (ANOVA) and regression were performed at 95% confidence
interval to define the coefficients of the predictive model and significant terms. The
optimum conditions for maximizing the reducing sugar concentration was
determined using Response Optimizer tool in MINITAB 16.0.
3.7.1.2.1 Model Validation
The constructed model was verified by conducting additional fermentation
experiments, which were not present in the design matrix and comparing the results
of experiments to the predicted values. The coefficient of determination (R2) was
calculated to check for the variability between the predicted vs. observed reducing
sugar concentration values. A statistical difference measure test was also carried
out to evaluate the performance of the model by calculating root mean square error
(RMSE) and mean absolute error (MAE) values which indicate the goodness of the
predictions as follows:
� �5.0
1
2exp,,
1��
���
� � �
�
N
iiipred XX
NRMSE
(15)
��
�N
iiipred XX
NMAE
1exp,,
1
(16)

56
where Xexp is the experimental value and Xpred is the predicted value of total
reducing sugar concentration, N is the number of data.
The reproducibility of the PG production was calculated using coefficient of
variation (CV) values as follows
where σ is sample standard deviation, and X̅ is sample mean. Lower values of CV
indicate higher reproducibility.
3.7.1.3 Artificial Neural Network (ANN) Modeling
ANN is a mathematical means of simulating the biological neurons in a brain learn
relationship between input and output data after training with example input and
output data sets (Kashaninejad et al., 2009). Especially in the past two decades, it
has been greatly used in numerous fields of science and engineering. ANNs consist
of many simple computational elements, called nodes or neurons, organized in
layers and operating in parallel (Silva et al., 2008). Neurons are connected by
weights that are modified during learning phase (Kashaninejad et al., 2009). All
neural networks have three main layers, which are called input, hidden and output
layers (Mehdizadeh & Movaghernejad, 2011). A number of classes of neural
networks exist in the literature such as, feed forward back propagation, recurrent
neural networks, cascade correlation neural networks and radial basis function
neural networks. All types of these network architectures have the same elements:
neurons, layers and weights. The most common type of ANN in engineering
application is multi-layer perceptron (MLP), which is a back propagation feed
forward network (Singh et al., 2008). In this work, a multi-layer feed forward neural
network has been used. MLP network consist of input and output layers, with
several but usually only one-hidden layer (Rurnelhart et al., 1986). In this particular
ANN, information moves only in one direction, forward from the input layer,
through the hidden layer and to the output layer (Mehdizadeh & Movaghernejad,
2011). The number of neurons in the input layer depends on the number of

57
independent variables and the number of neurons in the output layer corresponds to
dependent variables. Several ANNs with differing numbers of hidden layer neurons
was developed for describing dilute acid pretreatment. Input data were randomized
into three sets: learning, validation and testing. Usually 30% of data are used for
testing and remaining 70% for training and validation (Mehdizadeh &
Movaghernejad, 2011). The experimental data, 43 data points, was divided such
that 70% was used to train the model, 15% was used to validate the model and 15%
was used to test the generalization ability of the model. The activation function of
hidden layer was “logsig” and the one in output layer was “purelin”.
xe11logsig(x) �
� (18)
x(x)purelin � (19)
Training of the network was performed with the function of “trainlm”, that updates
weight and bias values according to Levenberg-Marquardt optimization. In learning
of network “learngd” as adaption learning function was used. The maximum
training epochs were 1000, and mean square error was 0.0001. The other parameters
of neural network were taken as defaults of neural network toolbox, MATLAB
R2011a (The MathWorks, USA).
It is necessary to train an artificial neural network before using it for a particular
application (Mehdizadeh & Movaghernejad, 2011). Feed forward network training
starts by applying the input vector to the input layer having network processing
element (Singh et al., 2008). During the training, the network learns to create new
outputs through a repetitive method (Mehdizadeh & Movaghernejad, 2011). The
generated outputs by network are compared with the target. The network is
adjusted, based on a comparison of the output and the target, until the network
output matches the target. Basically the purpose of training patterns is to reduce the
global error (Kashaninejad et al., 2009).
The performance of the ANN was statistically measured by mean squared error
(MSE), root percent deviation (RPD) and the coefficient of determination (R2). The

58
R2 represents how well the approximated function predicts the response versus just
using the response mean. Values closest to 1 are the best. The MSE is a
representation of the difference between the predicted and actual values and gives
a sense of how close the predicted values are to the observed values in the units of
those values. Lower values of MSE are good and was calculated using the formula
in equation 20. The RPD represents the percent that the error was of the value being
estimated. Lower values are good and was calculated using the formula in equation
21.
� �n
iipreMSE
n
iXX�
�� 1
2
exp,, (20)
� ���
�
n
i i
iipre
XXX
nRPD
1 exp,
exp,,100 (21)
Where Xpre,i is the predicted output from observation i, Xexp,i is the experimental
(target) output from observation i, is the average value of experimental output,
and n is the total number of data.
3.7.2 Optimization of Alkaline Pretreatment
Individual and combined effects of NaOH concentration, solid-liquid ratio (biomass
loading) and treatment time on solid recovery, lignin reduction (based on AIL) and
total reducing sugar (after enzyme hydrolysis), were studied by Box–Behnken
Design (BBD) using MINITAB 16.0. Optimal alkaline pretreatment conditions
were identified using the response optimizer function under DOE-RSM. The coded
and uncoded forms of independent factors are given in Table 3.2. A set of 30
experiments were carried out. The measurement of each response variable was
reported as the average of three replicates. Quadratic mathematical equation (Eqn.

59
22) as expressed below were also obtained by Response Surface Methodology
(RSM) analysis for predictive modeling:
Y = b0 + b1X1 + b2X2 + b3X3 + b12X1X2 +b13X1X3 + b23X2X3 + b11X12 + b22X2
2 + b33X32
(22)
where Y is the response (solid recovery, lignin reduction and total reducing sugar
yield after hydrolysis), b’s are regression coefficients, and X1,X2, and X3 are NaOH
concentration, solid-liquid ratio (SLR) and treatment time, respectively. Analysis
of variance (ANOVA) and regression were performed at 95% confidence interval
to define the coefficients of the predictive model and significant terms.
From regression analysis of Box-Behnken design, optimal conditions for alkaline
production were defined. To validate the model, additional trials at the defined
pretreatment conditions were carried out in triplicate. All experiments in this study
were conducted in triplicate with a 95 % confidence level.
Table 3.2 Coded and uncoded variables of alkaline pretreatment by using response
surface design.
Factors
Exp.No NaOH conc. (%) SLR (%) Time (min)
coded uncoded
coded
uncoded coded uncoded
1 0 5 0 10 0 60
2 0 5 0 10 0 60
3 0 5 0 10 0 60

60
4 +1 7 +1 15 0 60
5 +1 7 -1 5 0 60
6 -1 3 +1 15 0 60
7 -1 3 -1 5 0 60
8 -1 3 0 10 +1 90
9 +1 7 0 10 +1 90
10 0 5 +1 15 +1 90
11 0 5 -1 5 +1 90
12 -1 3 0 10 -1 30
13 +1 7 0 10 -1 30
14 0 5 -1 5 -1 30
15 0 5 +1 15 -1 30
3.7.3 Experimental Design and Optimization of Ozone Pretreatment
The optimization of ozone concentration, moisture and treatment time for solid
recovery, lignin reduction and total reducing sugar yield were carried out in two
steps. The first step was the selection of physical parameters such as ozone
concentration, moisture concentration and treatment time. The second step was the
estimation of the optimum values by using full factorial design to obtain maximal
reducing sugar yield.
Table 3.2 (continued)

61
Initial screening of factors was performed with BBD technique to identify the
crucial parameters affecting lignin reduction, solid recovery and total reducing
sugar yield and subsequently full factorial design was used to determine the optimal
total reducing sugar production using the selected process variables.
3.7.3.1 BBD Design
The individual and combined effects of ozone concentration, moisture and
hydrolysis time on total reducing sugar yield, solid recovery and lignin reduction
were studied using Box–Behnken response surface method (Table 3.3). A quadratic
predictive model was fit to experimental data to simulate reducing sugar yield, solid
recovery and lignin reduction as follows:
Y = b0 + b1X1 + b2X2 + b3X3 + b12X1X2 +b13X1X3 + b23X2X3 + b11X12 + b22X2
2 + b33X32
(23)
where Y is the response (solid recovery, lignin reduction and total reducing sugar
yield), b’s are regression coefficients, and X1,X2,X3 are ozone concentration,
moisture concentration and hydrolysis time.

62
Table 3.3 Box-Behnken design matrix for identifying key process variables
Factors
Exp.No Ozone conc.(%) Moisture (mg/L) Time (min)
coded uncoded coded uncoded coded uncoded
1 -1 25 0 40 +1 120
2 0 30 -1 30 +1 120
3 0 30 +1 50 +1 120
4 +1 35 0 40 +1 120
5 -1 25 -1 30 0 90
6 -1 25 +1 50 0 90
7 0 30 0 40 0 90
8 0 30 0 40 0 90
9 0 30 0 40 0 90
10 +1 35 -1 30 0 90
11 +1 35 +1 50 0 90
12 -1 25 0 40 -1 60
13 0 30 -1 30 -1 60
14 0 30 +1 50 -1 60
15 +1 35 0 40 -1 60

63
3.7.3.2 Full-Factorial Design
Based on BBD results, the full factorial design was constructed for 2 factors (ozone
concentration and time) each having 3 levels (-1, 0 and 1) with 15 experimental
designs (12 points of the factorial design and 3 center points to establish the
experimental errors) as shown in Table 3.4. All experiments were carried out in
triplicate and the results are reported in terms of mean values.
Table 3.4 Experimental levels of the variables studied in the full factorial design
Factor Low (-1) Center (0) Upper (+1)
Ozone concentration (mg/L)
30
40
50
Time (min)
60
90
120
3.7.4 Optimization of Pectinase Production
The optimization of medium components and culture conditions for pectinase
production by B.subtilis and B.pumilus was carried out in two steps. The first step
was the selection of physical parameters such as pH, fermentation time,
temperature, inoculum volume (%, v/v) and medium components such as pectin,
yeast extract, magnesium sulphate [MgSO4], and dipotassium hydrogen phosphate
[K2HPO4].

64
The second step was the estimation of the optimum values using Box-Behnken
design (BBD) under RSM to obtain the maximum pectinase activity.
Initial screening of factors (step 1) was performed with Plackett-Burman Design
(PBD) to identify the primary parameters affecting pectinase production and
subsequently BBD technique was used to determine the optimal pectinase
production using the selected factors (step 2).
3.7.4.1 Plackett Burman Design (PBD)
A two level PBD experimental matrix was set up to identify the significant factors
of pectinase production. The PB design provides a linear model, where only main
effects are taken into account. Selection of appropriate carbon, nitrogen and other
nutrients is one of the most critical stages in the development of an efficient and
economic process. In this study, 8 independent variables were selected, namely pH,
fermentation time, temperature, inoculum volume (%, v/v) and media components
of pectin, yeast extract, magnesium sulphate [MgSO4], and dipotassium hydrogen
phosphate [K2HPO4]. The concentration range of each nutrient was based on
various studies in the literature. Table 3.5 illustrates the design matrix of various
components with coded and uncoded values. Table 3.6 shows PB experimental
design in coded variables form. Pareto chart was then plotted to highlight the most
significant factors responsible for pectinase production (Figure J.1).

65
Table 3.5 Coded and uncoded variables of independent factors in PBD.
Variable
Low (-1)
High (+1)
pH 5 9
Fermentation time (h)
24
72
Temperature(oC)
30
40
Inoculum volume (%, v/v) Pectin (%, w/v) Yeast extract (%, w/v)
1
0.2
0.1
5
0.5
0.5 MgSO4 7H2O (%, w/v)
0.02
0.08
K2HPO4 (%, w/v)
0.02
0.04

66
T
able
3.6
Pla
cket
t Bur
man
Des
ign
for s
cree
ning
maj
or fa
ctor
s of p
ectin
ase
prod
uctio
n.
Run
No.
pH
Tim
e
(h)
Tem
pera
ture
(o C)
Inoc
ulum
Vol
ume
(%v/
v)
Pect
in
(%w
/v)
Yea
st
extr
act
(%w
/v)
MgS
O4
(%w
/v)
K2H
PO4
(%w
/v)
1 +1
-1
+1
-1
-1
-1
+1
+1
2 +1
+1
-1
+1
-1
-1
-1
+1
3 -1
+1
+1
-1
+1
-1
-1
-1
4 -1
-1
+1
+1
+1
-1
+1
+1
5 -1
-1
-1
+1
+1
+1
-1
+1
6 -1
+1
-1
-1
-1
+1
+1
+1
7 +1
+1
-1
+1
+1
-1
+1
-1
8 -1
+1
+1
+1
-1
+1
+1
-1
9 -1
-1
-1
-1
-1
-1
-1
-1
10
+1
-1
-1
-1
+1
+1
+1
-1
11
+1
+1
+1
-1
+1
+1
-1
+1
12
+1
-1
+1
+1
-1
+1
-1
-1

67
3.7.4.2 BBD Design and Optimization
BBD technique is a statistical tool used to develop a quadratic model including major
factors and their interactions to estimate pectinase production (Box & Behnken, 1960).
Based on Pareto chart results (Figure J.1), BBD matrix was constructed for the five
significant factors (pH, fermentation time, fermentation temperature, yeast extract and
dipotassium hydrogen phosphate [K2HPO4]). The ranges for each factor studied were
5.0-9.0 for pH, 24-48 h for fermentation time, 30-40 oC for temperature, 0.1-0.5 (%,
w/v) for yeast extract and 0.02-0.04 (%,w/v) for K2HPO4.
A set of 46 experiments were conducted and the results given in Table 3.7 were
analyzed by MINITAB 16.0. Each response was reported as the average of two
replicates.
A second order predictive model was fitted to represent linear, interaction and quadratic
effects of variables on enzyme production (Eqn 24):
Y= b0 + b1X1 + b2X2 + b3X3 + b4X4 + b5X5 + b11X12 + b22X2
2 + b33X32+ b44X4
2 + b55X52
+b12X1X2 +b13X1X3 + b14X1X4 + b15X1X5 + b23X2X3 + b24X2X4 +b25X2X5 + b34X3X4 +
b35X3X5 + b45X4X5 (24)
where Y is the response (pectinase activity), b’s are regression coefficients, and
X1,X2,X3, X4, X5 are pH, fermentation time, fermentation temperature, yeast extract and
dipotassium hydrogen phosphate [K2HPO4], respectively. The analysis of variance
(ANOVA) and regression analysis were performed to define the coefficients of the
predictive model and significant terms using MINITAB 16.0.
From regression analysis of Box-Behnken design, optimal conditions for pectinase
production were defined. To validate the model, additional trials at the defined
fermentation conditions were carried out in triplicate.

68
T
able
3.7
Exp
erim
enta
l des
ign
for o
ptim
izat
ion
of p
ectin
ase
prod
uctio
n us
ing
Box
-Beh
nken
resp
onse
surf
ace
met
hod
(RSM
).
Run
Ord
er
pH
(A)
Tem
pera
ture
(B)
Tim
e (h
) (C
) Y
east
ext
ract
(%w
/v)
(D)
K2H
PO4
(%w
/v)
(E)
1 0
0 +1
-1
0
2 0
+1
0 0
+1
3 0
+1
0 -1
0
4 0
0 +1
0
-1
5 0
-1
0 0
-1
6 +1
0
+1
0 0
7 0
0 0
0 0
8 +1
0
0 +1
0
9 0
+1
+1
0 0
10
+1
+1
0 0
0 11
+1
0
0 0
+1
12
0 -1
0
+1
0 13
0
0 0
0 0
14
+1
0 -1
0
0 15
0
0 -1
0
+1
16
-1
0 +1
0
0 17
-1
0
-1
0 0
18
0 +1
0
+1
0 19
-1
0
0 0
-1
20
0 0
+1
0 +1
21
0
0 0
0 0
22
0 +1
0
0 -1

69
23
0 -1
0
0 +1
24
0
-1
+1
0 0
25
0 0
0 0
0 26
0
0 0
0 0
27
0 +1
-1
0
0 28
-1
0
0 +1
0
29
0 0
0 -1
-1
30
0
0 0
+1
+1
31
+1
-1
0 0
0 32
0
0 -1
0
-1
33
0 -1
0
-1
0 34
0
0 +1
+1
0
35
+1
0 0
-1
0 36
0
0 0
-1
+1
37
0 0
-1
+1
0 38
-1
+1
0
0 0
39
-1
0 0
-1
0 40
0
0 0
+1
-1
41
+1
0 0
0 -1
42
-1
0
0 0
+1
43
-1
-1
0 0
0 44
0
0 -1
-1
0
45
0 -1
-1
0
0 46
0
0 0
0 0
Tabl
e 3.
7 (c
ontin
ued)

70
3.7.5 Optimization of Clarification Process
A BBD matrix was constructed for the three process variables (enzyme
concentration (%), pH and time (h). The ranges for each factor were 0.1-0.5 % for
enzyme concentration, 4.0-7.0 for pH, and 2-6 h for time (Table 3.8). The optimal
clarification conditions were defined using a quadratic mathematic equation
expressed as;
Y = b0 + b1X1 + b2X2 + b3X3 + b12X1X2 +b13X1X3 + b23X2X3 + b11X12 + b22X2
2 + b33X32
(25)
where Y is the response clarity, b’s are regression coefficients, and X1,X2,X3 are
enzyme concentration, pH and time. From regression analysis of Box-Behnken
design, optimal conditions for clarity were defined. To validate the model,
additional trials at the defined clarification conditions were carried out in triplicate.
Table 3.8 Coded and uncoded variables of clarification by using response surface
design
Factors
Exp.No Enzyme Conc.
(%)
pH Time (h)
coded uncoded coded uncoded coded uncoded
1 0 0.3 -1 4.0 +1 6
2 0 0.3 +1 7.0 +1 6

71
3 0 0.3 0 5.5 0 4
4 +1 0.5 -1 4.0 0 4
5 +1 0.5 +1 7.0 0 4
6 +1 0.5 0 5.5 -1 2
7 0 0.3 -1 4.0 -1 2
8 0 0.3 +1 5.5 0 4
9 -1 0.1 +1 5.5 -1 2
10 -1 0.1 -1 4.0 0 4
11 -1 0.1 0 5.5 +1 6
12 0 0.3 +1 7.0 -1 2
13 +1 0.5 0 5.5 +1 6
14 -1 0.1 +1 7.0 0 4
15 0 0.3 0 5.5 0 4
3.8 Statistical Analysis
Statistical analyses were accomplished using MINITAB 16.0 to test the significance
of different acidic, alkaline, ozone, enzymatic hydrolysis, pectinase activity and
clarification treatments. The pairwise comparisons were made by Tukey’s test with
a significance level of 0.05.
Table 3.8 (continued)

72
3.9 Cost Analysis
Cost of dilute acid pretreatment providing the highest reducing sugar conversion
was also estimated for better assessment. The total cost of dilute acid pretreatment
was calculated using the following Eqn (26) according to study of Vavouraki et al.
(2014):
ElchchGG PElPMPMTLinTC � � ��)(
where TC represents the total cost (in Turkish Liras, TL) for the dilute acid
pretreatment, MG denotes the mass (in g) of glucose obtained at the end of
pretreatment, PG is market prices of glucose (in TL/g) considered as 0.21 TL/g, Mch
denotes the amount of chemical used for pretreatment (H2SO4) and Pch its cost,
considered as 20 TL/L H2SO4. El represents the estimated electrical energy
consumed (in KWh) for dilute acid pretreatment, while PEl is the cost of electricity
(0.18 TL/KWh) (Vavouraki et al., 2014).
(26)

73
CHAPTER 4
RESULTS AND DISCUSSION
4.1 Composition of Raw Material
The hazelnut shells contained 24.20±0.99% (w/w) cellulose, 28.20±0.14 % (w/w)
hemicellulose and 34.64±0.43 % (w/w) lignin on a wet basis (Table 4.1), which
approved their potential as the source of sugars such as xylose and glucose. These
results agreed well with study of Demirbaş (2006). The chemical composition of
hazelnut shells varies with geographic location, season, harvesting practice, as well
as analysis procedures (Agblevor et al., 2003).
Table 4.1 Constituents of the hazelnut shell used in the experiments, expressed as
percent of wet basis.
Constituent
Contenta (%, w/w, wb)
Dry solid
Extractive
Fat
Crude fiber
90.30±0.24
6.09 ±0.16
6.06±0.48
68.22±1.86

74
Cellulose
Hemicellulose
Total lignin
Ash content
24.20±0.99
28.20±0.14
34.64±0.43
1.13±0.04 a Results belong to two replicates
4.2 Effect of Pretreatment Methods on Fermentable Sugar Production
4.2.1 Effect of Dilute Acid Pretreatment
4.2.1.1 Effect of Particle Size on Reducing Sugar Concentration
Particle size in pretreatments and enzymatic hydrolysis is important for yield of
fermentable sugars. Table 4.2 shows the effects of the particle size on concentration
of reducing sugars. When particle size decreases, surface area increases. Thus,
reaction sites, where molecules can collide and interact increase. For particle size
larger than 1mm, the penetration of acid was slower with result of declining the
reducing sugar concentration. It was clear that the reducing sugar concentration
decreased with increasing particle size, and at the particle size 1 mm, the reducing
sugar concentration was the highest (16.74 g/L). Thus, a particle size of 1mm was
chosen as the best for reducing sugars.
Table 4.1 (continued)

75
Table 4.2 Reducing sugar concentration with respect to particle size (3.42%, w/w,
acid, 130 oC, 31.7 min).
Particle size (mm) Reducing sugar concentration
(g/L)*
0.18 15.81±0.14b
0.71 15.35±0.06c
1 16.74±0.13a
2 15.11±0.10c
* Results belong to two replicates
4.2.1.2 Effect of Solid/Liquid Ratio On Reducing Sugar Yield
Three different solid/liquid ratios of 1/20, 1/10 and 1/7 (w/v) were investigated in
dilute acid pretreatment for reducing sugar yield (Figure 4.1). It was observed that
the reducing sugar yield decreased with increasing solid/liquid ratio and the highest
yield was achieved at the solid/ liquid ratio of 1/20, giving 63.2±0.5 % (w/w) of
reducing sugar yield. Similar observations were reported by Ferrer et al. (2013) and
Amenaghawon et al. (2014) who reported that maximum reducing sugar
concentration were obtained using low liquid to solid ratio. At the ratio of 1/7, the
reducing sugar yield decreased to 57.7 % (w/w). High solid/liquid ratio can result
in mixing problems, which are reflected by slow solid liquefaction. Therefore, a
ratio of 1/20 was chosen as the best ratio for production of reducing sugars. Mansilla
et al. (1998) studied the effect of acid hydrolysis on rice hull to produce furfural.
They reported that the optimal furfural production obtained with a solid liquid ratio
of 1/25.

76
Solid/liquid ratio (w/v)
1/20 1/10 1/7
Redu
cing
suga
r yie
ld (w
/w, %
)
0
10
20
30
40
50
60
7063.2±0.5
50.4±2.3
57.7±0.6
Figure 4.1 Reducing sugar yield with respect to solid/liquid ratio (3%, w/w, acid,
130 oC, 30 min)
4.2.1.3 Screening The Factors Affecting Dilute Acid Pretreatment
The effects of acid concentration, time, and temperature on hydrolysis conditions
of hazelnut shells were examined using one factor at a time approach. To determine
the temperature effect, three different temperatures (110, 120 and 130 °C) were
applied at 3% (w/w) acid concentration for 37.5 min. As temperature increased,
reducing sugar concentration increased (Fig. 4.2). The amount of reducing sugar
was increased at high temperature since reducing sugars released from

77
hemicellulose (Taherzadeh & Karimi, 2007; Sirikarn et al., 2012). For temperatures
of 110–120 °C, the amounts of reducing sugar were not significantly different
(P>0.05). The reducing sugar concentration at 130 °C (16.74 g/L) was significantly
higher than the concentration at 110 °C (9.67 g/L) (P<0.05).
Temperature (oC)
110 120 130
Red
ucin
g su
gar (
g/L)
0
2
4
6
8
10
12
14
16
18
ControlTreated
Figure 4.2 Hydrolysis of hazelnut shell at various temperatures (3%, w/w, 37.5
min)

78
Different acid (H2SO4) concentrations (1%, 3% and 5%, w/w) were then used at
130 oC for 37.5 min to assess the impact of acid concentration. The average results
are shown in Fig. 4.3. According to ANOVA results acid concentration had
significant effect on reducing sugar concentration (P<0.05). Increasing the acid
concentration from 1% to 3% (w/w) increased the reducing sugar concentration
from 12.56 g/L to 16.74 g/L whereas increasing the acid concentration from 3% to
5% (w/w) decreased the reducing sugar concentration from 16.74 g/L to 15.18 g/L.
This may be explained by formation of organic acids (formic acid and acetic acid)
and 5-HMF and furfural which, are byproducts of hexose and pentose degredation.
Thus, the 3% acid concentration was chosen as the best level.
Acid concentration (w/w, %)
control 1 3 5
Red
ucin
g su
gar (
g/L)
0
5
10
15
20
Figure 4.3 Hydrolysis of hazelnut shell at various acid concentrations (130 oC, 37.5
min)

79
Increasing the acid concentration leads to increase in the concentration of hydrogen
ions, which increase in turn increase the rate of the hydrolysis reaction and
consequently the glycosidic bonds breakage resulting in a high conversion of
hemicellulose fraction into fermentable sugars (Kumar et al., 2009; Mosier et al.,
2002). Hu et al. (2010) investigated the acid hydrolysis of sugar maple wood extract
at atmospheric pressure using dilute sulfuric acid. They showed that increasing the
acid concentration resulted in an increase in the concentration of fermentable
sugars. Maximum xylose concentration was found as 161.58 g/L with 6.2% H2SO4
at 95 oC for 50 min (Hu et al., 2010).
Finally, the time effect was examined using the aforementioned ideal temperature
and acid concentration levels for periods of 15, 37.5 and 60 min. The results are
shown in Fig. 4.4.
Time (min)15 38 60
Redu
cing
sug
ar (g
/L)
0
5
10
15
20
ControlTreated
Figure 4.4 Hydrolysis of hazelnut shells at various time (130 oC, 3%, w/w, acid)

80
It was clear that, the time had a limited impact, yielding a decrease in reducing sugar
concentration after a 60 min hydrolysis. A period of 37.5 min showed the highest
reducing sugar concentration (16.74 g/L). Therefore, it was chosen as the best time
among the tested levels for production of high fermentable sugars.
These results indicated that a temperature of 130 oC, a period of 37.5 min and 3%
(w/w) acid concentration revealed the highest reducing sugar concentration (16.74
g/L) which was also equal to 63.2% yield. Arslan and Saraçoglu (2010) studied the
hydrolysis of hazelnut shells using 3-5% H2SO4 at 100-120 oC with the 1/7 solid to
liquid ratio and reported that the highest reducing sugar concentration was obtained
at 120 oC, 5% H2SO4 and 30 min. When the overall reducing sugar yield of this
study was compared with the previous studies conducted with hazelnut shell
(57.7%) (Arslan & Saraçoglu, 2010) and cassava bagasse (62.4%) (Woiciechowski
et al., 2002) it was found that the overall sugar yield of this study was higher
(62.8%) (Table 4.3). The difference among results is due to the type of the raw
material and difference in hydrolysis conditions.
Table 4.3 Saccharification yields for various agro-residues at different dilute acid
pretreatment conditions.
Temperature (oC)
Acid conc. (%)
Time (min)
Raw material
Sacc. Yield
References
140 6 15 Cotton stalk
47.9 (Akpinar et al., 2011)
120 5 30 Hazelnut shell
57.7 (Arslan & Saraçoglu, 2010)
121 1 27 Rice straw
77 (Roberto et al., 2003)

81
120 1 10 Cassava bagasse
62.4 (Woiciechowski et al., 2002)
130 3.42 31.7 Hazelnut shell
62.8 This study
As a result, acid concentration, time and temperature are important parameters
which affect the sugar yield for dilute acid hydrolysis. For comprehensive
understanding of interactions between each factor and for complete optimization,
further study was carried out to maximize the sugar yields using response surface
method.
4.2.1.4 Response Surface Optimization
The experimental levels of temperature (X1), acid concentration (X2), and time (X3)
tested for optimization of reducing sugar production are shown in Table 3.3.
Overall, 2.84 to 15.24 g/L reducing sugar were obtained when hazelnut shells were
treated with dilute acid, depending on pretreatment conditions shown in Table 4.4.
The highest reducing sugar of about 15.24 g/L was obtained at 130 oC, 5% (w/w)
acid solution, and 37.5 min of time, whereas the poorest conditions were 110 oC,
1% (w/w), and 37.5 min, giving about 2.84 g/L of reducing sugars.
Table 4.3 (continued)

82
Table 4.4 Experimental design for optimization of dilute acid pretreatment using
response surface method (RSM)
Independent Variables Response (Reducing sugar, g/L)
Exp.
No
Temperature
(oC)
Acid conc.
(%)
Time
(min)
Experimentala
Predicted
1 120 5 60 10.47±0.12 G 11.18
2 120 5 15 10.99±0.15 FG 11.02
3 130 1 37.5 12.57±0.18 DE 12.69
4 130 5 37.5 15.24±0.06 A 14.65
5 110 1 37.5 2.84±0.15 J 3.43
6 120 1 60 7.23±0.19 H 7.20
7 110 3 15 6.15±0.13 H 6.25
8 120 1 15 4.94±0.11 I 4.24
9 110 5 37.5 12.36±0.17 DE 12.23
10 110 3 60 11.70±0.16 EF 11.13
11 130 3 60 13.75±0.23 BC 13.65
12 130 3 15 14.84±0.32 AB 15.41
13 120 3 37.5 12.89±0.06 CD 13.07
14 120 3 37.5 12.89±0.30 CD 13.07
15 120 3 37.5 13.42±0.25 CD 13.07
a Results belong to two replicates

83
To fit the experimental data to Eqn. (26), regression analysis was performed and
the resulting model was evaluated by ANOVA (Table 4.5).
Table 4.5 Significance of term coefficients for BBD using coded values; X1:
Temperature (oC); X2: Acid concentration (w/w); X3: Time (min)
Term Coefficient
Standard
Error
Coefficient T Value P Value
Constant 13.07 0.2320 56.313 0.000
X1 2.92 0.1421 20.550 0.000
X2 2.69 0.1421 18.927 0.000
X3 0.78 0.1421 5.467 0.000
X1* X2 -1.71 0.2009 -8.535 0.000
X1* X3 -1.66 0.2009 -8.261 0.002
X2* X3 -0.70 0.2009 -3.502 0.000
X12 0.44 0.2092 2.109 0.048
X22 -2.76 0.2092 -13.197 0.000
X32 -1.90 0.2092 -9.085 0.000 *Result is significant when p<0.05.
According to ANOVA results, the insignificant terms were excluded and the final
form of the equation was given as:
3231
2123
22
21321
70.066.171.190.176.244.078.069.292.207.13
XXXXXXXXXXXXY
�����
(27)

84
where Y is the predicted reducing sugar concentration, X1 , X2 and X3 are coded
values for temperature, concentration and time, respectively. The insignificant lack
of fit (P = 0.226 >0.05) and high values of R2=0.9846 proved that the model fitted
well to the experimental data (Table 4.6). All factors showed significant effects (P
<0.05) on reducing sugar concentration and the interactions between temperature-
temperature, concentration–concentration, time interactions and temperature–
concentration showed significant effects (Table 4.5). The complete experimental
design, results and predicted values are given in Table 4.4.
Table 4.6 ANOVA results for dilute acid pretreatment using coded values
Source of
variation
Degrees
of
freedom
Sum of
squares
Mean
squares F Ratio P Value
Model
Linear Effects 3 261.803 87.268 270.14 0.000
Interaction
Effects 3 49.537 16.512 51.11 0.000
Quadratic
Effects 3 81.897 27.299 84.51 0.000
Residual 19 6.138 0.323
Lack of Fit 15 5.493 0.366 2.27 0.226
Pure Error 4 0.645 0.161
Total 29 399.457
R-Sq = 0.9846 % R-Sq(adj) = 0.9765 % R-Sq(pred) = 0.9582 %

85
Estimation of reducing sugar at varying process variables (temperature, acid
concentration, and time) are pictured in response surfaces plots shown in Figures
4.5-7. Figure 4.5 shows the effect of acid concentration and time on reducing sugar
at the mid-point temperature of 120 °C. The reducing sugar content of the
hydrolyzates were strongly influenced by both variables, as indicated by sharp
increasing line and decreasing curvature around higher ends. Increasing the acid
concentration during hydrolysis leads to a corresponding increase in the
concentration of hydrogen ions, which in turn increases the rate of the hydrolysis
reaction. Thus, the glycosidic bonds are broken to result in a high conversion of
hemicellulose fraction into fermentable sugars (Mosier et al., 2002). An increase in
acid concentration from 1 to 3% (w/w) gave the highest reducing sugar of 12.5 g/L
at about 37.5 min, but above 3% (w/w) a decrease was observed. Three percent
dilute acid could be considered as a high acid concentration for this pretreatment
due to conversion of reducing sugars into 5-HMF or furfural, which caused a
decrease in reducing sugar yield.

86
60
405.0
7.5
10.0
12.5
1.02.5 20
4.05.5
(g/L)Reducing sugar
Time (min)
Acid concentration (%, w/w)
Figure 4.5 Response surface plot for the effects of acid concentration, and time on
reducing sugar (temperature is constant at 120 °C)
On the other hand, the effect of temperature and time on reducing sugar is shown
in Figure 4.6, where acid concentration was set at 3% (w/w) as the center point. A
remarkable increase in reducing sugar was observed as temperature and time
increased and this increase was limited beyond 50 min (Figure 4.6). The sugar yield
increased with increase of temperature and time, due to hemicellulose removal,
which is transformed to hexose and pentose (Idrees et al., 2014). The maximum
reducing sugar concentration of 14.84 g/L was obtained at 130 °C and 15 min. This
result agrees with Clausen & Gaddy (1993), who also observed that the hydrolysis
of cellulose to D-glucose was highly dependent upon temperature (50-100 °C).

87
60
5 40
10
15
110 20120
130
Time (min)
Temperature (°C)
Reducing sugar (g/L)
Figure 4.6 Response surface plot for the effects of temperature and time on
reducing sugars (acid concentration is constant at 3%, w/w).
A similar positive effect of temperature was observed in Figure 4.7, showing the
effect of temperature and acid concentration on reducing sugar, where 3% (w/w)
acid concentration was the limit for this increase (Figure 4.7). Under elevated
temperatures and acidic medium, monosaccharide degradation occurs, thus the
production of reducing sugars is adversely affected.

88
5.5
4.05
10
2.5110
15
120 1.0130Temperature (°C)
w/w)Acid concentration (%,
Reducing sugar (g/L)
Figure 4.7 Response surface plot for the effects of temperature and acid
concentration on reducing sugars (time is constant at 37.5 min).
The interactive effects of significant variables were represented in contour plots as
shown in Fig. 4.8. The maximum response is referred to a surface confined in the
smallest ellipse in a contour plot. The perfect interaction between the independent
variables can be shown when elliptical contours are obtained (Zahangir et al., 2009).
An increase in acid concentration from 1% to 3% (w/w) increased the reducing
sugar to 12.5 g/L (Fig. 4.8.a). It can be seen that for the 30 min of time, when the
temperature was increased from 120 to 130 °C, the reducing sugar concentration
increased from >12 g/L to 16 g/L (Fig. 4.8.b).
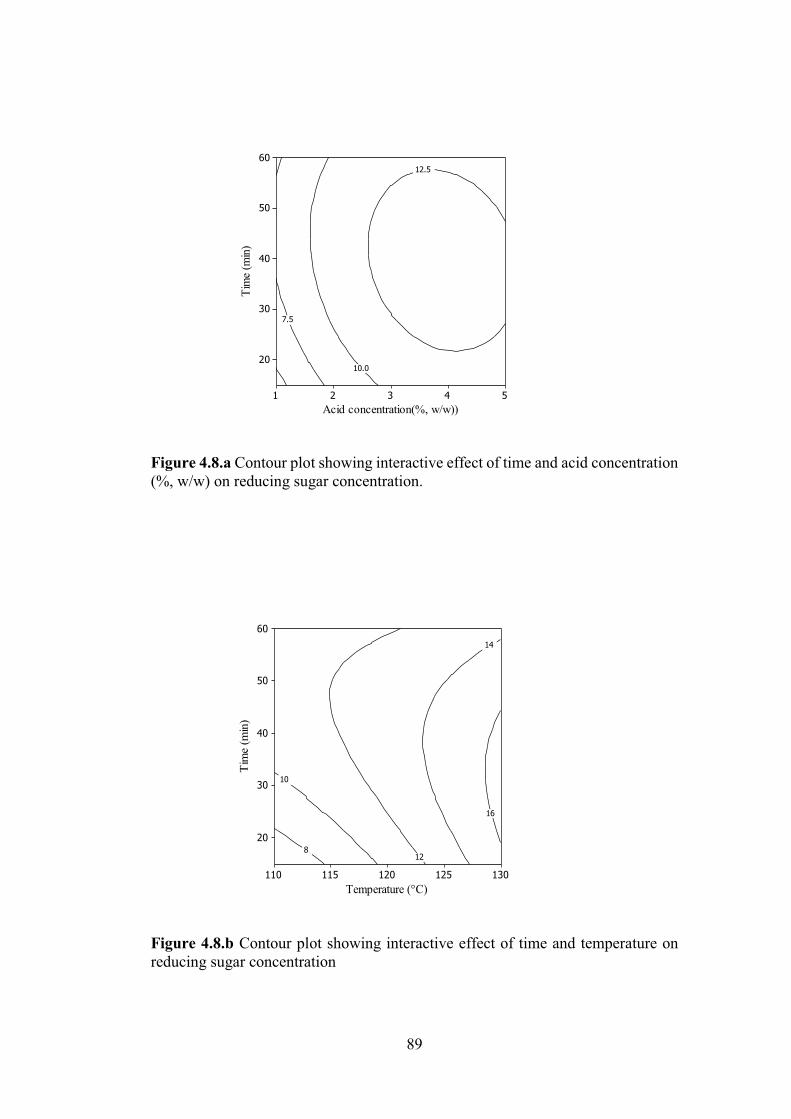
89
12.5
10.0
7.5
Acid concentration(%, w/w))
Tim
e (m
in)
54321
60
50
40
30
20
Figure 4.8.a Contour plot showing interactive effect of time and acid concentration (%, w/w) on reducing sugar concentration.
16
14
12
10
8
Temperature (°C)
Tim
e (m
in)
130125120115110
60
50
40
30
20
Figure 4.8.b Contour plot showing interactive effect of time and temperature on reducing sugar concentration

90
Fig. 4.8.c shows that the effect of acid concentration and temperature on reducing
sugar concentration. The interactive effect of acid concentration with temperature
had positive significant effect. When the acid concentration was increased from 2%
(w/w) to 3 % (w/w), the reducing sugar concentration increased from 7.5 g/L to 10
g/L (Fig. 4.8.c).
15.0
12.5
10.0
7.5
5.0
Temperature (°C)
Aci
d co
ncen
tratio
n (%
, w/w
)
130125120115110
5
4
3
2
1
Figure 4.8.c Contour plot showing interactive effect of acid concentration and
temperature on reducing sugar concentration
To confirm the validity of RSM model, eleven optimum check points were selected
by intensive grid search performed over the entire experimental domain (Table 4.7).
The resultant experimental data were compared with that of the predicted values in

91
Figure 4.9, which gave high correlation with R2=0.9578 and slope about 1.00. The
constructed model was also assessed using error analysis. The RMSE and MAE
values were calculated as 0.61 and 0.15, respectively. Low values of RMSE and
MAE also indicate that the model was successful in predicting reducing sugar
concentration. Furthermore, it was found that error was systematic
(RMSEs=0.02<RMSEu=0.61), of which experimental values were slightly higher
than the predicted values.
Table 4.7 Verification experiments of dilute acid pretreatments
Independent Variables Response (Reducing sugar,g/L)
Exp.
No
Temperature
(o C)
Acid conc. (%)
Time
(min)
Experimental
Predicted
1 120 5 37.5 13.77 12.49
2 130 3 30 16.74 17.54
3 125 4 35 14.87 14.48
4 130 1 60 10.88 10.04
5 125 1.5 35 12.16 11.22
6 115 2 35 9.36 8.64
7 115 4 35 12.13 12.23
8 110 3 30 9.67 9.29
9 110 1 60 6.50 4.30
10 120 5 30 13.80 12.33
11 120 3 15 9.50 10.13

92
Figure 4 8
Experimental reducing sugar concentration (g/L)
4 6 8 10 12 14 16 18
Pred
icte
d re
duci
ng su
gar c
once
ntra
tion
(g/L
)
2
4
6
8
10
12
14
16
18
20
y=1.006x+0.07613R2=0.9578
Figure 4.9 Predicted vs. experimental reducing sugar concentration for validation
of the response surface model.
Therefore, to determine the optimal pretreatment conditions, the response optimizer
tool in MINITAB® 16.0 was used. The optimum conditions for dilute acid
pretreatment were found as 130 °C of temperature, 3.42% (w/w) of acid
concentration and 31.7 min of time giving 62.8% (w/w) yield (or 16.65 g/L) at
minimum cost (-0.25 TL). It was concluded that the total cost of dilute acid
pretreatment at optimum conditions is negligible. The profit can be improved
furthermore when xylose is also targeted at production in addition to glucose.

93
4.2.1.5 Artificial Neural Network (ANN) Modeling
4.2.1.5.1 Training Data Set
Various ANN models were tabulated to show the effect of the number of neurons
in the hidden layer on the ability of the model to predict the response variables
(Table 4.8). The coefficient of determination (R2), mean squared error (MSE), and
the root percent deviation (RPD) statistics from the training data are also shown in
Table 4.8.
Generally, as the number of hidden layer neurons in the ANN increases, the R2
values increase slightly and the MSE values decrease slightly. The best network
model was the network with minimal MSE and RPD and maximum R2 of predicted
and experimental data (Table 4.8)

94
Tab
le 4
.8 A
rtific
ial n
eura
l net
wor
k (A
NN
) mod
els a
nd th
eir M
SE, R
2 and
RPD
val
ues f
rom
trai
ning
dat
a
Mod
el n
ame
Stat
istic
al c
rite
ria
Red
ucin
g su
gar
conc
entr
atio
n (g
/L)
A
NN
3 N
euro
n
MSE
R
2 R
PD (%
)
0.62
99
0.97
96
4.76
27
A
NN
4 N
euro
n
MSE
R
2 R
PD (%
)
0.13
89
0.99
49
1.74
74
A
NN
5 N
euro
n
MSE
R
2 R
PD (%
)
0.04
33
0.99
83
0.46
47
A
NN
6 N
euro
n
MSE
R
2 R
PD (%
)
0.02
63
0.99
91
0.51
92
A
NN
7 N
euro
n M
SE
R2
RPD
(%)
0.02
65
0.99
90
0.54
23
A
NN
8 N
euro
n
MSE
R
2 R
PD (%
)
0.04
31
0.99
85
1.06
57
A
NN
10
Neu
ron
MSE
R
2 R
PD (%
)
0.02
29
0.99
89
0.27
00
A
NN
12
Neu
ron
MSE
R
2 R
PD (%
)
0.11
25
0.99
54
0.82
45

95
From the training data, the ANN model with 6 hidden layer neurons appears to be
the best predictor based on the simplicity of this ANN versus 12 neurons as well as
the low MSE and RPD values (Table 4.8). Therefore, a 3-6-1 network that could
accurately model the dilute acid pretreatment among the training samples was built
for modeling. Figure 4.10 shows an example of the architecture for feed forward
backpropagation ANN, which includes an input layer with three inputs, a hidden
layer that contains six neurons, and an output layer.
Figure 4.10 Schematic representation of ANN to simulate the dilute acid
pretreatment of hazelnut shells.
Temperature
Acid
concentration
Input Layer
Hidden Layer
Output
Layer
O
L
Reducing
sugar
concentration Time
ayer

96
4.2.1.5.2 Testing of Data Set
After the training stage had been completed, the processed networks were tested
and the performances were evaluated by determining mean square errors (MSE)
and coefficient of determination of both training and testing processes (Table 4.9).
For the best network model, minimum MSE and maximum regression coefficient
values using predicted and experimental data were selected as optimal for further
applications.
Table 4.9 Performance of Neural Network model
Response Statistical Parameter
Training Testing Validation Overall
Reducing sugar
concentration
R2
MSE 0.9991 0.0263
0.9939 0.2151
0.9939 0.1798
0.9974 0.0033
4.2.1.5.3 Comparison of RSM and ANN
After the model was built, a comparative study was performed between RSM and
ANN models for predicting reducing sugar concentration. After training and
testing, Table 4.10 shows the predicted values by RSM and ANN models. The ANN
model generated a better prediction than the RSM model in terms of relative error.
Thus, the accuracy of ANN model was higher. The experimental error produced by
RSM exceeded that of ANN with 1% acid concentration at 110 oC for 37.5 min
(27.51% error).

97
Table 4.10 BBD matrix of three factors and experimental data, RSM and ANN for
determined values of maximum reducing sugar concentration
Reducing sugar concentration (g/L)
Factors RSM ANN
Temp. (oC)
Acid conc. (%)
Time (min)
Experimental Value
Model value
Relative Error (%)
Model value
Relative Error (%)
120 5 60 10.59 11.18 5.57 10.65 0.55 120 5 60 10.35 11.18 8.02 10.41 0.57 120 5 15 11.14 11.02 1.08 11.20 0.53 120 5 15 10.85 11.02 1.57 10.91 0.54 130 1 37.5 12.39 12.69 2.42 12.45 0.47 130 1 37.5 12.74 12.69 0.39 12.80 0.46 130 5 37.5 15.18 14.65 4.25 15.36 0.38 130 5 37.5 15.30 14.65 3.49 15.24 0.38 110 1 37.5 2.99 3.43 14.72 3.05 1.93 110 1 37.5 2.69 3.43 27.51 2.75 2.15 120 1 60 7.03 7.20 2.42 7.09 0.83 120 1 60 7.42 7.20 2.96 7.48 0.79 110 3 15 6.02 6.25 3.82 6.08 0.48 110 3 15 6.28 6.25 0.48 6.34 0.42 120 1 15 5.04 4.24 15.87 5.09 0.77 120 1 15 4.83 4.24 12.22 4.89 0.84 110 5 37.5 12.19 12.23 0.33 12.25 0.27 110 5 37.5 12.53 12.23 2.39 12.59 0.29 110 3 60 11.54 11.13 3.55 11.60 0.23 110 3 60 11.85 11.13 6.08 11.91 0.25 130 3 60 13.97 13.65 2.29 14.03 0.36 130 3 60 13.52 13.65 0.96 13.58 0.34 130 3 15 15.16 15.41 6.13 15.22 0.39 130 3 15 14.52 15.41 1.65 14.58 0.41 120 3 37.5 12.95 13.07 0.93 13.01 0.31 120 3 37.5 12.83 13.07 1.87 12.89 0.31 120 3 37.5 13.19 13.07 0.91 13.25 0.33 120 3 37.5 12.59 13.07 3.81 12.65 0.29 120 3 37.5 13.17 13.07 0.76 13.23 0.32 120 3 37.5 13.67 13.07 4.39 13.73 0.35

98
Though both models performed well and offered stable response in prediction; the
ANN model was better in predict on than the RSM model. Table 4.10 shows lower
RPD values or relative errors obtained by neural network compared to that of RSM
model. Thus the accuracy of ANN model was higher and better fitted the data than
the RSM method.
Figure 4.11 shows the plot of predicted reducing sugar concentration by ANN and
RSM against the experimental values. The results showed that ANN predictions
gave higher correlation with r=1.0 and slope about 1.00 than those of RSM (r=0.98).
ANN is a superior and more accurate modeling technique compared to RSM, as it
represents the non-linearity in a much better way (Bas and Boyacı, 2007, Bas et al.,
2007 and Mingzhi et al., 2009).
Experimental values (g/L)
0 2 4 6 8 10 12 14 16 18
Pre
dict
ed v
alue
s (g
/L)
2
4
6
8
10
12
14
16
18
experimental vs ANN experimental vs RSM
ANN y=x+0.059 R2=1.0RSM y=0.9783x+0.352 R2=0.9637
Figure 4.11 Combined training, validation and testing predicted versus actual
experimental values for an ANN with 6 neurons in the hidden layer and RSM

99
4.2.1.6 Combined Dilute Acid Pretreatment and Enzymatic
Hydrolysis
The dilute acid pretreatment method was followed by enzymatic hydrolysis. To
determine the necessary process time for enzymatic hydrolysis, aliquot samples
were taken hourly and analyzed for reducing sugar concentration. Glucose
production was monitored until the glucose concentration reached a constant value.
The concentration of glucose increased gradually with time and reached a constant
value within 20 h for all solid-liquid ratios (Figure 4.12). Thus, the enzymatic
hydrolysis was carried out for 20 h in all subsequent experiments. Moshe (1967)
found the process time as 8-10 h for hydrolysis of cellulose.
Enzymatic hydrolysis time (h)
0 5 10 15 20 25 30
Tota
l red
ucing
suga
r (g/
L)
10
20
30
40
50
60
70
5 %10 %15 %
Figure 4.12 Effect of solid/liquid ratio on the enzymatic hydrolysis time of hazelnut
shells.

100
However in another study by Aiduan et al. (2007) the optimum hydrolysis time was
stated as 3h for bioconversion of municipal solid waste to glucose. The difference
among results can be due to the type of the raw material and difference in enzymatic
hydrolysis conditions.
However, total reducing sugar concentration was much higher at solid/liquid ratio
of 15% than that of 5% (Figure 4.12). The total reducing sugar yield was obtained
as 72.4 and 71.5 g/g at the solid-liquid ratio of 5 and 15%, respectively. Reducing
sugar yield from the enzymatic hydrolysis of cellulose was investigated as a
function of cellulose enzyme loading (66.6-200 U/g dry substrate) at solid/liquid
ratios of 1/20, 1/10 and 1/7 (w/v)) for 20 h using the dilute sulfuric acid hydrolysate
(3.42 % (w/w) H2 SO4 , 31.7 min, 130 oC). Reducing sugar yield of pretreated
samples after 20 h of enzymatic hydrolysis is shown in Figure 4.13. Sugar yield
after 20 h ranged from 63.2 g/g at the low solid-liquid ratio (1/20) and low enzyme
loading (66.6 U/g dry substrate) to 72.4 g/g at the high solid-liquid ratio (1/7) and
high enzyme loading (200 U/g dry substrate). The highest total reducing sugar yield
was obtained as 76 g/g at 1/10 solid-liquid ratio and 100U/g dry substrate. However,
these solid-liquid ratio may still be too high to make the process economic.
Moreover, these values were not found statistically different from each other
(p>0.05). The best results of reducing sugar yield was observed at the solid loading
of 1/20 (w/v) as shown in Figure 4.13.

101
Enzyme concentration (U/g)
66.6U/g 100U/g 200U/g
Redu
cing
suga
r yiel
d (w
/w,%
)
0
20
40
60
80
1005 %10 %15 %
0.1
a a a a a a aa
a
Figure 4.13 Enzymatic hydrolysis at various solid concentration (5, 10 and 15% )
of hazelnut shell and enzyme loadings (50 oC, pH 5.0, 20 h at 130 rpm)

102
Enzyme concentration (U/g)
66.6U/g 100U/g 200U/g
Redu
cing
suga
r yiel
d (w
/w,%
)
0
20
40
60
80
100Enzyme OnlyAcid OnlyAcid+Enzyme
a a b
c c c
d d d
Figure 4.14 Acid hydrolysis and combination of acid and enzymatic hydrolysis at
5% solid concentration and various enzyme loadings (50 oC, pH 5.0, 20 h at 130
rpm)
Figure 4.14 indicates that combined acid and enzyme treatment gave significantly
higher reducing sugar yield than only acid pretreatment or enzymatic hydrolysis for
all enzyme loads (P<0.05). The yield values also increased as enzyme loading
increased. The highest reducing sugar concentration and yield were obtained as 19.2
g/L and 72.4 g/g, respectively with 200 U/g of enzyme load.

103
The analysis of results also revealed that pretreatment alone resulted in 62.8%
reducing sugar yield, but this value increased to 72.4% when combined with
enzymatic hydrolysis. Palmarola-Adrados et al. (2005) pretreated starch free wheat
bran with dilute acid and subsequently hydrolyzed using a mixture of Celluclast and
Ultraflo (1:1) (2g enzyme mixture/100 g slurry) and the overall sugar yield of this
combined hydrolysis method reached 80%. Aswathy et al. (2010) reported the
highest value of 639.42 mg/g reducing sugar attained with an enzyme loading of 12
FPUs and 2400 U of cellulose and β-glucosidase, respectively. An efficiency of
57% was obtained by dilute acid pretreatment of water hyacinth biomass and
subsequently enhanced from 57% to 71% with combined acid and enzymatic
hydrolysis in the study of Aswathy et al. (2010). The differences in yield values
compared to results of our study were clearly due to raw material characteristics,
enzyme type used and processing conditions. As a result, the saccharification yield
of our study (72.4%) seems to be comparable, as hazelnut shell is a high lignin
containing raw material.
4.2.1.7 Effect of Dilute Acid Pretreatment on Amount of Inhibitory
Compounds
Furfural, HMF and acetic acid are known as fermentation inhibitors, which are
formed as a result of hemicellulose, and cellulose degradation during pretreatment
of biomass (Karunanithy & Muthukumarappan, 2011). Figures H.1 and H.2
represent the chromatograms of the HMF, furfural and acetic acid standard and the
pretreated samples with dilute acid after pretreatment as an example. At optimal
temperature, time and acid concentration of 130 oC, 31.7 min, and 3.42 (w/w) %
respectively, the acetic acid level was measured as 2.59 ±0.09 g/L, HMF level was
measured as 0.0145±0.0007 g/L, phenolic compounds were measured as 0.15±0.00
g/L and no furfural were detected in the hydrolyzate (Table 4.11).

104
Mouta et al. (2011) studied the hydrolysis of sugarcane leaves straw using 2.9%
H2SO4 (w/v) at 130 oC for 30 min with the 1/4 solid to liquid ratio. They reported
that acetic acid, furfural and HMF were measured as 3.19, 0.56 and 0.15,
respectively. When the amount of inhibitory compounds of this study was
compared with the previous studies conducted with rice straw (Baek & Kwon,
2007) and sugarcane leaves straw (Mouta et al., 2011) it was found that the amount
of furfural and HMF of this study was lower (Table 4.11). The difference among
results is due to the type of the raw material and difference in hydrolysis conditions.
Table 4.11 Dilute acid pretreatment of various agro-residues for the production of
hemicellulosic-derived products.
Agro-residue
Conditions for acid hydrolysis
Inhibitors (g/L) References
Rice straw 1.5% H2SO4, 130 oC, 30 min, S:L=1:10
Acetate, 1.43, HMF, 0.15; Furfural, 0.25
Baek and Kwon (2007)
Sorghum straw
2% H2SO4, 122 oC, 71 min
Furfural, 0.2; acetic acid, 0.00
Sepülveda-Huerta et al. (2006)
Corn stover
2.13 % H2SO4, 121 oC, 180 min, S:L=1:10
Acetic acid, 1.48; Furans, 0.56; Phenolics, 0.08
Cao et al. (2009)
Sugarcane leaves straw
2.9%H2SO4 (w/v), 130 oC, 30 min, S:L=1:4
Acetic acid, 3.19; furfural, 0.56; HMF, 0.15.
Mouta et al. (2011)
Hazelnut shell
3.42%H2SO4 (w/w), 130 oC, 31.7 min, S:L=1:5
Acetic acid, 2.59; furfural, nd; HMF, 0.0145; phenolics, 0.15.
This study
nd=not detected

105
Temperature and acid concentration are also responsible for degradation of pentose
and hexose sugars to furfural and hydroxymethyl furfural compounds, which
strongly affect the microbial metabolism at >0.25 g/L (Klinke et al., 2004). Thus,
to minimize those inhibitory compounds it is advised to run the hydrolysis process
at less severe conditions. The toxic compounds present in the hazelnut shell
hydrolysate can be efficiently removed by a simple detoxification strategy based on
pH alteration. This indicated that the hydrolysate would impose no risk to
fermentation microorganisms.
4.2.2 Effect of Alkaline Pretreatment
The reducing sugar yields obtained under different alkaline conditions are
compared in Table 4.12 and Table 4.13 which illustrate the alkaline pretreatment
conditions and corresponding reducing sugar yields (%, w/w) for Method 1 and
Method 2, respectively. The highest yield of reducing sugar (2.9%) was observed
when the hazelnut shells were subjected to 3% (w/v) NaOH at 60 oC for 24 h (Table
4.12). The reducing sugar yield was calculated by dividing the concentration of the
reducing sugar obtained with reducing sugar in hazelnut shells multiplied by 100.
In Method 1, the reducing sugar yield increased as NaOH concentration was
increased from 1% to 3% (w/v) but decreased thereafter at 7% (w/v) (Table 4.12).
Increase in NaOH concentration with decreasing reducing sugar yield was observed
due to high solid loss (Wang et al., 2008). The results also indicated a positive
effect of temperature on reducing sugar yields at 5% (w/v) NaOH. The highest
reducing sugar yield of 2.9% (w/w) was obtained at 3% (w/v) NaOH, 60 oC, and 24
h for Method 1. However, the highest total reducing sugar yield of 61.2% (w/w)
was obtained at 15% SLR treated with 3% (w/v) NaOH for 60 min by Method 2.
Lower temperatures for NaOH pretreatment was not favorable to enhance sugar
yield because the crosslinkages between lignin and carbohydrates were not

106
disrupted sufficiently to reach a high sugar production (Wang, 2009). Reducing
sugar yield with NaOH pretreatment at high temperature (121 oC) was much higher
than at lower temperatures (<121 oC). Based on reducing sugar yield, Method 2 was
used for comprehensive understanding of interactions between each factor. For
completion of optimization, further study was carried out to maximize the sugar
yields.
Table 4.13 illustrates the reducing sugar concentration in the pretreated hazelnut
shell solids at various alkaline conditions. Total reducing sugar in untreated
hazelnut shells was 290.9±6.9 mg/g dry pretreated material (Table 4.13). Sugars in
the recovered solids varied depending on the pretreatment combination and impact
of NaOH concentration (X1), SLR (X2) and treatment time (X3) on reducing sugar
concentration was statistically evaluated. Sodium hydroxide concentration, SLR
and treatment time showed significant effects on total reducing sugars recovered in
pretreated solids. While interactions between NaOH concentration x SLR and SLR
x time had no significant effects (P>0.05), interactions between SLR x time showed
significant effects (P<0.05).
The highest total reducing sugar recovered after pretreatment (estimated equivalent
from 320.6 mg/g dry biomass) was obtained at 15% SLR treated with 3% (w/v)
NaOH for 60 min (Table 4.13). This value was significantly higher than that
reported by Arslan and Saraçoglu (2010), who pretreated hazelnut shell using 1-3%
NaOH at room temperature with a solid to liquid ratio of 1:5 and reported reducing
sugar concentration between 130-140 mg/g sugar (estimated equivalent from 26.40-
28.86 g/L).

107
Table 4.12 Total reducing sugar of hazelnut shell pretreated with different NaOH
concentration at different temperatures for 24 h
Treatments*
Total reducing sugar
(mg/g dry raw
material)
Reducing sugar
yield (%,w/w)
Alkaline pretreatment at 30 oC
Untreated 3.34±0.09 0.6
1% NaOH 7.93±0.60 1.5
3% NaOH 8.88±1.14 1.7
5% NaOH 6.73±0.38 1.3
7% NaOH 6.56±0.29 1.2
Alkaline pretreatment at 45 oC
Untreated 5.00±0.94 1.0
1% NaOH 10.65±0.17 2.0
3% NaOH 8.19±0.17 1.5
5% NaOH 9.19±0.76 1.7
7% NaOH 7.72±0.18 1.5
Alkaline pretreatment at 60 oC
Untreated 7.59±0.60 1.5
1% NaOH 7.39±0.11 1.7
3% NaOH 15.03±0.68 2.9
5% NaOH 13.33±0.81 2.5
7% NaOH 12.30±0.30 2.3
* Results belong to two replicates and solid/liquid ratio=1:20 (5%).

108
Table 4.13 Total reducing sugar of hazelnut shell pretreated with different NaOH concentration, time and solid-liquid ratio at 121 oC, 15 psi (autoclave).
Treatments Total reducing sugar (mg/g
pretreated biomass)
Reducing sugar
yield (%,w/w)
Untreated 290.9±6.9 33.6±0.6
3% NaOH
5% SLR 60 min 347.1±4.3 53.0±1.2
10% SLR 30 min 352.3±22.4 50.3±1.4
10% SLR 90 min 308.1±21.3 51.4±1.2
15% SLR 60 min 363.5±3.7 61.2±1.3
5% NaOH
5% SLR 30 min 321.0±18.4 39.1±2.2
5% SLR 90 min 337.0±4.1 48.4±0.9
10% SLR 60 min 397.5±22.1 58.1±2.5
15% SLR 30 min 342.2±14.4 49.5±1.6
15% SLR 90 min 303.0±30.7 46.1±3.4
7% NaOH
5% SLR 60 min 353.8±20.9 47.7±1.3
10% SLR 30 min 309.9±21.1 42.1±2.7
10% SLR 90 min 301.3±17.5 45.2±1.3
15% SLR 60 min 374.4±24.3 55.8±0.1
* Results belong to triplicate.

109
4.2.2.1 Alkaline Pretreatment of Hazelnut Shells and Response
Surface Modeling for Optimization
Optimization of alkaline pretreatment conditions focused on three aspects: solid
recovery, lignin removal, and total reducing sugar production after enzymatic
hydrolysis.
4.2.2.1.1 Effect of Alkali Pretreatment Conditions on Solid
Recovery
Solid recovery is an important parameter for evaluating pretreatment performance
as it determines the total amount of biomass that can be eventually converted to
sugars via enzymatic hydrolysis (Zhang, 2012).
RSM is a frequently used technique for modeling and determining optimal process
conditions. Response surface analysis of experimental results for solid recovery in
hazelnut shells, treated with NaOH at various concentrations, SLR and treatment
time per BBD (Table 4.14), were further elucidated to identify the best treatment
conditions in the ranges tested. Overall, 63.9 to 85.2% solids were recovered when
hazelnut shells were treated with NaOH, depending on pretreatment intensity
(Table 4.14).

110
Table 4.14 BBD matrix of conditions for alkali pretreatment of hazelnut shells and
corresponding solid recovery (%) and lignin reduction (%)
Run
No.
NaOH
conc.
(%) (X1)
SLR
(%)
(X2)
Time
(min)
(X3)
Solid
recoverya (%)
(Y1)
Lignin
reductiona (%)
(Y2)
1 5 10 60 73.7±3.5 19.3±0.3
2 5 10 60 72.2±3.2 19.7±1.4
3 5 10 60 75.4±1.1 19.0±1.0
4 7 15 60 75.9±2.2 16.7±0.9
5 7 5 60 71.8±4.8 13.7±1.8
6 3 15 60 84.4±6.4 14.2±1.4
7 3 5 60 80.1±2.6 13.9±1.3
8 3 10 90 85.2±1.7 15.5±1.3
9 7 10 90 81.8±1.6 14.8±0.5
10 5 15 90 79.7±1.5 10.2±0.9
11 5 5 90 75.9±1.0 9.6±0.7
12 3 10 30 75.0±4.9 6.9±0.3
13 7 10 30 71.3±0.5 7.6±0.7
14 5 5 30 63.9±0.1 7.3±0.3
15 5 15 30 75.9±4.0 8.3±0.1
a Results belong to triplicate

111
Table 4.15 shows the effect of process variables and interactions on solid recovery.
NaOH concentration, SLR and treatment time showed significant effects on solid
recovery which was also significantly affected (P < 0.05) by interaction between
SLR and treatment time.
Table 4.15 ANOVA results and estimated regression coefficients for the coded solid
recovery model
Term Coefficient P
Regression 0.000 Linear 0.000
Square 0.000
Interaction 0.009
Lack-of-fit 0.518
Constant 74.31 0.000*
NaOH conc. (X1) -2.995
0.000*
SLR (X2) 3.109
0.000*
Time (X3) 4.635
0.000*
X1*X1 4.241
0.000*
X2*X2 0.818 0.281
X3*X3 -1.304 0.092
X1*X2 -1.373 0.085
X1*X3 -0.949 0.195
X2* X3 -2.036
0.005*
*result is significant when P<0.05

112
Another run with excluded insignificant terms according to Table I.1 expressed by
Eqn 28;
Y1 = 74.01-3,08X1+3.12X2+4.56X3+4.14X12 -2.04X2X3 (28)
where Y1 is predicted solid recovery, X1 is NaOH concentration (%), X2 is solid-
liquid ratio (%), and X3 is time (min). Equation 28 was found fairly adequate to
represent the data with R2 of 0.85. The insignificant lack of fit for solid recovery
was (P = 0.45 >0.05) also proved that the model fit the experimental data well.
Figure 4.15 shows the response-surface plots for the effects of various NaOH
pretreatment conditions on solid recovery. It was observed that solid recovery
decreased significantly (P<0.05) with increase in NaOH concentration, but
increased with increase in time (Fig. 4.15.a). Ester bonds between lignin and
carbohydrates in the biomass were disrupted during NaOH pretreatment. During
this process, lignin is solubilized and high solid losses occur (Keshwani, 2009).
Solid loss decreased with increase in SLR and treatment time (Fig. 4.15.b) but there
was more loss of solids when NaOH concentration was higher even in the presence
of higher solids (Fig. 4.15.c). Xu et al. (2010b) showed the same pattern of solid
loss which is decreased with high temperature and NaOH concentration during
NaOH pretreatment. Xu et al. (2010b) reported that 19.5-53.9% of biomass was lost
during NaOH pretreatment. According to Mcintosh and Vancov (2011), wheat
straw was lost at a range of 25% (1% NaoH, 60 min, 60 oC) to 57% (2% NaOH,
121 oC).

113
807060
75
80
3.0
85
404.56.0
7.5
Solid Recovery (%)
Time (min)
NaOH concentration (%)
a
8065
60
70
75
5
80
4010
15
Solid recovery (%)
SLR (%)
Time (min)
b
15
70 10
75
80
85
3.04.5 56.0
7.5
Solid recovery (%)
NaOH concentration (%)
SLR (%)
c
Figure 4.15 Response surface plots for the effects of alkaline pretreatment conditions on solid recovery

114
The correlation between the experimental and predicted values of solid recovery
showed that predicted values were within the model’s designed ranges (R2=0.94)
(Fig.4.16).
Experimental values
60 65 70 75 80 85 90
Pred
icte
d va
lues
55
60
65
70
75
80
85
90
95
y=0.9428x+4.7820 R2=0.9373
Figure 4.16 Experimental versus RSM predicted values for solid recovery (%)
The conditions for obtaining maximum solid recovery of 89.1%, as predicted by
the model, were found as 3% NaOH concentration, 15% SLR for a 90 min treatment
time. These conditions were experimentally tested in triplicate to validate the
model’s predictive ability and a solid recovery of 88.4±0.5%, which indicated no
significant difference between the experimental and model predicted values
(P>0.05).

115
4.2.2.1.2 Effect of Alkali Pretreatment Conditions on Delignification
The major effect of alkaline pretreatment on lignocellulosic materials is to reduce
the lignin content of the biomass (Chang and Holtzapple, 2000). Lignin analysis of
the solids recovered after pretreatment indicated that 6.9 to 19.7% of the initial
lignin in the untreated hazelnut shell was removed after NaOH treatment (Table
4.14).
The highest lignin reduction (19.7%) was obtained upon treatment of hazelnut
shells at 10% SLR with 5% NaOH for 60 min at 121 °C. This condition also
corresponded to low biomass recovery. Second-order polynomial equations
(quadratic model) were established to identify the relationship between lignin
reduction and the three pretreatment variables: NaOH concentration (X1), SLR (X2)
and time (X3). The ANOVA results and the estimated regression coefficients for
the coded lignin reduction model are shown in Table 4.16. Among the variables
studied, only time showed significant effect (P <0.05) on lignin reduction (Table
4.16). The interaction between the variables did not have a significant effect
(P>0.05) on lignin reduction.

116
Table 4.16 ANOVA results* and estimated regression coefficients for the coded
lignin reduction model
Term Coefficient P
Regression 0.000 Linear 0.000
Square 0.000
Interaction 0.837
Lack-of-fit 0.069
Constant 19.36 0.000
NaOH conc. (X1) -0.024 0.941
SLR (X2) 0.181 0.558
Time (X3) 2.502
0.000*
X12 -2.047
0.000*
X22 -3.315
0.000*
X32 -6.850
0.000*
X1*X2 0.214 0.629
X1*X3 0.355 0.451
X2*X3 -0.066 0.876 *result is significant when P<0.05
Another run with excluded insignificant terms according to Table I.2 and the
equation (Eqn 29) was reduced to:
Y2 = 19.3611+2.5019X3-2.0466X12 -3.3152X2
2 -6.8501X32 (29)
where Y2 is predicted lignin reduction, X1 is NaOH concentration, X2 is SLR and

117
X3 is time. Equation 28 was found fairly adequate to represent the data with R2 of
0.94. The insignificant lack of fit for lignin reduction was (P = 0.086 >0.05), which
also proved that the model fit the experimental data well.
The surface plots showing the effect of the pretreatment conditions on lignin
reduction are presented in Fig. 4.17. Lignin reduction increased with increase in
NaOH concentration from 3% to 5% (w/v) and time from 30 min to 60 min (Fig.
4.17.a) but decreased when treatment time or NaOH concentration was increased
further.
80
60
10
15
3.0
20
404.56.0
7.5
Lignin reduction (%)
NaOH concentration (%)
Time (min)
a
Figure 4.17 Response surface plots for the effects of alkaline pretreatment
conditions on lignin reduction

118
80
5 60
10
15
5
20
4010
15
Lignin reduction (%)
SLR (%)
Time (min)
b
15
1410
16
18
3.0
20
4.5 56.07.5
Lignin reduction (%)
NaOH concentration (%)
SLR (%)
c
Figure 4.17 (Continued)
Kaur et al. (2012) reported that increased alkali concentration and pretreatment time
led to decreased lignin content and increased relative cellulose content in cotton
stalk solid residue. However, the increased alkali concentration and time negatively
affected the biomass available for hydrolysis due to a significant reduction in
available biomass caused by higher solubilization (Kaur et al., 2012). The effect of
pretreatment time on lignin removal was reduced when a higher solid-liquid ratio
was used (Fig.4.17.b). Fig. 4.17.c showed that lignin reduction increased with alkali
concentration and SLR up to 5% (w/v) and 10%, respectively. Then, lignin
reduction decreased with high alkali concentration and SLR. Correlation between
the experimental and predicted values of lignin reduction showed that predicted
values were within the model’s designed ranges (R2=0.94) (Fig.4.18).

119
Experimental values
0 5 10 15 20 25
Pred
icte
d va
lues
0
5
10
15
20
25
y=0.9384x+0.8222 R2=0.9379
Figure 4.18 Experimental versus RSM predicted values for lignin reduction (%)
The model predicted conditions for optimum lignin reduction of 19.6% were found
to be 5% of NaOH concentration and 10% SLR with 65 min pretreatment time.
When these conditions were verified, lignin reduction was 18.1±0.03%, which was
also close to the corresponding predicted value of 19.6%. These results indicate that
the RSM models could be used for determining the conditions best suited for
reducing lignin while recovering an optimal level of solids when hazelnut shells are
pretreated with NaOH, at least within the ranges of this study.
4.2.2.1.3 Effect of Alkali Pretreatment Factors on Reducing Sugar
Yield Combined with Enzymatic Hydrolysis
Enzymatic hydrolysis of the pretreated hazelnut shell was performed to generate
fermentable sugars (Table 4.17). Total reducing sugars in the hydrolyzate were
measured and used to evaluate overall pretreatment effectiveness. Hydrolysis of

120
untreated biomass resulted in 120±10 mg reducing sugar/g dry pretreated biomass
and the total reducing sugar yield from various pretreated samples ranged at 172.2-
318.3 mg/g dry pretreated biomass.
The highest sugar yield (318.6 mg/g dry pretreated biomass) was obtained from
biomass at 5% SLR treated with 3% (w/v) NaOH for 60 min and the corresponding
enzymatic conversion efficiency was 91.7%. However, enzymatic conversion was
found as 97.2% at 10% SLR treated with 3% (w/v) NaOH for 90 min. No
significant differences in enzymatic conversion were observed using either Run 7
an 8 (P>0.05) (Table 4.17). Considering economical concerns, the highest sugar
yield (318.6 mg/g dry pretreated biomass) with at 5% SLR treated with 3% (w/v)
NaOH for 60 min was selected. When alkali is used at high concentration,
degradation and alkaline hydrolysis of the polysaccharides takes place which
ultimately leads to the destruction of hemicellulose thus releasing sugars (Fengel
and Wegener, 1984). However, this yield was not significantly different (P>0.05)
from Run 12, which resulted in 316.3 mg/g reducing sugars with shorter treatment
time and higher SLR. It was noted that although overall enzymatic conversion
efficiency increased slightly with treatment time and SLR, it decreased with
increasing NaOH concentration (Table 4.17, Run 4 and 6). No significant (P>0.05)
changes in enzymatic efficiency were observed between 5% and 15% SLR or 30
and 90 min. Pretreatments with 3% (w/v) NaOH concentration led to significantly
(P<0.05) higher carbohydrates conversion efficiency than those with 5% and 7%
(w/v) NaOH concentration.
The sodium hydroxide concentration, SLR and treatment time showed significant
effects (P<0.05), on reducing sugars in the hydrolysate. Interactions between NaOH
concentration- SLR and SLR-time also had significant effects (P<0.05).

121
Tab
le 4
.17
Com
paris
on o
f re
duci
ng s
ugar
s re
cove
red
in p
retre
ated
haz
elnu
t sh
ell
solid
s an
d re
duci
ng s
ugar
yie
ld a
fter
enzy
mat
ic
h121
ydro
lysi
s(E.
H)
Run
N
o.
NaO
H
conc
. (%
) SL
R
(%)
Tim
e (m
in)
Red
ucin
g su
gar
befo
re E
.H
(mg/
g dr
y pr
etre
ated
bi
omas
s)
Red
ucin
g su
gar
afte
r E
.H
(mg/
g dr
y pr
etre
ated
bi
omas
s) (Y
3)
Enz
ymat
ic c
onve
rsio
n e
ffic
ienc
y
(%)
1 5
10
60
415.
6±13
.7
289.
6±26
.8
65.2
±1.5
F
2 5
10
60
387.
7±31
.5
283.
9±17
.5
73.3
±2.4
DEF
3
5 10
60
38
9.2±
5.4
272.
8±13
.1
70.1
±3.5
EF
4 7
15
60
376.
4±24
.3
303.
6±10
.2
80.9
±5.9
BC
DE
5 7
5 60
35
3.8±
20.9
21
7.2±
13.2
62
.4±5
.9 F
6
3 15
60
36
3.5±
3.7
308.
2±5.
7 84
.8±1
.0 A
BC
D
7 3
5 60
34
7.1±
4.3
318.
3±14
.2
91.7
±4.9
AB
8
3 10
90
30
8.1±
21.3
29
8.6±
13.8
97
.2±6
.8 A
9
7 10
90
30
1.3±
17.5
20
7.4±
5.2
69.1
±5.6
EF
10
5 15
90
30
3.0±
30.7
18
4.7±
9.9
76.4
±6.2
CD
EF
11
5 5
90
337.
0±4.
1 23
2.6±
3.2
70.3
±0.0
DEF
12
3
10
30
352.
3±22
.4
316.
3±7.
8 89
.9±3
.6 A
BC
13
7 10
30
30
9.9±
21.1
23
5.1±
25.3
75
.3±2
.9 D
EF
14
5 5
30
321.
0±18
.4
172.
2±8.
6 42
.3±2
.6 G
15
5 15
30
34
2.2±
14.4
22
0.7±
6.6
64.6
±3.1
F
a Res
ults
bel
ong
to tr
iplic
ate

122
As with lignin reduction, a second-order polynomial equation (Eqn 30) was
developed to establish correlations between reducing sugar yield and the
pretreatment variables. The model equation adequately represented the data with an
R2=0.92 and insignificant lack of fit (P = 0.555 >0.05). Detailed ANOVA
calculations is given in the Table I.3. The final equation without insignificant
(p>0.05) terms was:
Y3 = 0.2769-0.0368X1+0.0071X2+0.0383X12 -0.0245X2
2 -0.0509X32 +0.0281X1X2 -
0.0252 X2X3 (30)
where Y3 is predicted reducing sugar yield, X1 is NaOH concentration, X2
indicates the SLR (%) and X3 represents time (min).
Fig. 4.19.a shows that reducing sugar yield decreased significantly (P<0.05) with
increase in NaOH concentration, but increased with increase in treatment time up
to 60 min. the yield was also significantly (P<0.05) improved with the increase of
solid liquid ratio, but decreased (P<0.05) when time was attained for more than 60
min (Fig. 4.19.b). Fig. 4.19.c shows that reducing sugar yield decreased
significantly (P<0.05) with increase in NaOH concentration, but increased with
increase of solid liquid ratio. Increased NaOH concentration helps the increase of
surface area and formation of pores to permit easier enzyme access and attack on
carbohydrates for reducing sugar production (Goh et al., 2010). When alkali is used
at high concentration, cellulose and hemicellulose components were irreversibly
lost through dissolution and degredation of hemicellulose (Chen et al., 2013).

123
80
0.20 60
0.25
0.30
3.0
0.35
404.56.0
7.5
NaOH concentration (%)
Time (min)
(g/g dry biomass)Reducing sugar yield
a
80
60
0.20
0.24
5
0.28
4010
15
Time (min)
SLR (%)
(g/g dry biomass)Reducing sugar yield
b
15
0.20 10
0.25
0.30
3.0
0.35
4.5 56.07.5
NaOH concentration (%)
SLR (%)
(g/g dry biomass)Reducing sugar yield
c
Figure 4.19 Response surface plots for the effects of alkaline pretreatment conditions on reducing sugar yield (g/g dry biomass)

124
The correlation between the experimental and predicted values of reducing sugar
yield showed that predicted values were within the model’s designed ranges
(R2=0.93) (Fig. 4.20).
Experimental values
0,10 0,15 0,20 0,25 0,30 0,35 0,40
Pred
icte
d va
lues
0,10
0,15
0,20
0,25
0,30
0,35
0,40
y=0.9725x+0.0068 R2=0.9324
Figure 4.20 Experimental versus RSM predicted values for total reducing sugar
yield (g/g dry biomass)
The optimum condition for maximal reducing sugar yield, as predicted by the model
was 357.2 mg/g dry pretreated biomass, and obtained with 3% (w/v) NaOH
concentration, 7.5% SLR and 63 min treatment time.
To validate the models predictive ability and optimum condition, a verification run
was performed in triplicate and the reducing sugar yield was obtained as 243.3±10.2
mg/g dry pretreated biomass. A significant difference was observed between the
model predicted and experimental verification values potentially due to non-

125
homogeneous untreated material characteristics. It could also be inferred that the
pretreatment parameter range was not sufficient to completely evaluate the effect
of fermentable sugar production.
Although optimizations were performed to determine the most suitable conditions
for individually enhancing delignification and reducing sugar yield, an overall
evaluation of the results of this study indicated that subsequent research on hazelnut
shell-to-sugar conversion processs should target a process that can improve the
cost-effectiveness while maintaining the efficiency high.
4.2.3 Effect of Ozone Pretreatment
4.2.3.1 Effect of Ozonolysis on Biomass Recovery in Hazelnut Shell
Ozonolysis of hazelnut shells resulted in 4.54-10.87% loss of the biomass during
pretreatment depending on the pretreatment conditions (Table 4.18). Ozonolysis
with 25 % moisture content showed a higher biomass recovery than that with 35 %
moisture content. Solid recovery significantly (P<0.05) decreased with the increase
in pretreatment time and moisture content. The highest biomass recovery (95.5%)
was obtained at an ozone concentration of 30 mg/L with 25% moisture content for
a treatment time of 90 min. Among the factors, moisture content and time showed
significant effects (P <0.05) on biomass recovery.
4.2.3.2 Effect of Ozonolysis on Lignin Content in Hazelnut Shell
It was observed that ozonolysis reduced AIL concentration in hazelnut shell for all
pretreated samples. Lignin removal after ozone pretreatment ranged from 9.79% to
20.52% of the initial lignin in the untreated hazelnut shell (Table 4.18). AIL content

126
significantly (P<0.05) decreased with the increase of time and ozone concentration.
Garcia-Cubero et al. (2010) reported that ozonloysis of wheat, rye, barley and oats
in a fixed bed reactor resulted in a 38, 50, 41 and 40% reduction in lignin,
respectively. Travaini et al. (2013) observed a higher net reduction of 66.8% AIL
in sugarcane bagasse pretreated at an ozone concentration of 3.44% (v/v) with 40%
moisture content for 120 min.
Panneerselvam et al. (2013) pretreated energy grasses with ozone and observed the
net reduction in AIL ranged between 16.9-27.8% for washed samples. It was noted
that solid recovery ranged between 61.2–89.9% and 58.1–85.6% for AIL and
glucan with washed samples, respectively. The highest lignin reduction (20.52%)
was obtained at ozone concentration of 50 mg/L with 30% moisture treated for 120
min, which also resulted in high biomass recovery (94.01%) (Table 4.18). It was
indicated that different type of biomass responded differently to the ozonolysis
process conditions. Delignification results were found to be comparable with
conventional alkaline (NaOH) pretreatment. It was also clear that the use of NaOH
ranging from 3% to 7% (w/v) decreased lignin reduction from 19.7% (5%, w/v,
NaOH, 10% solid/liquid ratio, 60 min) to 6.9% (3%, w/v, NaOH, 10% solid/liquid
ratio, 30 min). Among the factors, ozone concentration and time showed significant
effects (P <0.05) on lignin reduction. It can be seen from Table 4.18 that the AIL
content significantly (P<0.05) decreased with the increase of ozone concentration
and time.
It was observed that when AIL decreased, acid soluble lignin (ASL) increased
(Table 4.18). This was expected, since ozone’s reaction with lignin converts an AIL
fraction into ASL by inserting hydrophilic functional groups (Garcia-Cubero et al.,
2009; Yu et al., 2011). Overall, ASL content of ozone pretreated hazelnut shells
increased with increase in ozone concentration, reaching a maximum in Run 3,
where it increased from 1.29% in the raw material to 1.91% after treatment (Table
4.18).

127
Tab
le 4
.18
Box
-Beh
nken
des
ign
mat
rix fo
r ide
ntify
ing
key
proc
ess
varia
bles
and
sol
id re
cove
ry (%
), ac
id in
solu
ble
ligni
n (%
) and
tota
l re
duci
ng su
gar (
mg/
g) in
ozo
ne tr
eate
d sa
mpl
es.
Run
N
o.
Moi
stur
e co
nten
t (%
) O
zone
con
c.
(mg/
L)
Tim
e (m
in)
Solid
rec
over
y (%
) A
IL (%
) A
SL (%
) A
fter
hyd
roly
sis R
D
(mg/
g)
1 25
40
12
0 91
.02±
0.76
40
.18±
1.84
1.
54±0
.05
256.
2±8.
0
2 30
30
12
0 92
.54±
0.55
40
.95±
0.64
1.
45±0
.06
278.
2±10
.8
3 30
50
12
0 94
.02±
1.40
37
.51±
0.93
1.
91±0
.09
196.
3±1.
0
4 35
40
12
0 89
.13±
2.32
41
.60±
1.41
1.
41±0
.05
243.
9±6.
0
5 25
30
90
95
.46±
2.06
42
.19±
1.13
1.
34±0
.10
284.
3±15
.0
6 25
50
90
93
.23±
1.51
41
.44±
0.93
1.
29±0
.04
293.
7±7.
3
7 30
40
90
92
.97±
1.64
40
.20±
0.22
1.
49±0
.06
270.
9±14
.0
8 30
40
90
91
.57±
0.94
40
.29±
0.05
1.
57±0
.03
292.
4±13
.9
9 30
40
90
93
.32±
0.99
41
.46±
2.36
1.
53±0
.03
275.
6±11
.2
10
35
30
90
92.7
7±0.
47
43.0
7±1.
02
1.24
±0.0
9 27
4.9±
11.1
11
35
50
90
92.3
7±1.
37
39.3
1±1.
51
1.50
±0.0
3 29
6.2±
13.3
12
25
40
60
94.8
1±1.
40
40.5
1±0.
25
1.79
±0.0
6 22
8.8±
12.9
13
30
30
60
93.6
3±0.
50
42.9
8±1.
24
1.27
±0.1
1 30
4.0±
6.3
14
30
50
60
92.8
4±1.
82
40.8
8±1.
26
1.44
±0.1
1 26
3.1±
6.9
15
35
40
60
93.0
0±0.
45
41.2
1±0.
28
1.69
±0.0
1 26
1.6±
9.2

128
4.2.3.3 Effect of Ozonolysis on Enzymatic Saccharification
Total reducing sugar yield also compared to analyze the influence of ozone
pretreatment on enzymatic saccharification. Table 4.19 shows that the reducing
sugar production after hydrolysis significantly (P<0.05) decreased with the increase
of time and ozone concentration. However, as the moisture content was increased
from 25 to 35%, there was no significant influence on total reducing sugar (P>0.05).
Moisture content played a major role during ozonolysis of biomass such as bagasse
(Neely, 1984), poplar sawdust (Vidal and Molinier, 1988) and wheat and rye straw
(Garcia-Cubero et al., 2009). Optimal moisture content for ozone pretreatment
varies with the biomass such as 25 to 35% for oak sawdust (Neely, 1984) and 30%
for wheat and rye straws (Garcia-Cubero et al., 2009). Higher consumption of ozone
was required using excessive moisture without any increase in pretreatment
efficiency (Garcia-Cubero et al., 2009). Thus, the moisture content was set at 30%
based on results of this study and Garcia-Cubero et al. (2009) who reported that the
optimum moisture content for ozonolysis as 30% and an increase in moisture
content above 30% evidenced no significant effects of ozonolysis pretreatment on
reducing sugar production.
The highest reducing sugar production (304.0 mg/g dry pretreated biomass) was
obtained at an ozone concentration of 30 mg/L, 30% moisture content and 60 min.
This was significantly higher than sugar produced by untreated material (119.9±6.2
mg/g raw material) (Table 4.19). Ozonolysis resulted in an improvement in
reducing sugar production. Enzymatic conversion increased by 100% at 30 mg/L
ozone concentration and 60 min (Table 4.19). While there were variations in
ozonolysis and hydrolysis conditions, ozonolysis used herein resulted in higher
sugar yield than ozone pretreatments of wheat straw (about 40%, Garcia-Cubero et
al., 2010), rye straw (between 40-57%, Garcia-Cubero et al., 2012), coastal
Bermuda grass (63%, Lee et al., 2010), cotton stalk (60%, Kaur et al., 2012) and
Japanese cedar sawdust (80%, Sugimoto et al., 2005). It was shown that ozonolysis
of hazelnut shell was also able to enhance fermentable sugar production.

129
Table 4.19 Total reducing (RD) sugar from saccharification of hazelnut shell
pretreated with ozonolysis.
Treatments Before hydrolysis Total RD sugar (mg/g
dry biomass)
After hydrolysis Total RD sugar
(mg/g dry biomass)
Conversion (%)
Untreated 290.9±6.2 119.9±6.2
Ozone treated with 25% MC
30 mg/l for 90 min 319.1±18.2 284.3±15.0 89.2±2.9
40 mg/l for 60 min 262.9±8.8 228.8±12.9 83.2±4.9
40 mg/l for 120 min 325.6±13.5 256.2±8.0 81.9±1.9
50 mg/l for 90 min 322.4±8.2 293.7±7.3 91.2±3.5
Ozone treated with 30% MC
30 mg/l for 60 min 302.1±4.5 304.0±6.3 100.6±2.1
30 mg/l for 120 min 325.0±7.6 278.2±10.8 85.5±2.4
40 mg/l for 90 min 323.3±4.2 270.9±14.0 82.2±1.7
40 mg/l for 90 min 318.2±12.3 292.4±13.9 93.8±2.4
40 mg/l for 90 min 319.7±6.5 275.6±11.2 86.2±1.9
50 mg/l for 60 min 317.7±5.6 263.1±6.9 84.1±1.8
50 mg/l for 120 min 238.2±6.3 196.3±1.0 83.4±2.5
Ozone treated with 35% MC
30 mg/l for 90 min 309.1±6.1 274.9±11.1 88.9±3.0
40 mg/l for 60 min 263.2±9.7 261.6±9.2 99.4±1.5
40 mg/l for 120 min 323.1±8.8 243.9±6.0 75.6±3.8
50 mg/l for 90 min 322.6±5.1 296.2±13.3 91.3±7.1
a Results belong to triplicate

130
Regression analysis showed that ozone concentration and time, with P values lower
than 0.05, had a substantial effect on reducing sugar production. It was observed
that data analysis by BBD-RSM did not provide good correlations between the
process variables (ozone concentration, moisture content and treatment time) and
dependent variables (solid recovery, lignin reduction and total reducing sugar
yield). Hence, to identify optimal process treatment conditions for ozonolysis of
hazelnut shell, process variables that had a significant effect on reducing sugar
production after enzymatic hydrolyses of ozonated samples were selected for
further evaluation. A full factorial design was established by listing experimental
conditions previously tested with RSM.
ANOVA (Table 4.20) suggested that there was a significant difference between the
levels of pretreatment time, ozone concentration and their interactions.
Table 4.20 Analysis of variance results for reducing sugar production based on
full factorial design conditions
Source Coef. Seq SS Adj SS Adj MS F
value
P
value
Ozone
concentration
(mg/L)
-0.0307 0.0113 0.0113 0.0113 319.41 0.000
Time(min) -0.0232 0.0065 0.0065 0.0065 183.56 0.000
Ozone
conc.*Time
(min)
-0.0102 0.0013 0.0013 0.0013 35.30 0.000
R-Sq = 0.9834% R-Sq(adj) = 0.9768% R-Sq(pred) = 0.9627%

131
The regression Eqn. (31) represented the best correlation between main 2
interaction effects of process variables on reducing sugar after the elimination of
non-significant parameters (P> 0.05).
Y1=0.2603-0.0306X1-0.0232X2-0.0102X1X2 (31)
where Y1 is predicted reducing sugar production (mg/g dry pretreated biomass), X1
and X2 are coded values for ozone concentration and time, respectively. The
optimum conditions for reducing sugar were found as 30% moisture content, 30
mg/L of ozone concentration and 60 min of time. The reducing sugar results were
found to be comparable with conventional alkaline (NaOH) pretreatment, which led
to the highest reducing sugar yield of 318.3 mg/g dry biomass (and 91.7% enzyme
conversion efficiency) from biomass pretreated with 3.0% NaOH at 5% solid liquid
ratio for 60 min.
4.2.4 Comparison of All Pretreatment Methods
The effectiveness of dilute acid, alkaline and ozone pretreatments on conversion of
hazelnut shell hydrolzates to reducing sugars with minimum sugar loss was also
assessed.
The sulfuric acid pretreatment resulted in the highest sugar conversion (62.8% for
3.42 (w/w)% acid, 31.7 min, 130 ºC) whereas sugar conversion of 49.6% (%3
NaOH, 15% solid/liquid ratio, 60 min, 121 ºC/15psi) and 53.4% were obtained from
NaOH and ozone pretreatment, respectively. Total reducing sugar conversion was
enhanced from 62.8% to 72.4% with combined acid and enzymatic hydrolysis.
After enzymatic hydrolysis, sugar conversion increased from 49.6 to 61.2% and
53.4 to 58.5% for NaOH and ozone pretreatment, respectively. Ozone pretreatment
resulted in significantly lower (P<0.05) sugar conversion (58.5%) than sodium
hydroxide and dilute acid pretreatment. Among all chemical pretreatments, sulfuric
acid at 3.42% (w/w) gave the maximum sugar production. Dilute acid pretreatment
(3.42 (w/w) % acid, 31.7 min, 130 ºC) was more effective at sugar conversion than

132
sodium hydroxide and ozone pretreatment. Eisenhuber et al. (2013) investigated
that effect of different pretreatment methods such as steam explosion, acid and
alkaline on sugar conversion. They reported that acid pretreatment led to the highest
xylose concentration of 120.9 g/kg (at 100 oC, 30 min, 10% sulphuric acid),
followed by a xylose concentration of 94.7 g/kg using steam exploded wheat straw
(at 180 oC, 20 min). The lowest sugar yield was achieved by alkaline pretreatment
(at 100 oC, 30 min, 5% NaOH). Tutt et al. (2012) reported that alkaline pretreatment
method showed lower hydrolysis efficiency compared to the dilute acid
pretreatment methods.
4.3 Selection of the Best Carbon Source of PG Production by B.subtilis
To determine the best inducing carbon source, different carbon sources such as
pectin, hazelnut shell and hazelnut shell hydrolysate, are shown in Fig. 4.21. The
highest PG production was obtained with hazelnut shell hydrolysate (4.8±0.03
EU/mL). It was clear from Fig. 4.21 that hydrolysis of hazelnut shell was effective
compared to ground form based on PG production increased from 0.39 EU/mL to
4.8 EU/mL.

133
Carbon Source
Hazelnut shell (HS) Pectin Pectin+HS HS hydrolyzate
PG
Act
ivity
(EU
/mL)
0
1
2
3
4
5
6
Figure 4.21 Effect of Carbon sources on PG activity at 30 oC pH 7.0 and 130 rpm
after 72 h fermentation
4.4 Evaluation of Key Variables Affecting Enzyme Production
4.4.1. Plackett Burman Design (PBD)
A two level PBD experimental matrix was set up to identify the factors and estimate
their significance in pectinase production. PBD predicts linear model where only
main effects are taken into consideration (Eqn. 32).
Response = a + Σ bi * Xi (32)
The response indicates the dependent variable in terms of overall pectinase
production (EU/mL), a is the model intercept, and Xi represents the levels of
independent variables. Selection of appropriate carbon, nitrogen and other nutrients
is one of the most critical stages in the development of an efficient and economic

134
process. In order to obtain an industrially low cost medium, hazelnut shell with
optimum blend of nutrients and culture conditions were screened for potential high
pectinase activity. In this respect, 8 independent variables were selected; pH,
fermentation time, temperature, inoculum volume (%v/v), pectin, yeast extract,
magnesium sulphate [MgSO4], and dipotassium hydrogen phosphate [K2HPO4].
The concentration of each nutrient was based on the literature. Table 4.21 represents
their actual values while Table 4.22 illustrates the design matrix of various
components with coded values as low (-1) and high (+1) levels.
Table 4.21 Independent variables with their coded and uncoded levels used in
PBD
Serial Number
Variable Low (-1)
Medium (0)
High (+1)
1 pH 5 7.0 9 2 Time (h) 24 48 72 3 Temperature (oC) 30 35 40 4
5 6
Inoculum volume (%v/v) Pectin (%w/v) Yeast extract (%w/v)
1
0.2 0.1
3
0.35 0.3
5
0.5 0.5
7 MgSO4 7H2O (%w/v) 0.02 0.05 0.08 8 K2HPO4 (%w/v) 0.02 0.03 0.04
A maximum pectinase activity of 3.96±0.06 EU/mL was found when B.subtilis was
fermented with pectin 0.5 (%w/v), yeast extract 0.1 (%w/v), MgSO47H2O 0.02
(%w/v), K2HPO4 0.02 (%w/v), pH 5.0, 40 oC, inoculum volume 1% (v/v) and 72h.

135
On the other hand, the maximum pectinase activity using B.pumilus was found as
3.93±0.02 EU/mL using pectin 0.5 (%w/v), yeast extract 0.5 (%w/v), MgSO47H2O
0.08 (%w/v), K2HPO4 0.02 (%w/v), pH 9.0, 30 oC, inoculum volume 1% (v/v), and
24 h as fermentation components. No significant differences in maximum pectinase
production were observed using either B. pumilus or B. subtilis (P>0.05).

136
Tab
le 4
.22
Plac
kett
Bur
man
Des
ign
for s
cree
ning
of f
acto
rs fo
r B.su
btili
s and
B.p
umilu
s
Run
N
o.
pH
T
ime
(h)
Tem
pera
ture
(o C
)
Inoc
ulum
V
olum
e (%
v/v)
Pect
in
(%w
/v)
Yea
st
extr
act
(%w
/v)
MgS
O4
(%w
/v)
K2H
PO4
(%w
/v)
Pect
inas
e A
ctiv
ity*
(EU
/mL
)
B.su
btili
s
B
.pum
ilus
1 +1
-1
+1
-1
-1
-1
+1
+1
3.
26±0
.07
ghi
3.54
±0.0
1bcd
efg
2 +1
+1
-1
+1
-1
-1
-1
+1
3.
40±0
.04
defg
h 3.
52±0
.01b
cdef
g 3
-1
+1
+1
-1
+1
-1
-1
-1
3.96
±0.0
6 a
3.62
±0.0
2 bc
de
4 -1
-1
+1
+1
+1
-1
+1
+1
3.
40±0
.13
defg
h 3.
69±0
.01a
bcd
5 -1
-1
-1
+1
+1
+1
-1
+1
2.
20±0
.09
j 3.
80±0
.03a
b 6
-1
+1
-1
-1
-1
+1
+1
+1
2.11
±0.0
9 j
3.31
±0.0
2fgh
i 7
+1
+1
-1
+1
+1
-1
+1
-1
3.57
±0.0
9 bc
def
3.53
±0.0
2bcd
efg
8 -1
+1
+1
+1
-1
+1
+1
-1
3.
52±0
.09
bcde
fg
3.33
±0.0
2efg
hi
9 -1
-1
-1
-1
-1
-1
-1
-1
3.
04±0
.22
i 3.
50±0
.02c
defg
10
+1
-1
-1
-1
+1
+1
+1
-1
3.
16±0
.07
hi
3.93
±0.0
2 a
11
+1
+1
+1
-1
+1
+1
-1
+1
3.31
±0.0
8 fg
hi
3.71
±0.0
2abc
12
+1
-1
+1
+1
-1
+1
-1
-1
3.
46±0
.07c
defg
h 3.
38±0
.02e
fgh
a Res
ults
bel
ong
to re
plic
ate.

137
The pH of the juices generally falls within the optimum range of the commercial
enzyme preparations. In any case, adjustment of the pH with alkali is not
recommended for the production of fruit juices (Reed, 1966). pH 9.0 is not suitable
for fruit juices and some vegetables (Table 4.23). Thus, B.pumilus was abandoned
in further trials of pectinase production.
Table 4.23 pH value and pectin substances of various fruit/vegetables
Fruit/Vegetable Pectin substance (%) Approximate pH
Apple 0.5-1.6 3.30-4.00
Orange pulp 12.4-28.0 3.50-4.15
Strawberries 0.6-0.7 3.00-3.90
Banana 0.7-1.2 4.50-5.20
Peaches 0.1-0.9 3.30-4.05
Tomatoes 2.4-4.6 4.30-4.90
Carrot 6.9-18.6 5.88-6.40
The variability in the five factors (pH, fermentation time, temperature, yeast extract
and K2HPO4) was found significant by PB analysis as illustrated in Pareto chart
(Figure J.1).
These factors were further optimized by BBD response surface method. Sharma
and Satyanarayana (2006) reported that C:N ratio, K2HPO4 and pH affected
significantly pectinase production of B. pumilus dcsr1 when analyzed 11 variables

138
by PB method. Variability in the initial amount of yeast extract was not determined
significant in their study, and time and temperature were not varied either. For B.
subtilis, 8-factor and 2-level Plackett-Burman design was conducted. The factors
such as pH, fermentation time, temperature, yeast extract and K2HPO4 with T values
above threshold (2.145 in this case) and P values lower than 0.05 as represented by
regression analysis (Table 4.24) had a substantial effect on enzyme activity and
were considered for further evaluation by BBD, while the rest of the variables did
not have a remarkable contribution to enzyme production.
Table 4.24 Regression analysis* for Plackett Burman design variables for
B.subtilis
Term Effect Coefficient T Value P Value Intercept Block
0.320 -0.066
91.88 -1.88
0.000 0.081
pH 0.319 0.159 4.58 0.000
Fermentation time 0.225 0.113 3.24 0.006
Temperature 0.571 0.286 8.20 0.000 % Inoculum (v/v) 0.119 0.060 1.71 0.109
Pectin 0.134 0.067 1.93 0.074
Yeast extract -0.481 -0.241 -6.91 0.000 Magnesium sulphate -0.056 -0.028 -0.80 0.438 Di-potassium hydrogen phosphate -0.504 -0.252 -7.24 0.000 *Result is significant when P<0.05.
The model considering the main effects (equation not shown) was found fairly
accurate with a R2 value of 0.93 and a Radj2 value of 0.89 (Table 4.25).

139
Tab
le 4
.25
Plac
kett
Bur
man
Des
ign
for s
cree
ning
of f
acto
rs fo
r B.su
btili
s
Seri
al
pH
T
ime
(h)
Tem
pera
ture
(o C
)
Inoc
ulum
V
olum
e (%
v/v)
Pect
in
(%w
/v)
Yea
st
extr
act
(%w
/v)
MgS
O4
(%w
/v)
K2H
PO4
(%w
/v)
Res
pons
e va
riab
le P
ectin
ase
Act
ivity
(E
U/m
L)
Exp
erim
enta
l* M
odel
pr
edic
ted
1 +1
-1
+1
-1
-1
-1
+1
+1
3.
26±0
.07
BC
D
3.36
2 +1
+1
-1
+1
-1
-1
-1
+1
3.
40±0
.04
BC
D
3.19
3 -1
+1
+1
-1
+1
-1
-1
-1
3.
96±0
.06
A
3.97
4 -1
-1
+1
+1
+1
-1
+1
+1
3.
40±0
.13
BC
D
3.30
5 -1
-1
-1
+1
+1
+1
-1
+1
2.
20±0
.10
E 2.
30
6 -1
+1
-1
-1
-1
+1
+1
+1
2.
11±0
.09
E 2.
22
7 +1
+1
-1
+1
+1
-1
+1
-1
3.
57±0
.09
AB
3.
78
8 -1
+1
+1
+1
-1
+1
+1
-1
3.
52±0
.09
BC
3.
41
9 -1
-1
-1
-1
-1
-1
-1
-1
3.
04±0
.22
D
3.03
10
+1
-1
-1
-1
+1
+1
+1
-1
3.16
±0.0
7 C
D
2.95
11
+1
+1
+1
-1
+1
+1
-1
+1
3.31
±0.0
8 B
CD
3.
30
12
+1
-1
+1
+1
-1
+1
-1
-1
3.46
±0.0
7 B
C
3.56
a R
esul
ts b
elon
g to
repl
icat
e.

140
4.4.2 Effect of Fermentation Time
pH, fermentation time, temperature, inoculum volume (%v/v), pectin, yeast extract,
magnesium sulphate [MgSO4], and dipotassium hydrogen phosphate [K2HPO4]
were kept at a constant, enzyme activities were measured at the end of 6, 12, 24,
36, 48, 60, 72, and 84 h to determine the effect of time on PG production (Figure
4.22). The results indicated that the highest enzyme production (4.8 EU/mL) was
achieved after 72 h at 30 oC, pH 7.0 and with agitation of 130 rpm.
time (h)
0 20 40 60 80 100
PG
Act
ivity
(EU
/mL)
0
1
2
3
4
5
6
Figure 4.22 Time course of pectinase production by B.subtilis at pH 7.0, 30 oC and
with shaking at 130 rpm.

141
4.4.3 Optimization of Fermentation Medium Components and
Conditions for Pectinase Production by Response Surface Method
(RSM)
In industrial perspective of enzyme production, the economy is another important
point to consider and can be addressed by optimization of the bioprocess. The
experimental plan and the results of pectinase production for various combination
of pH (A), temperature (B), time (C), yeast extract (D) and dipotassium hydrogen
phosphate [K2HPO4] (E) are shown in Table 4.26. The lowest PG activity
(3.35±0.03 EU/mL) was obtained at pH 7.0, temperature 35 oC with yeast extract
0.1 (w/w, %) and K2HPO4 0.03 (w/w, %) for 72 h. However, the highest PG activity
(4.77±0.03 EU/mL) was observed at pH 7.0, temperature 35 oC with yeast extract
0.5 (w/w, %) and K2HPO4 0.03 (w/w, %) for 72 h (Table 4.26).
A second order polynomial model fit to the experimental data for optimizing
pectinase production by RSM predicts the response as a function of five variables
and their interactions in terms of their coded values. The ANOVA results and
estimated regression coefficients for the coded pectinase activity model are shown
in Table 4.27. Another run with excluded insignificant terms according to Table
K.1 expressed by Eqn. (33) and the final form of the equation in terms of coded
values of factors was given as:
Y=4.271-0.075Aª0.233B+0.162C+0.137D+0.137E -0.221Aª -0.231B2 – 0.166C2-
0.258D2 + 0.096AB -0.111AC -0.093AD-0.379AE–0.296BC -0.218BD +0.218BE
+ 0.478CD– 0.381DE (33)
where Y is predicted pectinase activity, A,B,C,D,E are the coded values for pH,
fermentation time, temperature, yeast extract and [K2HPO4] respectively.

142
Tab
le 4
.26
Expe
rimen
tal d
esig
n fo
r opt
imiz
atio
n of
pec
tinas
e pr
oduc
tion
usin
g re
spon
se su
rfac
e m
etho
d (R
SM)
Run
O
rder
pH
(A
) T
empe
ratu
re (B
) T
ime
(h
) (C
) Y
east
ex
trac
t (%
w/v
) (D
)
K2H
PO4
(%w
/v)
(E)
Exp
erim
enta
l Res
pons
e Pe
ctin
ase
Act
ivity
(EU
/mL
)
Mod
el p
redi
cted
R
espo
nse
(EU
/mL
) 1
0 0
+1
-1
0 3.
35±0
.03
3.40
2
0 +1
0
0 +1
4.
02±0
.03
4.18
3
0 +1
0
-1
0 3.
70±0
.03
3.64
4
0 0
+1
0 -1
4.
04±0
.01
4.14
5
0 -1
0
0 -1
4.
41±0
.04
4.37
6
+1
0 +1
0
0 3.
98±0
.04
3.86
7
0 0
0 0
0 4.
24±0
.04
4.29
8
+1
0 0
+1
0 3.
68±0
.04
3.77
9
0 +1
+1
0
0 3.
46±0
.03
3.51
10
+1
+1
0
0 0
3.65
±0.0
3 3.
61
11
+1
0 0
0 +1
3.
72±0
.03
3.75
12
0
-1
0 +1
0
4.41
±0.0
5 4.
37
13
0 0
0 0
0 4.
28±0
.04
4.29
14
+1
0
-1
0 0
3.84
±0.0
2 3.
76
15
0 0
-1
0 +1
4.
28±0
.04
4.09
16
-1
0
+1
0 0
4.15
±0.0
3 4.
24
17
-1
0 -1
0
0 3.
55±0
.06
3.69
18
0
+1
0 +1
0
3.49
±0.0
3 3.
47
19
-1
0 0
0 -1
3.
69±0
.04
3.62
20
0
0 +1
0
+1
4.39
±0.0
3 4.
42
21
0 0
0 0
0 4.
23±0
.02
4.29

143
22
0 +1
0
0 -1
3.
51±0
.05
3.47
23
0
-1
0 0
+1
4.04
±0.0
2 4.
20
24
0 -1
+1
0
0 4.
58±0
.04
4.57
25
0
0 0
0 0
4.34
±0.1
6 4.
29
26
0 0
0 0
0 4.
35±0
.07
4.29
27
0
+1
-1
0 0
3.65
±0.0
3 3.
78
28
-1
0 0
+1
0 4.
08±0
.03
4.10
29
0
0 0
-1
-1
3.39
±0.0
3 3.
37
30
0 0
0 +1
+1
3.
79±0
.04
3.92
31
+1
-1
0
0 0
3.84
±0.0
3 3.
89
32
0 0
-1
0 -1
3.
69±0
.02
3.82
33
0
-1
0 -1
0
3.75
±0.0
5 3.
67
34
0 0
+1
+1
0 4.
77±0
.03
4.63
35
+1
0
0 -1
0
3.54
±0.0
3 3.
68
36
0 0
0 -1
+1
4.
46±0
.03
4.41
37
0
0 -1
+1
0
3.52
±0.0
1 3.
35
38
-1
+1
0 0
0 3.
69±0
.03
3.57
39
-1
0
0 -1
0
3.56
±0.0
3 3.
64
40
0 0
0 +1
-1
4.
24±0
.04
4.41
41
+1
0
0 0
-1
4.24
±0.0
4 4.
23
42
-1
0 0
0 +1
4.
69±0
.04
4.65
43
-1
-1
0
0 0
4.28
±0.0
3 4.
23
44
0 0
-1
-1
0 4.
02±0
.04
4.03
45
0
-1
-1
0 0
3.58
±0.0
4 3.
65
46
0 0
0 0
0 4.
32±0
.05
4.29
Tabl
e 4.
26 (c
ontin
ued)

144
The derived polynomial equation was found adequate in representing the
experimental data (R2=0.9398). The coefficients of the equation shown in Table
4.27 indicated the contribution of individual and combinations of components in
the pectinase production.
Table 4.27 ANOVA results of BBD in coded values
Term Coefficient P Value Constant 4.291 0.000 pH (A) -0.075 0.000* Temp. (B) -0.233 0.000* Time (C) 0.162 0.000* Yeast extract (D) 0.137 0.000* K2HPO4 (E) 0.137 0.000* A*B -0.096 0.012* A*C -0.111 0.004* A*D -0.093 0.015* A*E -0.379 0.000* B*C -0.296 0.000* B*D -0.218 0.000* B*E 0.218 0.000* C*D 0.478 0.000* C*E -0.060 0.115 D*E -0.381 0.000* A2 -0.229 0.000* B2 -0.229 0.000* C2 -0.174 0.000* D2 -0.266 0.000* E2 -0.028 0.274
*Result is significant when P<0.05

145
The most important factors determining the pectinase activity (EU/mL) were
fermentation time with highest coefficient (0.233), which indicates that it is the
most dominant factor influencing the overall pectinase production from hazelnut
shells followed by temperature (0.162), [K2HPO4] (0.137), yeast extract (0.137) and
pH (0.075) (Table 4.27).
The insignificant lack of fit (P = 0.135 >0.05) also proved that the model fitted well
to the experimental data. This signifies the model with 95% level of confidence
(α=0.05) and all effects namely linear, interaction and quadratic are exhibited. The
quality of fit model was estimated by Radj2 and predicted R2 (Rpred
2) values were
found as 0.92 and 0.89 respectively, which are fairly high and accurate measures of
precision (Ohtani, 2000). This indicates that only 8% variation in response cannot
be suitably explained by the model. This indicated that model equation very well
corresponded to BBD experimental data. It was also observed that the five-major
factors and almost all interactions significantly affect the PG production with low
P values (Table 4.27).
The three dimensional (3D) response surface curves were plotted to depict the
relationship among the various selected factors and to determine their optimum
values for attaining the maximum activity of pectinase. Figure 4.23 represents the
response surface plots for pectinase production at varying concentration of a)
[K2HPO4] vs yeast extract concentration, b) [K2HPO4] vs time, c) [K2HPO4] vs pH,
d) [K2HPO4] vs temperature, e) yeast extract concentration vs time, f) yeast extract
concentration vs temperature, g) yeast extract concentration vs pH, h) time vs
temperature, i) time vs pH and j) temperature vs pH, respectively. The fifth factor,
in all cases, was held constant at the center point (i.e. pH 7.0, time 48 h, temperature
35 oC, yeast extract concentration 0.3 (%w/v) and K2HPO4 0.03 (%w/v)
respectively).
A rapid increase in pectinase production was observed when yeast extract was
increased up to mid-values and stayed constant thereafter, whereas a slight increase
was observed with K2HPO4 (Fig. 4.23.a). Joshi et al. (2013) also reported high
pectinase production at 2.5% yeast extract. A similar trend was reported for

146
K2HPO4 (Sharma & Satyanarayana, 2006), where a maximum increase in pectinase
was attained at 0.5% K2HPO4. Figure 4.23.b shows that pectinase activity increased
with the increase of K2HPO4, and starts to decrease beyond 50 h.
Pectinase production is directly proportional to microbial growth and is high in the
late exponential phase of growth and decreases thereafter (Joshi et al., 2013).
Varying optimal fermentation time in the range of 24 h to 6 days are available for
Bacillus subtilis (Ahlawat et al., 2009, Joshi et al., 2013, Swain & Ray, 2009).
A rapid increase in pectinase activity was observed as pH was increased to about
7.0, and a slight decrease occurs beyond pH 8 (Fig. 4.23.c,g,i,j). A similar positive
effect of pH was reported by others (Sharma & Satyanarayana, 2006). High pH
values accounts typically for PG and pectate lyase production (Joshi et al., 2013).

147
Figure 4.23 Surface plots showing the effect of a) [K2HPO4] and yeast extract concentration, b) [K2HPO4] and time, c) [K2HPO4] and pH, d) [K2HPO4] and temperature, e) yeast extract concentration and time, f) yeast extract concentration and temperature, g) yeast extract concentration and pH, h) time and temperature, i) time and pH and j) temperature and pH on pectinase production.
3.5
4.0
00.100.25
0.40
4.5
0.04
0.03
0.020.55
(EU/mL)Pectinase Activity
Yeast extract (%w/v)
K2HPO4 (%w/v)3.8
4.0
4.2
20040
60
4.4
0.02
0.03
0.04(EU/mL)Pectinase Activity
Time (h)
K2HPO4 (% w/v)
3.5
4.0
6.07.5
4.5
0.029.0
0.03
0.04
pH
K2HPO4 (%w/v)
(EU/mL)Pectinase Activity
3.50
3.75
4.00
3035
4.25
0.0240
0.03
0.04 (EU/mL)Pectinase Activity
Temperature (oC)
K2HPO4 (%w/v)
3.5
4.0
20040
60
4.5
0.25
0.10
0.4
0.25
0.55
40
Time (h)
Yeast Extract (%w/v)
(EU/mL)Pectinase Activity
3.50
3.75
4.00
3035
4.25
0.25
0.1040
0.4
0.25
0.55
40
Temperature (oC)
Yeast extract (%w/v)
(EU/mL)Pectinase Activity
3.6
3.8
4.0
6.07.5
4.2
0.25
0.109.0
0.4
0.25
0.55
40
pH
Yeast extract (%w/v)
(EU/mL)Pectinase Activity
3.5
4.0
3035
4.5
40
2040
60
40
0
Temeprature (oC)
Time (h)
(EU/mL)Pectinase Activity
3.8
4.0
6.07.5
4.2
4.4
40
209.0
60
40
0
pH
Time (h)
(EU/mL)Pectinase Activity
3.50
3.75
4.00
6.07.5
4.25
309.0
35
40
pH
Temperature (oC)
(EU/mL)Pectinase Activity

148
Temperature exerted a profound effect on pectinase production, giving high enzyme
yields around 30-35 oC and decreasing at higher ends (Fig. 4.23.d,f,h). Similar mild
temperatures were reported elsewhere (Ahlawat et al., 2009, Jayani et al., 2010,
Joshi et al., 2013). Bayoumi et al. (2008) also obtained maximum pectinase activity
in Bacillus at 37 °C at neutral pH. The influence of temperature is associated with
the growth of the organism (Swain & Ray, 2009). It was also observed that
pectinase activity increased when K2HPO4 increased and temperature decreased
(Fig. 4.23.d).
An increase in yeast extract concentration led to the increasing PG activity, whereas
this increase was limited by time (Fig. 4.23.e). Yeast extract contains vitamins,
minerals and amino acids, which are necessary for bacterial growth and enzyme
production, thus facilitating cell growth and enzyme production (Rehman et al.,
2012). Fig. 4.23.f-j showed that as the levels of the variables increased, pectinase
activity increased nonlinearly. Figure 4.23.f shows that pectinase activity initially
increased and then decreased with the increase of yeast extract for a specified
temperature. A similar nonlinear effect of yeast extract and pH on pectinase activity
was observed in Fig. 4.23.g. Nonlinearity for different combinations of temperature,
time and pH also existed in Fig 4.23.h-j. High temperature (35 oC) increases the
solubility and diffusivity of proteins and no protein loss is indicated through thermal
denaturation (Castilho et al., 2000). The enzyme activity decreased gradually as the
temperature was raised to 40 oC. For most of the bacteria, pH optimum for growth
and pectinase production is in the range of 7.0 to 10 (Ahlawat et al., 2009).
Three dimensional (3D) response contour plots were then plotted to observe the
interaction effect of variables in pairs on pectinase production prior to determining
the optimal conditions (Figure L.1). The remaining three factors were held constant
at their center levels (i.e. pH 7.0, time 48 h, temperature 35 oC, yeast extract 0.3
(%w/v) and K2HPO4 0.03 (%w/v), respectively).
The shapes of the contour plots, which could be circular, elliptical, or saddle,
provide another tool to indicate the significance of the interactions between the

149
variables. While a circular contour plot indicates negligible interaction, elliptical or
saddle contour plot indicates a significant interaction between the corresponding
variables (Murthy et al., 2000). In Figure I.1, the contour plot showed significant
interaction between [K2HPO4]-yeast extract concentration, [K2HPO4]-pH,
[K2HPO4]-temperature, yeast extract concentration- time, yeast extract
concentration- temperature, yeast extract concentration-pH, time-temperature,
time-pH and temperature-pH with the more elliptical or saddle shape than
[K2HPO4]-time. In Figure I.1.b, the shape of the contour plots is rather circular, and
[K2HPO4]-time interaction could be assumed negligible for pectinase production.
The optimum conditions giving maximal PG activity (5.60 EU/mL) were identified
as 0.5 % (w/v) of yeast extract, pH 7.0, 72 h of fermentation time, 30 oC of
temperature and 0.02 % (w/v) of K2HPO4. Thus, a 2.7 fold (or 166%) increase in
pectinase production of Bacillus subtilis was achieved in shake flasks by PB and
RSM optimization compared to unoptimized culture conditions. A 3.4 fold increase
in PG production by Bacillus subtilis RCK was reported due to RSM optimization
(Gupta et al., 2008). A 48% increase in enzyme activity of A. sojae ATCC 20235
was reported after optimizing culture conditions by RSM (Ustok et al., 2007).
Similarly, a 1.5-fold increase in pectinase secretion of Kluyveromyces wickerhamii
was reported in the study of Moyo et al. (2003) by RSM. These resulted proved that
the PG production achieved in our study is comparable to those reported in the
literature. Slight variation in the enzyme activity is inevitable due to differences in
nature of the organism cultivated, varying culture conditions tested in RSM, and
raw material used as carbon or nitrogen source.
To validate the model, additional runs were carried out for pectinase production at
the optimal conditions predicted by RSM. The experimental PG activity of 4.84
EU/mL was slightly lower than the predicted value of 5.60 EU/mL. However, a low
value of coefficient of variation, which was 10.6 %, indicated the adequacy of the
model.
Soares et al. (1999) selected six strains of Bacillus sp. as good PG producers. The
activities varied from 0.3 to 4.0 U/mL. Galiotou-Panayotou and Kapantai (1993)

150
achieved 3.0 U/mL of PG by submerged fermentation of A. niger in medium
composed by pectin of citrus. Kashyap et al. (2001) obtained 15.7 U/mL after 30 h
of fermentation by strains of Bacillus sp. Martins et al. (2007) found a maximum
activity of 5.0 U/mL using Thermoascus aurantiacus. According to another study
conducted by Jayani et al. (2010), the polygalacturonase activity was observed
between 4.3-6.2 U/mL by Bacillus sphaericus (MTCC 7542). In this study, 16-
hour-old inoculum was used at 7.5% (v/v) in synthetic medium and incubated in
shaking conditions (160 rpm) for 72 h with the optimal temperature and pH as 30
◦C and 6.8, respectively, for bacterial growth and polygalacturonase production
(Jayani et al., 2010). Zeni et al. (2011) obtained polygalacturonase activity as 4.2
U/mL after 48 h of fermentation by strains of Aspergillus sp.
Comparing the results of work presented here with those reported in the literature,
higher pectinolytic activities were obtained in this study.
4.4.3 Biochemical Characterization of the Crude Pectinase
The purpose of the biochemical characterization was to understand the activity or
stability behavior of the produced enzyme under different conditions in order to
evaluate its potential industrial applications in the area of biotechnology or food
engineering (Gummadi & Panda, 2003).
4.4.3.1 Effect of pH on The Activity and Stability of Pectinase
The effect of pH on pectinase activity and stability were determined in a pH range
of 5.0-9.0 under standard assay conditions. The highest pectinase activity was
observed at pH 7.0 as shown in Figure 4.24.

151
pH
4 5 6 7 8 9 10
Pec
tinas
e A
ctiv
ity (E
U/m
L)
3.6
3.8
4.0
4.2
4.4
4.6
4.8
5.0
Figure 4.24 Effect of pH on the pectinase activity
The preference for a neutral pH for pectinase production was similar to that of
B.subtilis MFW7 (Mukesh kumar et al., 2012), B.subtilis CM5 (Swain and Ray,
2010), Bacillus sphaericus (Jayani et al., 2010), Bacillus spp. (Kobayashi et al.,
1999) and other Bacillus strains (Soares et al., 1999). Figure 4.25 illustrates the
retained pectinase activity after 7 h incubation at different pH values. Pectinase was
retained c.93% of its activity at pH 7.0 after 7h incubation.

152
pH
4 5 6 7 8 9 10
Res
idua
l Act
ivity
(%)
20
40
60
80
100
Figure 4.25 Effect of pH on the pectinase activity
4.4.3.2 Effect of Temperature on Pectinase Activity and Stability
The effect of temperature on pectinase activity and stability were determined at a
temperature range of 30-40 oC under standard assay conditions. The highest
pectinase activity was observed at 30 oC as shown in Figure 4.26. Several studies
showed that the optimum temperature of pectinase activity obtained from B.subtilis
was found as 30 oC (Mukesh kumar et al., 2012; Kashyap et al., 2000). The optimum
temperature of activity of B.subtilis is very suitable for fruit juice clarification
applications which are generally held between 30-50 oC.

153
Temperature (oC)
28 30 32 34 36 38 40 42
Pec
tinas
e A
ctiv
ity (E
U/m
L)
3.4
3.6
3.8
4.0
4.2
4.4
4.6
Figure 4.26 Temperature dependence of pectinase activity
The effect of temperature on pectinase stability was determined at a temperature
range of 40-60 oC under standard assay conditions Figure 4.27 illustrates the
retained pectinase activity after 7 h incubation at different temperature values.
Pectinase was retained c.93% of its activity at 50 oC after 7h incubation. After this
temperature, pectinase lost its stability sharply (79%).

154
Temperature (oC)
35 40 45 50 55 60 65
Res
idua
l Act
ivity
(%)
50
60
70
80
90
100
Figure 4.27 Temperature dependence of pectinase stability
This property indicated that the pectinase has sufficient thermostability at the
enzymatic clarification of fruit juices held at 50 oC. The half-life of pectinase at 50 oC and 60 oC were 82.5 and 21 h, respectively. Besides the half-life of pectinase at
50 oC was higher than that of pectinase at 60 oC showing that the enzyme was more
stable at 50 oC and easier to inactivate at 60 oC.
4.4.3.3 Molecular Weight of Pectinase
Crude extract of pectinase exhibited 72.9 mg protein and a specific activity of 0.91
U/mg. After using 50 kDa ultrafiltration membranes, the enzyme purity increased
1.06 fold, with a specific activity of 0.96 U/mg (Table 4.28). According to the
results, the molecular weight of pectinase was found around 50 kDa. There were

155
wide variations in molecular mass of exo-PG recorded from different microbial
sources, that is, Bacillus spp. (20.3 kDa) (Kobayashi et al.,1999), Aspergillus
japonicum (38 and 65 kDa) (Semenova et al., 2003), and Thermotoga maritime
(151.2 kDa) (Kluskens et al., 2003).
Table 4. 28 Summary of the Pectinase Concentration from B.subtilis
Steps Total Volume
(mL)
Total
activity
(U)
Total
Protein
(mg)
1*Specific
activity
(U/mg)
2* Degree of
Purification
3* Yield
Crude
enzyme
15 4.86 72.90 0.91 1.00 100
<50 kDa 5 4.86 24.30 0.96 1.06 35.2
>50 kDa 5 6.35 31.75 0.77 0.84 36.7
1* Specific Activity (U/mg protein): PG activity (U/mL)/ Protein concentration (mg/mL) 2* Degree of Purification: Specific PG activity (U/mg)/Crude specific PG activity (U/mg) 3*Yield (%): [Total PG activity (U/mL)/Crude total PG activity (U/mL)]*100
4.5 Application of Crude Pectinase in Carrot Juice Clarification
The crude enzyme was applied for clarification of carrot juice and its effectiveness
was studied after the optimization. The effect of varying enzyme concentration, pH
and time on clarity (%) was evaluated.

156
4.5.1 Optimization of Clarification Variables Using Crude Pectinase
Enzyme
The crude enzyme was applied to clarification of carrot juice and its effectiveness
was evaluated by RSM optimization. The effect of varying enzyme concentration,
pH and time was investigated in terms of clarity (%). Clarity is an important
parameter of clarified juice (Sin et al., 2006). The experimental values for clarity
under different conditions are presented in Table 4.29. Clarification of carrot juice
in this study ranged between 78.77-97.73% treated with crude pectinase,
irrespective of the enzyme concentration, pH and time. The maximum clarity of
carrot juice (97.73%) was obtained at maximum conditions of enzyme
concentration (0.3%), pH (7.0) and time (6h) (Table 4.29).
Table 4.29 BBD experimental design (in coded variables) employed for
clarification of carrot juice
Independent variables Dependent
variable
Serial
number
Enzyme
concentration
(%)
pH Time
(h) Clarity (%)
X1 (x1) X2 (x2) X3 (x3) Y
1 0.3 (0) 4.0 (-1) 6 (+1) 95.93±0.29 AB
2 0.3 (0) 7.0 (+1) 6 (+1) 97.73±0.47 A
3 0.3 (0) 5.5 (0) 4 (0) 85.68±0.37 F
4 0.5 (+1) 4.0 (-1) 4 (0) 82.71±0.34 G

157
5 0.5 (+1) 7.0 (+1) 4 (0) 94.00±0.79 BCD
6 0.5 (+1) 5.5 (0) 2 (-1) 86.15±0.29 F
7 0.3 (0) 4.0 (-1) 2 (-1) 78.77±0.48 H
8 0.3 (0) 5.5 (0) 4 (0) 86.24±0.42 F
9 0.1 (-1) 5.5 (0) 2 (-1) 84.58±0.96 FG
10 0.1 (-1) 4.0 (-1) 4 (0) 89.84±0.62 E
11 0.1 (-1) 5.5 (0) 6 (+1) 94.34±0.05 BC
12 0.3 (0) 7.0 (+1) 2 (0) 91.56±1.57 DE
13 0.5 (+1) 5.5 (0) 6 (+1) 95.82±0.46 ABC
14 0.1 (-1) 7.0 (+1) 4 (0) 93.22±0.62 CD
15 0.3 (0) 5.5 (0) 4 (0) 84.95±0.76 F
x represent the coded level of variables. X represent the actual level of variables. Figures in parentheses denote coded level of variables
The regression coefficients for the second order polynomial equation and results for
the linear, quadratic and interaction terms are presented in Table 4.30. The
statistical analysis indicated that the proposed model was adequate, possessing no
significant lack of fit and with very satisfactory values of the R2 for the response.
The insignificant lack of fit for % clarity was (P = 0.132 >0.05), which also proved
that the model fit the experimental data well.
Table 4.29 (continued)

158
Table 4.30 ANOVA results* and estimated regression coefficients for the coded
clarification of carrot juice model
Term Coefficient P Value
Regression 0.000
Linear 0.000
Square 0.000
Interaction 0.000
Lack-of-fit 0.119
Constant 85.62 0.000
Enzyme conc.(%) -0.412 0.231
pH 3.657 0.000*
Time (h) 5.344 0.000*
Enzyme con. *Enzyme conc. 1.769 0.002*
pH*pH 2.547 0.000*
Time*Time 2.826 0.000*
Enzyme conc.*pH 1.978 0.000*
Enzyme conc.*Time -0.021 0.964
pH*Time -2.749 0.000*
R-Sq = 0.9631 % R-Sq(adj) = 0.9466 % R-Sq(pred) = 0.9128 %
*Result is significant when P<0.05
The derived polynomial equation was found adequate in representing the
experimental data (R2=0.9631). Another run with excluded insignificant terms
according to Table M.1 expressed by Eqn. 34 and the final form of the equation in
terms of coded values of factors was given as :
Y=85.62 +3.66X2+5.34X3+1.77X12 +2.55X2
2 +2.83X32+ 1.98X1X2 -2.75X2X3
(34)

159
where Y is predicted clarify (%), X1, X2, X3 are coded values for enzyme
concentration (%) , pH and time (h), respectively.
4.5.2 Effects of Enzyme Concentration, pH and Time
The effect of different enzyme treatment conditions on the clarity are reported
(Table 4.30) by the regression coefficients. Linear (P=0.000), quadratic (P=0.000),
and interaction effects (P=0.000) were found statistically significant. Among the
variables studied, pH and treatment time showed significant effect (P<0.05) on
clarity. The clarity depends on the enzyme concentration, where its linear (P>0.05)
effect was not significantly affected and quadratic (P<0.05) effect was significantly
affected by crude pectinase concentration. Interaction between enzyme
concentration and pH and pH and time had significant effects (P<0.05) on clarity
(Table 4.30).
The results showed significant interaction effects between pH and enzyme
concentration at P<0.05 with a positive effect, therefore the pH was dependent on
enzyme concentration. It showed a significant interaction effect between pH and
time at P<0.05 with a positive effect (Table 4.30).
The most important factors determining the % clarity were time with highest
coefficient (5.34), which indicates that it is the most dominant factor influencing
the overall clarification of carrot juice using B.subtilis pectinase produced from
hazelnut shell followed by pH (3.66) (Table 4.30).
To aid visualization, the response surface plots for clarity are shown in Figure 4.28-
4.30. According to Kilara (1982), temperature may cooperate in the rate of
enzymatic clarification process as the temperature is below denaturation
temperature (40–60 oC). Therefore, moderate temperature could and should be used
during clarification of carrot juice.
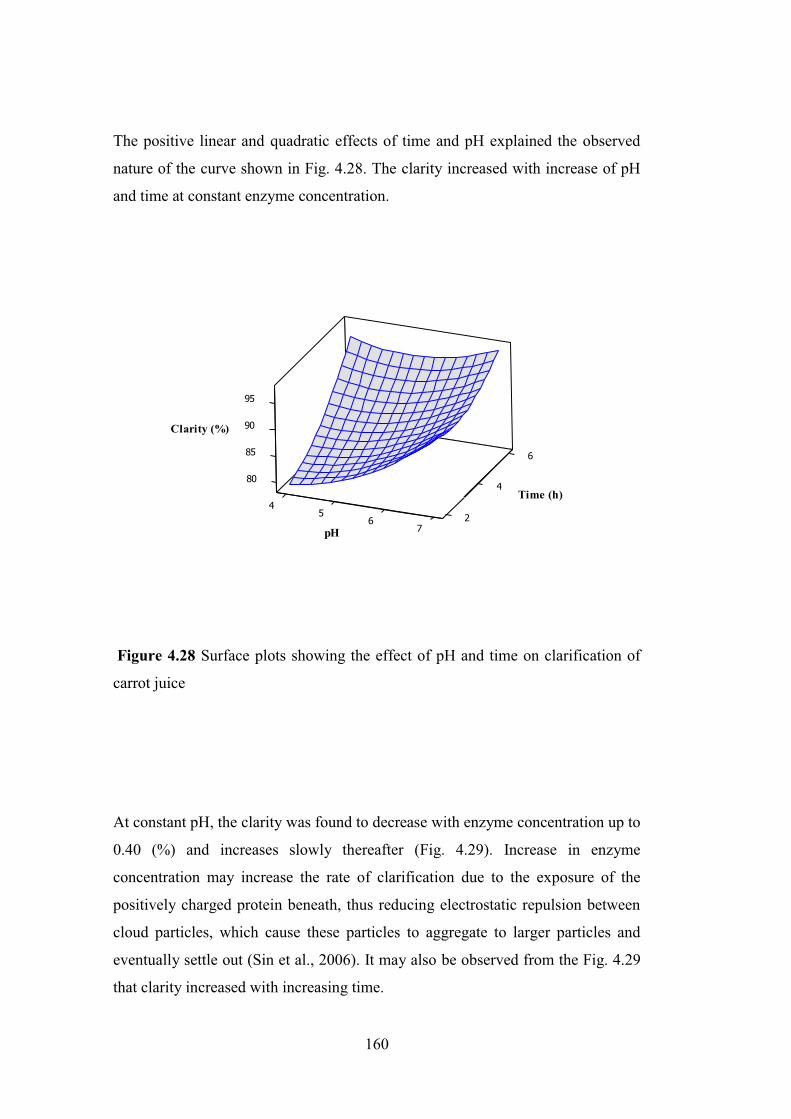
160
The positive linear and quadratic effects of time and pH explained the observed
nature of the curve shown in Fig. 4.28. The clarity increased with increase of pH
and time at constant enzyme concentration.
6
804
85
90
4
95
5 267
Clarity (%)
Time (h)
pH
Figure 4.28 Surface plots showing the effect of pH and time on clarification of
carrot juice
At constant pH, the clarity was found to decrease with enzyme concentration up to
0.40 (%) and increases slowly thereafter (Fig. 4.29). Increase in enzyme
concentration may increase the rate of clarification due to the exposure of the
positively charged protein beneath, thus reducing electrostatic repulsion between
cloud particles, which cause these particles to aggregate to larger particles and
eventually settle out (Sin et al., 2006). It may also be observed from the Fig. 4.29
that clarity increased with increasing time.

161
685
4
90
0.10
95
0.25 20.400.55
Clarity (%)
Time (h)
Enzyme concentration (%)
Figure 4.29 Surface plots showing the effect of enzyme concentration and time on
clarification of carrot juice.
Sin et al. (2006) investigated the optimum conditions (0.1% enzyme concentration
at 40 oC for 120 min) for clarification of sapodilla juice which was treated with
pectinase enzyme at different incubation times (30–120 min), temperature (30–50 oC) and enzyme concentration (0.03–0.10%). A similar behaviour for the clarity
was observed for the changes in incubation time with Sin et al. (2006). As time
increased, fine particles in juice may also slowly settle down (Sin et al., 2006).
At the lowest level of enzyme concentration, the clarity of carrot juice was found
to increase rapidly at the beginning with an increase in pH (Fig. 4.30). Degradation
of pectin causes a decrease in water holding capacity, and consequently, free water
is released to the system, which increases the clarity of juice (Demir et al., 2000).

162
7
685
90
50.10
95
0.25 40.400.55
Clarity (%)
pH
Enzyme concentration (%)
Figure 4.30 Surface plots showing the effect of enzyme concentration and pH on
clarification of carrot juice.
The optimum conditions for clarification of carrot juice predicted by the model was
found as 0.5 % enzyme concentration, 7.0 pH and 6 h. To confirm the validity of
RSM model, six optimum check points were selected by intensive grid search
performed over the entire experimental domain. Linear regression plots between
the observed and predicted values of the response are drawn (Fig. 4.31). The
constructed model was also assessed using error analysis. The root mean square
error and mean absolute error values were calculated as 1.99 and 0.76, respectively.
A high value of coefficient of determination (R2=0.9631) showed that the model
was successful in predicting clarity of the carrot juice (Fig. 4.31).

163
Experimental value
70 75 80 85 90 95 100
Pred
icted
valu
e
80
85
90
95
100
y=0.723x+27.732R2=0.96313
Figure 4.31 Verification of the model obtained by RSM
The clarification yield (%) using commercial enzyme was obtained as 78.18±3.14,
whereas clarification yield (%) using crude enzyme was obtained as 94.47±0.01 at
pH 7.0 with 0.5% enzyme concentration for 6 h. According to Swain and Ray
(2010), yield of carrot juice was found as 70 and 95 % in Pectinex 3XL and
B.subtilis polygalacturonase treated samples, respectively, over control (no enzyme
treated sample) after 8 h of incubation. Incubation time of 2-16 h was found
optimum for clarification of juice from apple, pears, and grapes (Kaur et al., 2004).
This study also showed that crude pectinase provided good clarification of carrot
juice as well. The crude pectinase was also as effective and competitive as
commercial pectinase.

164

165
CHAPTER 5
CONCLUSIONS
This study investigated the potential use of hazelnut shell as carbon source in
pectinase production from Bacillus subtilis by submerged fermentation. For this
purpose, the pretreatment methods such as ozone, alkaline and dilute acid were
employed to produce sugar monomers for enhancing the pectinase production.
Based on the produced reducing sugar yields, dilute acid pretreatment method was
selected as the best chemical pretreatment method. An optimum reducing sugar
concentration of 16.65 g/L (62.8 % saccharification yield) was achieved with low
levels of acetic acid, HMF and no furfurals during acidic pretreatment. The overall
sugar yield of combined acid and enzymatic hydrolysis reached 72.4% of the
theoretical. The combined dilute acid and enzymatic hydrolysis was also found
more effective than acid hydrolysis alone. The results indicated that hazelnut shell
is an attractive source of fermentable sugars (more than 50 %) and dilute-acid
hydrolysis is an effective process to produce sugars from hazelnut shells for
production of various value added products.
Hazelnut shells, an inexpensive agro-residue, was shown to serve as an appropriate
substrate for production of PG by Bacillus subtilis by optimizing submerged
fermentation medium composition and conditions using PB and RSM approach.
It was concluded that PG production was influenced significantly by all factors and
their interactions, except for time vs. K2HPO4 and squared K2HPO4. Significant
squared terms also reflect the limiting increase in pectinase production by pH,
temperature, time, and yeast extract levels, where upper and lower values resulted
in low pectinase production, while K2HPO4 possessed linear effects in all plots.
A 2.7 fold enhancement in enzyme production was achieved compared to

166
unoptimized fermentation trials. The optimization results indicated that a maximal
PG activity of 5.60 EU/mL was achieved at pH 7.0, 72 h, and 30 oC, 0.5 % (w/v)
yeast extract and 0.02 % (w/v) of K2HPO4.
B. subtilis produced remarkable level of PG activity at neutral pH; hence, it can
potentially be used to increase the extraction yield of banana, carrot, grape, or apple
juice. The RSM results revealed that 100% clarity was attained under optimal
clarification conditions of 0.5% (w/v) enzyme concentration, 7.0 pH, and 6 h of
clarification period. The results also indicated that the produced crude pectinase
was equally effective and competitive as the commercial enzyme.

167
CHAPTER 6
RECOMMENDATIONS
Kinetic studies of submerged pectinase production from B.subtilis using hazelnut
shell hydrolyzate are required for better understanding and describing the behaviour
of pectinase produced.
This study provided a preliminarily study of cost analysis for dilute acid
pretreatment. Thus, further detailed analysis is necessary to determine the economic
feasibility of dilute acid pretreatment and enzymatic hydrolysis.
The medium composition and culture conditions were optimized using shake-flask
bioreactors. Thus, the optimum factors should be implemented at large scale
bioreactors with strictly controlled extrinsic parameters such as aeration rate, pH
etc. Also, purification and characterization of pectinase produced by B. subtilis may
be carried out.

168

169
REFERENCES
Acar, J., & Gokmen, V. (2005). Meyve ve sebze işleme teknolojisi, Vol 1, Meyve ve sebze suları üretimi, Hacettepe Üniversitesi yayınları, Ankara, Türkiye.
Agblevor, F.A., Batz, S., & Trumbo, J. (2003). Composition and ethanol production potential of cotton gin residues. Applied Biochemistry Biotechnology, 105-108, 219-230.
Ahlawat, S., Dhiman, S.S., Battan, B., Mandhan, R.P., & Sharma, J. (2009). Pectinase production by Bacillus subtilis and its potential application in biopreparation of cotton and micropoly fabric. Process Biochemistry, 44, 521-526.
Ahlawat, S., Mandhan, R.P., Dhiman, S.S., Kumar, R., & Sharma, J. (2008). Potential application of alkaline pectinase from Bacillus subtilis SS in pulp and paper industry. Applied Biochemistry and Biotechnology, 149, 287-293.
Aiduan, L., Blanca, A.L., & Majeda, K. (2007). Bioconversion of municipal solid waste to glucose for bio-ethanol production. Bioprocess and Biosystems Engineering, 30, 189-196.
Akpinar, O., Levent, O., Bostanci, S., Bakir, U., & Yılmaz, L. (2011). The optimization of dilute acid hydrolysis of cotton stalk in xylose production. Applied Biochemistry Biotechnology, 163, 313-325.
Alkorta, I., Garbisu, C., Liama, M.J., & Serra, J.L.(1998). Industrial applications of pectin enzymes: a review. Process Biochemistry, 33(1), 21-28.
Andrade, M.V.V., Delatorre, A.B., Ladeira, S.A., & Martins, M.L.L. (2011). Production and partial characterization of alkaline polygalacturonase secreted by thermophilic Bacillus sp. SMIA-2 under submerged culture using pectin and corn steep liquor. Cienc. Technol. Aliment. Campinas 31(1):204-208.
Amenaghawon, A.N., Okieimen, C.O., & Ogbeide, S.E. (2014). Modeling and statistical optimization of dilute acid hydrolysis of eucalyptus wood chips using response surface methodology.The Pacific Journal of Science and Technology, 15, 1, 245-256.
AOAC (1984). Official methods of analysis. Association of Official Analytical Chemists. Washington, DC.

170
Arslan, Y., & Saraçoglu, N.E. (2010). Effects of pretreatment methods for hazelnut shell hydrolysate fermentation with Pichia stipitis to ethanol. Bioresource Technology, 101, 8664–8670.
Arslan, Y., Takac, S., & Saraçoglu, N.E. (2011). Kinetic study of hemicellulosic sugar production from hazelnut shells. Chemical Engineering Journal, 185-186, 23-28.
Aswathy, U.S., Sukumaran, R.K., Devi, G.L., Rajasree, K.P., Singhania, R.R., & Pandey, A. (2010). Bioethanol from water hyacinth biomass: An evaluation of enzymatic saccharification strategy. Bioresource Technology, 101, 925-930.
Baek, S.C., & Kwon, Y.J. (2007). Optimization of the pretreatment of rice straw hemicellulosic hydrolyzates for microbial production of xylitol. Biotechnology and Bioprocess Engineering, 12, 404–419.
Bailey, M.J., Biely, P., & Pountanen, K. (1992). Interlaboratory testing of methods for assay xylanase activity. Biochimica et Biophisica Acta, 117, 252-270.
Bas ̧ D., & Boyaci, İ.H. (2007). Modeling and optimization II: Comparison of estimation capabilities of response surface methodology with artificial neural networks in a biochemical reaction. Journal of Food Engineering, 78, 846-854.
Bas, D., Dudak, F. C., & Boyaci, I. H. (2007). Modeling and optimization III: Reaction rate estimation using artificial neural network (ANN) without a kinetic mode. Journal of Food Engineering, 79, 622-628.
Bayoumi, R.A., Yassin, H.M., Swelim, M.A., & Abdel-All, E.Z. (2008). Production of bacterial pectinases from agro-industrial wastes under solid state fermentation conditions. Journal of Applied Sciences Research, 4(12), 1708-1721.
Ben-Ghedalia, D., & Miron, J. (1981). The effect of combined chemical and enzyme treatments on the saccharification and in vitro digestion rate of wheat straw. Biotechnology and Bioengineering, 23, 823–831.
Ben-Ghedalia, D., & Shefet, G. (1983). Chemical treatments for increasing the digestibility of cotton straw: 2. Effect of ozone and sodium hydroxide treatments on the digestibility of cell-wall monosaccharides. Journal of Agricultural Science, 100, 401-406.
Bohdziewiez, J., & Bodzek, M. (1994). Ultrafiltration preparation of pectinolytic enzymes from citric acid fermentation broth. Process Biochemistry, 29, 99-107.

171
Box, G., & Behnken, D. (1960). Some new three level designs for the study of quantitative variables. Technometrics, 2, 455-475.
Brawman, J.W. (1981). Application of enzymes in fruit juice technology. In: Birch GG, Blakcorough N, Barker JK, editors. Enzymes and food processing. London: Applied Science, 247-261.
Browning, B.L. (1967). In Methods of Wood Chemistry: Determination of Sugars, New York: Inter-Science, 589–590.
Brodeur, G., Yau, E., Badal, K., Collier, J., Ramachandran, K.B., & Ramakrishnan, S. (2011). Chemical and physicochemical pretreatment of lignocellulosic biomass: a review. Enzyme Reseach, doi:10.4061/2011/787532.
Cao, G., Ren, N., Wang, A., Lee, D.J., Guo, W., Liu, B., Feng, Y., & Zhao, Q. (2009). Acid hydrolysis of corn stover for biohydrogen production using Thermoanaerobacterium thermosaccharolyticu W16. International Journal of Hydrogen Energy, 34, 7182–7188.
Castilho, L.R., Medronho, R.A., & Alves, T.L.M. (2000). Production and extraction of pectinases obtained by solid state fermentation of agroindustrial residues with Aspergillus niger. Bioresource Technology, 71, 45-50
Chang, V.S., & Holtzapple, M.T. (2000). Fundamental factors affecting biomass enzymatic reactivity. Applied Biochemistry and Biotechnology. - Part A Enzyme Engineering and Biotechnology, 84-86, 5-37.
Charley, V.L.S. (1969). Advances in food processing using pectic and other enzymes. Chemistry and Industry, 20, 635-641.
Chaudhri, A., & Suneetha, V. (2012). Microbially derived pectinases: A review. Journal of Pharmacy and Biological Sciences, 2 (2), 1-5.
Chen, Y., Stevens, M.A., Zhu, Y., Holmes, J., & Xu, H. (2013). Understanding of alkaline pretreatment parameters for corn stover enzymatic saccharification. Biotechnology for Biofuels, 6, 8, 1-10.
Chesson, A., & Codner, R.C. (1978). Maceration of vegetable by a strain of Bacillus subtilis. Journal of Applied Bacteriology, 45, 219-230.
Christian, V., Shrivastava, R., Shukla, D., Modi, H.A., & Vyas, B.R. (2005). Degradation of xenobiotic compounds by lignin-degrading white-rot fungi: enzymology and mechanisms involved. Indian Journal of Experimental Biology, 43(4), 301-12.

172
Clausen, E.C., & Gaddy, J.L. (1993). Concentrated sulfuric acid process for lignocellulosic materials to sugars. United States Patent, 5, 188-673.
Combo, A.M.M., Aguedo, M., Goffin, D., Wathelet, B., & Paquot, M. (2012). Enzymatic production of pectic oligosachharides from polygalacturonic acid with commercial pectinase preparations. Food and Bioproducts Processing, 90, 588-596.
Corredor, D.Y. (2008). Pretreatment and enzymatic hydrolysis of lignocellulosic biomass. PhD thesis, Kansas State University, USA.
da Costa Sousa, L., Chundawat, S.P., Balan, V., & Dale, B.E. (2009). Cradle-to-grave assessment of existing lignocellulose pretreatment technologies. Current Opinion in Biotechnology, 20(3), 339-47.
Dave, B.A., & Vaughn, R.H. (1971). Purification and properties of a polygalacturonic acid trans-eliminase produced by Bacillus pumilus. Journal of Bacteriology, 108(1), 166-174.
Delgenes, J.P., Penaud, V., & Moletta, R. (2002). Pretreatments for the enhancement of anaerobic digestion of solid wastes. Biomethanization of the organic fraction of municipal solid wastes: IWA Publishing. p 201-228.
Demir, N., Acar, J., Sarioglu, K., & Mutlu, M. (2000). Use of commercial pectinase in fruit juice industry—part 3: immobilized pectinase for mash treatment. Journal of Food Engineering, 47, 4, 275–280.
Demir, H., Gögüş, N., Tarı, C., Heerd, D., & Lahore, M.F. (2012). Optimization of the process parameters for the utilization of orange peel to produce polygalacturonzase by solid-state fermentation from an Aspergillus sojae mutant strain. Turkish Journal of Biology, 36, 394-404.
Demirbaş¸ E., Kobya, M., Oncel, S., & Sencan, S. (2002). Removal of Ni(II) from aqueous solution by adsorption onto hazelnut shell activated carbon: equilibrium studies. Bioresource Technology, 84, 291–293.
Demirbaş, A. (2005). Bioethanol from cellulosic materials: A renewable motor fuel from biomass. Energy Sources, 27, 327-337.
Demirbaş, A. (2006). Furfural production from fruit shells by acid catalyzed hydrolysis. Energy Source, 28, 157–165.
Djekrif-Dakhmouche, S., Gheribi-Aoulmi, Z., Meraihi, Z., & Bennamoun, L. (2006). Application of a statistical design to the optimization of culture medium for

173
a amylase production by Aspergillus niger ATCC 16404 grown on orange waste powder. Journal of Food Engineering, 73, 190–197.
Eckert, R.C., & Singh, R.P. (1975). Ozone reactions in relation to the aromatic structure of lignin: a review of selected topics in ozone chemistry. In: Gratzl JS, Nakano J, Singh RP, editors. Chemsitry of delignification with oxygen, ozone and peroxides, Raleigh, NC. Uni publishers.
Eisenhuber, K., Krennhuber, K., Steinmüller, V., & Jager, A. (2013). Comparison of different pretreatment methods for separating hemicellulose from straw during lignocellulose bioethanol production. Energy Procedia, 40, 172-181.
El-Sheekh, M.M., Ismail, A.S., El-Abd, M.A., Hegazy, E.M., El-Diwany, A.I. (2009). Effective technological pectinases by Aspergillus carneus NRC1 utilizing the Egyptian orange juice industry scraps. International Biodeterioration and Biodegradation, 63(1), 12-18.
Fengel, D., & Wegener, G. (1984). Wood, Chemistry, Ultrastructure, Reactions. De Gruyter, Berlin.
Ferrer, A., Requejo, A., Rodriguez, A., & Jimenez, L. (2013). Influence of temperature, time, liquid/solid ratio and sulphric acid concentration on the hydrolysis of palm empty fruit bunches. Bioresource Technology, 129, 506-511.
Fischbach, J., & Brasseur, K. (2012). Processing American and hybrid hazelnuts: A guide for hazelnut growers in the Upper-West. Upper-West Hazelnut Development Initiative, 1-21.
Fogarty, W.M., & Kelly, C.T. (1983). Pectic enzymes. In: Microbial enzymes and biotechnology, W.M. Fogarty, (Ed.), pp. 131-182, Applied Science Publishers, ISBN: 0853341850, London, England.
Galbe, M., & Zacchi, G. (2007). Pretreatment of lignocellulosic materials for efficient bioethanol production. Olsson L, editor. Berlin: Springer.
Galiotou-Panayotou, M.P.R., & Kapantai, M. (1993) Enhanced polygalacturonase production by Aspergillus niger NRRL-364 grown on supplemented citrus pectin. Letters in Applied Microbiology, 17, 145–148.
Garcia-Cubero, M.A., Gonzalez-Benito, G., Indacoechea, I., Coca, M., & Bolado, S. (2009). Effect of ozonolysis pretreatment on enzymatic digestibility of wheat and rye straw. Bioresource Technology, 100(4), 1608-1613.

174
Garcia-Cubero, M.T., Coca, M., Bolado, S., & Gonzalez-Benito, G. (2010). Chemical oxidation with ozone as pre-treatment of lignocellulosic materials for bioethanol production. Chemical Engineering Transactions, 21.
Garcia-Cubero, M.T., palacin, L.G., Gonzalez-benito, G., Bolado, S., Lucaz, S., & Coca, M. (2012). An analysis of lignin removal in a fixed bed reactor by reaction of cereal straws with ozone. Bioresource Technology, 107, 229-234.
Ghose, T.K. (1987). Meausrement of cellulase activities. Pure and Applied Chemistry, 59, 257-268.
Goh, C.S., Lee, K.T., & Bhatia, S. (2010). Hot compressed water pretreatment of oil palm fronds to enhance glucose recovery for production of second generation bio-ethanol. Bioresource Technology,101, 7362-7367.
Gummadi, S.N., & Panda, T. (2003). Purification and biochemical properties of microbial pectinases- a review. Process Biochemistry, 38, 987-996.
Gupta, S., Kapoor, M., Sharma, K.K., Nair, L.M., & Kuhad, R.C. (2008). Production and recovery of an alkaline exo-polygalacturonase from Bacillus subtilis RCK under solid-state fermentation using statistical approach. Bioresource Technology, 99, 937-945.
Haaland, P.D. (1989). Statistical problem solving. In: Experimental design in biotechnology. New York: Marcel Dekker Inc. 1–18.
Hara, A. & Radin, N.S. (1978). Lipid extraction of tissues with a low toxicity solvent. Analytical Biochemistry, 90, 420-426.
Hatakka, A.I., (1983). Pretreatment of wheat straw by white-rot fungi for enzymic saccharification of cellulose. European Journal of Applied Microbiology and Biotechnology, 18 (6), 350-357.
Hendriks, A.T.W.M., & Zeeman, G. (2009). Pretreatments to enhance the digestibility of lignocellulosic biomass. Bioresource Technology, 100, 10-18.
Hu, G., Heitmann, J., & Roja, O. (2008). Feedstock pretreatment strategies for producing ethanol from wood, bark, and forest residues. BioResources, 3(1), 270-294.
Hu, R., Lin, L., Liu, T., & Liu, S. (2010). Dilute sulfuric acid hydrolysis of sugar maple wood extract at atmospheric pressure. Bioresource Technology, 101(10), 3586-3594.

175
Idrees, M., Adnan, A., Bokhari, S.A., & Qureshi, F.A. (2014). Production of fermentable sugars by combined chemo-enzymatic hydrolysis of cellulosic material for bioethanol production. Brazilian Journal of Chemical Engineering, 31, 2, 355-363.
Jayani, R.S., Saxena, S., & Gupta, R. (2005). Microbial pectinolytic enzymes: A review. Process Biochemistry, 40, 2931-2944.
Jayani, R.S., Shukla, S.K., & Gupta, R. (2010). Screening of bacterial strains for polygalacturonase activity: Its production by Bacillus sphaericus (MTCC 7542). Enzyme Research, DOI: 10.4061/2010/306785.
Jorgensen, H., Kristensen, J.B., & Felby, C. (2007). Enzymatic conversion of lignocellulose into fermentable sugars: challenges and opportunities. Biofuels, Bioproducts and Biorefining, 1, 119-134.
Joshi, M., Nerurkar, M., & Adivarekar, R. (2013). Use of citrus limetta peels for pectinase production by marine Bacillus subtilis. Innovative Romanian Food Biotechnology, 12, 75-83.
Joslyn, N.A., Mist, S., & Lambart, E. (1952). Clarification of apple juice by fungal PG preparations. Food Technology, 6, 133-139.
Kang, L. (2011). Bioconversion of pulp and paper mills sludge and prehydrolysate stream into ethanol and cellulose enzyme. PhD thesis, Auburn University, Alabama, USA.
Kapoor, M., Beg, Q.K., Bhushan, B., Dadhich, K.S., & Hoondal, G.S. (2000). Production and partial purification and characterization of a thermo-alkali stable polygalacturonase from Bacillus sp. MG-cp-2. Process. Biochemistry, 36, 467-473.
Kapoor M., & Kuhad R.C. (2002). Improved polygalacturonase production from Bacillus sp. MG-cp-2 under submerged (SmF) and solid state (SSF) fermentation. Letters in Applied Microbiology, 34, 317-322.
Karunanithy, C., & Muthukumarappan, K. (2011). Optimization of alkali soaking and extrusion pretreatment of prairie cord grass for maximum sugar recovery by enzymatic hydrolysis. Biochemical Engineering Journal, 54, 71-82.
Kashaninejad, M., Dehghani, A., & Kashiri, M. (2009). Modeling of wheat soaking using two artificial neural networks (MLP and RBF). Journal of Food Engineering, 91, 602-607.

176
Kashyap D.R., Chandra S., Kaul A., & Tewari R. (2000). Production, purification and characterization of pectinase from a Bacillus sp. DT7. World Journal of Microbiology and Biotechnology, 16, 277-282.
Kashyap, D.R., Vohra, P.K., Chopra, S., & Tewari, R. (2001). Applications of pectinases in the commercial sector: a review. Bioresource Technology, 77, 215-227.
Kashyap, D.R., Soni, S.K., & Tewari, R. (2003). Enhanced production of pectinase by Bacillus sp. DT7 using solid state fermentation. Bioresource Technology, 88, 251-254.
Kaur, G., Kumar, S., & Satyanarayana, T. (2004). Production, characterization and application of a thermostable polygalacturonase of a thermophilic mould Sporotrichum thermophile Apinis. Bioresource Technology, 94, 3, 239-243.
Kaur, U., Oberoi, H.S., Bhargav, V.K., Sharma-Shivappa, R., & Dhaliwal, S.S. (2012). Ethanol production from alkali- and ozone-treated cotton stalks using thermotolerant Pichia kudriavzevii HOP-1. Industrial Crops and Products, 37, 219–226.
Kaushik, R., Saran, S., Isar, J., & Saxena, R.K. (2006). Statistical optimization of medium components and growth conditions by response surface methodology to enhance lipase production by Aspergillus carneus. Journal of Molecular Catalysis B: Enzymatic. 40, 121–126.
Keshwani, D.R. (2009). Microwave pretreatment of switchgrass fr bioethanol production. PhD thesis in Biological and Agricultural Engineering, North Carolina University, Raleigh, USA.
Keshwani, D.R., & Cheng, J.J. (2009). Switchgrass for bioethanol and other value-added applications: a review. Bioresource Technology, 100(4), 1515-23.
Khairnar Y., Krishna V., Boraste A., Gupta N., Trivedi S., Patil P., Gupta G., Gupta M., Jhadav A., Mujapara A., Joshi B., & Mishra D. (2009). Study of pectinase production in submerged fermentation using different strains of Aspergillus niger. International Journal of Microbiology Research, 1 (2), 13-17.
Kilara, A. (1982). Enzymes and their uses in the processed apple industry: A review. Process Biochemistry, 23, 35–41.
Klinke, H.B., Thomsen, A.B., & Ahring, B.K. (2004). Inhibition of ethanol-producing yeast and bacteria by degradation products produced during pretreatment of biomass. Applied Microbiology and Biotechnology, 66, 10–26.

177
Kluskens, L.D., van Alebeek, G.J.W.M., Voragen, A.G.J., De Vos, W.M., Van Der Oost, J. (2003). Molecular and biochemical characterization of the thermo active family 1 pectate lysase from the hyperthermophilic bacterium Thermotoga maritima. Biochemical Journal, 370, 651–659.
Kobayashi, T., Koike, K., Yoshimatsu, T., Higaki, N., Suzumatsu, A., Ozawa, T., Hatada, Y., & Ito, S. (1999). Purification and properties of a low-molecular-weight, high-alkaline pectate lyase from an alkaliphilic strain of Bacillus. Bioscience, Biotechnology and Biochemistry, 63 (1), 65–72.
Koksal, A.I., Artik, N., Simsek, A., & Gunes, N. (2006). Nutrient composition of hazelnut (Corylus avellana L.) varieties cultivated in Turkey. Food Chemistry, 99, 509-515.
Kumar, P., Barrett, D.M., Delwiche, M.J., & Stroeve, P. (2009). Methods for pretreatment of lignocellulosic biomass for efficient hydrolysis and biofuel production. Industrial and Engineering Chemistry Research. 48:3713–3729
Kumar, R., & Wyman, C.E. (2009). Does change in accessibility with conversion depend on both the substrate and pretreatment technology? Bioresource Technology, 100(18), 4193-4202.
Larsson, S., Reimann, A., Nilverbrant, N., & Jonsson, L. (1999). Comparison of different methods for the detoxification of lignocellulose hydrolyzates of spruce. Applied Biochemistry and Biotechnology, 77-79, 91-103.
Lavarack, B.P., Griffin, G.J., & Rodman, D. (2002). The acid hydrolysis of sugarcane bagasse hemicellulose to produce xylose, arabinose, glucose and other products. Biomass Bioenergy, 23, 367-380.
Lee, W.C., Yusof, S., Hamid, N.S.A., & Baharin, B.S. (2006). Optimizing conditions for enzymatic clarification of banana juice using response surface methodology (RSM). Journal of Food Engineering, 73, 55-63.
Lee, J. M., Jameel, H., & Venditti, R. A. (2010). Effect of ozone and autohydrolysis pretreatments on enzymatic digestibility of coastal Bermuda grass. Bioresources, 5 (2), 1084–1101.
Li, Z., Bai, Z., Zhang, B., Xie, H., Hu, O., Hao, C., Xue, W., & Zhang, H. (2005). Newly isolated Bacillus gibsonii S-2 capable of using sugar beet pulp for alkaline pectinase production. World Journal of Microbiology Biotechnology, 21, 1483-1486.
178
Lowry, O.H., Rosenbrough, N.J., Farr, A.L., & Randall, R.J. (1951). Protein measurement with the Folin Phenol Ragent. Journal of Biological Chemistry, 193, 265-275.
Lynd, L.R. (1996). Overview and evaluation of fuel ethanol from cellulosic biomass: technology, economics, the environment, policy. Annual Review of energy and the Environment, 21, 403-465.
Lynd, L.R., Weimer, P.J., van Zyl, W.H., & Pretorious, I.S. (1999). Microbial cellulose utilization: Fundamentals and biotechnology. Microbiology and Molecular Biology Reviews, 66(3), 506-577.
Mansilla, H.D., Baeza, J., Urzúa, S., Maturana, G.,. Villaseñor, J., & Durán, N. (1998). Acid-catalysed hydrolysis of rice hull: Evaluation of furfural production. Bioresource Technology, 66(3), 189-193.
Martins, E.S., Silva, D., da Silva, R., Leite, R.S., & Gomes, E. (2007). Purification and characterization of polygalacturonase produced by thermophilic Thermoascus aurantiacus CBMAI-756 in submerged fermentation. Antonie Van Leeuwenhoek 91, 291–299.
Mcintosh, S., & Vancov, T. (2011). Optimization of dilute alkaline pretreatment for enzymatic saccharification of wheat straw. Biomass and Bioenergy, 35, 3094-3103.
McKillip, W.J., & Collin, G. (2002). Ullmann's Encyclopedia of Industrial Chemistry, Sixth edition, Weinheim, Germany, Wiley-VCH.
McMillan, J.D. (1994). Pretreatment of lignocellulosic biomass, In: Himmel, M. E., Baker, J.O., and Overend, R.P. (Eds.), Enzymatic Conversion of Biomass for Fuels Production, American Chemical Society, Washington, DC, pp. 292-324.
Mehdizadeh, B., & Movagharnejad, K. (2011). A comparison between neural network method and semi empirical equations to predict the solubility of different compounds in supercritical carbon dioxide. Fluid Phase Equilibria, 303, 40-44.
Miller, G.L. (1959). Use of dinitrosalysilic acid reagent for determination of reducing sugar. Analytical Chemistry, 31 (3), 426-428.
Mingzhi, H., Ma, Y., Jinquan, W., & Yan, W. (2009). Simulation of a paper mill wastewater treatment using a fuzzy neural network. Journal Expert Systems with Applications, 36 (3), 5064-5070.

179
Mojsov, K. (2010). Experimental investigations of submerged fermentation and synthesis of pectinolytic enzymes by Aspergillus niger: Effect of inoculum size and age of spores. Applied Technologies and Innovations, 2(2), 40-46.
Moshe, K., & Reese, E.T. (1967). Production of glucose by enzymatic hydrolysis of cellulose. American Society of Microbiology, 16, 419-420.
Mosier, N.S., Ladisch, C.M. & Ladich, M.R. (2002). Characterization of acid catalytic domains for cellulose hydrolysis and glucose degradation. Biotechnology and Bioengineering. 6(79), 610-618.
Mosier, N., Wyman, C., & Dale, B. (2005). Features of promising technologies for pretreatment of lignocellulosic biomass. Bioresource Technology, 96 (6), 673–686.
Mouta, R.O., Chandel, A.K., Rodrigues, R.C.L.B., Silva, M.B., Rocha, G.J.M., & Silva, S.S. (2011). Statistical optimization of sugarcane leaves hydrolysis into simple sugars by dilute sulfuric acid catalyzed process. Sugar Tech. doi:10.1007/s12355-011-0116-y
Moyo, S., Gashe, B.A., Collison, E.K., & Mpuchane, S. (2003). Optimizing growth conditions for the pectinolytic activity of Kluyveromyces wickerhamii by using response surface methodology. International Journal of Food Microbiology, 15, 87-100.
Mueller, M. (2009). Fermentation of xylose and xylans by Kluveromyces marxianus IMB strains. Stillwater: Oklahoma State University.
Murthy, M.S.R.C., Swaminathan, T., Rakshit, S.K., & Kosugi, Y. (2000). Statistical optimization of lipase catalyzed hydrolysis of methyloleate by response surface methodology. Bioprocess Engineering, 22, 35-39.
Murthy, P.S., & Naidu, M.M. (2011). Improvement of robusta coffee fermentation with microbial enzymes. European Journal of Applied Sciences, 3, 130-139.
Mukesh Kumar, D.J., Saranya, G.M., Suresh, K., Andal Priyadharshini, D., Rajakumar, R., & Kalaichelvan, P.T. (2012). Production and Optimization of Pectinase from Bacillus sp. MFW7 using Cassava Waste. Asian Journal of Plant Science and Research, 2 (3), 369-375.
Nadaroglu, H., Taşkın, E., Adıgüzel, A., Güllüce, M., & Demir, N. (2010). Production of a novel pectin lyase from Bacillus pumilus (P9), purification and characterization and fruit juice application. Romanian Biotechnological Letters, 15(2), 5167-5176.

180
Nagel, C.W., & Vaughn, R.H. (1961). The characteristic of a polygalacturonase produced by Bacillus polymyxa. Archives of Biochemistry and Biophysics, 93, 344-352.
Najafian, L., Ghodsvali, A., Khodaparast, M.H.H., & Diosady, L.L. (2009). Aqueous extraction of virgin olive oil using industrial enzymes. Food Research International, 42, 171-175.
Neely, W.C. (1984). Factors affecting the pretreatment of biomass with gaseous ozone. Biotechnology and Bioengineering, 26 (1), 59–65.
Ohtani, K. (2000). Bootstrapping R2 and adjusted R2 in regression analysis. Economic Modelling, 17, 473-483.
Palmarola-Adrados, B., Chotĕborská, P., Galbe, M., & Zacchi, G. (2005). Ethanol production from non-starch carbohydrates. Bioresource Technology, 96, 843-850.
Palmowski, L., & Muller, J. (2000). Influence of the size reduction of organic waste on their anaerobic digestion. Water Science and Technology, 41(3):155-162.
Palmqvist, E. & Hahn-Hagerdal, B. (2000). Fermentation of lignocellulosic hydrolysates.I: inhibition and detoxification: review. Bioresource Technology, 74, 17–24.
Panneerselvam, A., Sharma-Shivappa, R.R., Kolar, P., Ranney, T., Peretti, S. (2013). Potential of ozonolysis as a pretreatment for energy grasses. Bioresource Technology, 148, 242–248.
Patil, S.R., & Dayanand, A. (2006). Optimization of process for the production of fungal pectinases from deseeded sunflower head in submerged and solid-state conditions. Bioresource Technology, 97, 2340-2344.
Pedrolli, D.B., Monteiro, A.C., Gomes, E., & Carmona, E.C. (2009). Pectin and pectinases: production, characterization and industrial application of microbial pectinolytic enzymes. The Open Biotechnology Journal, 3, 9-18.
Pericin, D.M., Madarev, S.Z., Radulovic, L.M., & Skrinjar, M. (2007). Production of exo-pectinase by Penicillium roqueorti using pumkin oil cake. Proceedings of the National Academy of Sciences, 113, 313-320.
Pilar, B., Carmen, S., & TomaËs, G. (1999). Villa Production of pectic enzymes in yeasts FEMS. Microbiology Letters, 175, 1-9.

181
Rahman, S.H.A., Choudhury, J.P., Ahmad, A.L., & Kamaruddin, A.H. (2007). Optimization studies on acid hydrolysis of oil palm empty fruit bunch fiber for production of xylose. Bioresource Technology, 98(3), 554–559.
Rangarajan, V., Rajasekharan, M., Ravichandran, R., Sriganesh, K., & Vaitheeswaran, V. (2010). Pectinase production from orange peel extract and dried orange peel solid as substrates using Aspergillus niger. International Journal of Biotechnology & Biochemistry, 6, 445-453.
Redding, A. (2009). An assessment of dilute acid pretreatment of coastal bermudagrass for bioethanol production. MSc thesis, North Carolina State University, Raleigh, USA.
Reed, G. (1966). Enzymes in Food Processing. New York, Academic Press. p. 311.
Rehman, H.U., Qader, S.A., & Aman, A. (2012). Polygalacturonase: production of pectin depolymerising enzyme from Bacillus licheniformis KIBGE IB-21. Carbohydrate Polymers, 90, 387-391.
Roberto, I.C., Mussatto, S.I., & Rodrigues, R.C.L.B. (2003). Dilute acid hydrolysis for optimization of xylose recovery from rice straw in a semi-pilot reactor. Industrial Crops and Products, 17, 171–176.
Rumelhart, D.E., Hintont, G.E., & Williams, R.J. (1986). Learning representations by back-propagating errors. Nature, 323, 533-536.
Saad, N., Briand, M., Gardarin, C., Briand, Y., & Michaud, P. (2007). Production, purification and characterization of an endopolygalacturonase from Mucor rouxii NRRL 1894. Enzyme and Microbial Technology, 41(6-7), 800-805.
Sabajanes, M.M., Yanez, R., Alonso, J.L., & Parajo, J.C. (2012). Pectic oligosaccharides production from orange peel waste by enzymatic hydrolysis. International Journal of Food Science and Technology, 47, 747-754.
Saha, B.C., & Bothast, R.J. (1999). Pretreatment and enzymatic saccharification of corn fiber. Applied Biochemistry and Biotechnology, 76, 65-77.
Saha, B.C. (2003). Hemicelluloses bioconversion. Journal of Industrial Microbiology and Biotechnology, 30, 279-291.
Sandri, I.G., Fontana, R.C., Barfknecht, D.M., & Da Silveira, M.M. (2011). Clarification of fruit juices by fungal pectinases. LWT-Food Science and Technology, 44, 2217-2222.

182
Semenova, M. V., Grishutin, S. G., Gusakov, A. V., Okunev, O. N., & Sinitsyn, A. P. (2003). Isolation and properties of pectinases from the fungus Aspergillus japonicus. Biochemistry, 68(5), 559-569.
Sepúlveda-Huerta, E., Tellez-Luis, S.J., Bocanegra-García, V., Ramírez, J.A., & Vázquez, M. (2006). Production of detoxified sorghum straw hydrolysates for fermentative purposes. Journal of the Science of Food and Agricultural, 86, 2579–2586.
Sharma, D.C., & Satyanarayana, T. (2006). A marked enhancement in the production of a highly alkaline and thermostable pectinase by Bacillus pumilus dcsr1 in submerged fermentation by using statistical methods. Bioresource Technology, 97, 727-733.
Sharma, D.C., & Satyanarayana, T. (2012). Biotechnological potential of agro residues for economical production of thermoalkali-stable pectinase by Bacillus pumilus dcsr1 by solid-state fermentation and its efficacy in the treatment of ramie fibres. Enzyme Research, DOI: 10.1155/2012/281384.
Silva, J. A., Costa Neto, E.H., Adriano, W.S., Ferreira, A.L.O., & Gonçalves, L.R.B. (2008). Use of neural networks in the mathematical modelling of the enzymic synthesis of amoxicillin catalysed by penicillin G acylase immobilized in chitosan. World Journal of Microbiology and Biotechnology, 24, 1761-1767.
Sin, H.N., Yusof, S., Hamid, N.S.A., & Rahman, R.A. (2006). Optimization of enzymatic clarification of sapodilla juice using response surface methodology. Journal of Food Engineering, 73, 313-319.
Singh, A., Tatewar, D., Shastri, P., & Pandharipande, S. (2008). Application of ANN for prediction of cellulase and xylanase production by Trichoderma reesei under SSF condition. Indian Journal of Chemical Technology, 15, 53-58.
Sirikarn S, Apanee L, & Sujitra W. (2012). Effect of temperature and time on dilute acid pretreatment of corn cobs. Int J Chem Biol Eng, 6, 333-337.
Sivers, M.V. & Zacchi, G. (1995). A techno-economical comparison of three processes for the production of ethanol from pine. Bioresource Technology, 51, 43-52.
Sixta, H. (2006). Handbook of pulp, Wiley-VCH, Weinheim.
Smith, J.E., & Aidoo, K.E. (1988). Growth of fungi on solid substrates. Physiology of Industrial Fungi. Blackwell. Oxford, England, 249-269.

183
Soares, M.M.C.N., da Silva, R., & Gomes, E. (1999). Screening of bacterial strains for pectinolytic activity: Characterization of the polygalactoronase produced by Bacillus sp. Annual Review of Microbiology, 30 (4), 299-303.
Soares, M.M.C.N., Da Silva, R., Carmona, E.C., & Gomes, E. (2001). Pectinolytic enzyme production by Bacillus species and their potential application on juice extraction. World Journal of Microbiology & Biotechnology, 17, 79-82.
Spanos, G.A., & Wrolstad, R.E. (1990). Influence of processing and storage on the phenolic composition of Thompson seedless grape juice. Journal of Agricultural and Food Chemistry, 38, 1565-1571.
Sugimoto, T., Magara, K., & Hosoya, S. (2005). Ozone pretreatment for ethanol production using lignocellulosic materials. 10th Biomass—Asia workshop. Retrieved from http://www.biomass-asia-workshop.jp/ biomassws/01workshop/material/No.3-FFPRI.pdf on June 20, 2013.
Sun, Y., & Cheng, J. (2002). Hydrolysis of lignocellulosic material for ethanol production: a review. Bioresource Technology, 83, 1-11.
Suryawati, L., Wilkins, M., Bellmer, D., Huhnke, R., Manness, N., & Banat, I. (2009). Effect of hydrothermolysis process conditions on pretreated switchgrass compostion and ethanol yield by SSF with Kluveromyces marxianus IMB4. Process Biochemistry, 44(5), 540-545.
Swain, M.R., Kar, S., & Ray, R.C. (2009). Exo-polygalacturonase production by Bacillus subtilis CM5 in solid state fermentation using cassava bagasse. Brazilian Journal of Microbiology, 40, 636-648.
Swain, M.R., Ray, R.C. (2010). Production, Characterization and application of a thermostable exo-polygalacturonase by Bacillus subtilis CM5. Food Biotechnology, 24, 37-50.
Taherzadeh, M.J., & Karimi, K. (2007). Acid-based hydrolysis processes for ethanol from lignocellulosic materials: a review. Bioresource Technology, 2, 472–499.
Taherzadeh, M.J., & Karimi, K. (2008). Pretreatment of lignocellulosic wastes to improve ethanol and biogas production: a review. International Journal of Molecular Sciences, 9, 1621–1651.
TAPPI (1985). TAPPI Useful Method UM 250: Acid-soluble lignin in wood and pulp, TAPPI Useful Methods, TAPPI, Atlanta, GA.

184
TAPPI Test Method T222 om-88, (1989). Acid-Insoluble Lignin in Wood and Pulp, In Tappi Test Methods. Atlanta, GA: Technical Association of the Pulp and Paper Industry.
Travaini, R., Otero, M.D., Coca, M., Da-Silva, R., & Bolado, S. (2013). Sugarcane bagasse ozonolysis pretreatment: effect on enzymatic digestibility and inhibitory compound formation. Bioresource Technology, 133, 332–339.
Teymouri, F.,Laureano-Perez, L., Alizadeh, H., & Dale,B.E. (2005). Optimization of the ammonia fiber explosion (AFEX) treatment parameters for enzymatic hydrolysis of corn stover. Bioresource Technology, 96 (18), 2014-2018.
Torres, E.F., Aguilar, C., Esquivel, J.C.C & Gonzalez, G.V. (2005). Pectinases. In: Enzyme Technology, A. Pandey, C. Webb, C.R. Soccol, C. Larroche (Eds.), Enzyme Technology, Asiatech Publishers Inc., New Delhi, pp. 273–296.
Tutt, M., Kikas, T., & Olt, J. (2012). Comparison of different pretreatment methods on degredation of rye straw. 11th International Scientific Conference on Engineering for rural development, Jelgava.
Ustok, F.I., Tari, C., & Gogus, N. (2007). Solid-state production of polygalacturonase by Aspergillus sojae ATCC 20235. Journal of Biotechnology, 127(2),322-334.
Vavouraki, A.I., Volioti, V., & Kornaros, M.E. (2014). Optimization of thermo-chemcial pretreatment and enzymatic hydrolysis of kitchen wastes. Waste Management, 34, 167-173.
Vidal, P.F., & Molinier, J. (1988). Ozonolysis of lignin - Improvement of in vitro digestibility of poplar sawdust. Biomass, 16.
Vlasenko, E.Yu., Ding, H., Labavitch, J.M., & Shoemaker, S.P. (1997). Enzymatic hydrolysis of pretreated rice straw. Bioresource Technology, 59, 109-119.
Wang, Z., Keshwani, D., Redding, A., & Cheng, J. (2010). Sodium hydroxide pretreatment and enzymatic hydrolysis of coastal Bermuda grass. Bioresource Technology, 101(10), 3583-3585.
Woiciechowski, A.L., Nitsche, S., Pandey, A., & Ricardo, C. (2002). Acid and enzymatic hydrolysis to recover reducing sugar from cassava bagasse: an economic study. Brazillian Archives of Biology and Technology, 45 (3), 393-400.

185
Wyman, C.E., Dale, B.E., Elander, R.T., Holtzapple, M., Ladisch, M.R., & Lee, Y.Y. (2005). Coordinated development of leading biomass pretreatment technologies. Bioresource Technology, 96(18),1959-1966.
Xie, R., Tu, M., Wu, Y., & Adhikari, S. (2011). Improvement in HLPC separation of acetic acid and levulinic acid in the profiling of biomass hydrolysate. Bioresource Technology, 102, 4938-4942.
Xu, J., Cheng, J.J., Sharma-Shivappa, R.R., & Burns, J.C. (2010a). Lime pretreatment of switchgrass at mild temperatures for ethanol production. Bioresource Technology, 101(8), 2900-2903.
Xu, J., Cheng, J.J., Sharma-Shivappa, R.R. & Burns, J.C. (2010b). Sodium hydroxide pretreatment of switchgrass for ethanol production. Energy Fuels, 24, 2113-2119.
Yan, S., Yao, J., Yao, I., Zhi, Z., Chen, X., & Wu, J. (2012). Fed batch enzymatic saccharification of food waste improves the sugar concentration in the hydrolysates and eventually the ethanol fermentation by Saccharomyces cerevisiae H058. Brazillian Archives of Biology and Technology, 55(2), 183-192.
Yat, S. C., Berger, A., & Shonnard, D. R. (2008). Kinetic characterization for dilute sulfuric acid hydrolysis of timber varieties and switchgrass. Bioresource Technology, 99, 3855-3863.
Yu, Z., Jameel, H., Chang, H., & Park, S. (2011). The effect of delignification of forest biomass on enzymatic hydrolysis. Bioresource Technology, 102 (19), 9083-9089.
Zahangir, A.M., Suleyman A. M. & Rosmaziah, W. (2009). Statistical optimization of process conditions for cellulase production by liquid state bioconversion of domestic wastewater sludge. Bioresource Technology, 99, 4709-4716.
Zeni, J., Cence, K., Grando, C.E., Tiggermann, L., Colet, R., Lerin, L.A., Cansian, R.L., Toniazzo, G., De Oliveira, D., & Valduga, E. (2011). Screening of pectinase-producing microorganisms with polygalacturonase activity. Applied Biochemistry and Biotechnology, 163, 383-392.
Zhang, X. (2012). Pretreatment of Corn Stover for Sugar Production by Using the Combination of Alkaline Reagents and Switchgrass-Derived Black Liquor. Dissertation, North Carolina State University.

186

187
APPENDIX A
CHEMICALS, ENZYMES AND SUPPLIER INFORMATION
Chemicals/Enzymes Supplier
Acetic acid (glacial)
Merck
Acetone Merck
Bovine serum albumine Sigma-Aldrich
Cellic® Ctec2 Novozymes
Celluclast Sigma-Aldrich
Citrus Pectin Sigma-Aldrich
CuSO45H2O Merck
D-glucose Merck
dipotassium hydrogen phosphate (K2HPO4) Merck
DNS (3,5-dinitrosalicylic acid) Sigma-Aldrich
Ethanol Merck
Folin-ciocalteu Sigma-Aldrich
Furfural Sigma-Aldrich
Galacturonic acid monohydrate Sigma-Aldrich
Gallic acid Sigma-Aldrich
Glycerol
Hexane
Sigma-Aldrich
Merck
HMF Sigma-Aldrich
HTec2 Novozymes
Magnesium sulphate (MgSO4.7H2O) Merck
Nutrient Agar Merck
Nutrient Broth Merck
Oxygen (industrial grade) Airgas
Pectinex 100L Sigma-Aldrich

188
Phenol Sigma-Aldrich
Potassium di-hydrogen phosphate (KH2PO4) Merck
Potassium hydroxide Merck
Rochelle salt Merck
Sodium acetate Merck
Sodium bicarbonate Merck
Sodium carbonate Merck
Sodium chlorite Sigma-Aldrich
Sodium hydroxide Merck
Sodium phosphate dibasic Merck
Sodium phosphate monobasic Merck
Sodium sulfite Merck
Sulphuric acid Merck
Viscozyme L Sigma-Aldrich
Yeast extract Merck

189
APPENDIX B
COMPOSITION OF BUFFERS AND SOLUTIONS
Buffers and Solutions Composition of Acetate Buffer (pH 5)
Stock solutions:
A: 0.1 M solution of acetic acid
B: 0.1 M solution of sodium acetate
14.8 ml of solution A and 35.2 ml of solution B are mixed in 100 ml total volume
to adjust the pH 5.0.
Composition of Phosphate Buffer (pH 7)
Stock solutions:
A: 0.1 M solution of sodium phosphate monobasic
B: 0.1 M solution of sodium phosphate dibasic
39 ml of solution A and 61 ml of solution B are mixed in 200 ml total volume to
adjust the pH 7.0.
Composition of Carbonate-Bicarbonate Buffer (pH 9 &pH 11)
Stock solutions:
A: 0.1 M solution of sodium carbonate

190
B: 0.1 M solution of sodium bicarbonate
4 mL of solution A and 46 ml of solution B are mixed in 200 ml total volume to
adjust the pH 9.0.
42.5 mL of solution A and 7.5 ml of solution B are mixed in 200 ml total volume
to adjust the pH 11.0.
Composition of DNS Reagent:
Dinitrosalicylic Acid Reagent Solution, 1%
Dinitrosalicylic acid: 10 g
Phenol: 2 g
Sodium sulfite: 0.5 g
Sodium hydroxide: 10 g
Add water to: 1 liter
Potassium sodium tartrate solution, 40%

191
APPENDIX C
STANDARD CURVE FOR TOTAL REDUCING SUGAR
Glucose concentration (g/l)
0.0 0.2 0.4 0.6 0.8 1.0 1.2
Abs
orba
nce
@ 5
75 n
m
0.0
0.5
1.0
1.5
2.0
2.5
3.0
y=2.7235x-0.1641R2=0.9993
Figure C.1 The standard curve for DNS method
The total reducing sugar concentration was calculated as below:
The total reducing sugar concentration (g/L)= ((absorbance
+0.1641)/2.7235)*dilution

192

193
APPENDIX D
STANDARD CURVE FOR TOTAL PHENOLIC COMPOUNDS
Gallic acid concentration (mg/l)
0 20 40 60
Abs
orba
nce
(@ 7
65 n
m)
0.0
0.2
0.4
0.6
0.8
1.0
y=0.0153xR2=0.9994
Figure D.1 Gallic acid standard curve for determination of total phenol content

194

195
APPENDIX E
STANDARD CURVE FOR ENZYME ACTIVITY
D-galacturonic acid concentration (g/l)
0.0 0.1 0.2 0.3 0.4 0.5 0.6
Abs
orba
nce
(@ 5
75 n
m)
0.0
0.2
0.4
0.6
0.8
1.0
1.2
y=2.2718x-0.1544R2=0.99626
Figure E.1 D-Galacturonic acid standard curve for determination of enzyme
activity
U/L=Absorbance*F*(1/incubation time)*DF*(1/212.12)*Rv
F= a factor to convert absorbance to g of galacturonic acid
Incubation time= time of incubation of the enzyme with substrate (30 min)

196
1/212.12= conversion from grams of galacturonic acid to moles of galacturonic
acid
DF=Dilution factor
Rv =Amount of enzyme in the reaction mixture (ml)

197
APPENDIX F
GROWTH CURVE OF Bacillus spp.
Time (h)
0 10 20 30 40 50 60
Gro
wth
(OD
at 6
00 n
m)
0.0
0.1
0.2
0.3
0.4
0.5
0.6
0.7
Figure F.1 Growth curve of B.subtilis
Time (h)
0 10 20 30 40 50 60
Gro
wth
(OD
at 6
00 n
m)
0.0
0.2
0.4
0.6
0.8
1.0
1.2
Figure F.2 Growth curve of B.pumilus

198

199
APPENDIX G
LOWRY PROTEIN ASSAY
SOLUTIONS
Solution A (alkaline solution, for 500 ml)
2.8598 g NaOH
14.3084 g Na2CO3
Solution B (for 100 ml)
1.4232 g CuSO45H2O
Solution C (for 100 ml)
2.85299 g Na2Tartarate.2(H2O)
Lowry Solution (fresh:0.7 lm/sample)
Solution A+Solution B+Solution C with a ratio (v/v) of (100:1:1)
Folin Reagent (instant fresh, 0.1 ml/sample)
5 ml of 2N Folin Ciocalteu Phenol Reagent + 6 ml distilled water. This solution
light-sensitive. So it should be prepared at the last 5 min of the first sample
incybation and kept in an amber container.
BSA Standard: 1mg BSA in 1 ml of water

200
mg protein/l
50 100 150 200
A75
0nm
0.1
0.2
0.3
0.4
0.5
0.6
0.7
0.8
y=0.0027x+0.1273R2=0.9869
Figure G.1 BSA standard curve used in Lowry Method for the determination of total protein concentration

201
APPENDIX H
SAMPLE HPLC CHROMATOGRAM
Figure H.1 Chromatograms: A: furfural standard, B: After acid hydrolysis.
Figure H.2 Chromatograms: A: HMF and acetic acid, B: After acid hydrolysis

202

203
APPENDIX I
ANOVA RESULTS OF ALKALI PRETREATMENT
Table I.1 Revised ANOVA table of alkali pretreatment for solid recovery
Term Coefficient P Value
Regression 0.000
Linear 0.000
Square 0.000
Interaction 0.008
Lack-of-fit 0.447
Constant 74.0124 0.000
X1 (NaOH Conc.,%) -3.0790 0.000
X2 (SLR, %) 3.1163 0.000
X3 (Time, min) 4.5590 0.000
X12 4.1440 0.000
X2* X3 -2.0358 0.008

204
Table I.2 Revised ANOVA table of alkali pretreatment for lignin reduction
Term Coefficient P Value
Regression 0.000
Linear 0.000
Square 0.000
Interaction 0.837
Lack-of-fit 0.086
Constant 19.3611 0.000
X3 2.5204 0.000
X12 -2.0679 0.000
X22 -3.2957 0.000
X32 -6.8648 0.000

205
APPENDIX J
PARETO CHART OF PLACKETT BURMAN DESIGN
Figure J.1 Pareto chart of Plackett Burman Design for B.subtilis
MgSO4*7H2O (% w/v)
Inoculum volume (% v/v)
Pectin (% w/v)
Time (h)
pH
Yeast extract (% w/v)
K2HPO4 (% w/v)
Temperature
9876543210
Term
Standardized Effect
2.145

206

207
APPENDIX K
ANOVA RESULTS OF PECTINASE ACTIVITY
Table K.1 Revised ANOVA table of pectinase activity
Term Coefficient
Standard Error Coefficient T Value P Value
Constant 4.271 0.025 173.769 0.000 A -0.075 0.019 -3.960 0.000 B -0.233 0.019 -12.323 0.000 C 0.162 0.019 8.561 0.000 D 0.137 0.019 7.252 0.000 E 0.137 0.019 7.278 0.000 A*B 0.096 0.038 2.537 0.013 A*C -0.111 0.038 -2.941 0.004 A*D -0.093 0.038 -2.460 0.016 A*E -0.379 0.038 -10.031 0.000 B*C -0.296 0.038 -7.846 0.000 B*D -0.218 0.038 -5.763 0.000 B*E 0.218 0.038 5.765 0.000 C*D 0.478 0.038 12.674 0.000 D*E -0.381 0.038 -10.094 0.000 A2 -0.221 0.025 -8.990 0.000 B2 -0.231 0.025 -9.390 0.000 C2 -0.166 0.025 -6.755 0.000 D2 -0.258 0.025 -10.498 0.000

208

209
APPENDIX L
CONTOUR PLOTS OF PECTINASE PRODUCTION
Figure L.1 Contour plots showing the effect of a) [K2HPO4] and yeast extract
concentration, b) [K2HPO4] and time, c) [K2HPO4] and pH, d) [K2HPO4] and
temperature, e) yeast extract concentration and time, f) yeast extract concentration
and temperature, g) yeast extract concentration and pH, h) time and temperature, i)
time and pH and j) temperature and pH on pectinase production

210
Figure L.1 (continued)

211
APPENDIX M
ANOVA RESULTS OF CLARIFICATION OF CARROT JUICE
Table M.1 Revised ANOVA table of clarification of carrot juice
Term Coefficient P Value
Regression 0.000
Linear 0.000
Square 0.000
Interaction 0.000
Lack-of-fit 0.132
Constant 85.62 0.000
pH 3.66 0.000
Time (h) 5.34 0.000
Enzyme con. (%) 1.77 0.001
pH*pH 2.55 0.000
Time*Time 2.83 0.000
Enzyme conc.*pH 1.98 0.000
pH*Time -2.75 0.000

212
213
VITA
Surname, Name : Uzuner, Sibel
Nationality : Turkish
Date of Birth : 06/28/1981
Place of Birth : Istanbul
Marital Status : Single
Telephone : +90 312 210 5623
Fax : +90312 210 2767
e-mail : [email protected], [email protected]
Address : METU, Food Engineering Department, Office AZ-16, Lab: Bioprocess Laboratory 06800, Ankara, TURKEY
EDUCATION
2009-Present Middle East Technical University, Ankara /Turkey
PhD in Department of Food Engineering
2006-2008 Hacettepe University, Ankara /Turkey
MSc in Department of Food Engineering
2001-2005 Hacettepe University, Ankara /Turkey
BSc in Department of Food Engineering

214
ACADEMICAL EXPERIENCES
01/10/2014-07/10/2014
Visiting Scholar, Department of Agricultural and Biological Engineering, North Carolina State University, USA
09/2008-Present Research Assistant, Department of Food Engineering, Middle East Technical University, TURKEY
01/2008-09/2008 Research Assistant, Department of Food Engineering, Abant Izzet Baysal University, TURKEY
Publications Published within this PhD thesis are indicated as [bold]. A. Full paper published in International Journals (SCI expanded)
[1] Uzuner, S., & Cekmecelioglu, D. (2014). Hydrolysis of hazelnut shells as a carbon
source for bioprocessing applications and fermentation. International Journal of Food
Engineering, 10 (4), 799-808.
[2] Uzuner, S., & Cekmecelioglu, D. Enhanced pectinase production by
optimizing fermentation conditions of Bacillus subtilis growing on hazelnut shell
hydrolyzate. (under review in Journal of Molecular Catalysis. B, Enzymatic,
December, 2014).

215
B. Full paper published in Proceedings of Conferences
[1] Uzuner, S., & Cekmecelioglu, D. (2013). A Rapid screening approach to factors
affecting dilute acid hydrolysis of hazelnut shells. International proceedings of
chemical, Biological & Enviromental Enginnering, Vol 50. 30-33 (Cited by 1).
[2] Uzuner, S., & Acar, J. (2012). Hydrolytic properties of ellagic acid in commercial
pomegranate juices. World Academy of Science, Engineering and Technology, 67.
C. Full paper published in National Journals [1] Uzuner, S., Onsekizoglu, P., Acar, J. (2011). Effects of processing techniques and
cold storage on ellagic acid concentration and some quality parameters of
pomegranate juice. GIDA, 36 (5), 263-269 (Cited by 1).
D. Oral Presentations [1] Uzuner, S., & Cekmecelioglu, D. (2013). A Rapid screening approach to
factors affecting dilute acid hydrolysis of hazelnut shells. 4th International
Conference on Food Engineering and Biotechnology, 19-20 May, Copenhang,
DENMARK (Full paper).
[2] Uzuner, S., & Acar, J. (2012). Hydrolytic properties of ellagic acid in
commercial pomegranate juices. World Academy of Science, Engineering and
Technology (WASET), 25-26 July, Amsterdam, HOLLAND (Full paper).

216
E. Poster Presentations
[1] Uzuner, S., & Cekmecelioglu, D. (2014). Exo-polygalacturonase production
by B. subtilis and its use in clarification of carrot juice. Institute of Food
Technologists Annual Meeting (IFT), New Orleans, USA.
[2] Uzuner, S., & Cekmecelioglu, D. (2013). Response Surface Modelling to
Optimize Acid Concentration, Time and Temperature during Hydrolysis of
Hazelnut Shells. Poster presentation in Northeast Agricultural and Biological
Engineering Conference, 16-19 June, Pennsylvania, USA.
[3] Uzuner, S., & Acar, J. (2013). Effect of processing techniques on some quality
properties of pomegranate juice. Poster presentation in Eurofoodchem XVII, 7-10
May, Istanbul, TURKEY (Abstract).
[4] Uzuner, S., Onsekizoglu,P., Acar, J. (2011). Effects of cold storage on the total
phenolic content and antioxidant activity of pomegranate juice, Poster presentation
in 6th International CIGR Technical Symposium ‘Towards a sustainable food
chain’, 18-20 April, Nantes, FRANCE (Full paper).
F. Conference Papers (National)
[1] Uzuner, S., & Cekmecelioglu, D. (2013). Çeşitli bacillus türlerinden elde
edilen pektinaz enzimini etkileyen dış faktörler, 8.Gıda Mühendisliği Kongresi, 7-
9 Kasım, Ankara, Türkiye (Poster).
[2] Uysal, E.E., Uzuner, S., Evrendilek, G.A. (2008). Kırmızı şarapların atımlı
elektrik akımı ile proses edilmesi, 1.Ulusal Bağcılık ve Şarap Sempozyumu ve
Sergisi, 6-9 Kasım, Denizli (Poster).
217
PROJECT WORK
[1] Modelling and optimization of alkaline pectinase production using food waste,
METU Research Fund Project, BAP-2011-03-14-002, 2011-2012, Researcher.
[2] Modelling and optimization of alkaline pectinase production using food waste,
METU Research Fund Project, BAP-2011-03-14-002, 2012-2013, Researcher
(Additional support).
SCHOLARSHIPS/AWARDS
TUBITAK (The Scientific and Technological Research Council of Turkey),
International Research Fellowship Programme (2214/a) (January-July, 2014, 6
months)
TUBITAK (The Scientific and Technological Research Council of Turkey),
International Scientific Events Participation Support (May, 2013)