microbial food web dynamics along a soil chronosequence of a
TRANSCRIPT

Biogeosciences, 8, 3283–3294, 2011www.biogeosciences.net/8/3283/2011/doi:10.5194/bg-8-3283-2011© Author(s) 2011. CC Attribution 3.0 License.
Biogeosciences
Microbial food web dynamics along a soil chronosequence of aglacier forefield
J. Esperschutz1,2, A. Perez-de-Mora1,2, K. Schreiner2, G. Welzl2, F. Buegger3, J. Zeyer4, F. Hagedorn5, J. C. Munch1,3,and M. Schloter2
1Technical University Munich – Chair of Soil Ecology, Center of Life and Food Sciences Weihenstephan,Ingolstaedter Landstr. 1, 85764 Neuherberg, Germany2Helmholtz Zentrum Munchen, GmbH, German Research Center for Environmental Health, Research Unit of EnvironmentalGenomics, Ingolstaedter Landstr. 1, 85764 Neuherberg, Germany3Helmholtz Zentrum Munchen, GmbH, German Research Center for Environmental Health, Institute of Soil Ecology,Ingolstaedter Landstr. 1, 85764 Neuherberg, Germany4ETH Zurich, Institute of Biogeochemistry and Pollutant Dynamics, Universitatstrasse 16, 8092 Zurich, Switzerland5WSL Birmensdorf, Swiss Federal Institute for Forest, Snow and Landscape Research, Zurcherstrasse 111,8903 Birmensdorf, Switzerland
Received: 11 January 2011 – Published in Biogeosciences Discuss.: 10 February 2011Revised: 27 September 2011 – Accepted: 25 October 2011 – Published: 11 November 2011
Abstract. Microbial food webs are critical for efficient nu-trient turnover providing the basis for functional and stableecosystems. However, the successional development of suchmicrobial food webs and their role in “young” ecosystems isunclear. Due to a continuous glacier retreat since the middleof the 19th century, glacier forefields have expanded offer-ing an excellent opportunity to study food web dynamics insoils at different developmental stages. In the present study,litter degradation and the corresponding C fluxes into micro-bial communities were investigated along the forefield of theDamma glacier (Switzerland).13C-enriched litter of the pi-oneering plantLeucanthemopsis alpina(L.) Heywood wasincorporated into the soil at sites that have been free from icefor approximately 10, 60, 100 and more than 700 years. Thestructure and function of microbial communities were iden-tified by13C analysis of phospholipid fatty acids (PLFA) andphospholipid ether lipids (PLEL). Results showed increas-ing microbial diversity and biomass, and enhanced prolif-eration of bacterial groups as ecosystem development pro-gressed. Initially, litter decomposition proceeded faster at themore developed sites, but at the end of the experiment lossof litter mass was similar at all sites, once the more easily-degradable litter fraction was processed. As a result incorpo-ration of 13C into microbial biomass was more evident dur-ing the first weeks of litter decomposition.13C enrichments
Correspondence to:J. Esperschutz([email protected])
of both PLEL and PLFA biomarkers following litter incor-poration were observed at all sites, suggesting similar micro-bial foodwebs at all stages of soil development. Nonetheless,the contribution of bacteria, especially actinomycetes to lit-ter turnover became more pronounced as soil age increasedin detriment of archaea, fungi and protozoa, more prominentin recently deglaciated terrain.
1 Introduction
Glaciers are retreating in many mountainous areas of theworld due to global warming (Oerlemans, 2005) leaving be-hind new terrestrial habitats that are colonized by organisms(Bardgett et al., 2007). This is usually a gradual processthat results in a chronosequence. The latter can be definedas a set of soils that share a common community of organ-isms, climate, parent material and slope, but differ in regardwith the length of time that materials have been exposed toweathering and soil formation. As glaciers recede, parentmaterials become exposed and physical and biogeochemicalweathering convert primary minerals to secondary mineralsreleasing plant nutrient elements in soluble forms. Initially,the newly exposed surface typically has a high proportion ofrocks, lacks vegetation, is sandy and contains few nutrients(Schutte et al., 2009). As substrate colonization by plants andmicroorganisms occurs, organic material starts to accumu-late that can be further transformed; as a result complex food
Published by Copernicus Publications on behalf of the European Geosciences Union.

3284 J. Esperschutz et al.: Microbial food webs in a glacier forefield
webs develop and stratification into horizons of increasingphysical and chemical complexity becomes more prominent(Chapin et al., 1994; Bardgett et al., 2007). These featuresmake chronosequences ideal to study the initial and succes-sional stages of soil and ecosystem development as well asthe role of plant-microbe interactions at different time pointsof soil evolution.
Various studies in alpine regions have recently providednovel insights into microbial community dynamics and theirimportance in nutrient cycling in these environments. For in-stance, extensive colonization of granite surfaces could playa crucial role in initial soil formation and mineral dissolution(Frey et al., 2010), but also wind-driven transport of organicmaterial (insects, grasses, seeds) has to be considered (Jump-ponen et al., 1999). Although the first phase of soil devel-opment is dominated by geological and chemical processes,also biology plays a major role. For example, autotrophicfixation of C is also known to be an important process duringthe early stages of soil formation providing, in turn, nutrientsources for heterotrophic microorganisms (Walker and delMoral, 2003). Diazotrophic communities have been shownto be highly diverse following glacier retreat and could havea major role in N cycling in these ecosystems (Duc et al.,2009). Heterotrophic communities may also be highly abun-dant at initial soil stages (Tscherko et al., 2003), for in-stance, in response to ancient C released during glacier re-treat. Microbial communities in glacier forefields have alsobeen shown to respond to changes in ecosystem development(e.g. C and N content) and vegetation (Tscherko et al., 2005;Miniaci et al., 2007).
Pioneer plants can strongly alter parent materials and stim-ulate microbe-plant interactions through root morphology,rhizodeposition and litter production (Bardgett et al., 1999;Bardgett and Walker, 2004). The plant residues are trans-formed by microorganisms into humus and other new or-ganic substances enhancing the capacity of the soil to holdwater and nutrients. This positive feedback accelerates thedevelopment of more complex plant communities and mi-crobial food web structures (Edwards et al., 2006). Rhizode-posits of pioneering plants such asLeucanthemopsis alpina(L.) Heywood (L. alpina) have been shown to cause signif-icant shifts in the microbial community structure of rhizo-sphere soil compared to bulk soil at glacier forefields (Ed-wards et al., 2006). Due to their simple molecular struc-ture root exudates are readily assimilable by single microbes(Baudoin et al., 2003). By contrast, the transformation oflitter requires different specialized microorganisms acting asfunctional units to degrade substances like lignin or cellulose(Dilly et al., 2004; Fioretto et al., 2005). Although micro-bial interactions during litter degradation might be criticalfor ecosystem development in such scenarios (Bardgett andWalker, 2004), little is known about microbial dynamics ofthis process and the main players involved.
To improve our understanding of litter degradation and therole of microbial communities during the initial stages of soil
and ecosystem formation, a field incubation experiment us-ing 13C labelled plant litter ofL. alpina was carried out ina chronosequence in the Damma Glacier forefield (Switzer-land). L. alpina was selected because it was previously de-scribed as a pioneering plant in this area (Edwards et al.,2006; Miniaci et al., 2007). Microbes involved in litter degra-dation were identified via13C labelling of phospholipid fattyacids (PLFA) and phospholipid ether lipids (PLEL) (Gat-tinger et al., 2003; White et al., 1979; Zelles, 1999). Wehypothesized a different and more complex microbial com-munity structure as soil development progresses. In addition,we expected litter degradation rates to increase accordinglyalong the chronosequence as a result of better developed mi-crobial foodwebs. To test this, the microbial community pro-file, litter degradation and incorporation of13C-labelled lit-ter products by microbial communities were studied at fourdifferent locations of a chronosequence along a glacier fore-field (10, 60, 100 and 700 years free of ice) in bulk and litteramended soil.
2 Material and methods
2.1 Production of labelled plant litter
L. alpinawas sowed in plastic pans filled with prick out sub-strate in the greenhouse. Seeds were watered daily and incu-bated for 8–10 days at +20/+15◦C (day/night) and 75–85 %relative humidity until germination. Subsequently, plantswere transferred into plastic pots (4 plants per pot) of 12 cmin diameter, filled with a mixture of potting soil, expandedclay and silica sand (1:1:2, v/v/v). The pots were placed ina transparent EFTE-plastic tent (ethylene-tetrafluorethylene,film thickness 80 µm, Koch Membranen GmbH, 83253 Ger-many; volume∼7000 L) and subjected to a photoperiodicday length of 14 h (additional light by sodium vapour dis-charge lamps, SONT Agro 400, Philips, NL). Temperaturewas kept around +25/+18◦C (day/night) and relative hu-midity between 75–85 %. Irrigation was performed dailyvia irrigation tubes (500 mL/24 h/12 pots). Twice a week500 mL of Hoagland based fertilizer was added after irri-gation (Hoagland, 1920). The13C labelling was performedaccording to Esperschutz et al. (2009). In brief, CO2 con-centration in the tent atmosphere was reduced by plant pho-tosynthesis during the daytime. When the CO2 concen-tration in the tent dropped below 350 µmol mol1, enriched13CO2 (δ13C = + 170 ‰ vs. Vienna-Pee Dee Belemnite, AirLiquide, Dusseldorf, Germany) was added to the tent at-mosphere, until CO2 concentration reached 400 µmol mol1.Using this experimental setup, an enriched13C atmosphereof +90 to + 110 ‰ V-PDB was established inside the tent.At night time the tent atmosphere was pumped throughvials containing soda lime (sodium and calcium hydrox-ide) using a membrane pump (N 0135.3 AN.18, KNF Neu-berger, Freiburg, Germany) with a flow of 200 L min−1
Biogeosciences, 8, 3283–3294, 2011 www.biogeosciences.net/8/3283/2011/

J. Esperschutz et al.: Microbial food webs in a glacier forefield 3285
to reduce the CO2 produced by the plant dark respira-tion. The CO2 depleted air was pumped into the closedtent again. The system capacity ensured a stable CO2-concentration of 350 µmol mol−1 over night. The CO2 con-centration of the inner and outer tent atmosphere (day/night)was measured continuously with a photo acoustic CO2-controller (7MB1300, Siemens, Germany, calibration at 400to 600 µmol mol−1
± 2 %). The labelled plants were har-vested before flowering after a total growth time of 10 weeks.Leaves and stems were oven-dried (60◦C), homogenized andshredded (0.5–2.0 cm). The obtained labelled plant litter ofL. alpina (δ13C = 88.4± 1.6 ‰ vs. V-PDB) was used in thefollowing experiment.
2.2 Experimental setup
The experiment was carried out in the forefield of theDamma glacier, around 2100 m a.s.l. It is located in thecanton Uri in Switzerland (N46◦38.177′ E008◦27.677′) fac-ing north/east. The climate of the area is characterized bya short vegetation period (mid of June to end of Septem-ber) and approximately 2400 mm of rainfall per year. Ithas a total length of 2.35 km and a total area of 5.09 km2
(measured in 1973). Since the beginning of measurementsin 1921, the Damma glacier has retreated at an averagerate of 11 m per year. A detailed description of the re-search site has been done recently by the BigLink project(Bernasconi et al., 2008; Goransson et al., 2011). Basedon this site characteristics as well as systematic measure-ments by the Swiss Glacier monitoring network (http://glaciology.ethz.ch/messnetz/glaciers/damma.html), three lo-cations in the forefield of known exposure time since glacierretreat were chosen: (a) the first location near the glaciertongue (N46◦38.177′ E008◦27.677′) with an exposure timeof approximately 10 years (T1), (b) a second location (T2)below the 1992 moraine free of ice for nearly 60 years(N46◦38.177′ E008◦27.677′), and (c) a third location near the1928 moraine (N46◦38.177′ E008◦27.677′) estimated to beice-free for around 100 years (T3). Outside the forefield, afourth location (T4) (N46◦38.177′ E008◦27.677′) free fromice for at least 700 years, served as reference site (Egli et al.,2001).
According to Hammerli et al. (2007), the bedrock materialis Aargranite and surface conditions vary between fine flu-vial sands and coarse sandy areas. The soil at the differentlocations at the forefield can be classified as either Leptosolor Regosol with an average of 50 to 80 % of sand, 10 to 50 %of silt and around 5 % of clay (Dumig et al., 2011). Ac-cording to Dumig et al. (2011), the organic surface layer in-creased with increasing soil age, preceding the developmentof an Ah horizon. At T1 hardly any Ah horizon could be de-tected , whereas up to 4 cm Ah was found at T4. Soil pHranged from 4.3 to 5.6; the lowest value was detected at thereference site T4. Increasing concentrations of total C from0.11 % to 6.50 %and total N from 0.004 % to 0.442 % were
observed as ecosystem development progressed. The soilδ13C value was on average−27 ‰ vs. V-PDB at all locations(Table 1). The young site T1 was characterized by detachedvegetation patches ofAgrostis gigantea, Rumex scutatusandCerastium uniflorumresulting in less than 20 % vegetationcover (Goransson et al., 2011), By contrast, T2 was domi-nated byA. gigantea, Salix sp.andDeschampsia cespitosa(Goransson et al., 2011) showing partial to full vegetationcover (Sigler and Zeyer, 2002). T3 was fully covered by veg-etation (Towe et al., 2010) withRhododendron ferrugineum,A. gigantea and Festucarubraas dominant plant species.The reference site T4 was further dominated byAlnus viridis(Goransson et al., 2011).L. alpina was commonly detectedat all locations (Edwards et al., 2006; Miniaci et al., 2007;Towe et al., 2010) and therefore used to produce labelledplant litter in the present experiment.
Following snow melt in the beginning of June 2008, tubesmade of aluminium (20 cm in diameter and 14 cm high) wereinstalled 10 cm deep into the soil and replicated 5 times atevery location (T1–T4). Every replicate was composed ofthree independent tubes: two for soil analysis and one forlitterbag study. To avoid damaging of the vegetation cover,it was carefully removed prior to litter application. In thetubes for soil analysis, plant litter (5 g oven-dried) was ap-plied directly below the vegetation cover (2–4 cm depth) tominimize the influence of natural litter breakdown. Then,the vegetation cover was re-accommodated to ensure undis-turbed conditions during the experimental period. For thelitter bag experiment, two litter bags (mesh-size 40 µm) with2.5 g of oven-dried plant material per bag were placed at asimilar depth as with the direct litter application. Every tubewas protected with steel grids (mesh size 5 mm) against dis-turbances.
Eight and 12 weeks after litter application one litter bagand one of the tubes containing directly applied litter washarvested per location and replicate. Sampled litter bagswere immediately placed on ice for transportation and keptfrozen until further analysis. The tubes were completely re-moved from the soil, sealed and transported to the lab forfurther analysis. Control soil was sampled next to the tubesat similar soil depths at the beginning and at the end of theexperiment. The soil was immediately sieved at the forefieldand stored on ice for transportation.
2.3 Soil and litter bag analysis
Litter degradation rates were calculated based on the lossof litter material in the litter bags during incubation afterdrying at 60◦C. Soil samples from the tubes were takenfrom 2–5 cm depth and remaining litter material was care-fully removed. An aliquot of the soil samples was dried at60◦C whereas the rest was stored at−20◦C for phospholipidanalysis. The dried soil and plant litter material were ball-milled and subsequently analysed for total C,13C and N con-tent using an elemental analyzer (Eurovector, Milan, Italy)
www.biogeosciences.net/8/3283/2011/ Biogeosciences, 8, 3283–3294, 2011

3286 J. Esperschutz et al.: Microbial food webs in a glacier forefield
Table 1. Total C and N contents, pH-values andδ13C natural abundance in soil samples of the control treatments without litter application(means ofn = 5± standard deviation) at different locations (T1–T4).
ecosystem pH Ctotal Ntotal δ13Cdevelopment (CaCl2) [g/100 g] [g/100 g] [‰ V-PDB]
T1 – 10 years 5.6 (0.1) 0.11 (0.09) 0.004 (0.002)−26.96 (2.39)T2 – 60 years 4.8 (0.1) 0.78 (0.55) 0.048 (0.034)−26.50 (0.47)T3 – 100 years 5.1 (0.6) 0.62 (0.35) 0.040 (0.028)−27.51 (0.56)T4 > 700 years 4.3 (0.2) 6.50 (3.96) 0.442 (0.252)−26.72 (0.28)
coupled with an isotope ratio mass spectrometer (MAT 253,Thermo Electron, Bremen, Germany). Soil pH was analysedin 0.01 M CaCl2 extracts (DIN ISO 10390).
2.4 Phospholipid analyses
Phospholipid fatty acid (PLFA) and phospholipid etherlipid (PLEL) analyses were performed based on Zelles etal. (1995) and Gattinger et al. (2003). An aliquot of 50 g soil(dry weight) was extracted with 250 mL of methanol, 125 mLof chloroform and 50 mL of phosphate buffer (0.05 M, pH 7).After 2 h of horizontal shaking, 125 mL of water and 125 mLof chloroform were added to promote phase separation. Af-ter 24 h the water phase was removed and discarded. Thetotal lipid extract was separated into neutral lipids, glycol-ipids and phospholipids on a silica-bonded phase column(SPE-SI 2 g/12 mL; Bond Elut, Analytical Chem Interna-tional, CA, USA). An aliquot corresponding to 25 g of thephospholipid extract (dry weight) was further separated intosaturated (SATFA), monounsaturated (MUFA) and polyun-saturated (PUFA) fatty acids (see Zelles et al., 1995 for de-tails) to facilitate the identification of fatty acids as well asto obtain a good baseline separation of peaks for isotopiccalculations. According to Wuchter et al. (2003),13C en-riched PLEL isoprenoids indicate archaeal activity. There-fore the remaining extract of the phospholipids equivalent to25 g was therefore used for PLEL extraction as described byGattinger et al. (2003). In brief, after an acidic hydrolysis,ether core lipids were treated with hydriodic acid (57 %) for18 h at 100◦C to cleave the ether bonds. The resulting alkyliodides were reduced to the corresponding hydrocarbons us-ing 100 mg zinc powder in glacial acetic acid at 100◦C for18 h. The “isoprenoid-20” PLEL (phytane, i20) was used for(ubiquitous) archaeal abundance (Gattinger et al., 2003).
Prior to measurements, an internal standard (nonadecanoicacid methyl ester respectively myristic acid methyl ester) wasadded to calculate absolute amounts of fatty acids. PLFAwere analyzed as fatty acid methyl esters (FAME) on agas chromatograph/mass spectrometry system (5973MSDGC/MS Agilent Technologies, Palo Alto, USA). FAMEswere separated on a polar column (BPX70, SGE GmbH,Griesheim, Germany), 60 m× 0.25 mm× 0.25 µm, coated
with 70 % of cyanopropyl polysilphenylene-siloxane (seeEsperschutz et al., 2009 for details). PLEL were mea-sured using an non-polar column (HP 5 capillary column,50 m length, 0.2 mm internal diameter; coated with a cross-linked 5 % phenylmethyl rubber phase with a film thick-ness of 0.3 µm; see Gattinger et al., 2003 for details). Themass spectra of the individual FAME were identified bycomparison with established fatty acid libraries (Solvit, CH6500 – Luzern, Switzerland) using MSD Chemstation (Ver-sion D.02.00.237). The13C signature of the correspondingPLFA was determined by online coupling of the GC/MS sys-tem with an isotope ratio mass spectrometer (Delta Advan-tage, Thermo Electron Cooperation, Bremen, Germany), af-ter combustion (GC Combustion III, Thermo Electron Co-operation, Bremen, Germany). The actualδ13C ratio of theindividual FAME was corrected for the one C atom that wasadded during derivatisation (Abrajano et al., 1994). Fattyacids are presented by the number of C atoms followed by thenumber of double bonds. The positions of double bonds areindicated by “ω” and the number of the first double-bondedC atoms from theω end of the C chain. Anteiso and Iso-branched fatty acids are indicated by “ant” and “iso”, fol-lowed by the number of C atoms. Branched fatty acids inwhich the position of the double bond was unknown wereindicated by the prefix “br”. Methyl groups on the tenth Catom from the carboxyl end of the molecule were indicatedby “10ME”. Cyclopropane fatty acids were indicated by theprefix “cy”, while even-chained, saturated fatty acids wereabbreviated with the prefix “nor”. Since PLFA 18:3 was notdetected in any soil sample, removal of litter residues priorto extraction was successful and hence all PLFA were takeninto account for statistical analysis and interpretation of data.
2.5 Calculations
Stable isotope results were expressed inδ13C or atom percent(AP) according to Eqs. (1) and (2):
δ13C = [(Rsample/RV−PDB)−1]×1000) (1)
13CAP = (100×RV−PDB×(δ13C/1000+1))/ (2)
(1+RV−PDB×(δ13C/1000+1))
Biogeosciences, 8, 3283–3294, 2011 www.biogeosciences.net/8/3283/2011/
J. Esperschutz et al.: Microbial food webs in a glacier forefield 3287
RSampleand RV−PDB represent the13C to 12C ratios of sam-ple and international standard Vienna-Pee Dee Belemnite(VPDB = 0.0111802), respectively. The relative amountof litter-incorporated13C ( %13CLITTER) into the total lipidfraction was calculated according to Eq. (3),
%13CLITTER = CTx ×(13CTx −13CT0)×100/13Cadded) (3)
where the concentration of the individual C-fraction(ng g−1 DW) at timepoint Tx was multiplied by its13C en-richment in atom percent excess (difference between13C attimepoint Tx and13C enrichment at control) and expressedrelatively to the amount of added13C (ng g1 DW). The rel-ative 13C-distribution within total measured phospholipids( %13CPLDIST) was calculated as follows:
%13CPLDIST = %13CLITTERi ×100/∑
%13CLITTER i (4)
where %13CLITTERi represents the relative amount of added13C in an individual phospholipidi, as calculated afterEq. (3). Diversity (Hk) and Evenness (Ek) of the PLFApattern were calculated using Shannon indices according toEqs. (5) and (6):
Hk = −
k∑i=1
pi lnpi (5)
Ek =Hk
lnk(6)
wherek represents the total number of fatty acids andpi therelative abundance of each PLFA (Hill, 1973).
2.6 Statistical analysis
Univariate analysis of variance was carried out using SPSS11.0, with location (T1–T4) and harvesting treatment (con-trol, 8 weeks, 12 weeks) as independent variables. Two-way analysis of variance (ANOVA) was performed to estab-lish significant interactions between location and treatment.Significant differences for specific variables were identifiedusing Duncan‘s post-hoc test atp < 0.05 following one-way ANOVA. Principal component analysis (PCA) was per-formed on the variance-covariance matrix utilizing the statis-tical softwareR (http://www.r-project.org). PCA was basedon mean values (n = 5) of PLFA and13C-PLFA data for eachlocation and time point. The data set for PCA was thus com-posed of 12 (Fig. 2) and 8 (Fig. 5) average samples (n = 5) ofeach location (T1–T4). Data illustration was performed withAdobe Illustrator CS3 and S-PLUS 8.1.
3 Results
3.1 Microbial plant litter degradation
After 8 weeks significant plant litter degradation (p < 0.05)was observed at all sites T1–T4 (Table 2). Nearly 55 %
0
400
800
1200
PL to
tal [
nmol
g-1
DW
] control8 weeks12 weeks
a)
T1 T2 T3 T40.00
0.05
0.10
0.15
0.20
0.25
% o
f ad
ded
13C
in t
ota
l PL
8 weeks12 weeks
T1 T2 T3 T4
b)
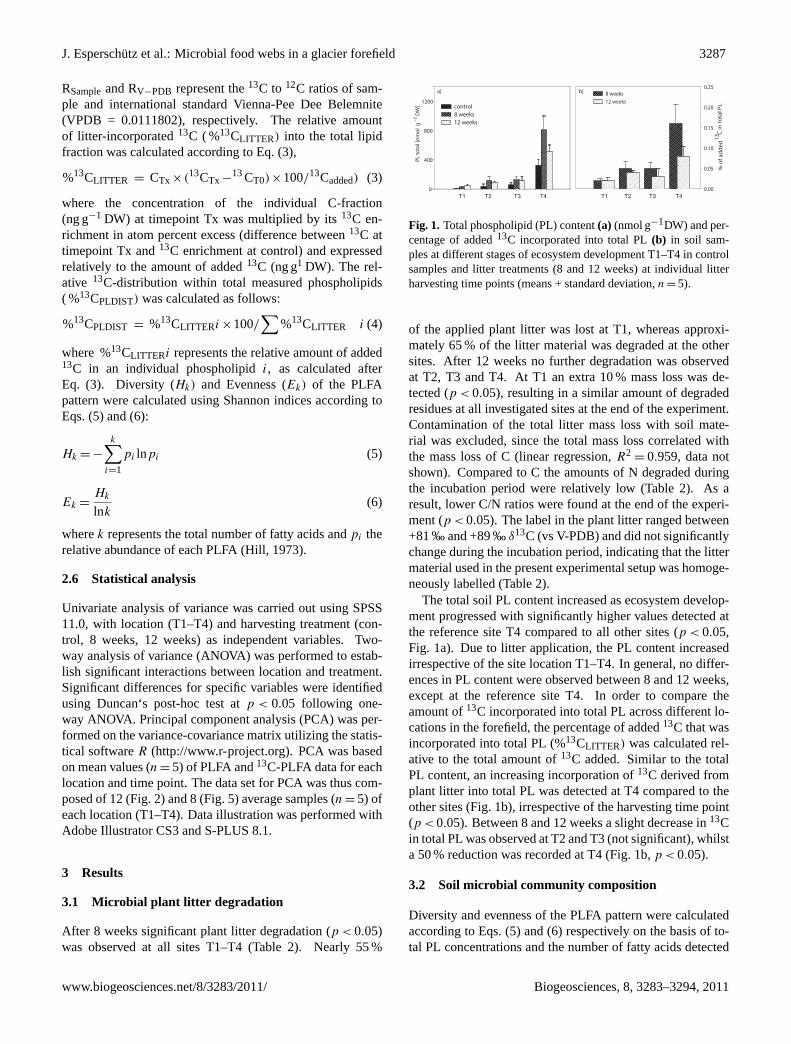
Fig. 1. Total phospholipid (PL) content(a) (nmol g−1DW) and per-centage of added13C incorporated into total PL(b) in soil sam-ples at different stages of ecosystem development T1–T4 in controlsamples and litter treatments (8 and 12 weeks) at individual litterharvesting time points (means + standard deviation,n = 5).
of the applied plant litter was lost at T1, whereas approxi-mately 65 % of the litter material was degraded at the othersites. After 12 weeks no further degradation was observedat T2, T3 and T4. At T1 an extra 10 % mass loss was de-tected (p < 0.05), resulting in a similar amount of degradedresidues at all investigated sites at the end of the experiment.Contamination of the total litter mass loss with soil mate-rial was excluded, since the total mass loss correlated withthe mass loss of C (linear regression,R2
= 0.959, data notshown). Compared to C the amounts of N degraded duringthe incubation period were relatively low (Table 2). As aresult, lower C/N ratios were found at the end of the experi-ment (p < 0.05). The label in the plant litter ranged between+81 ‰ and +89 ‰δ13C (vs V-PDB) and did not significantlychange during the incubation period, indicating that the littermaterial used in the present experimental setup was homoge-neously labelled (Table 2).
The total soil PL content increased as ecosystem develop-ment progressed with significantly higher values detected atthe reference site T4 compared to all other sites (p < 0.05,Fig. 1a). Due to litter application, the PL content increasedirrespective of the site location T1–T4. In general, no differ-ences in PL content were observed between 8 and 12 weeks,except at the reference site T4. In order to compare theamount of13C incorporated into total PL across different lo-cations in the forefield, the percentage of added13C that wasincorporated into total PL (%13CLITTER) was calculated rel-ative to the total amount of13C added. Similar to the totalPL content, an increasing incorporation of13C derived fromplant litter into total PL was detected at T4 compared to theother sites (Fig. 1b), irrespective of the harvesting time point(p < 0.05). Between 8 and 12 weeks a slight decrease in13Cin total PL was observed at T2 and T3 (not significant), whilsta 50 % reduction was recorded at T4 (Fig. 1b,p < 0.05).
3.2 Soil microbial community composition
Diversity and evenness of the PLFA pattern were calculatedaccording to Eqs. (5) and (6) respectively on the basis of to-tal PL concentrations and the number of fatty acids detected
www.biogeosciences.net/8/3283/2011/ Biogeosciences, 8, 3283–3294, 2011

3288 J. Esperschutz et al.: Microbial food webs in a glacier forefield
Table 2. Litter mass loss and selected plant litter parameters obtained from litter bags during the incubation period along the Damma forefield(means ofn = 5± standard deviation).
initital plant 8 weeks 12 weeks
litter T1 T2 T3 T4 T1 T2 T3 T4
plant litter (g per litterbag DW) 2.50 1.12 0.95 0.91 0.87 0.88 0.84 0.83 0.93(0.11) (0.11) (0.10) (0.12) (0.08) (0.16) (0.31) (0.36)
remaining plant litter ( %) 100.00 44.68 38.03 36.27 34.90 35.14 33.50 33.21 37.40(4.22) (4.52) (3.94) (4.95) (3.10) (6.24) (12.41) (14.30)
Ctotal (g per g litter DW) 0.96 0.59 0.42 0.42 0.40 0.45 0.38 0.37 0.42(0.06) (0.15) (0.04) (0.05) (0.04) (0.13) (0.06) (0.14) (0.17)
13Ctotal (‰ δ13C V-PDB) 88.35 84.00 82.33 83.47 85.53 86.50 80.19 81.04 81.45(1.61) (4.42) (4.41) (4.41) (3.09) (2.14) (7.36) (3.15) (5.31)
Ntotal (g per g litter DW) 0.043 0.045 0.032 0.031 0.030 0.035 0.030 0.027 0.031(0.004) (0.011) (0.004) (0.007) (0.003) (0.012) (0.006) (0.011) (0.012)
C/N 22.70 13.32 13.31 13.57 13.35 12.98 12.85 13.86 13.40(1.22) (0.75) (0.57) (1.11) (0.57) (0.90) (0.88) (0.47) (1.15)
in the samples (Table 3). Diversity was lowest at T1, irre-spective of treatments (p < 0.05). After 8 weeks and after12 weeks of incubation, significantly higher values were ob-tained for T4 compared to T1 and T2 (p < 0.05). A similartrend was observed for the evenness of PLFA.
Figure 2 shows the ordination of the samples using PCAanalysis of the various phospholipid fatty acids. Principalcomponents accounted for 47.5 % (PC1) and 20.5 % (PC2)of the total variance, respectively. The first principal com-ponent (PC1) shows discrimination between samples fromT1 and T2/T3/T4 sites. The PL biomarkers that correlatedbest with this axis were PLEL i20 and poly unsaturated fattyacids (18:2w6,9 and 20:4) as well as various iso- and anteisobranched PL (ant14:0, ant15:0, iso15:0, iso16:0, iso17:0)and cyclopropylic PLFA (cy17:0, cy19:0). The biomarkersPLEL i20, 18:2w6,9 and 20:4 were more abundant in thesamples derived from T1 and T2, whilst the opposite was ob-served for the other groups. The second principal component(PC2) separated samples based on the presence or absenceof added litter. The variables that contributed the most tothe variance explained by this axis were saturated fatty acidsof the branched (ant17:0, br18:0, br20:0) and chained type(nor16:0); these were less abundant in litter treatments. Onthe other hand, mono unsaturated PLFA (16:1w7, 16:1w11,17:1w8, 18:1w7 and 18:1w9) were more abundant in thelitter treatments. While PCA was able to differentiate be-tween control and litter-amended samples, there was no clearseparation of samples from T1, T2 and T3 within the litter-amended treatments.
�
control treatment� 8 weeks litter incubation
12 weeks litter incubation
−0.6 −0.4 −0.2 0.0 0.2 0.4
−0.6
−0.4
−0.2
0.0
0.2
0.4
PC1 (47.5%)
PC2
(20.
5%)
T1
T2 T3
T4
T1 T2
T3 T4
T1 T2
T3
T4
−4 −2 0 2
−4−2
02
iso14:0
ant14:0
iso15:0
ant15:0
nor15:0
15:1w8iso16:0
nor16:0
16:1w5
16:1w7
16:1w9
16:1w11
iso17:0
ant17:0
10Me17:0
cy17:0
br13:17,0
17:1w8
br18:0
18:1w7
18:1w9 18:2w6,9
18:2w8,12
10ME19:0
cy19:0
br20:0
plel i20
20:4
nor22:0
22:4
nor24:0
� �
�
� �
�
� �
Fig. 2. First PC1 and second PC2 principal components of the prin-cipal component analysis (PCA) illustrating the relative ordinationof the various locations after 8 and 12 weeks based on their relativeabundance in the soil samples (in % relative to total PL accordingto Fig. 1; means ofn = 5).
Biogeosciences, 8, 3283–3294, 2011 www.biogeosciences.net/8/3283/2011/

J. Esperschutz et al.: Microbial food webs in a glacier forefield 3289
Table 3. Diversity and Evenness of the PLFA pattern (based on Shannon indices) in soil samples at T1–T4 after 8 weeks and 12 weeks oflitter application, as well as without litter (control). Values are illustrated as means (n = 5± standard deviation). Letters (a, b, c) indicatesignificant differencesp < 0.05 within treatments (control, 8 weeks, 12 weeks).
control 8 weeks 12 weeks
T1 T2 T3 T4 T1 T2 T3 T4 T1 T2 T3 T4
PLFA 1.600 2.733 2.869 2.869 2.257 2.562 2.478 2.823 2.337 2.512 2.698 2.717Diversity (0.154)a (0.111)b (0.082)b (0.033)b (0.108)a (0.106)b (0.147)b (0.050)c (0.037)a (0.053)b (0.139)c (0.060)c
PLFA 0.667 0.839 0.861 0.850 0.685 0.777 0.752 0.830 0.687 0.762 0.819 0.834Evenness (0.064)a (0.034)b (0.025)b (0.011)b (0.033)a (0.032)b (0.045)b (0.015)c (0.011)a (0.016)b (0.042)c (0.018)c
-40
-30
-20
-10
0
10T1 - 10 yearsT2 - 60 yearsT3 - 100 yearsT4 - >700 years
natu
ral a
bund
ance
δ13C
vs. V
-PD
B
nor
24:0
22:
4
nor
22:0
20:
4
ple
l i20
br2
0:0
cy1
9:0
10M
e19:
0
18:
2w8,
12
18:
2w6,
9
18:
1w9
18:
1w7
br1
8:0
17:
1w8
br1
3,17
:0
cy1
7:0
10M
e17:
0
ant
17:0
iso1
7:0
16:
1w11
16:
1w9
16:
1w7
16:
1w5
nor
16:0
iso1
6:0
15:
1w8
nor
15:0
ant
15:0
iso1
5.0
ant
14:0
iso1
4:0
Fig. 3. Natural abundanceδ13C values [‰ vs V-PDB] of individ-ual PL in control soil without litter application (means± standarddeviation;n = 5) at different locations T1-T4.
3.3 13C distribution within PL groups
Figure 3 shows the natural13C abundance (no litter applica-tion) of PL in soil at the different sites. For most PL,δ13Cvalues ranged between−25 ‰ and−30 ‰ at T2, T3 and T4,and showed no statistical differences atp < 0.05 betweenthese sites. T1 showed higher variability ofδ13C naturalabundance with average values ranging between−1 ‰ and−20 ‰ (vs V-PDB). In general,δ13C natural abundance inPL significantly differed between soil samples from T1 andthe other sites, but similar values were observed for 16:1w7and 18:2w6,9 (Fig. 3).
Distribution of 13C derived from plant litter (PLDIST)
among individual PL was calculated according to Eq. (4).Results indicated a similar incorporation of plant litter13Camong individual PL at all sites (Fig. 4). In all cases,the highest plant litter13C incorporation was reported for18:2w6,9 (40–50 %), nor16:0, 20:4 and PLEL i20 (10–20 %)and the monounsaturated fatty acids 16:1w7, 18:1w7 and18:1w9 (5–10 %). Litter-derived13C incorporation patterns
0 10 20 30 40 50 60
nor24:0
22:4
nor22:0
20:4
plel i20
br20: 0
cy19: 0
10Me19: 0
18:2w8,12
18:2w6, 9
18:1w 9
18:1w 7
br18: 0
17:1w 8
br13,17: 0
cy17: 0
10Me17: 0
ant17: 0
iso17:0
16:1w11
16:1w 9
16:1w 7
16:1w 5
nor16:0
iso16:0
15:1w 8
nor15:0
ant15:0
iso15.0
ant14: 0
iso14:0 a)
0 10 20 30 40 50 60
T1: 10 yearsT2: 60 yearsT3: 100 yearsT4: >700 years
b)
relative distribution of plant litter derived 13C [%]
nor24:0
22:4
nor22:0
20:4
plel i20
br20: 0
cy19: 0
10Me19: 0
18:2w8,12
18:2w6, 9
18:1w 9
18:1w 7
br18: 0
17:1w 8
br13,17: 0
cy17: 0
10Me17: 0
ant17: 0
iso17:0
16:1w11
16:1w 9
16:1w 7
16:1w 5
nor16:0
iso16:0
15:1w 8
nor15:0
ant15:0
iso15.0
ant14: 0
iso14:0
Fig. 4. Distribution of13C derived from litter (in % relative to totallitter derived13C into total PL according to Fig. 1; means + standarddeviation;n = 5) within phospholipids in soil samples after 8 weeks(a) and 12 weeks(b) of litter incubation at different locations T1–T4.
were also assessed by means of PCA analysis (Fig. 5). Prin-cipal components accounted for 59.7 % (PC1) and 16.5 %(PC2) of the total variance, respectively. Results showed aseparation between T1 at 8 and 12 weeks and the rest of thesites along PC1. PC1 is very similar to the total soil mi-crobial community profile (Fig. 2); on average, for T1 therewas higher incorporation of13C into PLFA 18:2w6,9, 20:4and PLEL i20 at both 8 and 12 weeks compared to the othersites. PC2 mainly separates T4 at 12 weeks from the othersites/treatments, which is mainly related to a higher incor-poration of13C into 16:1w9 and 18:1w9 as well as the lackof nor22:0 and nor24:0. The separation of T2 and T3 fromthe other locations at both harvesting time points was due tohigher13C incorporation into cy17:0 at these sites.
4 Discussion
4.1 Plant litter degradation and microbial biomass
In the present study, all experimental sites were located ina relatively small geographical region and therefore similar
www.biogeosciences.net/8/3283/2011/ Biogeosciences, 8, 3283–3294, 2011

3290 J. Esperschutz et al.: Microbial food webs in a glacier forefield
climatic and weathering conditions can be assumed. Thelitter decomposition rate during the first 8 weeks of incu-bation was high at all sites, and even higher at sites thathad been free from ice for at least 60 years (Table 2). Thismight be explained by the increase in microbial biomass assuccession proceeds (Fig. 1; Ohtonen et al., 1999). Nonethe-less, after 12 weeks more than 50 % of the applied plant litterwas degraded at all locations along the glacier forefield inagreement with previous studies; for instance, Bradford etal. (2002) described a litter mass loss of around 40 % after5 weeks, although results may vary depending on the typeof litter and the mesh size of the bag. It is also possiblethat the loss of litter mass was not only a result of micro-bial degradation. Particularly in wet environments, leachingof dissolved organic matter from litter tends to be signifi-cant (Chapin et al., 2002). Recently, Gulland and coworkers(unpublished data) found substantial leaching of litter in theDamma glacier forefield. However, the incorporation of lit-ter had a stimulating effect on soil microbial biomass at allinvestigated sites suggesting that microbial activity was re-sponsible for the observed loss of litter (Dornbush, 2007);after 8 weeks of litter incubation, microbial biomass haddoubled at all sites (Fig. 1a). The incorporation of a newC and energy source into the soil, resulted in the stimula-tion of zymogenous organisms otherwise present in a dor-mant state in the soil, regardless of the time free from ice.The freshly-added litter material probably contained con-siderable amounts of relatively easily degradable substances(Heal et al., 1997). As these compounds are consumed,slow-growing cellulose- and lignin-decomposers start to takeover and soon opportunistic organisms, that mainly degradesugars and amino acids, begin to die of starvation (Tate,1987; Dilly et al., 2004). This was reflected by a decreasein soil microbial biomass at all sites after 8 weeks, exceptT1 (Fig. 1a). Results from13C incorporation into microbialbiomass not only support the above-mentioned trend but alsounderpin that such turnover becomes faster as soil develop-ment progresses (Fig. 1b).
Despite the fact that we tried to minimize the effect of thevegetation cover and its rhizosphere by applying the litter be-low it and sampling the soil underneath the litter bags, indi-rect effects due to the vegetation cover such as soil moisture,the presence/absence of mycorrhiza or the association of cer-tain faunal decomposer communities could have influencedour results. In addition it cannot be excluded completely thatdifferences in microclimatic conditions at the different sitespresent may have influenced litter degradation rates (Kauf-mann, 2001; Bardgett et al., 2005), which also includes soilmoisture influenced by the large amounts of melt water orsnow accumulation in certain areas along the forefield (Dar-mody and Thorn, 1997; Herron et al., 2009).
4.2 Soil microbial community profile
According to the diversity of the PLFA pattern, the micro-bial diversity and evenness were suggested to be signifi-cantly lower at T1 compared to the other sites (Table 3).As soil development progresses and the parent material be-comes more accessible for plant colonization, complexity in-creases, nutrient content improves and new potential nichesand microniches become available (Loreau, 2001). This, inturn, results in enhanced microbial diversity (Hattenschwileret al., 2005). The harsh alpine conditions, however, maylimit diversity in these environments as suggested by simi-lar indices in T2 and T3. Higher evenness usually reflectshigher functionality and stability within a system (Legrendeand Legrende, 1998). This becomes more apparent when di-versity values between control and litter amended treatmentsare compared. At T1, diversity substantially increased inthe litter amended treatments, whereas no changes were ob-served at the older sites (Table 3). The fact that few changesin evenness were observed following litter incorporation maysuggest an increasing stability of the microbial food web ir-respective of nutrient sources, as succession proceeds.
The initial microbial community structure as evidenced byPLFA analysis of controls (no litter incorporation) indicatedmarked differences between the T1 and T2–T3 sites, and T4(Fig. 2). At T1, the microbial community structure was dom-inated by PLEL i20. 20:4 and 18:2w6,9, whereas their abun-dance decreased as soil age increased. According to the lit-erature, these markers are mainly found in archaea, fungi,microeukaryotes, protozoa and cyanobacteria (Gattinger etal., 2003; Zelles et al., 1999; Zaady et al., 2010; Potts etal., 1987; Villanueva et al., 2004). These organisms formmicrobial mats in initial ecosystem substrates (Villanueva etal., 2004; Stal, 1995) to revert on different skills of C andN fixation systems (Nisbet and Fowler, 1999), which alsoallow the use of C-CO2 or old C sources. In contrast todata from Towe et al. (2010), where higher abundance of ar-chaeal ammonia oxidizers was observed as ecosystem devel-opment progressed, results from this study indicated a highproportion of total archaea at T1. This contradictory resultmight be explained by the fact that Towe et al. (2010) fo-cused on specific archaeal communities rather than the totalarchaeal community (based on the ubiquitious archaeal lipidphytane; Gattinger et al., 2003). In comparison with T1, amore bacterial-dominated microbial population was detectedat the control sites T2, T3 and T4. Biomarkers characteris-tic of both Gram-positive bacteria (ant14:0, ant15:0, iso15:0,iso16:0, iso17:0) and Gramnegative bacteria (cy17:0, cy19:0)were more abundant at the older sites. According to Kramerand Gleixner (2008), bacteria prefer plant derived C ratherthan soil derived C as a C-source. Vegetation and plant coverwere generally greater at these sites likely providing bettergrowth conditions for bacteria.
The microbial community structure detected in controltreatments differed from that in the litter treatments at all
Biogeosciences, 8, 3283–3294, 2011 www.biogeosciences.net/8/3283/2011/

J. Esperschutz et al.: Microbial food webs in a glacier forefield 3291
stages of ecosystem development (Fig. 2). After litter ap-plication, an increase of mainly Gram-negative bacteria wasobserved (16:1w7, 16:1w11, 17:1w8, 18:1w7 and 18:1w9)that benefited from the fresh and easily available C sources.This is in accordance with other studies postulating Gram-negatives as an important group of bacteria involved in thelitter decomposition process (Elfstrand et al., 2008; Kramerand Gleixner, 2008). Despite a significant decrease inmicrobial biomass between 8 and 12 weeks of incubation(Fig. 1), differences between both harvesting time points inPLFA profiles of soils amended with litter were not as pro-nounced as those found between litter-amended and con-trol samples (Fig. 2). This suggests that shifts in the dom-inant microbial populations from more opportunistic groupsto more specialized groups capable to process the more re-calcitrant litter components was slow and thus not clearlydetectable within the four weeks interval. In addition, differ-ences in the microbial community structure between litter-amended treatments from T1, T2 and T3 were not as promi-nent as those between T4 and the other sites (Fig. 2). Theinfluence of run-off transport of materials from the glacierend to sites T2 and T3 compared to the reference site T4 (notinfluenced by run-off from the glacier end), and the lack ofmajor variations in soil chemistry between T2 and T3 mayexplain the lack of greater differences between the two andalso between T2–T3 and T1.
4.3 13C distribution within PL groups
There was a high natural13C abundance of individual PLgroups in T1 withδ13C values up to +0 ‰ (vs V-PDB)(Fig. 3). We do not attribute these highδ13C values to thedirect use of ancient C after glacier retreat as suggested byBardgett et al. (2007), as theδ13C values of natural soilorganic matter were not higher at T1 compared to thosefound at the other sites. The high natural13C abundanceat T1 might be an indication of cyanobacterial fixation of C(Walker and del Moral, 2003). Due to a smaller isotopic frac-tionation by the 3-hydroxypropionate pathway compared tothe Calvin cycle,13C enriched signatures may also occur dueto C fixation by cyanobacteria (van der Meer et al., 2007).By predation and release of the fixed C into the soil ma-trix and subsequent uptake by other microbes, enriched13Csignatures were possibly transferred into a variety of “non-cyanobacterial” PL groups. For instance highδ13C valuesin PLFA biomarkers indicative for Gram-positive and Gram-negative bacteria were also detected. In addition, as ecosys-tem development progresses, the influence of organic sourcesfrom plants increases. Higher plants fix C through the Calvincycle resulting in higher influence ofδ13C signatures withinthe range−20 to −25 ‰ δ13C (vs V-PDB) in biolipids atT2–T3 and T4.
Incorporation of13C into PL was highest for 18:2w6,9both at 8 and 12 weeks (Fig. 4a and b), possibly due toa predominant role of fungi during the initial stages of
�
� 8 weeks litter incubation 12 weeks litter incubation
−0.4 −0.2 0.0 0.2 0.4 0.6
−0.4
−0.2
0.0
0.2
0.4
0.6
PC1 (59.7%)
PC
2 (1
6.5%
)
T1
T2
T3
T4 T1
T2 T3
T4
−2 −1 0 1 2 3
−2−1
01
23
iso14:0
ant14:0
iso15:0
ant15:0
nor15:0
iso16:0
nor16:0
16:1w5
16:1w7
16:1w9
iso17:0
ant17:0
10Me17:0
cy17:0
br13,17:0
br18:0 18:1w7
18:1w9
18:2w6,9
18:2w8,12 10Me19:0
cy19:0
br20:0
plel i20 20:4
nor22:0
22:4
nor24:0
PC
2
�
�
�
�
�
�
�
�
Fig. 5. First PC1 and second PC2 principal components of the prin-cipal component analysis (PCA) illustrating the relative ordinationof the various locations after 8 and 12 weeks based on their13C-litter enriched soil PL profiles (in % relative to total13C derivedfrom litter into total PL according to Fig. 1; means ofn = 5).
litter decomposition (Fig. 5). According to Emerenciano etal. (1986), high contents of sesquiterpene lactones are knownin the family ofAsteraceaeand up to 7 different compoundshave been detected in theLeucanthemopsisgenus. As suchcompounds are difficult to degrade (Picman, 1987), fungimight have played an important role as the main litter decom-posers in our study. For instance, fungi secrete enzymes thatbreak down the cuticule of dead leaves (Chapin et al., 2002).Schmidt and Lipson (2004) suggest that a high proportionof fungi may dominate the microbial community structure atlow temperatures (−5 to 3◦C), decomposing litter and im-mobilizing N. Frey et al. (2003) postulated a translocationof litter-derived C belowground by decomposer fungi, sub-sequently stabilized as soil organic matter. The high13C en-richment detected in 20:4 could be related to protozoa andother soil microfauna which prey on fungi (Georgieva et al.,2005). However, 18:2w6,9 may occur not only in fungi,but also among cyanobacteria (Zaady et al., 2010) andγ -proteobacteria (Nichols and McMeekin, 2002), which havebeen detected in the Damma forefield as well (Duc et al.,2009). Therefore, it might be possible that at the youngsite, the13C enrichment in these lipids observed in the con-trol soil (no litter application) originates from cyanobacterial13C fixation, whereas13C enrichment in 18:2w6,9 after lit-ter application indicates decomposition processes by fungior γ -proteobacteria. High amounts of13C derived from litter
www.biogeosciences.net/8/3283/2011/ Biogeosciences, 8, 3283–3294, 2011

3292 J. Esperschutz et al.: Microbial food webs in a glacier forefield
were also detected in PLFA nor16:0; however, these lipidsare ubiquitously found in all organisms and therefore provideno clear bioindication.
Surprisingly, we found significant13C enrichment inPLEL i20, characteristic of archaea, particularly after 12weeks (Fig. 4a and b). To the best of our knowledge this isthe first litter decomposition study that includes PLEL as ar-chaeal biomarker (at least in alpine ecosystems), suggestingthat archaea might play an important role during initial lit-ter decomposition in alpine ecosystems. However, it remainsunclear whether the enrichment observed is due to the directparticipation of archaea in litter degradation or to the recy-cling of 13C from other groups. The average incorporation of13C into archaeal biomass decreased with increasing soil ageat 8 and 12 weeks (Figs. 4 and 5), whilst the opposite trendwas observed for biomarkers characteristic of Gram-negativebacteria (16:1w7, 18:1w7 or 18:1w9).
Aside from 18:2w6,9 and PLEL i20, subtle differences be-tween sites were observed for the incorporation of13C intovarious PL as reflected by the multivariate analysis (Fig. 5).Incorporation of13C into 16:1w7 (Gram-negative bacteria)at 12 weeks was greater on average in T1 compared to theother sites (Fig. 4a and b). Incorporation of13C into PLFAcy17:0 at 8 weeks differed between T2 and the rest of loca-tions (Fig. 4a); this marker is characteristic of certain Gram-negative bacteria. Nonetheless, similar litter-derived13C in-corporation patterns for all PLFA groups were found regard-less of site age (Fig. 4a and b). These results indicate that ini-tial food web structures also form the basis of later stages ofsoil development in this kind of environments. This might berelated to the demanding specialization required to surviveand proliferate in environments characterized by very lowtemperatures, short vegetation periods and low availabilityof nutrients. Microbial populations thus have to react rapidlyto organic inputs, which might be restricted to the short veg-etation period, and also to compete with plants for the scarcenutrients. It should be noted that results from general PLanalyses (Sect. 4.2) showed a stimulation of individual PLgroups following litter application which may not necessarilybe related to the utilization of litter derived13C. This mightbe explained by an increase in soil organic carbon mineral-ization due to the input of fresh organic carbon residues, theso called “priming effect” (Kuzyakov, 2010). Additionally,during the time between litter application and the first har-vest (8 weeks), microbes may have migrated to other sitesthrough deposition of particulate matter, air currents, precip-itation or snowmelt (Schutte et al., 2009). The importance ofsuch disturbances and mechanisms was not estimated in thepresent study.
5 Conclusions
The main points emerging from this study are:
– Soil development increases microbial biomass, diver-sity and evenness of the PLFA pattern in glacier fore-land resulting in faster turnover rates during the firstweeks of litter degradation in response to organic sourcepulses.
– Soil development strongly influences the structure of themicrobial community in glacier forefields with increas-ing importance of bacteria as soil development pro-gresses.
– Adaptation to the harsh environmental conditions pre-vailing in alpine ecosystems acts as a strong selectiveforce resulting in similar microbial food web patterns atdifferent stages of soil development.
– Cyanobacteria may play a more important role in C-cycling in alpine ecosystems than previously thought.
– In addition to fungi, both Gram-negative bacteria andarchaea are significantly involved in C-turnover in re-sponse to the incorporation of litter residues in alpineforefields.
Supplementary material related to thisarticle is available online at:http://www.biogeosciences.net/8/3283/2011/bg-8-3283-2011-supplement.pdf.
Acknowledgements.This study is part of the Transregional Col-laborative Research Centre 38 (SFB/TRR38) which is financiallysupported by the Deutsche Forschungsgemeinschaft (DFG, Bonn)and the Brandenburg Ministry of Science, Research and Culture(MWFK, Potsdam). We thank C. Kollerbauer for her excellentwork in PLFA and PLEL analyses. We are also very grateful tothe Department of Environmental Engineering at the HelmholtzZentrum Munchen for providing labelling tents and facilities inthe greenhouse. The following people are acknowledged for theirsupport and their help during the experiment at the glacier forefield:A. Albert, K. Gulland, F. Haesler, B. Hai, J. Ollivier, K. Schauss,R. Schilling, E. Schreiner, S. Schulz, R. Smittenberg, S. Towe.
Edited by: M. Bahn
Biogeosciences, 8, 3283–3294, 2011 www.biogeosciences.net/8/3283/2011/

J. Esperschutz et al.: Microbial food webs in a glacier forefield 3293
References
Abrajano, J. T. A., Murphy, D. E., Fang, J., Comet, P., and Brooks,J. M.: 13C/12C ratios in individual fatty acids of marine mytilidswith and without bacterial symbionts, Org. Geochem., 21, 611–617, 1994.
Bardgett, R. D. and Walker, L. R.: Impact of coloniser plant specieson the development of decomposer microbial communities fol-lowing deglaciation, Soil Biol. Biochem., 36, 555–559, 2004.
Bardgett, R. D., Mawdsley, J. L., Edwards, S., Hobbs, P. J., Rod-well, J. S., and Davies, W. J.: Plant species and nitrogen ef-fects on soil biological properties of temperate upland grass-lands, Funct. Ecol., 13, 650–660, 1999.
Bardgett, R. D., Bowman, W. D., Kaufmann, R., and Schmidt, S.K.: A temporal approach to linking aboveground and below-ground ecology, Trends in Ecology & Evolution, 20, 634–641,2005.
Bardgett, R. D., Richter, A., Bol, R., Garnett, M. H., Baeumler,R., Xu, X., Lopez-Capel, E., Manning, D. A. C., Hobbs, P. J.,Hartley, I. R., and Wanek, W.: Heterotrophic microbial commu-nities use ancient carbon following glacial retreat, Biology Lett.,3, 487–490, 2007.
Baudoin, E., Benizri, E., and Guckert, A.: Impact of artificial rootexudates on the bacterial community structure in bulk soil andmaize rhizosphere, Soil Biol. Biochem., 35, 1183–1192, 2003.
Bernasconi, S. M. and Biglink Project Members: Weathering, soilformation and initial ecosystem evolution on a glacier forefield: acase study from the Damma Glacier, Switzerland, Mineral. Mag.,72, 19–22, 2008.
Bradford, M. A., Tordoff, G. M., Eggers, T. J., and Newingtont,H. J. E.: Microbiota, fauna, and mesh size interactions in litterdecomposition, Oikos, 99, 317–323, 2002.
Chapin, F. S., Walker, L. R., Fastie, C. L., and Sharman, L. C.:Mechanisms of Primary Succession Following Deglaciation atGlacier Bay, Alaska, Ecol. Monogr., 64, 149–175, 1994.
Chapin, F. S., Matson, P. A., and Mooney, H. A.: Principles ofTerrestrial Ecosystem Ecology, Springer, New York, 2002.
Darmody, R. G. and Thorn, C. E.: Elevation, age, soil develop-ment, and chemical weathering at Storbreen, Jotunheimen, Nor-way Geogr. Ann., 79A, 215–222, 1997.
Dilly, O., Bloem, J., Vos, A., and Munch, J. C.: Bacterial Diversityin Agricultural Soils during Litter Decomposition, Appl. Envi-ron. Microb., 70, 468–474, 2004.
DIN ISO 10390: Determination of pH., Berlin, Germany, BeuthVerlag GmbH, 1997.
Dornbush, M. E.: Grasses, litter, and their interaction affect micro-bial biomass and soil enzyme activity, Soil Biol. Biochem., 39,2241–2249, 2007.
Duc, L., Neuenschwander, S., Rehrauer, H., Wagner, U., Sobek,J., Schlapbach, R., and Zeyer, J.: Development and experimen-tal validation of anifH oligonucleotide microarray to study di-azotrophic communities in a glacier forefield, Environ. Micro-biol., 11, 2179–2189, 2009.
Dumig, A., Smittenberg, R. H., and Kogel-Knabner, I.,: Concur-rent evolution of organic and mineral components during initialsoil development after retreat of the Damma glacier, Switzerland,Geoderma, 163, 83–94, 2011.
Edwards, I., Burgmann, H., Miniaci, C., and Zeyer, J.: Variation inMicrobial Community Composition and Culturability in the Rhi-zosphere ofLeucanthemopsis alpina(L.) Heywood and Adjacent
Bare Soil Along an Alpine Chronosequence, Microb. Ecol., 52,679–692, 2006.
Egli, M., Fitze, P., and Mirabella, A.: Weathering and evolution ofsoils formed on granitic, glacial deposits: results from chronose-quences of Swiss alpine environment, Catena, 45, 19–47, 2001.
Elfstrand, S., Lagerlof, J., Hedlund, K., and Martensson, A.: Car-bon routes from decomposing plant residues and living roots intosoil food webs assessed with13C labelling, Soil Biol. Biochem.,40, 2530–2539, 2008.
Emerenciano de P., V., Auxiliadora, M., Kaplan, C., Gottlieb, O.R., Bonfanti de M., M. R., Ferreira, Z. S., and Comegno, L. M.A.: Evolution of sesquiterpene lactones inasteraceae, Biochem.Syst. Ecol., 14, 585–589, 1986.
Esperschutz, J., Buegger, F., Winkler, J. B., Munch, J. C., Schloter,M., and Gattinger, A.: Microbial response to exudates in therhizosphere of young beech trees (Fagus sylvaticaL.) after dor-mancy, Soil Biol. Biochem., 41, 1976–1985, 2009.
Fioretto, A., Di Nardo, C., Papa, S., and Fuggi, A.: Lignin and cel-lulose degradation and nitrogen dynamics during decompositionof three leaf litter species in a Mediterranean ecosystem, SoilBiol. Biochem., 37, 1083–1091, 2005.
Frey, B., Rieder, S. R., Brunner, I., Plotze, M., Koetzsch, S., La-panje, A., Brandl, H., and Furrer, G.: Weathering-associated bac-teria from the Damma Glacier forefield: Physiological capabil-ities and impact on granite dissolution, Appl. Environ. Microb.,76, 4788–4796, 2010.
Frey, S. D., Six, J., and Elliott, E. T.,: Reciprocal transfer of carbonand nitrogen by decomposer fungi at the soil-litter interface, SoilBiol. Biochem., 35, 1001–1004, 2003.
Gattinger, A., Gunthner, A., Schloter, M., and Munch, J. C.: Char-acterization ofArchaea in soils by polar lipid analysis, ActaBiotechnol., 23, 21–28, 2003.
Georgieva, S., Christensen, S., and Stevnbak, K.: Nematode suc-cession and microfauna-microorganism interactions during rootresidue decomposition, Soil Biol. Biochem., 37, 1763–1774,2005.
Goransson, H., Olde Venterink, H., and Baath, E.: Soil bacterialgrowth and nutrient limitation along a chronosequence from aglacier forefield, Soil Biol. Biochem., 43, 1333–1340, 2011.
Hammerli, A., Waldhuber, S., Miniaci, C., Zeyer, J., and Bunge,M.: Local expansion and selection of soil bacteria in a glacierforefield, Eur. J. Soil Sci, 58, 1437–1445, 2007
Hattenschwiler, S., Tiunov, A. V., and Scheu, S.: Biodiversity andlitter decomposition in terrestrial ecosystems, Annu. Rev. Ecol.Evol. Syst., 36, 191–218, 2005.
Heal, O. W., Anderson, J. M., and Swift, M. J.: Plant litter qualityand decomposition: an historical overview, in: driven by nature,Plant litter quality and decomposition, edited by: Cadisch, G. andGiller, K. E., CAB International, Wallingford, United Kingdom,1997.
Herron, P. M., Stark, J. M., Holt, C., Hooker, T., and Cardon, Z. G.:Microbial growth efficiencies across a soil moisture gradient as-sessed using13C-acetic acid vapour and15N-ammonia gas, SoilBiol. Biochem., 41, 1262–1269, 2009.
Hill, M. O.: Diversity and Evenness: A unifying notation and itsconsequences, Ecology, 54, 427–432, 1973.
Jumpponen, A., Vare, H., Matteson, K. G., Ohtonen, R., andTrappe, J. M.: Characterization of “safe sites” for pioneers inprimary succession on recently deglaciated terrain, J. Ecol., 87,
www.biogeosciences.net/8/3283/2011/ Biogeosciences, 8, 3283–3294, 2011

3294 J. Esperschutz et al.: Microbial food webs in a glacier forefield
98–105, 1999.Kaufmann, R.: Invertebrate succession on an alpine glacierforeland,
Ecology, 82, 2261–2278, 2001Kramer, C. and Gleixner, G.: Soil organic matter in soil depth pro-
files: Distinct carbon preferences of microbial groups during car-bon transformation, Soil Biol. Biochem., 40, 425–433, 2008.
Kuzyakov, Y.: Priming effects: Interactions between living anddead organic matter, Soil Bio. Biochem., 42, 1363–1371, 2010.
Legrende, P.: Legrende L Numerical ecology, Elsevier, Amsters-dam, The Netherlands, 1998.
Loreau, M.: Microbial diversity, producer-decomposer interactionsand ecosystem processes: a theoretical model, Proc. R. Soc. Lon-don Ser. B, 268, 303–309, 2001.
Miniaci, C., Bunge, M., Duc, L., Edwards, I., Burgmann, H., andZeyer, J.: Effects of pioneering plants on microbial structuresand functions in a glacier forefield, Biol. Fert. Soils, 44, 289–297, 2007.
Nichols, D. S. and McMeekin, T. A.: Biomarker techniques toscreen for bacteria that produce polyunsaturated fatty acids, J.Microbiol. Meth., 48, 161–170, 2002.
Nisbet, E. G. and Fowler, C. M. R.: Archaen metabolic evolution ofmicrobial mats, P. R. Soc. Lond. B. Bio., 266, 2375–2382, 1999.
Oerlemans, J.: Extracting a climate signal from 169 glacier records,Science, 308, 675–677, 2005.
Ohtonen, R., Fritze, H., Pennanen, T., Jumpponen, A., and Trappe,J.: Ecosystem properties and microbial community changes inprimary succession on a glacier forefront, Oecologia, 119, 239–246, 1999.
Picman, A. K.: Persistence and disappearance of the sesquiterpenelactone, isoalantolactone, in soils, Biochem. Syst. Ecol., 15, 361–363, 1987.
Potts, M., Olie, J. J., Nickels, J. S., Parsons, J., and White, D. C.:Variation in phospholipid ester-linked fatty acids and carotenoidsof desiccated nostoc commune (cyanobacteria) from different ge-ographic locations., Appl. Environ. Microb., 53, 4–9, 1987.
Schmidt, S. K. and Lipson, D. A.: Microbial growth under thesnow: Implications for nutrient and allelochemical availabilityin temperate soils Plant Soil, 259, 1–7, 2004.
Schuette, U. M. E., Abdo, Z., Bent, S. J., Williams, C. J., Schneider,G. M., Solheim, B., and Forney, L. J.: Bacterial succession ina glacier foreland of the High Arctic, ISME J., 3, 1258–1268,2009.
Sigler, W. V. and Zeyer, J.,: Microbial diversity and activity alongthe forefields of two receding glaciers, Microb. Ecol., 43, 397–407, 2002.
Stal, L. J.: Tansley Review No. 84, Physiological ecology ofcyanobacteria in microbial mats and other communities, NewPhytol., 131, 1–32, 1995.
Tate, R. III. Soil organic matter, biological and ecological effects,John Wiley & Sons Inc, USA, 291 pp., 1987.
Towe, S., Albert, A., Kleineidam, K., Brankatschk, R., Dumig, A.,Welzl, G., Munch, J., Zeyer, J., and Schloter, M.: Abundance ofmicrobes involved in nitrogen transformation in the rhizosphereof Leucanthemopsis alpina(L.) Heywood grown in soils fromdifferent sites of the Damma glacier forefield, Microb. Ecol., 60,762–770, 2010.
Tscherko, D., Rustemeier, J., Richter, A., Wanek, W., and Kandeler,E.: Functional diversity of the soil microflora in primary succes-sion across two glacier forelands in the Central Alps, Eur. J. SoilSci., 54, 685–696, 2003.
Tscherko, D., Hammesfahr, U., Zeltner, G., Kandeler, E., andBocker, R.: Plant succession and rhizosphere microbial commu-nities in a recently deglaciated alpine terrain, Basic Appl. Ecol.,6, 367–383, 2005.
Van Der Meer, M. T. J., Schouten, S., Damste, J. S. S., andWard, D. M.: Impact of carbon metabolism on13C signatures ofcyanobacteria and green non-sulfur-like bacteria inhabiting a mi-crobial mat from an alkaline siliceous hot spring in YellowstoneNational Park (USA), Environ. Microbiol., 9, 482–491, 2007.
Villanueva, L., Navarrete, A., Urmeneta, J., White, D. C., and Guer-rero, R.: Combined phospholipid biomarker-16S rRNA gene de-naturing gradient gel electrophoresis analysis of bacterial diver-sity and physiological status in an intertidal microbial mat, Appl.Environ. Microb., 70, 6920–6926, 2004.
Walker, L. R. and del Moral, R.: Primary succession and ecosys-tem rehabilitation, Cambridge, UK: Cambridge University Press,2003.
White, D. C., Davis, W. M., Nickels, J. S., King, J. D., and Bobbie,R. J.: Determination of the sedimentary microbial biomass byextractible lipid phosphate, Oecologia, 40, 51–62, 1979.
Wuchter C., Schouten, S., Boschker, H. T. S. and Damste, J. S.S.: Biocarbonate uptake by marine Crenarchaeota, FEMS Mi-crobiol. Let. 219, 203–207, 2003.
Zaady, E., Ben-David, E. A., Sher, Y., Tzirkin, R., and Nejidat, A.:Inferring biological soil crust successional stage using combinedPLFA, DGGE, physical and biophysiological analyses, Soil Biol.Biochem., 42, 842–849, 2010.
Zelles, L.: Fatty acid patterns of phospholipids and lipopolysaccha-rides in the characterisation of microbial communities in soil: areview, Biol. Fert. Soils, 29, 111–129, 1999.
Zelles, L., Bai, Q. Y., Rackwitz, R., Chadwick, D., and Beese, F.:Determination of phospholipid- and lipopolysaccharide-derivedfatty acids as an estimate of microbial biomass and communitystructure in soils, Biol. Fert. Soils, 19, 115–123, 1995.
Biogeosciences, 8, 3283–3294, 2011 www.biogeosciences.net/8/3283/2011/