microb ecol (1983) 9:137-153 microbial...
TRANSCRIPT

Microb Ecol (1983) 9:137-153 MICROBIAL CCOLOGY @ 1983 Springer-Verlag
A Model for the Density of Aeromonas hydrophila in Albemarle Sound, North Carolina
Terry C. Hazen
Department of Biology, Faculty of Natural Sciences, University of Puerto Rico, Rio Piedras, Puerto Rico 00931
Abstract. The abundance ofAeromonas hydrophila was measured month- ly at 29 sites in Albemarle Sound, North Carolina and its tributaries from April 1977 through July 1979. Simultaneous measurements included het- erotrophic plate count bacteria, fecal coliform bacteria, and 18 physical and chemical parameters. Using only 6 water quality parameters, multiple correlation and regression analysis of the data produced a best-fit regression which explained 38% of the variation observed in A. hydrophila density. The 6 water quality parameters included dissolved oxygen, temperature, orthophosphate, chlorophyll A trichromatic, total Kjeldahl nitrogen, and ammonia. Heterotrophic plate count bacteria and fecal coliform densities were highly correlated with A. hydrophila density, but made the model very unstable. The model was successfully tested against similar data col- lected for 2 other North Carolina reservoirs, Lake Norman and Badin Lake. Data from 10 sites in Badin Lake over 18 months and from 7 sites on Lake Norman over 5 months were not significantly different from the Albemarle Sound model. Conditions of water quality that may give rise to "blooms" of A. hydrophila will simultaneously contribute to the probability of in- creased epizootics in fish in the southeastern United States.
Introduction
Aeromonas hydrophila is a ubiquitous facultative pathogen. It has been reported throughout the United States in all but the most extreme habitats [20, 21]. Indeed, it has been isolated in high numbers from pristine alpine lakes [21], Louisiana bayous [21], and the aphotic zones of the Atlantic Ocean (1,000 m isolation 5 miles southeast of Puerto Rico; T. C. Hazen, unpublished obser- vations).
A wide range of poikilothermic and homeothermic animals, including man, can be infected by A. hydrophila [6, 7, 10, 15, 23, 24, 30, 33, 34]. In the southeastern United States, A. hydrophila causes extensive losses to commercial and sport fisheries as the etiological agent for red-sore disease [22]. In one documented case, 37, 500 fish were killed over a single 13-day period in one North Carolina reservoir, Badin Lake [25]. During the fall of 1976, approxi- mately 95% of the white perch (Roccus americanus) population was killed by

138 Terry C. Hazen
r e d - s o r e d i s e a s e in A l b e m a r l e S o u n d , N o r t h C a r o l i n a ; d u r i n g t h i s e p i z o o t i c , a p p r o x i m a t e l y 5 0 % o f t h e c o m m e r c i a l f ish c a t c h f o r A l b e r m a r l e S o u n d w a s d i s c a r d e d b e c a u s e o f u n s i g h t l y s u r f a c e l e s ions .
I n v i e w o f t h e s e r i o u s i m p l i c a t i o n s f o r t h e c o m m e r c i a l a n d s p o r t f i sh ing i n d u s t r i e s in t h e s o u t h e a s t e r n U . S . , a n d w i t h i n a d e q u a t e i n f o r m a t i o n a v a i l a b l e
r e g a r d i n g t h e e c o l o g y o f A. hydrophila i n N o r t h C a r o l i n a , a s t u d y w a s u n d e r - t a k e n to c o m p r e h e n s i v e l y e x a m i n e t h e c o r r e l a t i o n o f s e l e c t e d w a t e r q u a l i t y p a r a m e t e r s a n d t h e d e n s i t y o f A . hydrophila in A l b e m a r l e S o u n d a n d i n L a k e N o r m a n a n d B a d i n L a k e , N o r t h C a r o l i n a . S i n c e t h e r e l a t i o n s h i p b e t w e e n d e n -
s i ty o f A . hydrophila a n d p r e v a l e n c e o f r e d - s o r e d i s e a s e w i t h i n l a r g e m o u t h b a s s h a d b e e n p r e v i o u s l y s h o w n to b e so s t r o n g [8], i t w a s b e l i e v e d t h a t t h e p r e s e n t
a p p r o a c h w o u l d be u s e f u l in i d e n t i f y i n g t h o s e w a t e r q u a l i t y p a r a m e t e r s t h a t m a y i n c r e a s e t h e p r o b a b i l i t y o f r e d - s o r e e p i z o o t i c s .
Mater ia l s and M e t h o d s
Study Site
The primary area of study was Albemarle Sound (76~ 36~ located in the northeast comer of North Carolina (Fig. 1). Albemarle Sound is a natural estuary with a mean depth of 3 m, a maximum depth of 20 m, and a shoreline of 600 kin. The total watershed covers 45, 695 kmL Albemarle Sound has 2 major tributaries, accounting for 83% of the total watershed: the Roanoke River (25, 123 km:) and the Chowan River (12, 872 km2). The nearest connection to the Atlantic Ocean is Oregon Inlet near Roanoke Island, site 23. The annual mean tidal range at Oregon Inlet is 0.6 m whereas tides in Albemarle Sound are less than 0.3 m. The characteristic diurnal cycle of tides is approximately 24.8 hours. Average annual rainfall in the area is 114 cm. River flow into Albemarle Sound is greatest during the winter (400 m J s -z) and lowest during the summer (>30 m 3 s-~). At times, flow can even reverse briefly during the summer [32]. In the lower Chowan River, flushing times range from more than 50 days during the summer to less than 10 days during the winter [32]. The entire basin supports a rural economy of 500,000 (estimated from the 1970 census). In 1972, commercial fishing was estimated to be producing $5 million annually [2, 4].
Sampling
Water samples were collected using a 2 liter vertical lucite Kemmerer sampling bottle (Wildlife Supply Co., Saginaw, MI). The bottle was washed with 70% ethanol after each sample was taken. Each water sample was placed in a sterile 180 ml whirl-pak bag (NASCO, Ft. Wilkinson, WI) and kept on ice for transport to the lab; the time from collection site to the lab never exceeded 1 hour.
Abundance and distribution ofA. hydrophila were measured monthly. Three samples were taken at the surface and at 1 m intervals in vertical profile at each station (Fig. 1).
Bacteriological Methods
Aeromonas hydrophila density was estimated by viable cell count using Rimler-Shotts (R-S) me- dium [31]. All density estimates were made 4 times on the same sample. A specific volume of sample was filtered through a sterile, gridded, 47 mm membrane filter with a pore diameter of 0.45 ~m (Millipore Corp., Bedford, MA). The filter was then placed on R-S medium and incubated at 35~ for 20-24 hours. Following incubation, yellow colonies were counted with the aid of a

Model for A. hydrophila Density 139
77 ~ 760 ! I
3 ~ ' ~ o
I 77 ~ 716 o
Fig. 1. Albemarle Sound study sites.
magnifying lens; each colony was assumed to represent one colony forming unit (CFU). Periodically, colonies were isolated from membrane filters and confirmed as A. hydrophila using API-20E (Analytab Products, Plainview, NY), oxidase tests, the vibriostatic agent 0/129, and A. hydrophila specific, fluorescent antibody. All techniques are as previously described by Fliermans and Hazen [12], Hazen [17] and Hazen et al. [21].
Fecal coliform estimates were obtained from 4 aliquots from each sample. A specific volume of sample water was filtered through a sterile, gridded, 47 mm membrane filter with a pore diameter of 0.7 tzm (Millipore Corp., Bedford, MA). The filter was then placed on m-FC medium (Difco, Detroit, MI) and incubated at 44.5~ for 24 hours. Following incubation, blue colonies were counted with the aid of a magnifying lens according to APHA standard methods [1].
Heterotrophic plate count bacteria were also estimated from 4 aliquots of each sample. A specific volume of sample water was filtered through a sterile, gridded, 47 mm membrane filter with a pore diameter of 0.45 um (Millipore Corp., Bedford, MA). The filter was then placed on TGE medium (Difco, Detroit, MI) and incubated at 35~ for 24 hours. Following incubation, all colonies were counted with the aid of a magnifying lens, according to APHA standard methods [1].
W a t e r Qual i ty
Five water quality parameters were measured simultaneously with A. hydrophila density. Dissolved oxygen, pH, conductivity, temperature, and redox potential were monitored using a Hydrolab surveyor Model 5901 (Hydrolab Corp., Austin, TX). APHA standard methods were followed for all in situ measurements. Four liters of water were collected, divided into various bottles, and small amounts of the following preservatives added: nitric acid, sulfuric acid, zinc acetate, and mercuric chloride. All samples were then placed on ice for transport to the laboratory. The ap-

140 Terry C. Hazen
propriately preserved samples were analyzed for the following parameters: ammonia, total Kjeldahl nitrogen, nitrates, nitrites (after APHA [1] except that samples were dialyzed instead of filtered); sulfates (turbidimetric method); orthophosphates, total phosphorus (ascorbic acid method and samples were dialyzed); mercury, total organic carbon (using an Oceanographic International Cor- poration Model 524B equipped with a Lira 303 IR detector); sulfides (methylene blue method), chlorophyll A trichromatic, chlorophyll A corrected, and pheophytin A. APHA [ 1] standard meth- ods were used for all determinations; for more details see Esch and Hazen [9].
Data Analysis
A Hewlett-Packard, 3000 series, or an IBM 370-148 computer, was used for all statistical analyses. Some data were analyzed using IDA (Interactive Data Analysis, University of Chicago), and modifications of programs by Davies [5]. Factorial analysis of variance was used to test for dif- ferences between sites and seasons. Multiple correlations were used to determine relationships of A. hydrophila densities with water quality parameters against densities ofA. hydrophila. Parameters were then removed in a stepwise manner until all the remaining parameters showed t statistics that indicated they significantly affected the density ofA. hydrophila. Some data (bacteria counts, orthophosphates, total phosphorus, nitrate, nitrite, total organic carbon, ammonia, and chlorophyll A) were found to be heteroscedastic by determining skewness and kurtosis against a normal prob- ability plot. Heteroscedasticity was reduced by transforming each of these measurements with Log(x + 1) or (x + 0.1) or (x + 0.01), prior to analysis [35]. Any statistical probability -<0.05 was considered significant.
Results
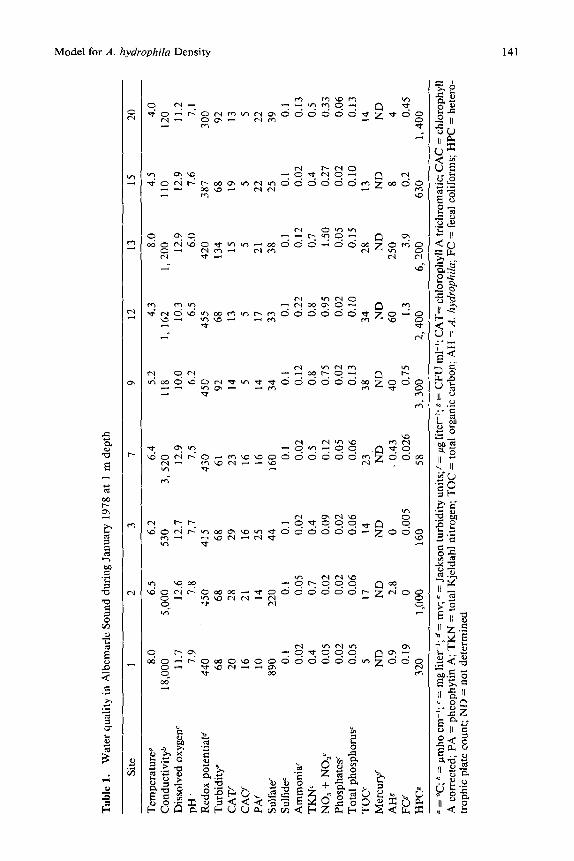
D a t a for al l p a r a m e t e r s m e a s u r e d we re c o m p u t e d s e p a r a t e l y b y m o n t h a n d site. P h y s i c a l a n d c h e m i c a l p a r a m e t e r s for 9 s i tes d u r i n g J a n u a r y 1978, A u g u s t 1978, a n d Ju ly 1979 a re p r e s e n t e d in T a b l e s 1, 2, a n d 3, r e spe c t i ve ly . A l l s i tes c o n s i s t e n t l y s h o w e d c o m p l e t e m i x i s a t a l l d e p t h s for al l p a r a m e t e r s m e a s u r e d . O n l y the 9 m o s t r e p r e s e n t a t i v e s i tes a r e shown.
Si tes 1, 2, a n d 3 were a l w a y s b r a c k i s h wi th sa l in i t i e s g rea t e r t h a n 10 pp t . Si te 27 r e c e i v e d r u n o f f f r o m i n t e n s i v e ag r i cu l tu re a n d h a d s ign i f i can t ly h ighe r t o t a l n i t r o g e n a n d s ign i f i can t ly l o w e r c h l o r o p h y l l A t r i c h r o m a t i c . Si te 29 is a t the p o i n t sou rce o f e t t luen t f r o m a n i t r o g e n fe r t i l i ze r f a c to ry a n d h a d signif i- c a n t l y h ighe r a m m o n i a a n d to t a l n i t r o g e n t h a n a d j a c e n t si tes. Si te 30 is a t the p o i n t sou rce o f eff luent f r o m a p u l p mi l l a n d h a d s ign i f i can t ly h i g h e r c o n d u c - t iv i ty , p H , t u r b i d i t y , a m m o n i a , t o t a l n i t r ogen , a n d to t a l o rga n i c c a r b o n , b u t a s ign i f i can t ly l o w e r r e d o x p o t e n t i a l a n d d i s s o l v e d oxygen . F o r the c o m p l e t e d a t a set o n each p a r a m e t e r , si te, a n d d e p t h , see Esch a n d H a z e n [9].
Bacteria Distribution and Density
F a c t o r i a l a n a l y s e s o f v a r i a n c e i n d i c a t e s ign i f ican t d i f fe rences in h e t e r o t r o p h i c p l a t e c o u n t b a c t e r i a dens i t i e s b y si te ( F = 5.59; d f = 20 & 104; P < 0 .0001) , b u t n o t b y season . T h e h ighes t dens i t i e s o f h e t e r o t r 0 p h i c p l a t e c o u n t b a c t e r i a o c c u r r e d in N o v e m b e r ( > l 0 s C F U m l 1); t he sp r ing a n d s u m m e r m o n t h s were qu i t e v a r i a b l e (102-105 CFU m l 2). T h e b r a c k i s h w a t e r s i tes h a d m o d e r a t e
Tab
le 1
. W
ater
qua
lity
in
Alb
emar
le S
ou
nd
dur
ing
Jan
uar
y
1978
at
1 m
dep
th
O
Sit
e 1
2 3
7 9
12
13
15
20
Tem
per
atu
re a
8.0
6.5
6.2
6.4
5.2
4.3
8.0
4.5
4.0
Co
nd
uct
ivit
y b
18,0
00
5,00
0 53
0 3
,52
0
118
1, 1
62
1,2
00
11
0 12
0 D
isso
lved
oxy
gen
~ 11
.7
12.6
12
.7
12.9
10
.0
10.3
12
.9
12.9
11
.2
pH
7.
9 7.
8 7.
7 7.
5 6.
2 6.
5 6.
0 7.
6 7.
1 R
edo
x p
oten
tial
d
440
450
415
430
450
455
420
387
300
Tur
bidi
ty"
68
68
68
61
92
68
134
68
92
CA
T I
20
28
29
23
14
13
15
19
13
CA
C/
16
2|
16
16
5 5
5 5
5 P
AI
10
14
25
16
14
17
21
22
22
Sul
fate
~ 89
0 22
0 44
16
0 34
33
38
25
39
S
ulfi
de c
0.1
0.1
0.1
0.1
0.1
0.1
0.1
0.1
0.1
Am
mo
nia
c 0.
02
0.05
0.
02
0.02
0.
12
0.22
0.
12
0.02
0.
13
TK
N c
0.
4 0.
7 0.
4 0.
5 0.
8 0.
8 0.
7 0.
4 0.
5 N
O3
+ N
O2
~ 0.
05
0.02
0.
09
0.12
0.
75
0.95
1.
50
0.27
0.
33
Ph
osp
hat
es ~
0.02
0.
02
0.02
0.
05
0.02
0.
02
0.05
0.
02
0.06
T
otal
ph
osp
ho
rus c
0.
05
0.06
0.
06
0.06
0.
13
0.10
0.
15
0.10
0.
13
TO
C c
5 17
14
23
38
34
28
13
14
M
ercu
ry c
ND
N
D
ND
N
D
ND
N
D
ND
N
D
ND
A
H~
0.
9 2.
8 0
, 0.
43
40
60
250
8 4
FCg'
0.
19
0 0.
005
0.02
6 0.
75
1.3
3.9
0.2
0.45
H
PC
s 32
0 1,
000
160
58
3,3
00
2,
400
6
,20
0
630
1,4
00
v ~7
a =
~ h
= u
mh
o c
m-~
; c
= m
g li
ter-
~; a
= m
y;
e =
Jack
son
turb
idit
y u
nit
s;I=
ug
lite
r-~;
g =
CF
U m
l-';
CA
T=
chl
orop
hyll
A t
rich
rom
atic
; C
AC
= c
hlor
ophy
ll
A c
orre
cted
; P
A =
ph
eop
hy
tin
A;
TK
N =
tot
al K
jeld
ahl
nitr
ogen
; T
OC
= t
otal
org
anic
car
bon;
AH
= A
. h
ydro
ph
ila
; F
C =
fec
al c
olif
orm
s; H
PC
= h
eter
o-
trop
hic
plat
e co
unt;
ND
= n
ot
det
erm
ined
4~

Tab
le 2
. W
ater
qua
lity
in
Alb
emar
le S
ou
nd
dur
ing
Au
gu
st 1
978
at 1
m d
epth
Sit
e 1
2 3
7 9
12
13
15
20
Tem
per
atu
re a
28.0
30
.5
30.0
29
.5
30.0
29
.0
32.0
29
.0
30.0
C
on
du
ctiv
ity
b 94
.0
660
1, 1
50
1,00
0 19
0 2,
000
145
80
85
Dis
solv
ed o
xyge
n c
8.1
10.1
9.
2 8.
4 4.
5 7.
5 7.
8 8.
6 9.
5 p
H
7.6
8.9
7.5
7.0
6.0
6.6
6.6
7.0
7.9
Red
ox
pot
enti
al a
340
340
415
450
515
475
490
500
370
Tur
bidi
ty"
36
47
20
4 26
26
12
36
88
C
AT
r
17
45
15
5 20
5
43
18
83
CA
C r
28
41
5 5
13
5 27
14
80
P
A r
5
5 13
5
12
5 29
5
5 S
ulfa
te c
480
2 56
53
11
13
13
N
D
12
Sul
fide
c 0.
1 0.
1 0.
1 0.
1 0.
1 0.
1 0.
1 0.
1 0.
1 A
mm
on
ia c
0.
02
0.02
0.
02
0.2
0.2
0.29
0.
02
0.02
0.
02
TK
N c
0.
6 1.
0 0.
2 0.
2 0.
4 1.
3 1.
1 0.
4 0.
8 N
O3
+ N
Oa
c 0.
02
0.02
0.
02
0.16
0.
08
0.31
0.
15
0.02
0.
02
Ph
osp
hat
es ~
0.02
0.
02
0.02
0.
02
0.02
0.
05
0.02
0.
02
0.02
T
otal
ph
osp
ho
rus c
0.
02
0.02
0.
02
0.02
0.
06
0.24
0.
09
0.02
0.
06
TO
C ~
5
10
5 13
5
37
24
5 5
Mer
cury
f 0.
2 0.
5 0.
2 0.
2 0.
2 0.
2 0.
2 0.
2 0.
2 A
Hg
1.5
11
3.7
1.4
6 2
4.1
78
6 F
O
0.06
0.
05
0.03
0.
91
1.0
1.0
0.65
0.
05
0.4
HP
O
52
240
76
180
430
370
390
1,7
00
43
0
See
Tab
le
1 fo
r n
ota
tio
ns
and
ab
bre
via
tio
ns

Tab
le 3
. W
ater
qu
alit
y i
n A
lbem
arle
So
un
d d
uri
ng
Jul
y 19
79
Sit
e 1
2 3
7 9
12
13
15
20
O
Tem
per
atu
re"
28.0
27
.5
28.0
28
.0
30.0
30
.0
26.5
28
.0
27.5
C
on
du
ctiv
ity
b 15
,000
3
,66
0
10,0
00
170
200
20
0
210
100
80
Dis
solv
ed o
xy
gen
c 7.
3 7.
1 7.
1 6.
9 4.
5 8.
9 3.
7 7.
7 8.
0 p
H
7.8
7.8
7.2
6.7
5.8
6.8
6.0
6.8
7.8
Red
ox
po
ten
tial
d 30
0 30
0 33
5 34
0 34
0 30
0 21
0 35
0 29
0 T
urb
idit
y r
96
94
94
97
81
92
99
97
92
CA
T f
14
18
13
5 21
44
5
16
59
CA
C f
11
16
5 5
14
34
5 10
56
P
Af
5 5
5 5
12
16
5 12
5
Sul
fate
~ 6
80
15
0 4
30
73
11
14
13
9
8 S
ulfi
de c
0.1
0.1
0.1
0.1
0.1
0.1
0.1
0.1
0.1
Am
mo
nia
r 0.
13
0.02
0.
02
0.02
0.
5 0.
02
0. !
2
0.02
0.
02
TK
N c
0.5
0.5
0.4
0.4
1.8
0.7
0.7
0.4
0.8
NO
~ +
NO
2 c
0.02
0.
02
0.02
0.
11
0.20
0.
15
0.19
0.
11
0.02
P
ho
sph
ates
~ 0
.02
0.
02
0.02
0.
02
0.12
0.
02
0.02
0.
02
0.0
2
To
tal
ph
osp
ho
rus c
0
.02
0.
02
0.02
0.
02
0.33
0.
13
0.09
0.
06
0.08
T
OC
~ 5
12
5 16
82
26
25
12
14
M
ercu
ry f
1.0
0.2
1.5
0.2
0.6
0.2
0.2
0.2
0.9
AH
~
1,00
0 1,
000
700
ND
30
24
.3
ND
10
0 10
,000
F
C g
0.10
N
D
1.40
0.
10
1.0
0.2
0
200
0.03
4.
83
HP
C TM
5
0,0
00
10
,000
2
0,0
00
3
0,0
00
5,
000
1,9
00
10
0,00
0 15
,000
5
,00
0,0
00
See
Tab
le 1
for
no
tati
on
s an
d a
bb
rev
iati
on
s
t.o

144 Terry C. Hazen
iooo
3oo
~t 5o-
~ -
zr 25
LI IE D 500 - b_ L)
IO0 -
~ ~ 0 -
ha
= , , i T l , l , l l l �84
1 1 1 1 1 1 1 1 1 1 1 J F M A M J J A S O N
Fig. 2. Density ofA. hydrophila by site; mean + 1 standard error, a = brackish sites, b = intensive agriculture runoff, c = nitrogen fertilizer factory, d = pulp mill. Fig. 3. Density ofA. hydrophila by month; mean _ 1 standard error.
densities o f heterotrophic plate count bacteria (10 4 CFU m1-1); site 29 had significantly lower densities (<5 X 10³ CFU ml 1) than all other sites.
Fecal coliform densities were not significantly different between sites; how- ever, differences by season were significant (F = 21.67; d f = 8 & 104; P < 0.0001). Densities o f fecal coliforms at the brackish sites were low (< 1 CFU m1-1) whereas those sites receiving effluent were noticeably higher. Indeed, densities at site 30 (receiving pulp mill effluent) were above r eco m m en d ed limits [3] at all t imes (>10 z CFU ml-~).
Aeromonas hydrophila densities (Fig. 2 and 3) were significantly different by season ( F = 5.87; d f - - 8 & 104; P < 0.01) and by site ( F = 6.60; d f = 20 & 104; P < 0.0001). Densities o f A. hydrophila were highest during the spring and fall. The brackish water sites had significantly lower densities than fresh- water sites, whereas site 27 and site 30 had significantly higher densities of A. hydrophila than at other stations. The A. hydrophila densities at site 29 were significantly lower (Fig. 2) than adjacent sites.
Correlation and Regression of A. hydrophi la Densities with Water Quality
The multiple correlat ion half-matrix (Table 4) shows significant posit ive cor- relations between densities o f A. hydrophila and site, month , temperature, chlorophyll A tr ichromatic , chlorophyll A corrected, total Kjeldahl nitrogen, or thophosphate , total phosphorus, total organic carbon, heterotrophic plate count bacteria, and fecal col iform bacteria densities. Significant negative cor- relations were observed between densities o f A. hydrophila and dissolved oxy- gen, pH and a mm on ia concentrat ions. The other parameters were not signif- icantly correlated with A. hydrophila density.
The best-fit regression o f the first year o f data using dissolved oxygen, tem- perature, or thophosphates , chlorophyll A tr ichromatic , total Kjeldahl nitrogen,

Tab
le 4
. C
orre
lati
on h
alf-
mat
rix
Sit
e M
on
thT
emp
C
on
d
DO
p
H
Red
ox
C
AT
C
AC
P
A
SO4
SOz
NH
3 T
KN
N
Oj+
2 PO
4 T
P
TO
C
HP
C
FC
A
H
O r
Sit
e 1.
000
Mo
nth
.0
68
1.00
0 T
emp
.0
32
.571
1,
000
Co
nd
-.
40
6
-.0
41
-,
04
4
1.00
0 D
O
-.2
76
-.
45
5
-.6
18
.1
20
1.00
0 p
H
-.2
64
-.
05
7
-.0
55
.3
38
.359
1.
000
Red
ox
-.1
13
.1
18 -
.04
2
-.1
18
.1
35 -
.38
8
1,00
0 C
AT
.0
40 -
.05
6
.152
.0
16 -
.03
6
.206
-.2
01
1.
000
CA
C
.053
.0
98
.235
-.0
37
-.
07
0
.180
-.1
07
.8
02
1.00
0 P
A
.051
-.
47
4
-.2
74
.0
97
.048
.1
17 -
.34
1
.413
.0
63
1.00
0 SO
4 -,
02
7
.040
.0
12
.197
,0
08
.261
-.
04
8
.044
.0
32
.007
1.
000
SO
s -.
01
7
-.0
97
-.
09
9
.000
.0
81
-.0
06
-.
05
9
.013
.0
15
.042
.0
02
1,00
0 N
H 3
.1
82
.061
,1
15 -
.02
5
-.4
94
-.
04
0
-.2
76
.0
88
.061
.1
83 -
.02
3
.002
1,
000
TK
N
.194
.0
82
.106
-.0
11
-.
41
5 -
.05
7
-.2
27
.1
25
.088
.2
15 -
.00
4
.008
.6
57
1.00
0 N
O3,
2 -.
05
8
-.0
37
-.
23
1
-.2
11
,0
45 -
.37
0
.271
-.
19
4
-.1
25
-.
13
7
-.0
87
.0
49
.032
,0
24
1,00
0 PO
4 .1
06
.141
-,
08
9
-.0
09
-.
21
7
-.0
65
-.
10
3
.031
-.
01
8
.099
-.
00
6
.000
.2
95
,248
-.0
46
1,
000
TP
.2
50
.027
.0
27 -
.09
4
.481
.0
25 -
,22
0
.154
.1
02
.271
-.0
53
,0
20
.789
.6
90
.029
,2
31
1.00
0 T
OC
.0
93
-.0
45
.0
68 -
.02
2
-.2
67
-.
03
1
-.1
97
.0
83
.019
.2
58 -
.02
1
.003
.4
60
39
0 -
.02
6
.I4
7
.447
1.
000
HP
C
.099
-.1
31
-,
30
1
.050
-.0
17
-.
00
9
-.1
01
.0
02 -
.02
4
.183
.0
41
.060
.2
38
,172
.0
66
,046
.2
81
.100
1.
000
FC
.3
53
.194
,1
35
-.1
13
-.
31
0
-.0
99
-.
00
3
-.0
21
-.
00
4
.005
-.0
19
-.
00
0
.210
,1
86
.037
,0
69
.313
.0
69
.229
1.
000
AH
.3
07
.213
.1
42 -
.07
4
-.4
02
-.
19
1
-.0
77
.1
26
.128
.0
51
.050
-.0
78
-.
19
9
,235
-.
02
7
.I3
5
.357
.1
60
.230
.5
15
1.00
0 N
= 3
22,
P <
.05
wh
en r
> .
109.
~7
See
Tab
le 1
for
no
tati
on
s an
d a
bb
rev
iati
on
s
7~

146 Terry C, Hazen
I I J I , ) I I I i )
S I T E 1 6 T , C H I �9 5 , 5 i
P �9 0 9 4
I 0 ~ .
~ . ~ ~
i I t i I i I I b I t ~ D O F M A M d J A S N
1 9 7 8
P ' 0 8 0
I I I F I I I L t O d F M M d J A
1 9 7 8
SITE I C H I , 1 5 . ' /
I I I S 0 N D
Fig. 4, Predicted (broken line) and observed (solid line) densi t ies o f A. hydrophila at an undis - turbed site. Fig, 5. Predicted (broken line) and observed (solid line) densi t ies o f A. hydrophila at brackish site.
Table 5. Best-fit regression statistics
S u m m a r y Mult iple r r 2
Unad ju s t ed .6244 .3899 Adjus ted ~ ,6151 .3783 b
Analys is o f variance:
S u m o f Degrees o f Source squares f reedom
Mean F square statistic
Regress ion 3.276 6 0.546 33.55 b Res iduals 5.126 315 0.016
Tota l 8.402 321 0.026
Analys is o f coefficients:
S tandard T Variable B (Std. V.) B ~ error* statistic c
DO - . 4 1 4 4 - . 1 2 0 1 .0222 - 5 . 4 1 3 T e m p - . 2 8 0 4 - . 0 2 3 9 .0058 - 4 . 1 1 9 PO4 .4772 10.8710 1.5135 7.183 C A T .142[ .0071 .0026 2.714 T K N .1523 .1149 .0456 2.522 N H 3 - . 3 1 0 1 - . 6 6 8 5 .1591 - 4 . 2 0 2 A H 0 1.8135 .2976 6.094 N = 322
a = where the correlat ion coefficient is ad jus ted to account for the biased es t ima tor o f the popula t ion parameters ; b = p < 0.0001; "= P < 0.05, when T > 1.968; a = slope
and ammonia explains 37.83% of the variation in densities of A. hydrophila (Table 5). The analysis of variance is highly significant (P < 0.0001) and each of the independent variables has a slope significantly different from 0 as seen by the analysis of coefficients (Table 5).
Model for A. hydrophila Density 147
i o * -
5 -
= L o 3 -
I o -
i!ii ~ SITE 3o r""L
CHI �9 20.9 P �9 0.25
i ,
i
�9 ,'
J'
i , i
I I
J F M A M J A S 0 ~ 9 r 8
,~, Io. o
5.
a: ~ i -
. 5 -
tu
, , , , , , , �9 p . . . .
CHr 2 6 P �9 0.g9
D J F M A M O J A S O N O f 9 7 8
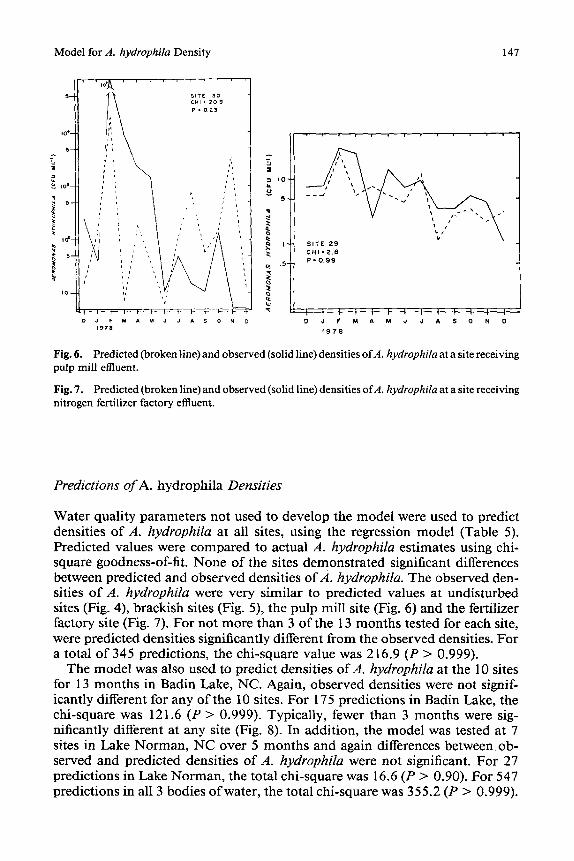
Fig. 6. Predicted••r•ken•ine)and•bserved(s••id•ine)densities•fA.hydr•philaatasitereceiving pulp mill effluent.
Fig. 7, Predicted (broken line) and observed (solid line) densities ofA. hydrophila at a site receiving nitrogen fertilizer factory effluent.
Predictions o f A. hydrophila Densities
Water quality parameters not used to develop the model were used to predict densities of A. hydrophila at all sites, using the regression model (Table 5). Predicted values were compared to actual A. hydrophila estimates using chi- square goodness-of-fit. None of the sites demonstrated significant differences between predicted and observed densities of,4. hydrophila. The observed den- sities of A. hydrophila were very similar to predicted values at undisturbed sites (Fig. 4), brackish sites (Fig. 5), the pulp mill site (Fig. 6) and the fertilizer factory site (Fig. 7). For not more than 3 of the 13 months tested for each site, were predicted densities significantly different from the observed densities. For a total of 345 predictions, the chi-square value was 216.9 (P > 0.999).
The model was also used to predict densities ofA. hydrophila at the 10 sites for 13 months in Badin Lake, NC. Again, observed densities were not signif- icantly different for any of the I 0 sites. For 175 predictions in Badin Lake, the chi-square was 121.6 (P > 0.999). Typically, fewer than 3 months were sig- nificantly different at any site (Fig. 8). In addition, the model was tested at 7 sites in Lake Norman, NC over 5 months and again differences between ob- served and predicted densities of A. hydrophila were not significant. For 27 predictions in Lake Norman, the total chi-square was 16.6 (P > 0.90). For 547 predictions in all 3 bodies of water, the total chi-square was 355.2 (P > 0.999).

148 Terry C. Hazen
5
..j
j ,J
%
SITE S CH1=7.3
i i i i i i I I L I [ S 0 N D d F M A M d J
1 9 7 9
Fig. 8. Predicted (broken line) and observed (solid line) densities of A. hydrophila at an undisturbed site in Badin Lake.
Table 6. Fish infections and density of Aeromonas hydrophila in the water column
Percent prevalence of red-sore Water column
Date Location disease A. hydrophila b
10/77 Albemarle Sound 20.0 (85) a 2.5 + 0.5 4/77 Lake Hickory 23.0 (109) 42.5 + 13.2 4/78 Lake Hickory 4.5 (66) 5.0 - 3.4 5/77 Lake Gaston 14.3 (315) 17.4 + 4.6 6/77 Badin Lake 29.0 (62) 57.2 + 21.2 4/78 Badin Lake 2.4 (207) 1.7 + 0.7 5/78 Badin Lake 2.8 (145) 20.7 + 6.9 7/78 Badin Lake 8.7 (115) 9.4 + 7.8
10/78 Chowan River 3.8 (53) 8.2 + 4.1 12/78 Lake Norman 15.4 (39) 12.8 + 11.0
Numbers in parentheses refer to numbers of fish sampled b Mean CFU ml ~ + 1 standard error
Fish Disease and A. h y d r o p h i l a Density
D e n s i t i e s o f A. hydrophila were e s t i m a t e d at severa l sites in o p e n wa te r si- m u l t a n e o u s wi th co l l ec t i on a n d e x a m i n a t i o n o f l a r g e m o u t h bass (Micropterus salmoides) for the p re sence o f r ed - so re d i sease (Tab le 6). Dens i t i e s o f A. hy- drophila in 5 d i f ferent bod ie s o f w a t e r in N o r t h C a r o l i n a s a m p l e d at d i f fe rent t i m e s w e r e s igni f icant ly c o r r e l a t e d wi th p r e v a l e n c e o f i n fec t ed fish (r = 0.73; P < 0.02).
Discussion
Spatial and Temporal Distribution of A. h y d r o p h i l a
T h e dens i t i e s o f A . hydrophila in A l b e m a r l e S o u n d are e l e v a t e d w h e n c o m p a r e d wi th o t h e r sou thea s t e rn r e se rvo i r s [ 17], bu t are wel l w i t h i n the n o r m a l range

Model for A. hydrophila Density 149
for most lakes, rivers, and estuaries in the United States [21]. As has been demonstrated previously, densities of A. hydrophila were not significantly dif- ferent between depths [ 17].
Seasonal densities of A. hydrophila in Albemarle Sound exhibit a striking periodicity (Fig. 3). The highest numbers occur early in spring, decline to low levels in summer and then increase briefly in the fall. The spring maximum, followed by a weaker fall peak, corresponds to general patterns ofphytoplankton density andproductivity observed in many temperate lakes [ 13] and this system [32]. The strong positive correlation between A. hydrophila density and chlo- rophyll A (Table 4) provides additional support for the relationships between seasonal changes in A. hydrophila and productivity in the Sound. The seasonal pattern for A. hydrophila density in Albemarle Sound parallels that reported for a South Carolina cooling reservoir [ 16]. Moreover, the same study [16] also revealed an association between carbon fixation in the water column and den- sities ofA. hydrophila.
Densities of A. hydrophila were significantly lower in brackish water when compared with freshwater sites (Fig." 2); brackish stations were also low in phosphate, nitrate and chlorophyll A. On the other hand, site 30 (pulp mill effluent), site 27 (intensive agriculture runoff), and site 29 (nitrogen fertilizer factory effluent) all had significantly higher densities of A. hydrophila as well as elevated concentrations of phosphate, nitrate, and chlorophyll A.
Other Bacteria
The highest densities of heterotrophic plate count bacteria were observed at site 27 (intensive agriculture runoff) and site 30 (pulp mill effluent). The lowest densities of heterotrophic plate count bacteria occurred at site 29 (nitrogen fertilizer factory effluent); however, low densities were also observed at sites 16 and 17 ( 103 CFU ml- ~). The distribution ofheterotrophic plate count bacteria is thus quite unlike the patterns observed for A. hydrophila. The large variability observed between sites during each month produced significant differences between months. However, the large variability also made it impossible to perceive the nature of a seasonal pattern for heterotrophic plate count bacteria.
Densities of fecal coliform bacteria showed a pattern more similar to that of A. hydrophila than to heterotrophic plate count bacteria. Brackish sites had very low densities of fecal coliforms whereas the pulp mill effluent site had the highest numbers. Unlike A. hydrophila, however, densities of fecal coliform bacteria were high at site 29 (nitrogen fertilizer factory effluent) and low at site 27 (intensive agriculture runoff). Site 21 also had high densities of fecal coliform bacteria, but low densities of A. hydrophila; the reason for the large numbers of fecal coliforms at site 21 is unknown. A regular seasonal periodicity in densities of fecal coliforms was unapparent.
Correlations Between A. hydrophila and Water Quality
The abundance of Aeromonas hydrophila was positively correlated with tem- perature, a factor that has been previously shown as important in limiting the
150 Terry C. Hazen
densities ofA. hydrophila in both natural and thermally altered environments [20]. Thus, the number of A. hydrophila are always highest between 30 ~ and 35~ and then decline with increasing temperature until the thermal maximum of 45~ is reached [11, 28].
This study, similar to that of Hazen [17], indicates a significant negative relationship between A. hydrophila and dissolved oxygen and pH. Apparently, A. hydrophila has a slight competitive advantage over other bacteria when levels of dissolved oxygen decline. This is indicated by the lack of correlation between dissolved oxygen and heterotrophic plate count bacteria. Water pH is apparently not directly correlated with densities of A. hydrophila because of a strong positive correlation between pH and dissolved oxygen and since the pH optimum for A. hydrophila is slightly basic (T. C. Hazen, unpublished obser- vations).
The significant positive correlations between densities of A. hydrophila and total Kjeldahl nitrogen, orthophosphate, and total phosphorus may be influ- enced by the strong correlation between these parameters and chlorophyll A. Since each of these factors is known to affect the density ofphytoplankton [ 13], it is reasonable to expect that they would indirectly indicate A. hydrophila. An explanation for the negative correlation between ammonia and densities of A. hydrophila is not apparent; however, it may be a direct influence since survival ofA. hydrophila in diffusion chambers at site 29 (nitrogen fertilizer factory) is significantly lower that at other sites where ammonia is lower [19]. This may also explain the low densities of A. hydrophila observed at site 29.
Strong positive correlations were also observed between densities ofA. hy- drophila, fecal coliforms, and heterotrophic plate count bacteria. Caution should be exercised in assessing the importance of these correlations, since sewage effluents would be expected to have high fecal coliform densities, heterotrophic plate count densities, phosphates, nitrates and total organic carbon [14]. This is especially apparent at sites 21 and 29 which are very high in fecal coliform densities but low in A. hydrophila, and site 27 which is low in fecal coliforms but high in A. hydrophila.
The Model and Predictions o f A. hydrophila Densities
The best-fit regression produced a model that predicted densities of A. hydro- phila using only 6 water quality parameters: temperature, dissolved oxygen, orthophosphate, chlorophyll A trichromatic, total Kjeldahl nitrogen, and am- monia. All of these parameters except ammonia, dissolved oxygen, and tem- perature had a positive effect on the density of A. hydrophila (Table 5). Sites receiving significant nitrogen input (Fig. 7) and organic loading (Fig. 6) were predicted as well as those that were not disturbed (Fig. 4). Indeed, large variation in magnitude of A. hydrophila density can be predicted by the model (Fig. 6). The predictability of the very low densities ofA. hydrophila observed at brack- ish sites suggests that low nutrient levels, not salinity, are contributing to low densities of A. hydrophila observed in marine habitats. Recent reports [29] have suggested that what is being identified as A. hydrophila in marine habitats is probably Group F bacteria. The ability of the model to explain densities of

Model for A. hydrophila Density 151
A. hydrophila at brackish sites demonstra tes that A. hydrophila is indeed a normal floral const i tuent o f brackish and mar ine habitats [26].
The densities o f heterotrophic plate count bacteria and fecal coliforms were also incorporated into another version of the model. In this version, nearly all sites i n Albemarle Sound had significant differences between observed and predicted densities o f A. hydrophila. Thus, al though sewage effluent may con- tr ibute to high densities o f A. hydrophila, it is probably not as much due to direct fecal contaminat ion as it is to the increase in nutrients necessary for growth and survival.
Other studies have demonst ra ted correlat ions between a relative eutrophic index and densities o fA. hydrophila [27]. The model developed for Albemarle Sound and the relative eutrophic index are both useful since the index also incorporates the following parameters: total phosphorus , dissolved phosphorus, inorganic nitrogen, secchi depth, chlorophyll A and hypol imnet ic dissolved oxygen. The index cannot, however, be used as a predict ive model .
F rom the model it has been shown (Table 5) that small increases in total nitrogen and or thophosphate st imulate density increases in A. hydrophila, whereas large increases are needed in temperature, dissolved oxygen, chloro- phyll A and ammonia . Nitrogen and phosphorus are nearly always limiting in aquatic systems. As has been shown in numerous studies, small changes in these 2 nutr ients will cause large increases in phytoplankton densities. It is suggested that A. hydrophila is probably receiving the major nutrients it requires f rom these " leaky" phytoplankton.
The utility o f this model is seen by its applicat ion to 2 Nor th Carolina reservoirs. Thus, at every site tested in Lake N o r m a n and Badin Lake, the differences between observed and predicted densities ofA. hydrophila were not significant. Indeed, the overall difference probabil i ty for the goodness-of-fit o f the Albemarle Sound model , tested against 547 different predictions, was a remarkable 0.999. Studies in progress in a tropical rain forest watershed in Puerto Rico also indicate predictabil i ty o f densities of A. hydrophila using the Albemarle Sound model [18].
Densities of A. hydrophi la and Fish Disease
Studies have shown strong posit ive correlat ions between density o f A. hydro- phila in the water co lumn and incidence o f red-sore disease in fish over a 4- year period in a South Carolina reservoir [8, 17]. During the course o f the present investigation, 6 Nor th Carolina reservoirs were examined at different t imes for density o f A. hydrophila and prevalence o f red-sore disease in large- mou th bass; the correlat ion was again highly significant.
Acknowledgments. The author is grateful to Dr. Gerald W. Esch for reviewing the manuscript, for guidance throughout the study, and administration of monies; and to Dr. Robert P. Hirsch for technical assistance in various aspects of the initial part of this study. I am also grateful to William Crawford, Andy Roberts, Edgar Roberts, James Matthews, Anne Mansfield, Mark Mondl, Joe Camp, Cecile Smith, Greg Olson, Gayle Hazen and Ruth Melendez for their technical assistance.
Throughout this study, I was given extremely generous technical support by Steve Tedder and his associates within the Division of Environmental Management of the North Carolina Depart-

152 Terry C. Hazen
ment of Natural Resources and Community Development. The personnel at Duke Power Company also provided help for work on Lake Norman.
A special thanks is due to the Twin Cities Bass Masters Club of Winston-Salem, North Carolina and the B.A.S.S. club of Franklin, Virginia for helping us obtain the largemouth bass needed for this study; their interest and enthusiasm was inspirational.
This work was supported by a grant, B-112-NC, from the North Carolina Water Resources Research Institute. It was also supported in part by a grant from the North Carolina Board of Science and Technology and by Contract DE-AS09-76EY-0900 between Wake Forest University and the Department of Energy. I also acknowledge support through a grant from the Oficina de Coordinacion de Estudios Graduados y Investigaciones of the University of Puerto Rico, grant RR-8102 from the National Institutes of Health to the University of Puerto Rico, and Sea Grant 04F 15844030 project EN/P-45 from the National Oceanographic and Atmospheric Administration to the University of Puerto Rico.
R e f e r e n c e s
1. American Public Health Association (1975) Standard methods for the examination of water and wastewater, 14th edn. American Public Health Association, Washington, DC
2. Bond S, Cook B, Howells DH (1978) The Chowan River project. Summary report for the water resources research institute of the University of North Carolina, Raleigh, North Carolina
3. Bonde GJ (1977) Bacterial indicators of water pollution. Adv Aquatic Mierobiol 1:273-367 4. Daniel CC (1977) Digital flow model of the Chowan River estuary, North Carolina. U.S.
geological survey water resources investigations 77-63 National Technical Information Service, Springfield, Virginia
5. Davies RG (1971) Computer programming in quantitative biology. Acadcmic Press, New York
6. Davis WA, Kane JG, Garagusi VG (1978) Human Aeromonas infections: a review of the literature and a case report ofendocarditis. Medicine 57:267-277
7. Emerson H, Norris C (1905) "Red Leg"--an infectious disease of frogs. J Exp Med 7:32--60 8. Esch GW, Hazen TC (1978) Thermal ecology and stress: a case history for red-sore disease
in largemouth bass (Micropterus salmoides). In: Thorpe JH, Gibbons JW (ed) Energy and environmental stress in aquatic systems. Department of Energy Symposium Series CONF- 7711114. National Technical Information Service, Springfield, Virginia
9. Esch GW, Hazen TC (1980) The ecology ofAeromonas hydrophila in Albemarle Sound, North Carolina. Water Resources Research Institute of The University of North Carolina. Report 153, Raleigh, North Carolina
10. Esch GW, Hazen TC, Dimock Jr RV, Gibbons JW (1976) Thermal effluent and the epizo- otiology of the ciliate Epistylis and the bacterium Aeromonas in association with centrarchid fish. Trans Am Microsc Soc 95:687-693
11. Fliermans CB, Gorden RW, Hazen TC, Esch GW (I 977) Aeromonas distribution and survival in a thermally altered lake. Appl Environ Microbiol 33:114-122
12. Fliermans CB, Hazen TC (1980) lmmunofluorescence ofAeromonas hydrophila as measured by fluorescence photometric microscopy. Can J Microbiol 26:161-168
13. Fogg GE (1965) Algal cultures and phytoplankton ecology. University of Wisconsin Press, Madison, Wisconsin
14. Grabow WOK, DuPreez M (1979) Comparison of m-Endo, LES, MacConkey and Teepol media for membrane filtration counting of total coliform bacteria in water. Appl Environ Microbiol 38:351-358
15. Haley R, Davis SP, Hyde JM (1967) Environmental stress and Aeromonas liquefaciens in American and threadfin shad mortalities. Prog Fish-Cult 29:193
16. Hazen TC (1978) The ecology ofAeromonas hydrophila in a South Carolina cooling reservoir. PhD thesis, Wake Forest University, Winston-Salem, North Carolina
17. Hazen TC (1979) The ecology ofAeromonas hydrophila in a South Carolina cooling reservoir. Microb Ecol 5:179-195

Model for A. hydrophila Density 153
18. Hazen TC, Aranda CF (1981) The relationship between the distribution and abundance of bacteria and water quality in the Rio Mameyes watershed. Septimo Simposio de Recursos Naturales. Puerto Rico, San Juan, pp 87-11 i
19. Hazen TC, Esch GW (1983) Effect of effluent from a nitrogen fertilizer factory and a pulp mill on the distribution and abundance of Aeromonas hydrophila in Albemarle Sound, North Carolina. Appl Environ Microbiol 45:31--42
20. Hazen TC, Fliermans CB (1979) Distribution ofAeromonas hydrophila in natural and man- made thermal effluents. Appl Environ Microbiol 38:166-168
21. Hazen TC, Fliermans CB, Hirsch RP, Esch GW (1978) The prevalence and distribution of Aeromonas hydrophila in the United States. Appl Environ Microbiol 36:731-738
22. Hazen TC, Raker ML, Esch GW, Fliermans CB (1978) Ultrastructure of red-sore lesions on largemouth bass Micropterus salmoides: the association of the peritrich Epistylis sp. and the bacterium Aeromonas hydrophila. J Protozool 25:351-355
23. Marcus LC (1971) Infectious diseases of reptiles. J Am Vet Med Assoc 159:1626-1631 24. Mead AR (1969) Aeromonas liquefaciens in the leukodermia syndrome of Achatina fulica.
Malacologia 9:43 25. Miller RM, Chapman WR (1976) Epistylis sp. and Aerornonas hydrophila infections in fishes
from North Carolina reservoirs. Prog Fish-Cult 38:165-168 26. Peele ER, Singleton FL, Penning JW, Cavari B, Colwell RR (1981) Effects of pharmaceutical
wastes on microbial populations in surface waters of the Puerto Rico dump site in the Atlantic Ocean. Appl Environ Microbiol 41:873-879
27. Rippey SR, Cabelli VJ (1980) Occurrence ofAeromonas hydrophila in limnetic environments: relationship of the organism to lrophic state. Microb Ecol 6:45-54
28. Rouf MA, Rigney MM (1971) Growth temperatures and temperature characteristics of Aero- monas. Appl Microbiol 22:503-506
29. Seidler R J , Allen DA, Colwell RR, Joseph SW, Daily OP (1980) Biochemical characteristics and virulence of environmental group F bacteria isolated in the United States. Appl Environ Microbiol 40:715-720
30. Shotts Jr EB, Gaines JL, Martin C, Prestwood AK (1972) Aeromonas--induced deaths among fish and reptiles in an eutrophic inland lake. J Am Vet Med Assoc 161:603-607
31. Shotts Jr EB, Rimler R (1973) Medium for the isolation of Aeromonas hydrophila. Appl Microbiol 26:550-553
32. Stanley DW, Hobble JE (1981) Nitrogen recycling in a Nor th Carolina coastal river. Limnol Oceanogr 26:30-42
33. Trust TJ, Chipman DC (1979) Clinical involvement ofAeromonas hydrophila. Can Med Assoc J 120:942-947
34. Wohlegemuth D, Pierce RL, Kirkbfide CA (I972) Bovine abortion associated with Aeromonas hydrophila. J Am Med Assoc 160:1001
35. Zar JH (1974) Biostatistical analysis. Prentice Hall, Englewood Cliffs, New Jersey