microatx (µatx) small form factor pc case...
TRANSCRIPT

microATX (µATX) Small Form Factor PC Case Studies
Revision 1.0
April 2007

2 microATX (µATX) Small Form Factor PC Case Studies
THIS DOCUMENT AND RELATED MATERIALS AND INFORMATION ARE PROVIDED "AS IS” WITH NO WARRANTIES, EXPRESS OR IMPLIED, INCLUDING BUT NOT LIMITED TO ANY IMPLIED WARRANTY OF MERCHANTABILITY, FITNESS FOR A PARTICULAR PURPOSE, NON-INFRINGEMENT OF INTELLECTUAL PROPERTY RIGHTS, OR ANY WARRANTY OTHERWISE ARISING OUT OF ANY PROPOSAL, SPECIFICATION, OR SAMPLE. INTEL ASSUMES NO RESPONSIBILITY FOR ANY ERRORS CONTAINED IN THIS DOCUMENT AND HAS NO LIABILITIES OR OBLIGATIONS FOR ANY DAMAGES ARISING FROM OR IN CONNECTION WITH THE USE OF THIS DOCUMENT. Intel products are not intended for use in medical, life saving, life sustaining, critical control or safety systems, or in nuclear facility applications.
Intel Corporation may have patents or pending patent applications, trademarks, copyrights, or other intellectual property rights that relate to the presented subject matter. The furnishing of documents and other materials and information does not provide any license, express or implied, by estoppels or otherwise, to any such patents, trademarks, copyrights, or other intellectual property rights.
Intel may make changes to specifications and product descriptions at any time, without notice. Intel accepts no duty to update specifications or product descriptions with information. Designers must not rely on the absence or characteristics of any features or instructions marked "reserved" or "undefined." Intel reserves these for future definition and shall have no responsibility whatsoever for conflicts or incompatibilities arising from future changes to them.
The hardware vendor remains solely responsible for the design, sale and functionality of its product, including any liability arising from product infringement or product warranty. Intel provides this information for customer’s convenience only. Use at your own risk. Intel accepts no liability for results if customer chooses at its discretion to implement these methods within its business operations. Intel makes no representations or warranties regarding the accuracy or completeness of the information provided.
Copies of documents which have an order number and are referenced in this document, or other Intel literature, may be obtained by calling 1-800-548-4725, or by visiting http://www.intel.com .
The Intel® Core™2 Duo processor and Intel® Q965 Express Chipset and the ICH8 I/O component may contain design defects or errors known as errata, which may cause the product to deviate from published specifications. Current characterized errata are available on request. ∆Intel processor numbers are not a measure of performance. Processor numbers differentiate features within each processor family, not across different processor families. Over time processor numbers will increment based on changes in clock, speed, cache, FSB, or other features, and increments are not intended to represent proportional or quantitative increases in any particular feature. Current roadmap processor number progression is not necessarily representative of future roadmaps. See www.intel.com/products/processor_number for details.
Not all specified units of this processor support Thermal Monitor 2 (TM2). See the Processor Spec Finder at http://processorfinder.intel.com or contact your Intel representative for more information.
Intel, Pentium, Core™2 Duo, Quiet System Technology and the Intel logo are trademarks of Intel Corporation in the U.S. and other. countries.
*Other names and brands may be claimed as the property of others.
Copyright © 2007 Intel® Corporation. All rights reserved.

microATX (µATX) Small Form Factor PC Case Studies 3
Contents 1 Introduction .....................................................................................................8
1.1 References ............................................................................................8 2 System Design Overview .................................................................................10
2.1 System Thickness.................................................................................10 2.2 Industrial Design..................................................................................12 2.3 Acoustic Performance Factors.................................................................13 2.4 Disc Drive Contribution .........................................................................14 2.5 Fan Contribution ..................................................................................14
2.5.1 System Design – Impact on Fan Speed.......................................15 2.5.2 Thermal Solution Design – Impact on Fan Speed .........................15 2.5.3 Power Supply Design – Impact on Fan Speed ..............................16 2.5.4 Fan Speed Control for the System..............................................16
3 Use Condition Definitions .................................................................................17
4 Case Study 1: 10.8L System Volume .................................................................18 4.1 Use Condition Power .............................................................................18 4.2 Component Placement ..........................................................................19 4.3 Front Panel Layout ...............................................................................21 4.4 Power Supply Acoustic Optimization ........................................................22 4.5 Hard Disk Drive (HDD) Acoustic Optimization ...........................................22 4.6 Numerical Model Construction and Design Optimization .............................23
4.6.1 Airflow Patterns ......................................................................26 4.6.2 Predicted Thermal Performance .................................................29 Predicted Acoustic Performance..............................................................31
4.7 Actual Performance ..............................................................................31 4.8 Alternative Design Opportunity...............................................................34
5 Case Study 2: 7.5L System Volume...................................................................36 5.1 Use Condition Power .............................................................................36 5.2 Component Placement ..........................................................................37 5.3 Front Panel Layout ...............................................................................40 5.4 Standard boxed Intel® Core™2 Duo FHS.................................................40 5.5 Power Supply Acoustic Optimization ........................................................40 5.6 Hard Disk Drive (HDD) Acoustic Optimization ...........................................41 5.7 Numerical Model Construction and Design Optimization .............................41
5.7.1 Airflow Patterns ......................................................................43 5.7.2 Predicted Thermal Performance .................................................45
5.8 Actual Performance ..............................................................................46 5.9 Alternative Design ................................................................................50
6 Case Study 3: 5.8L System Volume...................................................................51 6.1 Use Condition Power .............................................................................51

4 microATX (µATX) Small Form Factor PC Case Studies
6.2 Component Placement ..........................................................................52 6.3 Front Panel Layout ...............................................................................55 6.4 Reduced Height CPU Fan Heat Sink .........................................................55 6.5 Power Supply Design and Acoustic Optimization........................................56 6.6 Hard Disk Drive (HDD) Acoustic Optimization ...........................................56 6.7 Numerical Model Construction and Design Optimization .............................56
6.7.1 Airflow Patterns ......................................................................59 6.7.2 Predicted Thermal Performance .................................................60
6.8 Actual Performance ..............................................................................62 6.8.1 Thermal Validation ..................................................................62 6.8.2 Acoustic Noise Level Measurement.............................................64
7 Summary ......................................................................................................65 7.1 Summary of the Three Case Studies .......................................................65 7.2 Thermal Key Learnings of the Case Studies ..............................................66 7.3 Acoustics Key Learnings of the Case Studies ............................................66
Appendix A SFF Concept Systems Prototype Chassis Thermal/Acoustic Test Plan ......................68 A.1 Introduction ........................................................................................68
A.1.1 Purpose .................................................................................68 A.1.2 Audience................................................................................68
A.2 Chassis Qualification Tests.....................................................................68 A.2.1 Chassis Qualification Tests with DO µATX Platform .......................68 A.2.2 Investigative Test Hardware Needs ............................................68 A.2.3 System Configurations .............................................................69 A.2.4 Test Report ............................................................................70
A.3 Test Procedures ...................................................................................70 A.3.1 Thermal Tests with System Configuration ...................................70
A.3.1.1 Purpose...................................................................70 A.3.1.2 Quantity..................................................................70 A.3.1.3 Equipment ...............................................................70 A.3.1.4 Temperature Targets (Success Criteria) .......................71 A.3.1.5 Test Profiles .............................................................71 A.3.1.6 Fan Speed Settings ...................................................72 A.3.1.7 Test Procedure .........................................................72 A.3.1.8 Thermocouple Locations ............................................73 A.3.1.9 Expected Success Criteria ..........................................77
A.3.2 Acoustic Noise Tests with System Configuration...........................78 A.3.2.1 Purpose...................................................................78 A.3.2.2 Quantity..................................................................78 A.3.2.3 Laboratory and Equipment .........................................78 A.3.2.4 Sound Pressure Level Test Profile................................78 A.3.2.5 Success Criteria........................................................79 A.3.2.6 Sound Power Test Profile ...........................................80 A.3.2.7 Success Criteria........................................................81

microATX (µATX) Small Form Factor PC Case Studies 5
Figures Figure 1 µATX SFF System Design .......................................................................8 Figure 2 SFF µATX System with 10.8L Volume.....................................................11 Figure 3 SFF µATX System with 7.9L Volume ......................................................11 Figure 4 uSFF µATX System with 5.8L Volume.....................................................12 Figure 5 µATX SFF PC Industrial Design..............................................................13 Figure 6 Grommets on HDD Mounting ................................................................14 Figure 7 Generic µATX CPU Fan Noise Vs. Fan Speed............................................15 Figure 8 10.8L SFF µATX System Layout ............................................................18 Figure 9 10.8L Top Cover Off in Mini-tower Position .............................................20 Figure 10 10.8L ODD/HDD Bracket (Partition) .....................................................21 Figure 11 10.8L ODD/HDD Bracket (Partition) Swung Up ......................................21 Figure 12 10.8L Front Panel Design ...................................................................22 Figure 13 10.8L CFD Model...............................................................................23 Figure 14 10.8L Ventilation: CPU FHS Inlet .........................................................24 Figure 15 10.8L Ventilation: ODD Compartment Inlet ...........................................24 Figure 16 10.8L Ventilation: HDD Bay ................................................................25 Figure 17 10.8L Ventilation: DIMM and ODD Venting............................................25 Figure 18 10.8L Ventilation: Bezel Venting..........................................................26 Figure 19 10.8L Ventilation: AIC Venting ............................................................26 Figure 20 10.8L CFD Airflow Pattern Prediction – CPU FHS Inlet .............................27 Figure 21 10.8L CFD Airflow Pattern Prediction – No Recirculations Back to Upper
Compartment ...........................................................................................27 Figure 22 10.8L CFD Airflow Pattern Prediction – ODD, FPIO, and HDD ...................28 Figure 23 10.8L CFD Airflow Pattern Prediction – AIC Region .................................28 Figure 24 10.8L CFD Airflow Pattern Prediction – AIC and HDD Ventilations .............29 Figure 25 10.8L Prototype ................................................................................32 Figure 26 10.8L Additional Fan to Improve HDD’s Ambient Temperature .................35 Figure 27 7.5L SFF µATX System Layout ............................................................36 Figure 28 Iso View of the 7.5L SFF System .........................................................38 Figure 29 Inside of the 7.5L SFF System ............................................................38 Figure 30 Lower Components of 7.5L SFF System................................................39 Figure 31 7.5L HDD/ODD/Partition Bracket .........................................................39 Figure 32 7.5L Front Panel Design .....................................................................40 Figure 33 7.5L CFD Model ................................................................................42 Figure 34 7.5L Ventilation: FHS and AIC Venting Design .......................................42 Figure 35 7.5L Ventilation: Front Exhaust ...........................................................43 Figure 36 7.5L CFD Airflow Pattern Prediction......................................................44 Figure 37 7.5L Partition to Prevent Recirculation..................................................44 Figure 38 7.5L CFD Airflow Pattern Prediction......................................................45 Figure 39 7.5L Prototype..................................................................................47 Figure 40 5.8L uSFF µATX System Layout...........................................................51 Figure 41 Iso View of the 5.8L uSFF System .......................................................53 Figure 42 Inside of the 5.8L uSFF System...........................................................53 Figure 43 5.8L ODD/HDD Bracket......................................................................54 Figure 44 Lower Compartment of 5.8L uSFF System ............................................54 Figure 45 5.8L Front Panel Design .....................................................................55 Figure 46 DC\DC Converter Assembly ................................................................56 Figure 47 5.8L CFD Model ................................................................................57 Figure 48 5.8L Ventilation: FHS Inlet and Under Motherboard Exhaust ....................58 Figure 49 5.8L Ventilation: System Fan Exhaust and Front Bezel Exhaust................58 Figure 50 5.8L Partition to Prevent Recirculation..................................................59 Figure 51 5.8L CFD Airflow Pattern Prediction......................................................60

6 microATX (µATX) Small Form Factor PC Case Studies
Figure 52 5.8L Prototype..................................................................................62 Figure 53 CPU FHS Fan Inlet Thermocouple Locations...........................................74 Figure 54 GMCH Tambient Thermocouple Location ...............................................74 Figure 55 GMCH Tcase Thermocouple Location ....................................................75 Figure 56 ICH Tambient Thermocouple Location ..................................................75 Figure 57 ICH Tcase Thermocouple Location .......................................................75 Figure 58 Memory Thermocouple Location ..........................................................76 Figure 59 PCI-Ex X16 Gfx Thermocouple Location ................................................76 Figure 60 GPU Thermocouple Location ...............................................................77 Figure 61 PCI Thermocouple Location ................................................................77 Figure 62 Sound Pressure Level Measurement (Front View)...................................79 Figure 63 Sound Pressure Level Measurement (Top View) .....................................80 Figure 64 Microphone placements for sound power measurement ..........................81
Tables Table 1 Use Condition Descriptions ....................................................................17 Table 2 10.8L Component Temperature Targets and Use Condition Power Loads ......19 Table 3 10.8L Predicted Component Ambient Temperatures with Intel® Core™2 Duo
processor.................................................................................................30 Table 4 10.8L Predicted Vent Airflow (CFM).........................................................30 Table 5 10.8L Predicted Fan Speed and Operating Point........................................31 Table 6 10.8L Predicted System Sound Power (BA) ..............................................31 Table 7 10.8L Measured Thermal Data [°C] at 23°C Ambient.................................32 Table 8 10.8L Measured Thermal Data [°C] at 35°C Ambient.................................33 Table 9 10.8L Measured Acoustic Performance ....................................................34 Table 10 10.8L Measured Sound Pressure Level with One HDD ..............................34 Table 11 7.5L Component Temperature Targets and Use Condition Power Loads ......37 Table 12 7.5L Predicted Component Temperatures with Mainstream Intel® Core™2
Duo Processor ..........................................................................................45 Table 13 7.5L Measured Thermal Data [°C] at 23°C Ambient.................................47 Table 14 7.5L Measured Thermal Data [°C] at 35°C Ambient.................................48 Table 15 7.5L Measured Sound Pressure and Sound Power Level............................50 Table 16 5.8L Component Temperature Targets and Use Condition Power Loads ......52 Table 17 5.8L Predicted Component Temperatures with Mainstream Intel® Core™2
Duo Processor ..........................................................................................61 Table 18 5.8L Predicted Vent Airflow (CFM).........................................................61 Table 19 5.8L Predicted Fan Speed and Operating Point........................................61 Table 20 5.8L Measured Thermal Data [°C] at 23°C Ambient.................................63 Table 21 5.8L Measured Thermal Data [°C] at 35°C Ambient.................................63 Table 22 5.8L Measured Sound Pressure and Sound Power Level............................64 Table 23 Summary of the Three Case Studies .....................................................65 Table 24 Acoustics Data Summary.....................................................................66 Table 25 10.8L Concept Configuration................................................................69 Table 26 7.5L Concept Configuration..................................................................69 Table 27 5.8L Concept Configuration..................................................................70 Table 28 System Thermal Test Profile ................................................................71 Table 29 Fan Speed Settings ............................................................................72 Table 30 System Thermocouple Locations...........................................................73 Table 31 Table 8: Microphone XYZ Locations [m].................................................81

microATX (µATX) Small Form Factor PC Case Studies 7
Revision History
Revision Number
Description Date
1.0 Public Release April 2007
§

Introduction
8 microATX (µATX) Small Form Factor PC Case Studies
1 Introduction
Small Form Factor (SFF – 8-19L) and Ultra Small Form Factor (uSFF – 4-7L) desktop system are predicted to become a significant market over the next couple of year. MicroATX is the most widely used and available motherboard used in the industry. Several microATX (µATX) system profiles have been designed and analyzed to determine µATX applicability to this relatively new Digital Office Small Form Factor (SFF) system profile. Each of the different system profiles was designed to decrease the system chassis volume to demonstrate the µATX form factor design tradeoffs to develop smaller and smaller system profiles. The µATX SFF system profiles illustrated in Figure 1 were also prototyped and their performance measured to correlate the thermal and acoustic predictive models. All system profiles are based on a microATX board and use standard components except where noted.
Figure 1 µATX SFF System Design
1.1 References
Material and concepts available in the following documents may be beneficial when reading this document.

Introduction
microATX (µATX) Small Form Factor PC Case Studies 9
Document Location
LGA775 Socket Mechanical Design Guide http://developer.intel.com/design/Pentium4/guid
es/302666.htm
Fan Specification for 4-wire PWM Controlled Fans http://www.formfactors.
org/
ATX Thermal Design Suggestions http://www.formfactors.
org/
microATX Motherboard Interface Specification http://www.formfactors.
org/
microATX Thermal Design Suggestions http://www.formfactors.
org/
Environmental Standards Handbook,
July 2003 revision - Complete 2003 Environmental Standards Handbook
662394-06
Conroe Processor Electrical, Mechanical, and Thermal Specifications (EMTS)
Ref. No. 20708
Conroe Processor Thermal and Mechanical Design Guidelines Ref. No. 20050
Intel® 965 Express Chipset Family Thermal and Mechanical Design Guidelines
Ref. No. 21599
Intel® I/O Controller Hub 8 (ICH8) Thermal Design Guidelines Ref. No. 20764
Intel® Quiet System Technology (Intel® QST) Configuration and Tuning Manual
Ref. No. 21017

System Design Overview
10 microATX (µATX) Small Form Factor PC Case Studies
2 System Design Overview
The mechanical and thermal design of a SFF and uSFF µATX system will influence the appearance and ability to integrate desirable characteristics, including but not limited to:
• Digital Office aspect ratio (system thickness Vs. width)
• Attractive front panel design
• Easy access to optical storage media player and USB
• Cost effective design
• Quiet operation
• System airflow and power delivery that allows all components to operate within their temperature specifications
Intel® has elected to use the microATX Motherboard Interface Specification to demonstrate that such a product can be designed with interchangeable industry standard components. Standards-based system design and integration is critical to cost and availability, but it is important to also demonstrate that there is sufficient latitude for product differentiation.
Many SFF system designs are possible; however, the content in this case study illustrate three systems with varying component placement characteristics. Of particular interest, all the systems decrease in overall system volume to provide design information on systems ranging from over 10L volume to approximately 5L volumes. Small Form Factor for DT is defines as 7-10L volumes while Ultra Small Form factor for DT systems is defines as 4-7L overall system volumes.
2.1 System Thickness
The minimum system thickness and system volume of a SFF PC is influenced by the feature loading, industrial design, and acoustic performance targets.
The type and quantity of features in the system will dictate the total power required from the power supply. The cost of a power supply typically increases as the total power increases, but each power supply form factor has a power limit beyond which it becomes cost prohibitive. Generally, smaller power supplies have lower total power capability. A system designer may find that the minimum thickness is limited by the physical size of the power supply, as illustrated in Figure 2. The power supply is 85mm tall which keep the minimum system thickness at approximately 88mm.
Front panel symmetry can be an industrial design requirement that limits the minimum system thickness. A centered Optical Disc Drive (ODD) installed in a system whose width is constrained by standard A/V equipment width of 432mm (17”) will need to fit above the thermal module, which will increase the system thickness (Figure 3). In this illustration, a Slim or Mobile ODD in place of a Standard ODD would minimize the system thickness. Compare Figure 3 with a centered ODD to Figure 4 with an ODD slightly off-center.

System Design Overview
microATX (µATX) Small Form Factor PC Case Studies 11
Finally, the acoustic target can also influence the system thickness. Generally, larger fans can spin at lower speed than smaller fans for the same air flow and can lead to better acoustic performance.
Figure 2 SFF µATX System with 10.8L Volume
Figure 3 SFF µATX System with 7.9L Volume

System Design Overview
12 microATX (µATX) Small Form Factor PC Case Studies
Figure 4 uSFF µATX System with 5.8L Volume
2.2 Industrial Design
The industrial design of a SFF PC will likely more closely resemble that of a consumer electronics device than a typical Personal Computer for Digital Home applications. A sleek profile requires attention to the factors that significantly change the aspect ratio, but it is also important that the front panel design be attractive and elegant. For Digital Office applications it will likely look like a typical Personal Computer. The following illustration clearly demonstrates that this important characteristic can be satisfied with an ATX standards-based system in a tower or desktop configuration as shown in Figure 5.

System Design Overview
microATX (µATX) Small Form Factor PC Case Studies 13
Figure 5 µATX SFF PC Industrial Design
2.3 Acoustic Performance Factors
The acoustic performance of any Personal Computer system is most influenced by the amount of noise generated by the installed components. Noise is generated by moving components – e.g. rotating fan blades and bearings or spindles are typical contributors to PC noise.
A general model of system noise based on the noise from its constituents is provided in Equation 1. Therefore, the system noise can be predicted if the individual component noise sources are available from vendor specifications or previous testing.
Equation 1: System Sound Power from Constituent Sound Power
System Sound Power (BA) = log10 (10 source 1 BA + 10 source 2 BA + … + 10 source n BA)
As applied to an RAID compliant Digital Office PC with two HDD units and an ODD, the system noise could be represented as:
Equation 2: RAID Compliant Digital Office PC Sound Power from Constituent Power
Digital Office PC (BA) = log10 (10 HDD 1 BA + 10 HDD 2 BA + 10 ODD 1 BA + 10 CPU Cooler BA+ 10 PSU BA)
In an Idle use condition (e.g. Windows XP idle), the HDD and the ODD units are in Idle not Active mode and both the CPU cooler and Power Supply Unit (PSU) fans will be at their minimum operating speed. The SFF system noise could be forecast based on the HDD Idle sound power and the minimum noise of the CPU Cooler and PSU fans.
Equation 3: Digital Office PC Sound Power Model in Idle Mode

System Design Overview
14 microATX (µATX) Small Form Factor PC Case Studies
Digital Office PC (BA) = log10 (10 HDD 1 Idle BA + 10 HDD 2 Idle BA + 10 ODD Idle BA + 10 CPU
Cooler BA+ 10 PSU Min RPM BA)
2.4 Disc Drive Contribution
Rotating storage media (Hard Disc and Optical Disc Drives) bearings or spindles will generate noise that can be transmitted through the system structure, in addition to being transmitted through the air. Bearing or spindle noise is typically reduced through the selection of bearing technology – fluid bearings generate the least noise and are broadly available. Quiet high performance drives are offered by most HDD vendors.
Structural transmission can actually amplify the HDD noise through structural resonance. If the disc drive is rigidly mounted to a very rigid structure, structural resonance will be minimized; however, this is not always possible in a system design because large spans of sheet metal casing are not very stiff. Damping materials placed between the drive and its holding bracket are often effective in reducing the transmission and amplification of drive noise. See Figure 6 for illustration.
Figure 6 Grommets on HDD Mounting
2.5 Fan Contribution
Fan blades generate airborne noise whose source is either related to separation or blade pass. Separation occurs when the airflow that passes over a fan blade leaves the blade surface or when the airflow stream itself separates through shear. In each case the transition from laminar to turbulent flow generates noise, which is then transmitted by airborne vibrations. Blade Pass occurs as a rotating blade of a fan passes by a strut at the fan’s inlet or exit (struts are used to hold the fan motor in place and span the distance from the motor to the outer fan housing). The high pressure at the narrow blade-strut interface creates separation and turbulence that create noise. The amount of noise generated is typically proportional to the fan’s

System Design Overview
microATX (µATX) Small Form Factor PC Case Studies 15
rotational speed (Figure 7). It is, therefore, important to engineer opportunities to reduce fan speeds when designing a PC system.
Figure 7 Generic µATX CPU Fan Noise Vs. Fan Speed
Generic uATX CPU Fan Noise Vs. Fan Speed
0.00
1.00
2.00
3.00
4.00
5.00
6.00
7.00
1000 1500 2000 2500 3000 3500 4000 4500
Fan Speed [rpm]
Soun
d P
ower
[BA
]
2.5.1 System Design – Impact on Fan Speed
Appropriate side, top, or bottom panel ventilation will improve air temperature in most regions in the system. This may be especially important for low power add-in cards, ODD, and HDD units. Poor ventilation will create stagnant flow in certain areas and increase the air temperature. Achieving temperature compliance in a poorly ventilated design would require an undesirable increase in fan speed.
Power supply orientation and placement will impact the system airflow. A power supply can pull air from within the system or from external ambient. If the power supply pulls air from within the system, the impact to the system airflow should be favorably engineered. For instance, a power supply that prevents sufficient airflow to add-in cards or drive bays will impact the system performance in the same way as poor ventilation noted above. A power supply that pulls in lower temperature air from external ambient may allow a substantial reduction the power supply fan speed. This configuration may, however, have an adverse impact on other component temperatures that might require an increase in the processor’s fan speed.
2.5.2 Thermal Solution Design – Impact on Fan Speed
The performance of a processor’s thermal solution can also have an impact on the noise generated by a system. The more effective any particular heatsink design is conducting and convecting heat, the less airflow is required for any given power dissipation requirement. Selecting more conductive heatsink material, minimizing interface contact losses, and analyzing the trade-offs heatsink surface area and airflow

System Design Overview
16 microATX (µATX) Small Form Factor PC Case Studies
will reduce the airflow that the fan must generate, which will reduce the required fan speed.
2.5.3 Power Supply Design – Impact on Fan Speed
An efficient power supply will typically generate less heat and this will reduce the airflow required to dissipate that heat. Concurrent thermal and electrical engineering can reduce power supply airflow impedance and ensure that critical components are placed in the airflow stream. Selection of a power supply engineered for efficiency, impedance, and effective heat transfer will allow lower fan speed.
Most power supply fans are, unfortunately, voltage regulated. A PWM fan has a greater speed range. Appropriate power supply thermal engineering may allow very low fan speeds in many use conditions, so it is appropriate for power supply vendors and system integrators to consider the additional expense of a PWM fan.
The orientation and placement of the power supply in the system was discussed in Section 2.5.1.
2.5.4 Fan Speed Control for the System
When there is more than one fan in the system, which is typical for ATX systems, the tradeoffs with PSU, CPU, system, and/or other fans need to be addressed. To achieve optimal acoustics, one has to actively as well as dynamically control all the fans in the system via a fan speed control method and optimize that control method for a given system. Intel® Quiet System Technology (Intel® QST) has been developed specifically to resolve this complex task in an easy manner. Please refer to “Intel® Quiet System Technology Configuration and Tuning Manual” for details. Other fan control methods may also be used to achieve optimal acoustics with more efforts.
§

Use Condition Definitions
microATX (µATX) Small Form Factor PC Case Studies 17
3 Use Condition Definitions
Intel® suggests that there are specific use conditions in which the performance of a Digital Office PC is particularly important.
Most computer manufacturers publish acoustic performance values for products in an Idle Operating State. In this state, the system’s operating system is in Idle mode, as are the HDD unit(s), and the system is in a temperature controlled room (e.g. an air-conditioned room). PC systems with Fan Speed Control are typically designed so that all its fans are operating at their lowest speed in this state.
A Digital Office PC should be expected to have heavy use conditions in normal room temperature. For example, intensive graphic files being retrieved from the HDD and rendered through discrete or integrated graphics while an engineering calculation being performed by the processor and some data already stored in the HDD being backed up to a DVD in the background may represent such a use condition. To be conservative in the design approach, this use condition can be simulated by assuming all the components are at their maximum design power.
The Maximum use condition, though unlikely to occur, is important to ensure that the system design is capable of maintaining safe and reliable component operating temperatures when all components are at their maximum design power and the system is in a hot climate without temperature control.
Table 1 shows the external system ambient and application load for these three use conditions.
Table 1 Use Condition Descriptions
Use Condition Description
Idle Idle @ 23°C
Intermittent Maximum Load @ 23°C
Maximum Maximum Load @ 35°C
NOTE: Where Maximum Load indicates all components are at their full load condition.
§

Case Study 1: 10.8L System Volume
18 microATX (µATX) Small Form Factor PC Case Studies
4 Case Study 1: 10.8L System Volume
The first case study was defined to understand the minimum size that could be achieved with µATX motherboards using standard desktop components while targeting optimal acoustic performance and feature loading. Figure 8 outlines the feature loading for this 96mm x 333mm x 340mm (thickness x width x depth) configuration. Note the inclusion of two standard Hard Disc Drive (HDD) components, a desirable characteristic for a PC with RAID capability.
Figure 8 10.8L SFF µATX System Layout
4.1 Use Condition Power
Before describing the system layout, features, and performance, it is important to understand the component thermal design powers expected for this particular system configuration. Table 2 describes these power loads in each use condition, along with the component temperature requirement. For some components, the temperature requirement has been simplified as an approach ambient temperature requirement. The ambient requirement in these cases was derived from either detailed CFD numerical modeling or empirical testing that established a relationship between the component and ambient temperature.
ODD
HDD x2 FPIO
PSU
LP AIC
ChassiMB
ATX CPU FHS

Case Study 1: 10.8L System Volume
microATX (µATX) Small Form Factor PC Case Studies 19
Table 2 10.8L Component Temperature Targets and Use Condition Power Loads
Case 1: Idle Low Load @
23℃ ambient
Case 2: Intermittent
Maximum Load @ 23℃
ambient
Case 3: Maximum Maximum
Load @ 35℃ ambient
Component Description Quantity
Power Dissipation
[W]
Power Dissipation
[W]
Power Dissipation
[W] Thermal
Target[℃]
CPU 1 32.5 65.0 65.0 Tc ≦60.1℃
VRM VRD11
(efficiency 75%)
1 10.8 21.7 21.7 Component spec limits
Ta ≦ 47℃, 150LFM MCH 1 11.0 28.0 28.0
Tc ≦ 97℃
Ta ≦ 60℃, 50LFM ICH 1 2.5 3.8 3.8
Tc ≦ 92℃
Ta_entry ≦ 50℃ Memory DDR2 4 0.5 1.9 1.9
Ta_gap ≦ 70℃
M/B Msic. µATX 1 4.0 8.0 8.0 Component spec limits
PCIe x16 Card
½ Length PCIe card
1 10.0 20.0 20.0 Ta ≦ 55℃
PCI Card ½ Length AIC 1 3.0 5.0 5.0 Ta ≦ 55℃
HDD 3.5" SATA 2 5.0 8.1 8.1 Ta ≦ 55℃
ODD 5.25" EIDE 1 3.0 5.0 5.0 Ta ≦ 50℃
Card Reader 7 in 1 1 0.5 1.0 1.0 Ta ≦ 50℃
Total (excluding PSU) 89.3 181.3 181.3
PSU TFX12V 1 59.5 (efficiency
60%) 77.7 (efficiency
70%) 77.7 (efficiency
70%) Ta ≦ 50℃ inlet
target
4.2 Component Placement
In this system profile, placement of the PSU on the left (add-in card – Area B) edge of the board allows the ODD to be placed near the top of the front panel (as viewed from a mini-tower position). Figure 9 illustrates an attractive industrial design option available with a DT ODD and a thin system profile. The standard components in this system profile include a µATX motherboard, memory, standard ATX CPU fan heatsink, TFX12V PSU, 5.25” ODD, 3.5” HDD (x2), and low-profile add-in cards (x2). The system can also accommodate a full height ½-length PCI-Express x16 DVI card on a

Case Study 1: 10.8L System Volume
20 microATX (µATX) Small Form Factor PC Case Studies
riser if the chassis width is increased from 333mm to 363mm, keeping the same TFX PSU, although we did not analyze this condition in this study.
The only non-standard component in this system is the front panel I/O (FPIO) assembly, which includes a 7-in-1 media card reader, two USB 2.0 ports, one 1394 port, and Line-in/Line-out jack.
With the ODD being located in a user-friendly position as shown, the two HDD’s are placed near the PSU fan inlet without creating mechanical interference with the add-in cards nor violating the motherboard’s keep-out areas. The position of the PSU not only helps cool the HDD’s, it also vents the heated ambient air from (G)MCH, ICH, and add-in cards.
There is an ODD/HDD bracket (or partition), separating the chassis into two compartments as shown in Figure 10. The upper compartment keeps CPU fan inlet temperature close to the external ambient temperature. Additionally, the heated air on the lower compartment of the system does not get pulled back by the fan to mix with the air inside the upper compartment. This is the main purpose for implementing the partition like ODD/HDD bracket – to prevent air recirculation between the CPU heatsink fan and the rest of the system.
Figure 9 10.8L Top Cover Off in Mini-tower Position
The ODD/HDD bracket along with the partition assembly can be swung up for access to the devices or components on the motherboard, e.g. DIMM memory, processor, processor fan heatsink, FPIO, and cable assemblies. The ID bezel must be removed before the bracket can be rotated. See Figure 11 for illustration.
ODD
Stand

Case Study 1: 10.8L System Volume
microATX (µATX) Small Form Factor PC Case Studies 21
Figure 10 10.8L ODD/HDD Bracket (Partition)
Figure 11 10.8L ODD/HDD Bracket (Partition) Swung Up
4.3 Front Panel Layout
The front panel layout can be seen in Figure 12. It is designed to combine with an interchangeable ID bezel that requires no tools for removal. To avoid ODD tray from hitting the PC’s keyboard typically placed in front of the system during loading and
HDD
ODD
Partition
Processor Heatsink
Memory

Case Study 1: 10.8L System Volume
22 microATX (µATX) Small Form Factor PC Case Studies
unloading of the disc, the drive device is located near the top side of the front panel in a tower configuration. The system can also be used in desktop (horizontal) orientation, again with the ODD high on the chassis for keyboard clearance. . Positioning the FPIO assembly in the lower part of the panel prevents USB, 1394, and audio accessories’ cables from hanging loosely off the ID bezel.
Figure 12 10.8L Front Panel Design
4.4 Power Supply Acoustic Optimization
Optimization of the 250W TFX12V PSU fan speed can be implemented by specifying the fan speed range required for the particular system requirements. This is an OEM solution optimized through empirical testing or thermal simulations, and the volume of units justifies the optimization. For broad channel applications the PSU would be any available TFX PSU.
4.5 Hard Disk Drive (HDD) Acoustic Optimization
High performance 250G HDD units were selected for the SFF PC prototype. The particular model selected comes with fluid bearings to minimize the source noise. Isolation mounts were inserted between the HDD and its retaining bracket to minimize potential noise contribution from structural resonance.
The HDD was independently tested in an acoustic chamber and values of 2.6 BA in Idle mode and 2.8 BA in Active mode were recorded.
Backlit Power Switch
DT DVD
Media Card Reader
Front Panel USB, 1394, Audio
Interchangeable Front Bezel

Case Study 1: 10.8L System Volume
microATX (µATX) Small Form Factor PC Case Studies 23
4.6 Numerical Model Construction and Design Optimization
A Computational Fluid Dynamic (CFD) numerical model (see Figure 13) was constructed based on the design illustrated in Figure 8. Compact models were constructed to simulate the devices or components in the system. Detailed modeling was not performed because behaviors on the system-level were of the only interest in the analyses, not component levels. Thermal and fluid flow analyses for each use condition (see Table 2) were performed to predict the airflow and temperature behaviors in the system.
There are two fans in the system, the CPU FHS fan and PSU fan. Both fan curves were needed for the CFD analyses. The PSU fan curves for different fan speeds were readily available since most fan vendors provided fan curves in their product specifications. CPU FHS fan curves were generated by testing the fan at three different speeds in a wind tunnel. These fan curves were used in the numerical model. For each placement and ventilation option evaluated, fan curves were scaled for different fan speeds according to the fan laws until the CFD model indicated that subsystem temperatures were compliant with their requirements with the minimum acceptable fan speeds for the particular use condition.
Figure 13 10.8L CFD Model
Component placement and ventilation position options were evaluated in the numerical model to ensure that the design was optimized (i.e. meeting acoustic noise and thermal targets) prior to the construction and testing of a prototype. Inlet ventilations for the CPU FHS fan are illustrated Figure 14. This generous inlet ventilation allows sufficient airflow and low airflow impedance, and allows a clean top cover design.
External ambient air can also be brought into the ODD bay by implementing venting patterns on the chassis cover near the rear side of the ODD as illustrated in Figure 15. A piece of partition with small opening inserted in between the CPU FHS compartment and the ODD compartment would prevent the heat dissipated by the ODD from over-
Upper HDD
Lower HDD
ODD AIC AIC
FPIO Assembl
ID Beze
CPU FHS
Bracket Partition
PSU
Main Cable

Case Study 1: 10.8L System Volume
24 microATX (µATX) Small Form Factor PC Case Studies
heating the inlet ambient temperature for the FHS while creating force convection on the rear end of the drive device.
Figure 14 10.8L Ventilation: CPU FHS Inlet
Figure 15 10.8L Ventilation: ODD Compartment Inlet
CPU FHS Inlet
FAR: 50%
CPU FHS Inlet
FAR: 50%
Partition with
Opening
ODD Bay Inlet
FAR:50%
ODD
ID Bezel
Case Study 1: 10.8L System Volume
microATX (µATX) Small Form Factor PC Case Studies 25
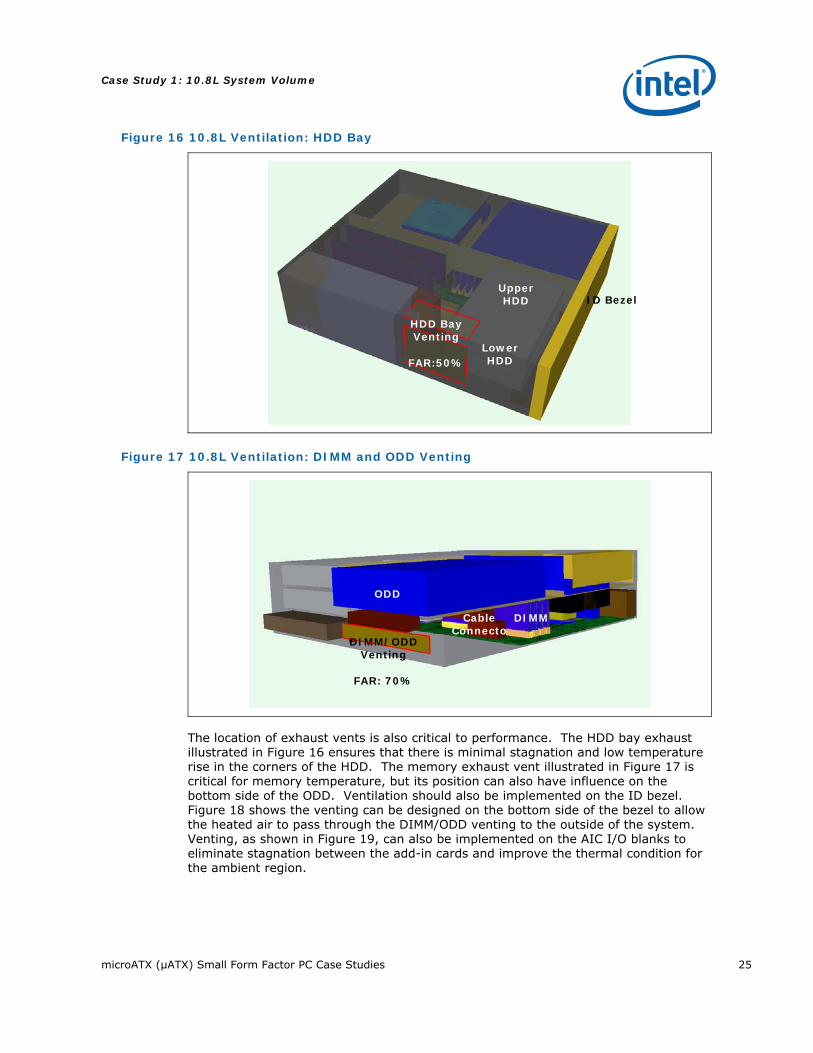
Figure 16 10.8L Ventilation: HDD Bay
Figure 17 10.8L Ventilation: DIMM and ODD Venting
The location of exhaust vents is also critical to performance. The HDD bay exhaust illustrated in Figure 16 ensures that there is minimal stagnation and low temperature rise in the corners of the HDD. The memory exhaust vent illustrated in Figure 17 is critical for memory temperature, but its position can also have influence on the bottom side of the ODD. Ventilation should also be implemented on the ID bezel. Figure 18 shows the venting can be designed on the bottom side of the bezel to allow the heated air to pass through the DIMM/ODD venting to the outside of the system. Venting, as shown in Figure 19, can also be implemented on the AIC I/O blanks to eliminate stagnation between the add-in cards and improve the thermal condition for the ambient region.
Upper HDD
Lower HDD
HDD Bay Venting
FAR:50%
ID Bezel
DIMM
ODD
DIMM/ODD Venting
FAR: 70%
Cable Connecto

Case Study 1: 10.8L System Volume
26 microATX (µATX) Small Form Factor PC Case Studies
Figure 18 10.8L Ventilation: Bezel Venting
Figure 19 10.8L Ventilation: AIC Venting
4.6.1 Airflow Patterns
The predicted airflow pattern in this system profile is illustrated in figures below. Air is drawn into the system by the fan on the CPU FHS through the FHS inlet vents (see Figure 20). The drive bay assembly is extended to the back end of the system (above the MB’s RPIO), forming a partition that separates the system into two compartments as mentioned in 4.2 and illustrated in Figure 10. The air in the upstream of the FHS fan (in so called the “upper” compartment) stays only 1°C ~ 4°C above the external ambient temperature because the air heated by the system in the “lower” compartment is prevented from recirculating to the upper compartment by the partition assembly (see Figure 21).
DIMM
ODD
ID Bezel ODD Bay
Bezel Venting FAR: 30%
MB
PSU
Cables FPIO
HDD
HDD
ODD
Partition HDD
FHS
PSU
MB
AIC Venting
FAR: 70%
RPIO
AIC AIC
ID Bezel
Cable

Case Study 1: 10.8L System Volume
microATX (µATX) Small Form Factor PC Case Studies 27
Figure 20 10.8L CFD Airflow Pattern Prediction – CPU FHS Inlet
Figure 21 10.8L CFD Airflow Pattern Prediction – No Recirculations Back to Upper Compartment
The air entering the CPU FHS will exit omni-directionally and pass by the components around the CPU socket and beyond creating convective cooling to the VR, (G) MCH, DIMM, discrete graphics card, and gigabit Ethernet LAN controller. Some air passing by the DIMM region will also flow by the bottom side of the ODD, keeping the drive device under its operating thermal specification. As illustrated in Figure 21 and Figure 22, a fraction of the heated air vents out through the bottom side of the ID bezel. The rest goes around the front panel and moves towards the FPIO assembly and the bottom side of the lower HDD, exiting the system through the HDD venting.
AIC
AIC
Drive Bay
ODD
External Air Being Pulled
In
ICH HDD
CPU Fan Partition
External Air Being Pulled
In
PSU
Heated Air from DIMM Region and Bottom Side of the ODD Exiting to the
Front Ventilations
Bezel ODD
DIMM
MB
RPIO

Case Study 1: 10.8L System Volume
28 microATX (µATX) Small Form Factor PC Case Studies
Figure 22 10.8L CFD Airflow Pattern Prediction – ODD, FPIO, and HDD
Figure 23 10.8L CFD Airflow Pattern Prediction – AIC Region
As illustrated in Figure 23, a significant amount of airflow that enters the CPU FHS will also exhaust past the (G) MCH heatsink and move towards the AIC region and ICH heatsink, eventually exiting through the PSU fan located next to the left hand side of the motherboard. A major pressure difference is created by the push-and-pull effect from the CPU FHS fan and PSU fan.
Simulated airflow streamlines through the AIC and HDD ventilations can be visualized in Figure 24. To avoid flow stagnations between the two add-in cards and in the corner of HDD near the left hand side panel, simulated ventilations on the AIC’s I/O blanks and near the HDD assembly have been proven effective.
ODD
Upper HDD
AIC
ICH
AIC
Heated Air Exiting the
Chassis
PSU Fan
GMCH HS below Partition
ID Bezel
Lower HDD
FPIO
ODD
PSU
MB
Cable
Cable
Bezel Ventilation
HDD Venting
Heated Air Exiting the
Chassis

Case Study 1: 10.8L System Volume
microATX (µATX) Small Form Factor PC Case Studies 29
Figure 24 10.8L CFD Airflow Pattern Prediction – AIC and HDD Ventilations
4.6.2 Predicted Thermal Performance
Thermal simulations were completed for the system profile modeled with an Intel® Q965/ICH8 µATX motherboard with Intel® Core™2 Duo processor. Table 3 is a summary of the results. It is important to keep in mind that these were system level simulations, where the predicted case temperatures for the component compact models such as GMCH and ICH were for reference only. The points of interest were on the component ambient temperatures. As the result summary shows, most components’ ambient temperatures are under the thermal specifications with the set fan speeds. However, ambient temperatures on HDD #0 (upper HDD), discrete graphics card’s approach region, and PSU fan’s inlet are over the targeted specifications by 0.5°C to 3.9°C in Case 3 (Maximum Load at 35°C). Since this use condition, in which every component in the system is at or near its thermal design power, is unlikely to occur in the real world, and the mentioned ambient temperatures of concern are still near the thermal targets, it is feasible and safe to move forth to build a mockup system based on the proposed concept. Nonetheless, as the analyses have shown the hard drive and AIC were the limiting components for the system fan speeds.
The predicted volumetric flows for the system ventilations are shown in Table 4, where “+” indicates air entering the system, and “-“ indicates air exiting the system. In all the cases analyzed the amount of heated air vented by the PSU fan accounts near or over 50% of the total volumetric flow. One fifth to one third of the total airflow coming into the system will vent through the ventilation next to the HDD’s. Though the amount of airflow through the AIC vent is about 7% of the total flow volume, the analysis shows that the ambient temperatures for the DIMM region and ODD are much below their thermal targets. For the Intermittent Use Condition, the flow direction through the AIC vent becomes positive (entering system) instead of staying negative (exiting system) because the high PSU fan speed combining with low CPU fan speed creates a low pressure region around the AIC’s relative to the external ambient next to the ventilation.

Case Study 1: 10.8L System Volume
30 microATX (µATX) Small Form Factor PC Case Studies
Table 3 10.8L Predicted Component Ambient Temperatures with Intel® Core™2 Duo processor
Component Thermal Specification
Case 1: Idle Low Load @
23℃ ambient
Case 2: Intermittent
Maximum Load @23℃ ambient
Case 3: Maximum Maximum
Load @ 35℃ ambient
CPU FHS Fan Speed (RPM) N/A 1200 2000 3200
PSU Fan Speed (RPM) N/A 1800 3600 3600
CPU FHS Inlet Ambient ≤ T_external + 5°C 25.1 25.2 36.6
Chipset (GMCH) Case Tcase ≤ 97°C 56.4 84.9 86.6
Chipset (GMCH) Ambient Tambient ≤ 47°C 34.4 39.1 45.9
ICH Case Tcase ≤ 95°C 66.9 73.0 71.8
ICH Ambient Tambient ≤ 60°C 41.8 46.5 52.0
Memory (Approach) Tambient ≤ 50°C 37.7 39.6 45.2
Memory (Channel) Tambient ≤ 70°C 40.6 54.2 56.3
Upper HDD Ambient Tambient ≤ 55°C 52.7 52.3 55.5
Lower HDD Ambient Tambient ≤ 55°C 47.9 49.0 51.9
Optical Disc Drive Ambient Tambient ≤ 50°C 36.5 33.3 40.4
Discrete Graphics Card Approach Tambient ≤ 55°C 48.5 54.8 55.7
PCI Card Approach Tambient ≤ 55°C 50.4 45.5 53.9
PSU Fan inlet Tambient ≤ 50°C 45.2 48.5 53.9
Table 5 shows the predicted operating points for the fans in each use condition, along with the fan speeds required. In the Maximum Use Condition (Case 3) the system’s thermal condition will demand that the CPU FHS fan and PSU fan operate at the maximum operating speed. Minimum operating speeds will be required in the Idle Use Condition (Case 1) to achieve good system acoustic performance. The Intermittent Use Condition would require the CPU fan operate at about 62.5% of its maximum speed, but the PSU fan will still remain at its full speed in order to fulfill the system’s thermal need.
Table 4 10.8L Predicted Vent Airflow (CFM)
Device Idle Intermittent Maximum
CPU FHS Fan Speed (RPM) 1200 2000 3200
FHS Inlet vent [FAR 50%] (CFM) +6.3 +11.4 +18.8
PSU Fan Speed (RPM) 1800 3600 3600
PSU vent (CFM) -3.1 -8.6 -8.7
DIMM/ODD vent [FAR 70%] (CFM) -0.5 -0.9 -1.4
HDD vent [FAR 50%] (CFM) -2.0 -2.7 -6.6
AIC vent [FAR 70%] (CFM) -0.6 +0.8 -2.1

Case Study 1: 10.8L System Volume
microATX (µATX) Small Form Factor PC Case Studies 31
Table 5 10.8L Predicted Fan Speed and Operating Point
Device Idle Typical Max Load
CPU FHS Fan Speed (RPM) 1200 2000 3200
CPU FHS Fan Flow (CFM) 8.5 15.1 25.0
CPU FHS Fan Operating Point (in-H2O) 0.014 0.037 0.090
PSU Fan Speed (RPM) 1800 3600 3600
PSU Fan Flow (CFM) 3.1 8.6 8.7
PSU Fan Operating Point (in-H2O) 0.032 0.117 0.116
Room Ambient (°C) 23 23 35
Advantage to the CPU fan partition implementation can be seen from the CFD analysis. For example, at 35°C external ambient (T_external), the inlet temperature (T_inlet) for the CPU fan can be more than 9°C higher than the external condition if the partition is removed. However, with the implementation of the partition on the same CFD analysis scenario, T_inlet is only 1.6°C higher than T_external. More than 7°C of inlet ambient reduction can be obtained by designing in a CPU fan partition.
Predicted Acoustic Performance
All the elements of the acoustic prediction have been described in previous sections. First, Equation 2 describes how the constituent noise sources can be used to predict the system noise. Second, Figure 7 in Section 2.5 can be used to determine the CPU FHS fan noise at fan speed required for each use condition. Finally, the PSU and HDD contributions were provided in Sections 4.4 and 4.5, respectively.
Table 6 shows component sound power information and prediction of the Idle system acoustic performance.
Table 6 10.8L Predicted System Sound Power (BA)
Use Condition
CPU Sound Power
PSU Sound Power
HDD Sound Power
System Sound Power
Idle 2.75 2.90* 2.90 3.33
NOTE: Fan law for noise was used to predict the PSU fan’s sound power based on fan supplier’s noise data for the fan at 3600rpm.
4.7 Actual Performance
Figure 25 is a picture of the prototype that was fabricated to correlate the numerical thermal and acoustic model predictions. The prototype was instrumented with thermocouples, which were placed at the same locations as the monitor points selected in the CFD model. Detailed test plan is described in Appendix A “SFF Concept Systems Prototype Chassis Thermal/Acoustic Test Plan.” Measured temperatures shown in Table 7 and Table 8 were within a few degrees of the predicted temperature (Table 3).

Case Study 1: 10.8L System Volume
32 microATX (µATX) Small Form Factor PC Case Studies
Figure 25 10.8L Prototype
Table 7 10.8L Measured Thermal Data [°C] at 23°C Ambient
Component Target Spec Idle CPU Maxpower
3DMark® 2005
HDD/HDD File
Transfer
ODD/HDD File
Transfer
FHS Fan Speed (RPM) 1000 2500 3200 1500 1500
PSU Fan Speed (RPM) 1820 3600 2400 2200 2200
CPU FHS Inlet 25.9 28.1 27.9 26.8 26.2
Processor Tcase≤60°C 36.2 53.0 42.3 36.1 34.8
Chipset (MCH) Tambient≤47°C 30.6 34.3 35.2 29.9 29.3
Chipset (MCH) Tcase≤97°C 50.4 50.6 55.3 47.4 47.1
Chipset (ICH) Tambient≤60°C 48.0 45.0 51.4 45.3 43.6
Chipset (ICH) Tcase≤92°C 63.7 59.4 62.6 61.0 59.1
DIMM Memory Tambient≤50°C 37.3 38.2 43.4 36.8 35.3
Graphics Card Tambient≤55°C 49.3 44.0 53.1 45.9 44.2
Tuner Card Tambient≤55°C 45.8 42.4 49.3 42.8 41.8
ODD Tambient≤45°C 35.0 35.4 36.2 33.1 32.9
ODD Tcase≤50°C 36.0 36.7 39.0 36.8 37.6
Upper HDD side Tambient≤55° 31.8 31.8 29.4 33.8 32.5
Upper HDD Tcase≤60°C 48.7 47.3 50.5 53.3 47.5

Case Study 1: 10.8L System Volume
microATX (µATX) Small Form Factor PC Case Studies 33
Component Target Spec Idle CPU Maxpower
3DMark® 2005
HDD/HDD File
Transfer
ODD/HDD File
Transfer
Lower HDD side Tambient≤55° 30.7 31.0 31.3 36.4 36.5
Lower HDD bottom Tambient≤55° 50.2 48.0 47.5 54.1 48.0
Lower HDD Tcase≤60°C 51.5 48.6 50.2 54.3 48.2
PSU Fan Inlet Tambient≤50°C 37.7 38.4 39.1 36.8 36.0
Table 8 10.8L Measured Thermal Data [°C] at 35°C Ambient
Component Target Spec CPU Maxpower
3DMark®2005
HDD/HDD File
Transfer
ODD/HDD File
Transfer
FHS Fan Speed (RPM) 3200 2500 2500 2000
PSU Fan Speed (RPM) 3600 3600 3125 3125
CPU FHS Inlet 38.7 39.3 38.6 39.1
Processor Tcase≤60°C 54.2 52.5 46.2 46.8
Chipset (MCH) Tambient≤47°C 41.4 42.0 40.1 40.9
Chipset (MCH) Tcase≤97°C 54.9 57.9 55.1 56.8
Chipset (ICH) Tambient≤60°C 49.6 53.0 50.6 53.0
Chipset (ICH) Tcase≤92°C 63.6 67.3 65.8 67.4
DIMM Memory Tambient≤50°C 44.7 47.0 44.6 46.0
Graphics Card Tambient≤55°C 49.7 53.1 51.5 53.2
Tuner Card Tambient≤55°C 50.2 51.8 49.9 50.4
ODD Tambient≤45°C 42.5 48.6 41.4 42.7
ODD Tcase≤50°C 44.9 57.5 45.8 49.8
Upper HDD side Tambient≤55° 48.0 48.6 49.4 44.7
Upper HDD Tcase≤60°C 56.3 57.7 59.9 57.6
Lower HDD side Tambient≤55° 47.6 46.3 45.7 46.1
Lower HDD bottom Tambient≤55° 55.0 57.3 60.0 56.9
Lower HDD Tcase≤60°C 55.5 57.5 60.1 56.9
PSU Fan Inlet Tambient≤50°C 45.8 47.8 45.4 46.2
The thermal data shows the majority of system components are well within thermal specification. Although AICs’ ambient is high, the measured values are still within the thermal target The two hard drives are very near or at the maximum allowed case temperature in the use conditions at 35°C ambient. The hard drives’ approach ambient air is well within specification in most operating cases; however the low volume of airflow (see Table 4) is allowing the drives to retain excessive heat. This is one trade off to achieve maximum acoustic performance. As the CFD analyses and the thermal tests have illustrated, the hard drives are the limiting components for the system fan speeds.

Case Study 1: 10.8L System Volume
34 microATX (µATX) Small Form Factor PC Case Studies
Acoustic performance was measured by running a fully functional prototype with the fan speeds being independently set to operate at the same speeds as those measured in the thermal tests. The system was then tested for the Idle Use Condition and 3DMark™05 graphics demo application as for a typical usage condition. The measurement was conducted at a certified acoustic laboratory equipped with a semi-anechoic chamber and instrumentation that meet ISO-3745 and ISO-7779. Sound power level of the system from ten measured sound pressure levels is determined according to ISO-3744.
Table 9 shows the measured A-weighted sound pressure level and sound power level. The sound pressure level in the Idle use condition was only 28.3dBA and sound power level was only 3.6BA.
Table 9 10.8L Measured Acoustic Performance
Use Condition
CPU Fan Speed (RPM)
PSU Fan Speed (RPM)
Measured Sound Pressure
Level (dBA)
Measured Sound Power
Level (BA)
Idle 1000 1820 28.3 3.6
3DMark®05 1200 2400 34.0 4.1
NOTE: Sound pressure level measurement from one single microphone positioned in front of the PC system according to ISO-7779
A second set of tests was conducted to determine the potential improvement if a second HDD was not included in the system design. To simulate this condition, the second HDD in the prototype system was turned off, and the measurement was repeated for the Idle condition. The result is described in Table 10.
Table 10 10.8L Measured Sound Pressure Level with One HDD
Use Condition
CPU Fan Speed (RPM)
PSU Fan Speed (RPM)
Measured Sound Pressure
Level (dBA)
Idle 1000 1820 27.8
4.8 Alternative Design Opportunity
To improve the HDDs’ ambient temperature by a further of 2~4°C, a 40mmx40mmx10mm 2-wire low speed fan can be implemented on the front panel of the chassis – right in front of the HDD cage as illustrated in Figure 26. The fan can be set to run constant at its minimum speed (e.g. 5DCV at 3800rpm). And, the additional sound pressure level to the Idle condition (with two HDD’s) is only 1.6dBA, resulting in nearly 30.0dBA.

Case Study 1: 10.8L System Volume
microATX (µATX) Small Form Factor PC Case Studies 35
Figure 26 10.8L Additional Fan to Improve HDD’s Ambient Temperature
§
40x40x10 fan

Case Study 2: 7.5L System Volume
36 microATX (µATX) Small Form Factor PC Case Studies
5 Case Study 2: 7.5L System Volume
The second case study was defined to understand the size and thickness reduction possible with using a slim optical drive (ODD) compared to the desktop ODD in the first case study. Figure 27 outlines the feature loading for this 89mm x 306mm x 278mm (thickness x width x depth) configuration. Note the inclusion of one standard slim Optical Disc Drive (ODD), Flex ATX PSU and low profile AIC components, a desirable characteristic for a PC be designed both digital office and digital home.
Figure 27 7.5L SFF µATX System Layout
5.1 Use Condition Power
Before describing the system layout, features, and performance, it is important to understand the component power loads expected for this particular system configuration. Table 13 describes the expected power loads in each use condition, along with the component temperature requirement. For some components, the temperature requirement has been simplified as an approach of ambient temperature requirement. The ambient requirement in these cases was derived from either detailed CFD numerical modeling or empirical testing that established a relationship between the component and ambient temperature.

Case Study 2: 7.5L System Volume
microATX (µATX) Small Form Factor PC Case Studies 37
Table 11 7.5L Component Temperature Targets and Use Condition Power Loads
Component Temperature Requirement
Idle Power (W)
Intermittent Power (W)
Maximum Power (W)
Processor T case ≤ 0.26xPower+43.2
32.5 65 65
Voltage Regulation 10.8 21.7 21.7
MCH 47C Ambient 11 28 28
ICH 60C Ambient 2.5 3.8 3.8
PSU 50C Inlet Ambient
59.5(60%) 77.7(70%) 77.7(70%)
Memory 50C/70C Ambient 0.5 1.9 1.9
PCI-E x16 55C Ambient 10 20 20
PCI 55C Ambient 3 5 5
HDD 55C Ambient 5 8.1 8.1
ODD 50C Ambient 3 5 5
Card Reader 50C Ambient 0.5 1 1
5.2 Component Placement
The standard components in this system profile include a microATX motherboard, memory, Intel® boxed FHS, Flex ATX PSU, Slim ODD, standard Desktop HDD, and two low profile add-in cards. Other non standard components include the media card reader and front panel I/O. Figure 28 shows the ISO view of the 7.5L SFF system. From Figure 29 to Figure 31, the system inside can be seen clearly when the top cover, front bezel and ODD/HDD bracket are removed. The ODD, HDD and partition are mounted on the bracket together for easy assembly, and it can be turned over simply when the user want to access the lower components. The main cable routings are below to the bracket and close to the axle. Note that the low profile PCIe and PCI cards direct plug onto the motherboard and no riser cards are required. The HDD is placed in front of the PSU.

Case Study 2: 7.5L System Volume
38 microATX (µATX) Small Form Factor PC Case Studies
Figure 28 Iso View of the 7.5L SFF System
Figure 29 Inside of the 7.5L SFF System

Case Study 2: 7.5L System Volume
microATX (µATX) Small Form Factor PC Case Studies 39
Figure 30 Lower Components of 7.5L SFF System
Figure 31 7.5L HDD/ODD/Partition Bracket

Case Study 2: 7.5L System Volume
40 microATX (µATX) Small Form Factor PC Case Studies
5.3 Front Panel Layout
The front panel layout can be seen in Figure 32. The interchangeable front panel allows the appearance of the system to be easily changed. This allows a color change or a different look for differentiation without retooling a completely new bezel.
Figure 32 7.5L Front Panel Design
5.4 Standard boxed Intel® Core™2 Duo FHS
In 7.5L SFF system, a standard boxed Intel® Core™2 Duo FHS is designed in, and easy getting a good thermal and acoustic performance in real test. Acoustic optimization of a thermal module targeted fan speed reduction through an improvement in the convective performance of the heatsink. With better convection, the required processor case temperature can be achieved with lower airflow and lower fan speed. Thirty party thermal suppliers can easily improve that by replacing a better copper column and heatsink shape, and the convective performance of the heatsink improvement and considerably lowing minimum and maximum fan speeds were possible. This acoustically optimized FHS was used on a 2006 Mainstream (65 watt) processor.
5.5 Power Supply Acoustic Optimization
Optimization of the Flex ATX PSU fan speed is important in this case, because the Flex PSU fan is small (40X10) and high speed (~9000RPM). It is noisier than CPU fan in

Case Study 2: 7.5L System Volume
microATX (µATX) Small Form Factor PC Case Studies 41
7.5L system. In this case study, we find out PSU fan has minimum impacts for system thermals in idle mode. It is not worth increasing the PSU fan speed to gain marginal improvements for ICH and AIC ambient temperatures. Carefully select a PSU fan with good speed control in all regions to keep the PSU fan speed low in idle mode and still maintain adequate speed in Maximum load mode. In other system configurations, PSU fan may be set to cool the PSU only. In this case, the PSU can be configured such that cooler external air is ducted into the PSU inlet. By reducing the maximum air temperature into PSU, the overall PSU fan speed variation can be reduced.
5.6 Hard Disk Drive (HDD) Acoustic Optimization
A high performance 250G HDD units were selected for the SFF system. The particular model selected comes with fluid bearings to minimize the source noise. Isolation mounts were inserted between the HDD and its retaining bracket to minimize potential noise contribution from structural resonance.
Reducing the HDD speed can improve the HDD acoustic noise, but it affects the HDD performance directly. Consult with your software and firmware engineers to help you manage the HDD in performance or quiet mode.
The HDD’s were independently tested in an acoustic chamber within the system in HDD idle mode and noise levels of 23.2 dBA for one HDD and 25.5 dBA for two HDD’s were recorded.
5.7 Numerical Model Construction and Design Optimization
A Computational Fluid Dynamic (CFD) numerical model was constructed based on the design illustrated in Figure 33 and run for each use condition to predict the airflow and temperature behavior.
FHS and PSU fan curves were generated by testing the FHS and PSU assemblies at incremental fan speeds on a wind tunnel. These fan curves were used in the numerical model. For each placement and ventilation option evaluated, fan curves were scaled until the CFD model indicated that subsystem temperatures were compliant with their requirements. From these scaled fan curves, fan speeds can be determined. The PSU fan speed can be determined by comparing the required PSU airflow to the tested PSU fan curves. The FHS fan speed can be determined by comparing intersection of the FHS fan curve with the CFD model predicted system impedance. Component placement and ventilation position options were evaluated in the numerical model to ensure that the design was optimized prior to the construction and testing of a prototype. Inlet ventilation for the FHS is illustrated in Figure 34. Considering that a monitor may be placed on the system when it is in desktop position, there is no ventilation on top of the system.
The location of exhaust vents is also critical to performance. The AIC exhaust illustrated in ensures that there is minimal stagnation and temperature rise in not only the AIC area, but also in the ICH ambient and PSU inlet area. The ODD/DIMM exhaust vent illustrated in Figure 35 is critical for memory and ODD temperature.

Case Study 2: 7.5L System Volume
42 microATX (µATX) Small Form Factor PC Case Studies
Figure 33 7.5L CFD Model
Figure 34 7.5L Ventilation: FHS and AIC Venting Design

Case Study 2: 7.5L System Volume
microATX (µATX) Small Form Factor PC Case Studies 43
Figure 35 7.5L Ventilation: Front Exhaust
5.7.1 Airflow Patterns
The predicted airflow pattern in this system profile is illustrated in figures below. Air is drawn into the system by the FHS through CPU inlet vents (illustrated in Figure 34). A partition plate with a round hole slightly larger than the FHS diameter is attached to the HDD/ODD bracket. The hole location is aligned with the FHS fan such that when the bracket closes the FHS fan extends to the system upper compartment through the hole. The plate can serve as a partition minimizing recirculation of internal heated air back into the FHS inlet. The airflow that enters the FHS will exhaust omni-directionally past the components around the FHS cooling the VR, MCH, DC/DC converter, and DIMMs. The air stream then flows to the front due to the presence of the GFX card and cools the ODD. A fraction of air vents out from the front bezel. The rest goes around the front and top edge of the GFX card and moves towards the rear side of the system due to the PSU fan suction and AIC vents. The components along this airflow path including HDD, ICH, and the PCI-Express card are then cooled.

Case Study 2: 7.5L System Volume
44 microATX (µATX) Small Form Factor PC Case Studies
Figure 36 7.5L CFD Airflow Pattern Prediction
Figure 37 7.5L Partition to Prevent Recirculation
Advantages of the partition can be seen from the CFD analysis results shown in Figure 37. Recirculation is minimized. Quantitatively, for example, at 35°C external ambient (T_external), the inlet temperature (T_inlet) for the CPU fan can be 10°C higher than the external ambient, if there is no partition. With the implementation of the partition, T_inlet is only 1.1°C higher than T_external from CFD analysis.

Case Study 2: 7.5L System Volume
microATX (µATX) Small Form Factor PC Case Studies 45
Figure 38 7.5L CFD Airflow Pattern Prediction
5.7.2 Predicted Thermal Performance
Thermal simulations were completed originally using a 965G/ICH8 Motherboard with a Intel® Core™2 Duo mainstream processor. Table 12 shows the predicted component and ambient temperatures from the CFD model. Note that these were system level simulations where component compact models were used meaning the predicted component temperatures are for reference only. The point of interest is on the component ambient temperatures. The Graphics Card approach ambient temperature was the only one ambient temperature over spec, which is shown in red in the table. The graphics card represents the limiting component for the FHS fan and system fan speeds. The rest of the component ambient temperatures are all well below the specifications.
Table 12 7.5L Predicted Component Temperatures with Mainstream Intel® Core™2 Duo Processor

Case Study 2: 7.5L System Volume
46 microATX (µATX) Small Form Factor PC Case Studies
Component Thermal Specification
Case 1: Idle Low Load @
23℃ ambient
Case 2: Intermittent
Maximum Load @23℃ ambient
Case 3: Maximum Maximum
Load @ 35℃ ambient
CPU FHS Fan Speed (RPM) N/A 1200 2000 3200
PSU Fan Speed (RPM) N/A 4000 6000 8000
Processor Tcase Tcase ≤ (P*0.26) +
43.2°C 46.8 48.1 59.1
Chipset (GMCH) Case Tcase ≤ 97°C 55.6 54 58.1
ICH Case Tcase ≤ 95°C 66.5 69.8 67.8
Memory (Approach) Tambient ≤ 50°C 44.2 43.4 45.8
Memory (Channel) Tambient ≤ 70°C 57.9 63.2 66.2
HDD Ambient Tambient ≤ 55°C 54.8 46.8 55.1
Optical Disc Drive Ambient Tambient ≤ 50°C 41.2 42.1 41.6
Discrete Graphics Card Approach Tambient ≤ 55°C 59.5 60.2 63.1
PCI Card Approach Tambient ≤ 55°C 47.9 51.9 52.5
PSU Fan inlet Tambient ≤ 50°C 46 48 49
5.8 Actual Performance
Figure 39 is a picture of the prototype that was fabricated to correlate the numerical thermal and acoustic model predictions. The prototype was instrumented with thermocouples, which were placed at the same locations as the monitor points selected in the CFD model.
Detailed test plan is described in Appendix A “SFF Concept Systems Prototype Chassis Thermal/Acoustic Test Plan.”

Case Study 2: 7.5L System Volume
microATX (µATX) Small Form Factor PC Case Studies 47
Figure 39 7.5L Prototype
Table 13 and Table 14 show the measured temperatures of the SFF 7.5L system for thermal test profiles, that represent the 5 thermal test scenarios at 23°C and 35°C ambient. The measured temperatures have been normalized and adjusted for the ambient temperatures designated for the thermal validation. Note that the fan speeds are different from those defined in the numerical models. As described in previous section, the predicted component temperatures were for reference only. The actual fan speeds had to be adjusted to make the components meet their specifications nevertheless the adjustments were modest. The predicted temperatures show good agreement with the measured temperatures and the differences were within a few degrees.
Table 13 7.5L Measured Thermal Data [°C] at 23°C Ambient
Component Target Spec Idle CPU
Maxpower 3DMark®
2005 HDD/HDD
File Transfer
ODD/HDD File
Transfer
CPU FHS Fan Speed 1400 2000 1800 1500 1500
PSU Fan Speed 5V 12V 8V 6.5V 6.5V
Estimated CPU Power 59.0 33.0
Average Chassis Inlet Ambient
23 23 23 23 23
CPU Fan Inlet Ambient #1 30.0 29.6 30.2 27.6 27.6
CPU Fan Inlet Ambient #2 24.9 23.9 24.2 22.7 22.7
CPU Fan Inlet Ambient #3 23.7 24.5 24.1 23.5 23.6

Case Study 2: 7.5L System Volume
48 microATX (µATX) Small Form Factor PC Case Studies
Component Target Spec Idle CPU
Maxpower 3DMark®
2005 HDD/HDD
File Transfer
ODD/HDD File
Transfer
CPU Fan Inlet Ambient #4 31.5 31.3 32.0 29.5 29.6
Average CPU Fan Inlet Ambient
27.5 27.3 27.6 25.8 25.9
CPU T case T case ≤
0.26xPower+43.2
40.4 58.4 46.7 38.4 38.0
GMCH Inlet Ambient #1 47°C 39.2 42.7 40.3 35.3 35.3
GMCH Inlet Ambient #2 47°C 38.5 43.3 39.7 36.3 36.2
GMCH Inlet Ambient #3 47°C 39.6 42.3 39.1 36.7 36.6
Average GMCH Inlet Ambient 47°C 39.1 42.8 39.7 36.1 36.0
GMCH T case 97°C 54.5 55.7 54.6 51.6 51.6
ICH Inlet Ambient #1 60°C 56.5 53.3 55.1 52.7 52.7
ICH Inlet Ambient #2 60°C 59.2 57.5 57.0 58.5 58.5
ICH Inlet Ambient #3 60°C 63.6 59.7 60.6 61.0 61.0
Average GMCH Inlet Ambient 60°C 59.8 56.8 57.6 57.4 57.4
ICH T case 92°C 72.2 67.5 69.7 68.4 68.4
DIMM Ambient #1 50°C 35.8 40.4 36.8 33.1 32.9
DIMM Ambient #2 70°C 36.9 39.5 37.2 34.4 34.4
DIMM Ambient #3 50°C 50.3 50.2 50.0 48.1 47.7
GFX Ambient 55°C 54.6 58.0 65.2 51.7 52.1
GFX T case 105°C 77.9 79.0 103.5 74.4 73.8
TV tuner card Ambient #1 55°C 48.8 52.2 53.7 49.1 49.0
HDD Ambient #1 55°C 48.1 45.4 46.7 45.4 44.4
HDD Ambient #2 55°C 38.4 40.7 39.0 36.6 36.5
HDD T case 60°C 51.6 50.4 51.1 53.7 50.2
ODD Ambient #1 50°C 36.1 38.5 36.6 34.0 35.8
ODD Ambient #2 50°C 24.4 36.3 35.3 33.4 38.9
PSU Inlet Ambient #1 50°C 46.1 46.3 47.7 46.5 45.7
PSU Inlet Ambient #2 50°C 46.9 49.9 51.1 46.5 46.6
PSU Inlet Ambient Average 50°C 46.5 48.1 49.4 46.5 46.1
Table 14 7.5L Measured Thermal Data [°C] at 35°C Ambient
Component Target Spec CPU Maxpower
3DMark®2005
HDD/HDD File Transfer
ODD/HDD File Transfer
CPU FHS Fan Speed 3200 3000 2800 2800 PSU Fan Speed 12V 12V 10V 10V

Case Study 2: 7.5L System Volume
microATX (µATX) Small Form Factor PC Case Studies 49
Component Target Spec CPU Maxpower
3DMark®2005
HDD/HDD File Transfer
ODD/HDD File Transfer
Estimated CPU Power 59.1 32.4 Average Chassis Inlet Ambient 35.0 35.0 35.0 35.0
CPU Fan Inlet Ambient #1 38.3 37.6 36.9 37.1 CPU Fan Inlet Ambient #2 36.8 36.6 35.8 35.8 CPU Fan Inlet Ambient #3 37.2 37.0 36.1 36.1 CPU Fan Inlet Ambient #4 41.1 40.3 39.3 39.5
Average CPU Fan Inlet Ambient 38.4 37.9 37.0 37.1
CPU T case T case ≤
0.26xPower+43.2
58.51/(59.74) 48.96/(52.28) 43.8 43.8
GMCH Inlet Ambient #1 47°C 43.9 41.0 39.4 39.4 GMCH Inlet Ambient #2 47°C 44.6 41.4 39.8 39.9 GMCH Inlet Ambient #3 47°C 44.4 41.2 39.6 39.8
Average GMCH Inlet Ambient 47°C 44.3 41.2 39.6 39.7 GMCH T case 97°C 56.4 53.9 51.9 52.1
ICH Inlet Ambient #1 60°C 53.0 50.7 49.5 49.6 ICH Inlet Ambient #2 60°C 55.9 53.8 52.6 52.9 ICH Inlet Ambient #3 60°C 57.9 55.9 54.9 55.1
Average GMCH Inlet Ambient 60°C 55.6 53.5 52.3 52.5 ICH T case 92°C 65.9 63.9 62.9 63.1
DIMM Ambient #1 50°C 43.6 40.7 39.1 39.2 DIMM Ambient #2 70°C 43.2 41.1 39.5 39.9 DIMM Ambient #3 50°C 50.8 49.3 47.8 48.0
GFX Ambient 55°C 59.0 64.2 55.7 55.9 GFX T case 105°C 71.0 86.8 68.2 68.4
TV tuner card Ambient #1 55°C 52.7 53.2 49.4 49.6 HDD Ambient #1 55°C 47.3 45.3 44.3 44.1 HDD Ambient #2 55°C 44.0 41.8 40.6 40.8
HDD T case 60°C 52.9 51.2 53.2 50.7 ODD Ambient #1 50°C 42.2 40.1 38.8 39.8 ODD Ambient #2 50°C 42.6 40.8 40.3 43.7
PSU Inlet Ambient #1 50°C 48.1 45.8 45.0 44.9 PSU Inlet Ambient #2 50°C 51.2 49.7 47.6 47.7
PSU Inlet Ambient Average 50°C 49.6 47.8 46.3 46.3
The thermal data shows the majority of system components are well within thermal specification. Only the ICH and GFX ambient temperature are over their specifications, even their case temperatures are still fine. These issues can be improved by increasing the fan speed or change the venting design. But the low volume of airflow is allowing the chipsets to retain excessive heat. This is an acceptable trade off to achieve maximum acoustic performance and part of the strategy used with Intel® Quiet System Technology.
Table 15 shows the acoustic performance was measured by building a fully functional prototype with functional components. The system was then tested using the Idle and

Case Study 2: 7.5L System Volume
50 microATX (µATX) Small Form Factor PC Case Studies
Intermittent cases and fans were independently set to operate at the same speeds as those used in thermal validation by external power supplies. Detailed test plan is described in “SFF Concept Systems Prototype Chassis Thermal/Acoustic Test Plan.”
The sound pressure level in the Idle use condition was only 26dBA and sound power level was only 3.4BA
Table 15 7.5L Measured Sound Pressure and Sound Power Level
Fan Mode
Operating Mode
CPU Fan Speed [rpm]
PSU Fan Speed [rpm]
Sound Pressure
Level [dBA]*
Sound Power
Level [BA]
Manual Idle 1400 2900 26.0 3.4
Manual Typical (3DMark05) 1900 3500 31.3 3.9
5.9 Alternative Design
Between 10.8L and 7.5L systems, it is reasonable to have some different alternative designs for the ingredients price or available issues. Try to replace the Flex ATX PSU (7.5L) with the TFX one (10.8L), or change the slim ODD to the standard one. All give you more thinking for different customers’ cost or volume requests. From our studies, replaces Flex ATX PSU to TFX one for 7.5L system, the new system volume will be close to 9L. Because of the TFX PSU has a bigger fan (80mm) and better adoption rate in market, both the price and acoustic performance will be better. The ODD type change will have more issue in MB Z-direction violation and make the system deeper. The all standard ingredients design of a µATX platform, the volume limitation is close to 10L.
§

Case Study 3: 5.8L System Volume
microATX (µATX) Small Form Factor PC Case Studies 51
6 Case Study 3: 5.8L System Volume
The third case study was defined to understand the minimum size that could be achieved with µATX motherboards using standard desktop HDD while targeting optimal acoustic performance and feature loading.
This system profile takes advantage of the lower processor power to achieve a reduced height FHS Figure 40 outlines the feature loading for this 77mm x 277mm x 273mm (thickness x width x depth) configuration.
Figure 40 5.8L uSFF µATX System Layout
6.1 Use Condition Power
Before describing the system layout, features, and performance, it is important to understand the component power loads expected for this particular system configuration. Table 16 describes the expected power loads in each use condition, along with the component temperature requirement. For some components, the temperature requirement has been simplified as an approach ambient temperature requirement. The ambient requirement in these cases was derived from either detailed CFD numerical modeling or empirical testing that established a relationship between the component and ambient temperature.

Case Study 3: 5.8L System Volume
52 microATX (µATX) Small Form Factor PC Case Studies
Table 16 5.8L Component Temperature Targets and Use Condition Power Loads
Component Temperature Requirement
Idle Power (W)
Intermittent Power (W)
Maximum Power (W)
Processor Tcase = (P*0.26) +
43.2
32.5 65 65
Voltage Regulation 10.8 21.7 21.7
MCH 47C Ambient 11 28 28
ICH 50C Ambient 2.5 3.8 3.8
DC-DC Converter 6 10 10
Memory (x4 DIMM’s)
50C Ambient 0.5 1.9 1.9
PCI-E x16 55C Ambient 10 20 20
HDD 55C Ambient 5 8.1 8.1
ODD 50C Ambient 1 3 3
6.2 Component Placement
The standard components in this system profile include a microATX motherboard, memory, Slim ODD, standard Desktop HDD, system fan, and low profile PCI-Express x 16 add-in card. Other non standard components include a reduced height Fan heat sink (FHS), media card reader, front panel I/O, riser card, and PCI-E card. Figure 41 shows the isometric view of the 5.8L uSFF system. The inside of the system can be clearly seen when the top cover and the front bezel are removed as shown in Figure 42. There is an ODD/HDD bracket separating the chassis into two compartments as shown in Figure 43. The ODD and HDD are mounted on the bracket in the upper compartment and the bracket can be swung up for access to the lower compartment where the motherboard resides in.
Figure 44 shows the lower compartment when the ODD/HDD bracket is removed. The PCI-E card on riser is placed right underneath the HDD. The system fan is mounted on the chassis left rear corner on the side wall close to the PCI-E card to ensure adequate air flow over the card for cooling. The system fan venting is facing down towards the surface where the system is placed in tower position. Therefore stands are used to keep a gap between the venting and the surface. The DC-DC converter is mounted on the chassis right wall close to the FHS to take the advantage of its exhaust air for cooling.

Case Study 3: 5.8L System Volume
microATX (µATX) Small Form Factor PC Case Studies 53
Figure 41 Iso View of the 5.8L uSFF System
Figure 42 Inside of the 5.8L uSFF System
Slim ODD
7015 System Fan
HD
Media Card Reader
Front Panel I/O

Case Study 3: 5.8L System Volume
54 microATX (µATX) Small Form Factor PC Case Studies
Figure 43 5.8L ODD/HDD Bracket
Figure 44 Lower Compartment of 5.8L uSFF System
ODD Bracket
HDD Bracket
Air Baffle
Partition
DC-DC Converter
LP PCI-E x16 AIC on Riser
µATX MB
Reduced Height FHS

Case Study 3: 5.8L System Volume
microATX (µATX) Small Form Factor PC Case Studies 55
6.3 Front Panel Layout
The front panel layout is illustrated in Figure 45. The front bezel is a tooless, interchangeable design. It can be easily removed for access to the system. The ODD is placed in the upper right corner when the system is in desktop position or upper left corner when the system is in tower position. This prevents the ODD tray from hitting the keyboard typically placed in front of the system during loading and unloading disks. The front panel I/O with USB, 1394 and audio, and the media card reader are placed side by side in the lower left corner of the front panel when viewed in desktop position. Together with the ODD, these two components form an “S” shape pattern on the front panel. The power switch is located in lower right corner for most people are right-handed.
Figure 45 5.8L Front Panel Design
6.4 Reduced Height CPU Fan Heat Sink
One of the goals of this uSFF system is to minimize its volume. The most effective way to reduce the volume is to make the system as slim as possible. A slim system with only 77mm in height is then realized. As a result, the motherboard top to chassis clearance is only 67.4mm whereas it is 3” (76.2mm) as specified in “microATX Motherboard Interface Specification”. Most off shelf ATX FHS can not fit in this tight space and their heights have to be reduced. The height reduction ranges from 5mm to 10mm depending on their original heights and can still meet the thermal requirements of the processor with little to no acoustics impact.
Slim ODD
Front panel I/O with USB, 1394 and audio,
Media Card Reader
Power Switch

Case Study 3: 5.8L System Volume
56 microATX (µATX) Small Form Factor PC Case Studies
6.5 Power Supply Design and Acoustic Optimization
The use of an external AC adapter with passive cooling provides a quiet power supply solution. There is no fan in the AC adapter to add to the acoustic signature of the system. The use of an external AC adapter requires that the DC\DC voltage conversion take place internal to the system. This can be accomplished with the regulation components placed directly on the MB. It can also be accomplished by using a separate DC\DC voltage converter assembly as shown in Figure 46. This approach was used in the concept system to allow a standard MB to be utilized without modification.
To provide an optimum mechanical fit and placement within the system, the main power connector was extended on a cable. This allowed remote placement of the DC converter board from the motherboard main power connector. The DC\DC conversion is approximately 95% efficient. With the AC adapter this provides an overall power supply efficiency of over 81%.
Figure 46 DC\DC Converter Assembly
6.6 Hard Disk Drive (HDD) Acoustic Optimization
A high performance 250G HDD unit was selected for the PC prototype. The particular model selected comes with fluid bearings to minimize the source noise. Isolation mounts were inserted between the HDD and its retaining bracket to minimize potential noise contribution from structural resonance.
6.7 Numerical Model Construction and Design Optimization
A Computational Fluid Dynamic (CFD) numerical model was constructed based on the design illustrated in Figure 47 and run for each use condition to predict the airflow and temperature behavior.
There are two fans in the system, the FHS fan and the system fan. Both fan curves are needed for thermal simulation. The system fan curves of different fan speeds are

Case Study 3: 5.8L System Volume
microATX (µATX) Small Form Factor PC Case Studies 57
readily available since most fan vendors provide fan curves in their product specifications. FHS effective fan curves were generated by testing the FHS at three fan speeds on a wind tunnel. Fan laws were used to create fan curves of those speeds that were not specified in the system fan specification and those that were not tested for the FHS fan. The FHS effective fan curves and the system fan curves were used in the numerical model. For each placement and ventilation option evaluated, fan curves were scaled until the CFD model indicated that subsystem temperatures were compliant with their requirements. From these scaled fan curves, fan speeds can be determined.
Component placement and ventilation position options were evaluated in the numerical model to ensure that the design was optimized prior to the construction and testing of a prototype. Inlet ventilation for the FHS is illustrated in Figure 48. Considering that a monitor may be placed on the system when it is in desktop position, there is no ventilation on top of the system.
Figure 47 5.8L CFD Model

Case Study 3: 5.8L System Volume
58 microATX (µATX) Small Form Factor PC Case Studies
Figure 48 5.8L Ventilation: FHS Inlet and Under Motherboard Exhaust
Figure 49 5.8L Ventilation: System Fan Exhaust and Front Bezel Exhaust
The location of exhaust vents is also critical to performance. The under motherboard exhaust illustrated in Figure 48 ensures that there is minimal stagnation under the motherboard. The system fan exhaust may be facing down to the desktop while the system is in tower position as shown in Figure 49, which is the worst operating
FHS Inlet
Under Motherboard Exhaust
FHS Inlet
System Fan Exhaust
Front Bezel Exhaust

Case Study 3: 5.8L System Volume
microATX (µATX) Small Form Factor PC Case Studies 59
condition for the system fan. The free air ratio of the exhaust has to be reduced accordingly in the numerical model.
6.7.1 Airflow Patterns
The predicted airflow pattern in this system profile is illustrated in Figure 50 below. Air is drawn into the system by the FHS through the FHS inlet vents (illustrated in Figure 48). A Mylar plate with a round hole slightly larger than the FHS diameter is attached to the HDD/ODD bracket. The hole location is aligned with the FHS fan such that when the bracket closes the FHS fan extends to the system upper compartment through the hole. The plate can serve as a partition minimizing recirculation of internal heated air back into the FHS inlet. The airflow that enters the FHS will exhaust omni-directionally past the components around the FHS cooling the VR, MCH, DC/DC converter, and DIMMs. The air stream then flows to the front due to the presence of the riser card and cools the ODD. A fraction of air vents out from the front bezel. The rest goes around the front edge of the riser card and moves towards the rear side of the system due to the system fan suction. The components along this airflow path including HDD, ICH, and the PCI-Express card are then cooled.
Figure 50 5.8L Partition to Prevent Recirculation

Case Study 3: 5.8L System Volume
60 microATX (µATX) Small Form Factor PC Case Studies
Figure 51 5.8L CFD Airflow Pattern Prediction
6.7.2 Predicted Thermal Performance
Thermal simulations were completed originally using a 965G/ICH8 Motherboard with a Intel® Core™2 Duo mainstream processor. Table 17 shows the predicted component and ambient temperatures from the CFD model. Note that these were system level simulations where component compact models were used meaning the predicted component temperatures are for reference only. The point of interest is on the component ambient temperatures. The Graphics Card Approach ambient temperature was the only one ambient temperature over spec, which is shown in red in the table. The graphics card represents the limiting component for the FHS fan and system fan speeds. The rest of the component ambient temperatures are all well below the specifications.
The predicted vent airflow is shown in Table 18 where “+” indicates the airflow coming into the system and “-“ indicates the airflow coming out of the system. In Max Load and Intermittent case, only less than 8% of the net airflow into the system came out from the front bezel exhaust, but it was adequate to cool the ODD and memory. Airflow venting out from the under motherboard exhaust accounted only a very small fraction of the total FHS inlet airflow. In the Idle case, the airflow rates of both front bezel exhaust and under motherboard exhaust became positive indicating they were turned into inlet vents nevertheless the values were small.

Case Study 3: 5.8L System Volume
microATX (µATX) Small Form Factor PC Case Studies 61
Table 17 5.8L Predicted Component Temperatures with Mainstream Intel® Core™2 Duo Processor
Component Target Spec Idle Power Intermittent Power Max Power
FHS Fan Speed (RPM) N/A 850 2000 3500
System Fan Speed (RPM) N/A 1500 2800 4100
Processor Tcase Tcase ≤ (P*0.26)
+ 43.2°C 45.6 55.0 60.9
Chipset (MCH) Tambient ≤ 47 °C 38.8 37.4 43.6
ICH Tambient ≤ 60 °C 45.7 49.2 51.0
Memory (Approach) Tambient ≤ 50 °C 43.2 45.9 49.7
Memory Channel Tambient ≤ 70 °C 46.8 57.6 58.8
Graphics Card Approach Tambient ≤ 55 °C 53.3 55.1 54.4
Hard Disc Drive Tambient ≤ 55 °C 45.5 50.3 50.9
Optical Disc Drive Tambient ≤ 50 °C 40.5 43.3 47.7
Table 18 5.8L Predicted Vent Airflow (CFM)
Device Idle Intermittent Max Load
FHS Inlet (total) +4.81 +10.1 +16.56
Front Bezel Exhaust +0.21 -0.49 -1.31
Under Motherboard Exhaust +0.03 -0.05 -0.22
System Fan Exhaust -5.06 -9.56 -15.0
Table 19 shows the predicted operating point and flow balance in each use condition, along with the fan speeds required. In the Maximum Use Condition the Fan Speed Control circuit will demand that the FHS and system fan operate at the maximum operating speed. Minimum operating speeds will be dictated in the Idle Use Condition. The Intermittent Use Condition would require that the FHS and system fans operate above its minimum speed. It can be found from Table 19 and Table 18 that the FHS Fan Flow is always greater than Inlet airflow in all three cases indicating the occurrence of air recirculation. The partition did help reduce the intensity of recirculation.
Table 19 5.8L Predicted Fan Speed and Operating Point
Device Idle Intermittent Max Load
FHS Fan Speed (RPM) 850 2000 3500
FHS Fan Flow (CFM) 5.20 13.33 23.90
FHS Fan Operating Point (“ H2O) 0.0095 0.0414 0.1251
System Fan Speed (RPM) 1500 2800 4100
System Fan Flow (CFM) 5.99 11.21 17.26

Case Study 3: 5.8L System Volume
62 microATX (µATX) Small Form Factor PC Case Studies
Device Idle Intermittent Max Load
System Fan Operating Point (“ H2O)
0.0163 0.0518 0.1081
Room Ambient (°C) 23 23 35
6.8 Actual Performance
Figure 52 is a picture of the prototype that was fabricated for thermal and acoustics performance measurement. All materials and components used for the prototype were those intended for real practice.
Figure 52 5.8L Prototype
6.8.1 Thermal Validation
The prototype was used to correlate the numerical thermal model predictions. It was instrumented with thermocouples, which were placed at the same locations as the monitor points selected in the CFD model. Table 28 shows the system thermal test profiles. Operating Mode #4 and #5 were not performed since they were less thermally stressful than Operating Mode #2 for both ODD and HDD gauging from the thermal validation results of the 10.8L and 7.5L systems. Operating Mode #2 is the

Case Study 3: 5.8L System Volume
microATX (µATX) Small Form Factor PC Case Studies 63
worst case scenario. Detailed test plan is described in Appendix A “SFF Concept Systems Prototype Chassis Thermal/Acoustic Test Plan.”
Table 20 shows the measured temperatures for Operating Mode #1, #2, and #3 at 23°C ambient Temperature. Table 21 shows the measured temperatures for Operating Mode #2 and #3 at 35°C ambient Temperature. The measured temperatures have been normalized and adjusted for the ambient temperatures designated for the thermal validation. Note that the fan speeds are different from those defined in the numerical models. As described in previous section, the predicted component temperatures were for reference only. The actual fan speeds had to be adjusted to make the components meet their specifications nevertheless the adjustments were modest.
Table 20 5.8L Measured Thermal Data [°C] at 23°C Ambient
Component Target Spec Idle CPU Maxpower
3DMark® 2005
HDD/HDD File
Transfer
ODD/HDD File
Transfer
FHS Fan Speed (RPM)
1000 1200 2100
N/A N/A
PSU Fan Speed (RPM)
820 1300 1100
N/A N/A
CPU FHS Inlet 26.7 27.5 28.5 N/A N/A
Processor Tcase≤60°C 38.7 47.7 57.4 N/A N/A
Chipset (MCH) Tambient≤47°C 33.9 36.1 38.6 N/A N/A
Chipset (MCH) Tcase≤97°C 51.2 53.3 51.4 N/A N/A
Chipset (ICH) Tambient≤60°C 57.2 58.3 52.7 N/A N/A
Chipset (ICH) Tcase≤92°C 71.1 71.2 68.7 N/A N/A
DIMM Memory Tambient≤50°C 40.6 43.9 42.6 N/A N/A
Graphics Card Tambient≤55°C 49.9 49.7 47.9 N/A N/A
ODD Rear Tambient≤45°C 34.4 35.9 40.1 N/A N/A
ODD Bottom Tambient≤45°C 35.0 36.9 39.1 N/A N/A
HDD Rear Tambient≤55° 43.6 41.0 46.1 N/A N/A
HDD Bottom Tambient≤55° 48.2 44.5 48.4 N/A N/A
HDD Tcase≤60°C 47.7 45.9 48.9 N/A N/A
System Fan Inlet Tambient≤50°C 38.3 39.7 42.6 N/A N/A
Table 21 5.8L Measured Thermal Data [°C] at 35°C Ambient
Component Target Spec CPU Maxpower
3DMark®2005
HDD/HDD File
Transfer
ODD/HDD File
Transfer
FHS Fan Speed (RPM) 2800 4000 N/A N/A
PSU Fan Speed (RPM) 1300 1600 N/A N/A
CPU FHS Inlet 37.1 38.3 N/A N/A

Case Study 3: 5.8L System Volume
64 microATX (µATX) Small Form Factor PC Case Studies
Component Target Spec CPU Maxpower
3DMark®2005
HDD/HDD File
Transfer
ODD/HDD File
Transfer
Processor Tcase≤60°C 53.0 57.2 N/A N/A
Chipset (MCH) Tambient≤47°C 41.3 42.2 N/A N/A
Chipset (MCH) Tcase≤97°C 53.8 51.4 N/A N/A
Chipset (ICH) Tambient≤60°C 57.1 50.0 N/A N/A
Chipset (ICH) Tcase≤92°C 71.7 64.6 N/A N/A
DIMM Memory Tambient≤50°C 47.8 45.2 N/A N/A
Graphics Card Tambient≤55°C 48.0 48.3 N/A N/A
ODD Rear Tambient≤45°C 43.5 44.2 N/A N/A
ODD Bottom Tambient≤45°C 43.0 43.4 N/A N/A
HDD Rear Tambient≤55° 48.5 49.3 N/A N/A
HDD Bottom Tambient≤55° 46.0 48.1 N/A N/A
HDD Tcase≤60°C 50.6 51.6 N/A N/A
System Fan Inlet Tambient≤50°C 46.2 47.5 N/A N/A
6.8.2 Acoustic Noise Level Measurement
Acoustic performance was measured by building a fully functional prototype with functional components. The system was then tested using the Idle and Intermittent cases and fans were independently set to operate at the same speeds as those used in thermal validation by external power supplies. Detailed test plan is described in “SFF Concept Systems Prototype Chassis Thermal/Acoustic Test Plan.”
Table 22 shows the measured sound pressure and sound power level. The sound pressure level in the Idle use condition was only 25.4dBA and sound power level was only 3.4BA. For typical mode, the sound pressure level was 31.3dBA and the sound power level was 3.9BA.
Table 22 5.8L Measured Sound Pressure and Sound Power Level
Fan Mode
Operating Mode
CPU Fan Speed [rpm]
System Fan Speed [rpm]
Sound Pressure
Level [dBA]*
Sound Power
Level [BA]
Manual Idle 1000 820 25.4 3.4
Manual Typical
(3DMark05) 2100 1100 31.3 3.9
§

Summary
microATX (µATX) Small Form Factor PC Case Studies 65
7 Summary
7.1 Summary of the Three Case Studies
Table 23 is a summary of the three case studies. The acoustics data is summarized in Table 24.
Table 23 Summary of the Three Case Studies
Feature 5.8L System 7.5L System 10.8L System
Height 77 (3.0”) 89 (3.5”) 96 (3.8”)
Width 277 (10.9”) 306(12.0”) 330 (13.0”)
Chassis Dimension
in mm (in) Depth 273 (10.8”) 280 (11.7”) 343 (13.5”)
Motherboard Form Factor µATX µATX µATX
Optical Drive Slim ODD Slim ODD DT ODD
Hard Disk Drive 1 DT HDD 1 DT HDD 1-2 DT HDD
Card Reader Optional Optional Optional
PSU External Flex ATX TFX
Add in Cards 1 LP on riser 2 LP 2 LP
Features
# Fans/System Fan
2/1 2/0 2/0
Idle Power Pass Pass Pass Thermal Performance
Max Power Pass Pass Pass
Acoustic Performance
Idle Power @23C
25.4 dBA* 26 dBA* 27.8 dBA*
(1HDD)

Summary
66 microATX (µATX) Small Form Factor PC Case Studies
Table 24 Acoustics Data Summary
System Operating Mode HDD Sound Pressure Level [dBA]
Sound Power Level [BA]
idle x2 28.3 3.6 10.8L
3DMark05 x2 34.0 4.1
idle x1 26 3.4 7.5L
3DMark05 x1 31.3 3.9
idle x1 25.4 3.4 5.8L
3DMark05 x1 31.3 3.9
7.2 Thermal Key Learnings of the Case Studies
The thermal key learnings of the case studies are summarized below.
• Thermal validation completed with 65W processor and meets all thermal specifications
• Designing with no large side vent above the processor is possible ⎯ Partition provides low ambient temperature to processor inlet ⎯ Allows a monitor to sit on top for DT applications as well as aesthetics
• 2 fans sufficient in all 3 system to reduce noise contributors and reduce BOM cost
• Reduced height FHS for 65W processor can reduce system height
• Cable routing is important in SFF systems to maximize airflow through the system
7.3 Acoustics Key Learnings of the Case Studies
The acoustics key learnings of the case studies are summarized below.
• Acoustics validation targeted below 28dbA SP at idle and meets all thermal specifications
• Focus on PSU noise contribution is key. PSU fans dominate the acoustics noise for these cases.
• Up to 0.2 dB[A] of noise level reduction can be obtained by using grommets on the HDDs’ screws.
• Understand the acoustic and thermal relationship between fans and heat sources to help control your system acoustic and thermal efficiently
• Low speed system fan is used to reduce acoustic noise level.
• System acoustic performance is highly dependent on system thermal performance. In general, thermally optimized systems have good acoustic performance when using fan speed control properly configured to the system.

Summary
microATX (µATX) Small Form Factor PC Case Studies 67

Summary
68 microATX (µATX) Small Form Factor PC Case Studies
Appendix A SFF Concept Systems Prototype Chassis Thermal/Acoustic Test Plan
A.1 Introduction
A.1.1 Purpose
The purpose of this document is to define the test requirements and to provide Intel® procedure for completing the thermal and acoustic qualifications of PAE/RPG’s SFF concept systems at the prototype level. This test plan will add values to obtaining an early assessment of the system’s thermal and acoustic capabilities and to identify high risk areas of the SFF concept system.
A.1.2 Audience
This document is intended for those involved in the engineering design and integration of the PAE/RPG SFF concept chassis platforms and thermal solutions.
A.2 Chassis Qualification Tests
A.2.1 Chassis Qualification Tests with DO µATX Platform
The qualification suite is to determine if the system’s thermal configuration can adequately provide cooling to meet the thermal targets without exceeding the expected acoustic noise emission. A production DO µATX MB (of Q965/ICH8 platform) shall be used for this thermal/acoustic performance assessment. The test requires that temperature measurements be taken at multiple points within the system’s operating envelope (defined by different operating ambient temperatures/system working modes) demonstrating the effectiveness of the system’s thermal management solution. System acoustic noises will then be measured for these operating points.
A.2.2 Investigative Test Hardware Needs
For the thermal test, a minimum quantity of one (x1) prototype chassis sample, a fully configured system with Intel® DQ965GF µATX MB, and a thermal/humidity

Summary
microATX (µATX) Small Form Factor PC Case Studies 69
chamber will be needed for the thermal tests. The operating acoustic noises from the concept systems shall be measured in an ISO-certified semi-anechoic sound chamber.
A.2.3 System Configurations
Table 25 10.8L Concept Configuration
Component/Device Vendor/Model Quantity
Chassis/ID Bezel Assembly Customized for the 10.8 L SFF Concept 1
M/B Intel® DQ965GF 1
CPU Intel® Core™2 Duo 1
CPU FHS Intel® D34052-002 ATX FHS 1
DIMM Transcend® 512MB DDR2/800 2
3.5” HDD Seagate®/Barracuda 250GB/16M 7200rpm SATAII
2
5.25” ODD LiteOn® SHM-165H6 1
Low-profile PCI-Ex X16 Gfx card Leadtek® Quadro NVS285 1
Low-profile PCI TV tuner card Compro® X200 1
PSU Delta® DPS-250AB-18A 1
FPIO Customized for the 10.8L SFF Concept 1
Card reader Customized for the 10.8L SFF Concept 1
Table 26 7.5L Concept Configuration
Component/Device Vendor/Model Quantity
Chassis/ID Bezel Assembly Intel® 7.5L SFF concept 1
M/B Intel® DQ965GF 1
CPU Intel® Core™2 Duo 1
CPU FHS Intel® D34052-002 ATX FHS 1
DIMM Transcend 512MB DDR2/800 2
3.5” HDD Seagate/Barracuda 250GB/16M
7200rpm SATAII 1
Mbl 5.25” ODD TEAC DV-W28EC 1
Low-profile PCI-Ex X16 Gfx card Ledtek Quadro NVS285 1
Low-profile PCI TV tuner card Compro X200 1
PSU Delta DPS-250-AB-24A 1
FPIO Customized for the 7.5L SFF Concept 1
Media card reader Customized for the 7.5L SFF Concept 1

Summary
70 microATX (µATX) Small Form Factor PC Case Studies
Table 27 5.8L Concept Configuration
Component/Device Vendor/Model Quantity
Chassis/ID Bezel Assembly Intel® 5.8L SFF concept 1
M/B Intel® DQ965GF 1
CPU Intel® Core™2 Duo 1
CPU FHS Intel® D34052-002 ATX FHS 1
DIMM Transcend 512MB DDR2/800 2
3.5” HDD Seagate/Barracuda 250GB/16M
7200rpm SATAII 1
Mbl 5.25” ODD TEAC DV-W28EC 1
Low-profile PCI-Ex X16 Gfx card Ledtek Quadro NVS285 1
Power AC/DC Adaptor Delta ADP-220DB 1
DC/DC Converter Mini-Box PW-200-V 1
FPIO Customized for the 5.8L SFF Concept 1
Media card reader Customized for the 5.8L SFF Concept 1
A.2.4 Test Report
A test report will need to be completed to show the eventual completion of the required test items.
A.3 Test Procedures
A.3.1 Thermal Tests with System Configuration
A.3.1.1 Purpose
To demonstrate that the system meet all subsystem temperature targets in various operating conditions (ambient temperatures and work loads) which are defined by the test profiles or the operating envelops for the SFF concept systems.
A.3.1.2 Quantity
One (x1) prototype chassis sample for each concept + required system configuration as mentioned in Section 2.3.
A.3.1.3 Equipment
The test thermal chamber must have the lowest air flow speed possible. Without any sample system inside the chamber, the ambient temperature variation between any two positions in the chamber must be lower than 2℃.

Summary
microATX (µATX) Small Form Factor PC Case Studies 71
A.3.1.4 Temperature Targets (Success Criteria) • Conroe CPU case temperature ≦ Tcase[°C] = 0.26*Power[W] + 43.2
• Q965 GMCH case temperature ≦ 97°C
• Q965 GMCH ambient temperature ≦47°C
• ICH8 case temperature ≦92°C
• ICH8 ambient temperature ≦60°C
• Nineveh GbE LAN controller ambient temperature ≦55°C
• DIMM DDR2 entry ambient temperature ≦50°C
• DIMM DDR2 gap ambient temperature ≦70°C
• HDD case temperature ≦ 60°C
• HDD ambient temperature ≦ 55°C
• ODD ambient temperature ≦ 50°C
• PCI-Ex X16 graphics card processor case temperature ≦ 105°C
• PCI-Ex X16 garphics card ambient temperature ≦ 50°C
• PCI MPEG/TV tuner card ambient temperature ≦ 50°C
• Media card reader ambient temperature ≦ 50°C
• PSU inlet ambient temperature ≦ 50°C
A.3.1.5 Test Profiles
System shall be set up according to the configuration table ( A.2.3).
Table 28 System Thermal Test Profile
Chamber Temperature/Rel. Humidity Settings 23.0°C/50% 35.0°C/50%
Position Mini-tower Mini-tower
AIC’s Added? Yes Yes
Operating Mode #1 Idle
Operating Mode #2 Intel® Core™2 Duo
MaxPower (MAR% close to TDP)
Intel® Core™2 Duo MaxPower (MAR% close to
TDP)
Operating Mode #3 3DMark 2005 – Fill Rate 3DMark 2005 – Fill Rate
Operating Mode #4 HDD C:\ to D:\ partitions
files transfer HDD C:\ to D:\ partitions
files transfer
Operating Mode #5 ODD E:\ to HDD C:\ partition
files transfer ODD E:\ to HDD C:\ partition
files transfer
NOTE: Mini-tower position represents the worst normal usage orientation for system ventilation since hot air coming out from lower side of the system may get sucked into the system from CPU inlets located on the upper side of the system.

Summary
72 microATX (µATX) Small Form Factor PC Case Studies
A.3.1.6 Fan Speed Settings
For each test profile, two types of fan speed settings should be used as follows.
Table 29 Fan Speed Settings
Fan Control Mode
Fan Speed Settings #1 Manual per Flotherm Simulation Settings
Fan Speed Settings #2 Default iQST
A.3.1.7 Test Procedure • Gauge 30 type-T standard grade thermocouple (TC) sensors should be
instrumented to monitor ambient or case temperatures at locations throughout the system.
• MB VRD’s power delivery characteristics must be obtained before system assembly.
⎯ Use VTT (rev2.0) to characterize CPU socket’s Vcc vs. Icc relationship (for a given Conroe CPU VID).
⎯ Use an extra fan for cooling, if necessary, to prevent VR components from exceeding thermal targets (see Section 3.1.4).
⎯ Vcc_socket and Vss_socket must be probed (test points on the backside of the CPU socket – CPU power plane) and recorded while VTT is being adjusted with incrementing Icc inputs (from 0A to 75A). The purpose is to get a complete static DC loadline characteristic for a know CPU VID value.
⎯ Vcc_sense and Vss_sense should also be probed and recorded during the static DC loadline characterization.
• To estimate the CPU’s power dissipations (after the system is assembled with the required configuration)
⎯ With the system running a test profile (see Section 3.1.5), probe and record the steady-state Vcc_socket, Vss_socket, Vcc_sense, and Vss_sense. (20~30 minutes for steady state)
⎯ Use the recorded Vcc_socket and Vss_socket values to interpolate the drawn Icc on the static DC loadline graph.
⎯ Multiply Icc with the corresponding Vcc_sense to get the CPU core power. (Every Vcc_socket has a corresponding Vcc_sense.)
• Finally, the general test procedure required that the system and instrumentation cabling adhere to the following setup steps:
⎯ Once prepped with thermocouple sensors in place, verify all fan run according to the recommended settings (see Section 3.1.6). The system is to be placed in the temperature test environment of 23.5° C (±2 °C) or 35.5 ºC depending on the thermal test profile described above.
⎯ Thermocouples should be connected to an external data logger for monitoring the sub-system and component temperatures. The thermal data should be allowed to stabilize. The thermal tests should be performed with the system in the vertical “mini-tower” position. Data should be collected every 20 seconds until all monitored temperatures indicate variations of less than ±0.5°C for more than 20 minutes (steady state). The last 10 data points are then averaged to yield the final value.

Summary
microATX (µATX) Small Form Factor PC Case Studies 73
⎯ Results are linearly scaled from the measured system operating temperature, TE, for each run to the desired TE (either 23.0 °C or 35.0 °C).
⎯ The scaled values should be within their corresponding thermal targets in order to meet success criteria.
A.3.1.8 Thermocouple Locations
Table 30 System Thermocouple Locations
TC Ref. # Location Description
1 TC Processor case Centered on integrate circuit heat-spreader (IHS) – see YCD Ref. No. 20050
2, 3, 4, 5 Processor heat sink fan inlet ambient, TA
3-12 mm from the fans blades shown in Figure 1
6, 7, 8, 9 Chassis external inlet ambient, Ti
3-12 mm from the chassis inlet venting
10, 11, 12 GMCH inlet ambient About ½ height of the MCH heatsink approximate location shown in Figure 2 (H= 25mm, W= 13mm, D=25mm) – see YCD Ref. No. 21599
13 GMCH Tcase Heatsink base center machine-grooved as shown in Figure 3 – see YCD Ref. No. 21599
14, 15, 16 ICH inlet ambient About ½ height of the ICH heatsink approximate location shown in Figure 4 (H= 6mm, W= 13mm, D=13mm) – see YCD Ref. No. 20764
17 ICH Tcase Heatsink base center machine-grooved as shown in Figure 5 – see YCD Ref. No. 20764
18, 19, 20 Memory Tambient Approximate locations as shown in Figure 6
21, 22 PCI-Ex X16 graphics card Tambient
Centered and front of the GPU heat sink as shown in Figure 7
23 PCI-Ex X16 graphics card GPU Tcase
Heatsink base center machine-drilled as shown in Figure 8
24 TV Tuner Tambient Center of PCI TV Tuner card as shown in Figure 9
25, 26, 27, 28
PSU inlet ambient 3-8 mm away from PSU fan at 0°, 90°, 180°, and 270° positions around the fan
29, 30 HDD Tambient 3-8 mm from the bottom center of HDD; 3-8mm from the rear center of HDD
31 HDD Tcase Per HDD data sheet specification
32, 33 ODD Tambient 3-8 mm from the bottom center of ODD; 3-8 mm from the rear center of ODD

Summary
74 microATX (µATX) Small Form Factor PC Case Studies
Figure 53 CPU FHS Fan Inlet Thermocouple Locations
Figure 54 GMCH Tambient Thermocouple Location

Summary
microATX (µATX) Small Form Factor PC Case Studies 75
Figure 55 GMCH Tcase Thermocouple Location
Figure 56 ICH Tambient Thermocouple Location
k
Figure 57 ICH Tcase Thermocouple Location

Summary
76 microATX (µATX) Small Form Factor PC Case Studies
Figure 58 Memory Thermocouple Location
H
H/2
0.5 inchesL/2
L0.5 inches
H
H/2
0.5 inchesL/2
L0.5 inches
Figure 59 PCI-Ex X16 Gfx Thermocouple Location
L
Side View
Top View
L/2
H
H/2
6.4 MM [0.25 IN] (2 PLACES)
PCIe Graphic GPU Heat Sink
L
Side View
Top View
L/2
H
H/2
6.4 MM [0.25 IN] (2 PLACES)
PCIe Graphic GPU Heat Sink

Summary
microATX (µATX) Small Form Factor PC Case Studies 77
Figure 60 GPU Thermocouple Location
Figure 61 PCI Thermocouple Location
Side View
Top View
H
H/2
6.4 MM [0.25 IN]
FrontRear
Side View
Top View
H
H/2
6.4 MM [0.25 IN]
FrontRear
A.3.1.9 Expected Success Criteria • Case temperatures, TCase equal to or below specifications
• Sub-component ambient temperatures equal to or below targets

Summary
78 microATX (µATX) Small Form Factor PC Case Studies
A.3.2 Acoustic Noise Tests with System Configuration
A.3.2.1 Purpose
Investigate the concept mockup’s acoustic performance (sound pressure level in dB[A] and sound power in BA) in order to determine areas for improvement.
A.3.2.2 Quantity
The acoustic noise measurements conducted here are for investigative purpose only. One (x1) prototype chassis sample for each concept + required system configuration as mentioned in Section 2.3.
A.3.2.3 Laboratory and Equipment
A certified acoustics laboratory equipped with a semi-anechoic chamber (e.g. SGS).
The semi-anechoic chamber and the instrumentations must meet the requirement of ISO-3745 and ISO-7779.
Room temperature: 23±2°C
Humidity: 40%~70% RH
Barometric pressure: 86kPa to 106kPa
A.3.2.4 Sound Pressure Level Test Profile • The room shall provide a free field over a reflecting plane.
• The background ambient noise in the acoustics room (with no system operating) should be at least 0.6B quieter than the system under test measured noise values, in each 1/3-octave band between 100Hz and 16kHz.
⎯ This requirement is based on the measured noise emitted from the system and the room background noise, not the pas/fail criteria.
⎯ As system do not generate significant noise in all 1/3 octave bands, it is often not possible for the test room to meet this criteria across all 1/3 octave bands.
⎯ If this occurs, ISO 7779 requires noting in the test report that: “The background noise requirements of ISO-7779 and ISO-3744 have not been satisfied.” Typically, this only applies to some of the 1/3 octave bands, not all of them.
• The procedure to measure the sound pressure level of the system shall follow ISO-7779 (Second edition, 1999).
• Sound pressure level is measured for a seated operator position in which system is placed on the standard table, described in ISO-7779, 1999 edition (see figures 9 and 10 below).
• Keyboard and monitor should be located outside the test facility but may be placed beside the system if remote operation is not possible.
• Externally set the fan speeds according to thermal test results (for idle mode).

Summary
microATX (µATX) Small Form Factor PC Case Studies 79
• Allow 30 minutes for the system to warm up before collecting acoustic measurements.
• Measurements are made in Idle Ready mode for each system. ⎯ Idle Ready: Disk(s) shall be loaded, power on, unit ready to receive and
respond to control link commands, with spindle up to speed and read/write heads in track-follow mode.
⎯ For example, the measurement can be made while the system is in idle mode with a window of Microsoft* NotePad opened.
• Stop the manual fan speed settings and repeat the same test profile with automatic fan speed control from the default iQST settings.
A.3.2.5 Success Criteria
Idle mode sound pressure level ≦ TBD
• Success criteria recommendation is A-weighted in dB, measured between 100Hz and 16kHz.
Figure 62 Sound Pressure Level Measurement (Front View)

Summary
80 microATX (µATX) Small Form Factor PC Case Studies
Figure 63 Sound Pressure Level Measurement (Top View)
A.3.2.6 Sound Power Test Profile • The room shall provide a free field over a reflecting plane.
• The background ambient noise in the acoustics room (with no system operating) should be at least 0.6B quieter than the system under test measured noise values, in each 1/3-octave band between 100Hz and 16kHz.
⎯ This requirement is based on the measured noise emitted from the system and the room background noise, not the pas/fail criteria.
⎯ As system do not generate significant noise in all 1/3 octave bands, it is often not possible for the test room to meet this criteria across all 1/3 octave bands.
⎯ If this occurs, ISO 7779 requires noting in the test report that: “The background noise requirements of ISO-7779 and ISO-3744 have not been satisfied.” Typically, this only applies to some of the 1/3 octave bands, not all of them.
• Measurement duration should be at least 30 seconds and shall be the same for all microphones.
• Place the microphones specific locations in a hemispheric arrangement around the system at a radius of 1.0m (see Figure 11, Table 7).
• Place the system in the center of the test chamber.
• Keyboard and monitor should be located outside the test facility but may be placed beside the system if remote operation is not possible.
• Externally set the fan speeds according to thermal test results (for idle mode).
• Allow 30 minutes for the system to warm up before collecting acoustic measurements.
• Measurements are made in Idle Ready mode for each system.

Summary
microATX (µATX) Small Form Factor PC Case Studies 81
⎯ Idle Ready: Disk(s) shall be loaded, power on, unit ready to receive and respond to control link commands, with spindle up to speed and read/write heads in track-follow mode.
⎯ For example, the measurement can be made while the system is in idle mode with a window of Microsoft* NotePad opened.
• Determine the sound power level of the PC from the ten measured sound pressure levels according to ISO-3744.
• Stop the manual fan speed settings and repeat the same test profile with automatic fan speed control from the default iQST settings.
Figure 64 Microphone placements for sound power measurement
Table 31 Table 8: Microphone XYZ Locations [m]
Position X Y Z Position X Y Z
1 0.16 -0.96 0.22 6 -0.83 -0.40 0.38
2 0.78 -0.60 0.20 7 -0.26 -0.65 0.71
3 0.78 0.55 0.31 8 0.74 -0.07 0.67
4 0.16 0.90 0.41 9 -0.26 0.50 0.83
5 -0.83 0.32 0.45 10 0.10 -0.10 0.99
The origin (0, 0, 0) is the XY center of the system surface coplanar with the test room floor.
A.3.2.7 Success Criteria
Idle mode sound power ≦ TBD

Summary
82 microATX (µATX) Small Form Factor PC Case Studies
• Success criteria recommendation is A-weighted in Bels, measured between 100Hz and 16kHz.
§