micro data linking 2014/2015: methodological report on ... web viewreport. micro data linking...
TRANSCRIPT
Report
Micro Data Linking 2014/2015: Methodological report on meta information

project number
remarks
16 November 2015
The views expressed in this paper are those of the author(s) and do not necessarily reflect the policies of Statistics Netherlands.
CBS HeerlenCBS-weg 116412 EX HeerlenPostbus 44816401 CZ Heerlen+31 45 570 60 00+31 45 570 60 00
www.cbs.nl

project number
remarks
16 November 2015
The views expressed in this paper are those of the author(s) and do not necessarily reflect the policies of Statistics Netherlands.
CBS HeerlenCBS-weg 116412 EX HeerlenPostbus 44816401 CZ Heerlen+31 45 570 60 00+31 45 570 60 00
www.cbs.nl
Executive summary 5
1. Introduction 71.1 Aim of this report 71.2 MDL 2014-2015 71.3 Structure of the report 9
2. Phase I: Production of MDL-database 102.1 Background of the sources 102.2 Availability of variables 102.3 Experiences building MDL-database 102.4 Conclusions and recommendations 11
3. Phase II: Validation 133.1 Introduction 133.2 Experiences validation 133.3 Conclusions and recommendations 16
4. Phase III: Output 184.1 Introduction 184.2 Data analysis 184.3 Regular tabular output 204.4 Limitations MDL and national sources 21
Annex I: Background information sources 23
Annex II: Availability variables 40
Annex III: Overview issues 43
Annex IV: Country report Austria 46
Annex V: Country report Denmark 56
Annex VI: Country report Finland 66
Annex VII: Country report Germany 75
Annex VIII: Country report Latvia 87
Annex IX: Country report the Netherlands 96
Annex X: Country report Norway 109
Micro Data Linking 2014/2015: Methodological report on meta information 4
Annex XI: Country report Portugal 117
Annex XII: Country report Sweden 127
Micro Data Linking 2014/2015: Methodological report on meta information 5

Executive summaryThis methodological report summarizes the main conclusions and recommendations from the project ‘Micro data linking of structural business statistics and other business statistics’ (in short MDL 2014-2015).
The MDL 2014-2015 project produces national databases containing the most central structural business statistics – with information available on the enterprise and enterprise group level – in order to conduct micro-level economic analyses. Beyond this, the project provides the basis for further analyses in the future based on the national databases established in the project. The new statistical knowledge is produced without carrying out new surveys, i.e. without increasing the respondent burden on enterprises.
An important goal of the project is to test the feasibility of the micro data linking approach to produce (regular) statistical output to be considered a supplement to the current annual deliverables of tables as part of SBS.
The micro data linking project produces several deliverables, including three output deliverables. These output deliverables consist of tabular data for each of the three topics – intended for publication on the Eurostat website – and a descriptive analysis in the form of a Statistics Explained article for each topic.
Presented below are the main conclusions and recommendations from the MDL 2014-2015 project:
Conclusions:1) Overall there was positive feedback on the quality and timeliness of the circulated
guidelines and syntaxes.2) The used approach was suitable for all participating countries in the project.3) Most countries reported that the production of the national databases (phase 1 of the
project) and its validation (phase 2) was time consuming. 4) It was an educational experience for all countries. The participants learned more about
their own (micro) data.5) It is important to define the output specifications as early as possible; knowing that the
projects are research oriented and as such will require an iterative process where the final output cannot be determined from the outset of the project.
6) The validation phase was overall very valuable, even though the validation produced mixed results and experiences.
7) The interpretations of the different national results of validation were mixed. Some reasons were mentioned by many NSI’s, while at the same time there were also quite some reasons for the output in the validation mentioned only by one country (see also annex III).
Recommendations:1) Take into consideration explicit technical requirements in the project to avoid
unnecessary problems and possible delays (both hardware and software).2) Provide more meta description in SAS-syntax, examples of datasets and instructions on
importing files in SAS. This is particularly helpful for countries with limited SAS-knowledge.
Micro Data Linking 2014/2015: Methodological report on meta information 6
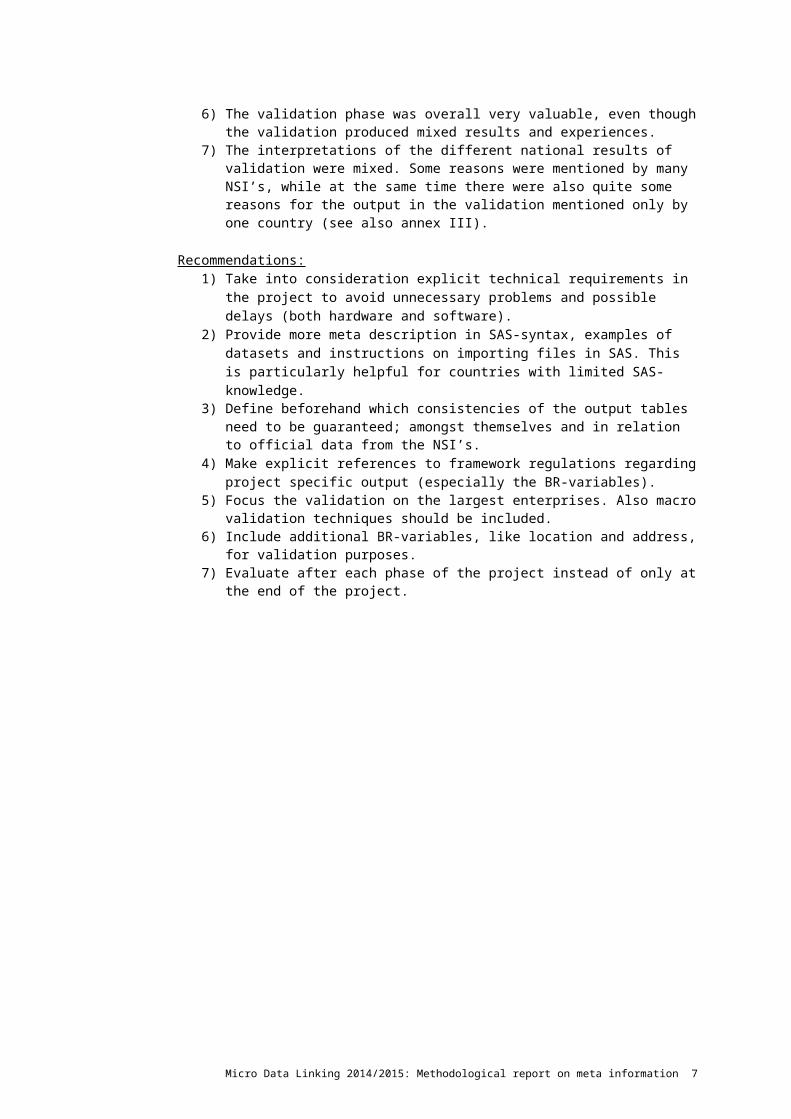
3) Define beforehand which consistencies of the output tables need to be guaranteed; amongst themselves and in relation to official data from the NSI’s.
4) Make explicit references to framework regulations regarding project specific output (especially the BR-variables).
5) Focus the validation on the largest enterprises. Also macro validation techniques should be included.
6) Include additional BR-variables, like location and address, for validation purposes. 7) Evaluate after each phase of the project instead of only at the end of the project.
Micro Data Linking 2014/2015: Methodological report on meta information 7

1. Introduction
1.1 Aim of this report
This report summarizes the experiences and results of the project ‘Micro data linking of structural business statistics and other business statistics’ (in short MDL 2014-2015) from the participating countries: Austria, Denmark, Finland, Germany, Latvia, the Netherlands, Norway, Portugal and Sweden. The main conclusions are presented in this report and recommendations for future exercises with micro data linking are made. This report serves as deliverable ‘D4.4 Methodological report’ of the MDL 2014-2015 project (theme: 06.1.23-Development of structural business statistics).
1.2 MDL 2014-2015
“The picture of economic globalization provided by current official statistics is incomplete, the causal links to economic welfare indicators such as employment and wages tend to be weak and unconvincing, allowing a set of highly charged, politically motivated, and unproductive debates over the basic facts”, economic geographer Timothy Sturgeon1 reported to Eurostat. He concluded: “[T]he most pressing need is to make full use of existing data sources, for a system that ties data from business surveys to the wealth of information from administrative sources”.
The MDL 2014-2015 project is a big step in this direction. It is the goal of the project to produce national databases containing the most central structural business statistics, with information available on the enterprise and enterprise group level, in order to conduct micro-level economic analyses. Beyond this, the project provides the basis for further analyses in the future based on the national databases established in the project. The new statistical knowledge is produced without carrying out new surveys, i.e. without increasing the respondent burden on enterprises.
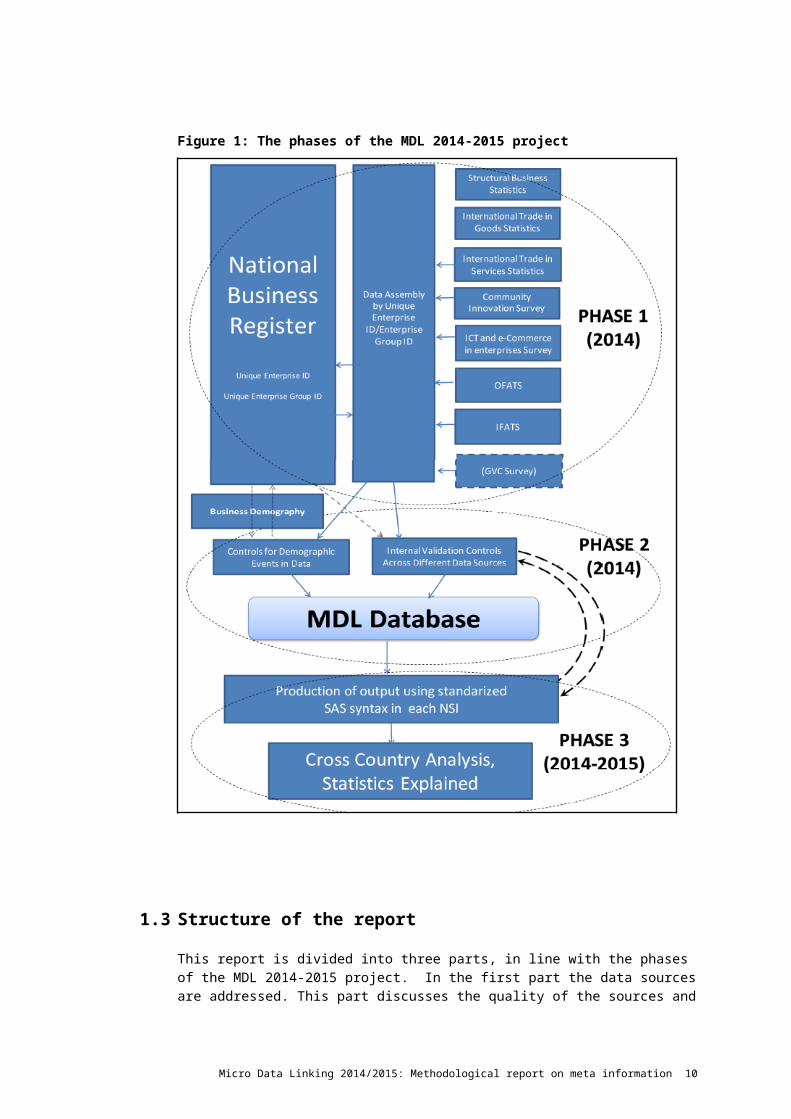
To the extent possible, the new MDL database is structured using input data for the reference period of 2008-2012 from Structural Business Statistics, International Trade in Goods Statistics, International Trade in Services Statistics, Community Innovation Survey, ICT usage and e-Commerce in enterprises Survey, Foreign Affiliate Statistics (Inward and Outward), Business Demography Statistics, International Organization and Sourcing Survey and the national Business Register. Information from the National Business Register is central for the establishment of the database as the issue of identity over time is essential for longitudinal micro-level analysis.
The micro data linking project is divided into three phases:
1 Sturgeon, T. (2013), Global Value Chains and Economic Globalization - Towards a New Measurement Framework. Report prepared for Eurostat, p.7.
Micro Data Linking 2014/2015: Methodological report on meta information 8
1. Matching and adjustment of data and structuring of the database;2. Validation controls and calculation of weights for the control group population(s)
where necessary;3. Production of standardized output.
The micro data linking project and its phases are illustrated in figure 1.
Figure 1: The phases of the MDL 2014-2015 project
Micro Data Linking 2014/2015: Methodological report on meta information 9
1.3 Structure of the report
This report is divided into three parts, in line with the phases of the MDL 2014-2015 project. In the first part the data sources are addressed. This part discusses the quality of the sources and the availability of variables. Also, part one discusses the member states’ experiences regarding the construction of the national databases (chapter 2). The central topic of the second part is the validation of the constructed databases. The results and experiences of the participating countries are presented in this chapter. In order to further improve the consistency and quality of the data, special attention was given to the following issues: instability over time, no-match, unit representation and demographic change (chapter 3). The third, and final, part gives additional information on the choices made in the data analysis for the three Statistics Explained articles (chapter 4). The most relevant knowledge gathered during the micro linking project can be found in the annexes at the end of the report.
Micro Data Linking 2014/2015: Methodological report on meta information 10
2. Phase I: Production of MDL-databaseThis chapter presents the results and experiences from the first phase of the project: the matching and adjustment of the data and the structuring of the MDL-database. As it is crucial to have a clear understanding of quality and limitations of the available variables and sources used for the database, this part of the methodological report also focusses on the relevant background information of the national sources.
2.1 Background of the sources
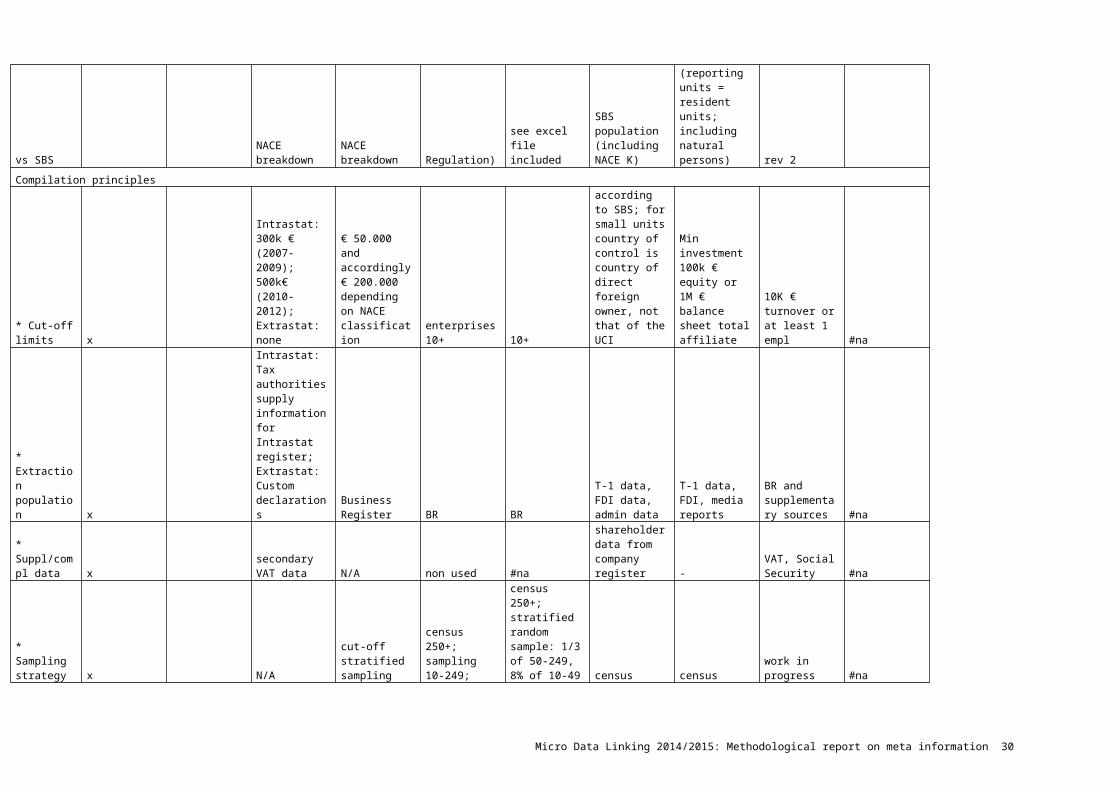
At the start of the MDL 2014-2015 project all nine participating NSI’s were asked to give additional background information on their national sources that are used in this project. Issues that are addressed include, amongst other: the type of statistical units that are used; how the coverage is of the source when compared to the Structural Business Statistics (SBS); and whether cut-off limits, other supplementary/complementary data, a sampling strategy, estimation methods and/or imputation methods are used during the construction of the national source.
The answers on these, and other, questions from the project participants are summarized in Annex I. The original completed questionnaires are in the possession of Eurostat.
2.2 Availability of variables
Besides giving additional background information on the national sources, all participants were also asked to indicate which variables are available in their national sources. As the overall table in Annex II shows, the majority of the listed variables are available for most countries. Not surprisingly, variables from the national Business Register, Structural Business Statistics, International Trade in Goods Statistics, Inward Foreign Affiliate Statistics and Business Demography Statistics are widely available. Variables from other sources, however, are less available, for example due to non-participation in specific surveys (like the International Organization and Sourcing Survey).
Eurostat obtains the country specific overviews of available variables from the participating NSI’s.
2.3 Experiences building MDL-database
The detailed experiences from the NSI’s were gathered in questionnaires that were send out to the participants at the end of the project. These country experiences can be found at the end of this methodological report, in the annexes 4 – 12. A full overview of the mentioned issues/problems and proposals are displayed in annex 3.
This paragraph lists the main experiences and proposals of the participating countries regarding the construction of the MDL-database, as presented and discussed in the fourth, and last, task force meeting of the MDL-project.
Micro Data Linking 2014/2015: Methodological report on meta information 11
Experiences The overall feedback in this phase of the project is positive. Moreover, all participants
agree (5) or strongly agree (4) that the used approach to build the MDL-database was suitable.
The circulated guidelines were positively evaluated. The nine participants ranked them as ‘good’ (2), ‘very good’ (3) and ‘excellent’ (4). The guidelines had a “clear structure and visualizations” and were “detailed and comprehensive”.
The circulated syntax was positively evaluated. The nine participants ranked them as ‘good’ (4), ‘very good’ (4) and ‘excellent’ (1). Overall, the syntax was “easy to adept and apply” and “efficient despite some minor mistakes”. For NSI’s with limited knowledge of the SAS-software more description would have been helpful.
Most countries agreed that this phase was more time consuming than anticipated. Two NSI’s had changes in staff during the project. Almost all countries had issues with different SAS-versions. This resulted in adjusting
the standard syntax, either by the NSI’s themselves but more often by the project leaders (which caused extra time).
It turned out that one country could not use SAS-software to produce the MDL-database. They had to build the database with different statistical software. There were legal and software/hardware reasons for this decision.
One country had problems with importing the data from the Excel format into the database.
A proposal for aggregated data sets for confidentiality checks was rejected by the project leaders; unaware of consequences for confidentiality.
Some countries indicated that they could not include all variables that were required for the MDL-database.
Not for everyone were all variables clear. For example, it was unclear which event the start of a new enterprise group marks.
Some countries observed that a lot of time was spend on building specific variables and datasets that were not used.
Proposals Define earlier which output to make, avoiding time spend on unused variables and
datasets. More time for syntax testing. More meta descriptions in SAS-syntax, examples of datasets, instructions on importing
files in SAS. Take into consideration the technical requirements before or at the beginning of the
project: both hardware and software. More clear variables, with reference to framework regulations Include extra BR variables identifying the enterprise, like name and address (for
validation purposes). Limit dataset to most relevant variables.
2.4 Conclusions and recommendations
The previous paragraph gave an overview of the experiences of phase 1 from the MDL 2014-2015 participants, including the proposals for further improvement. This served as input for the
Micro Data Linking 2014/2015: Methodological report on meta information 12

final discussion – held in the fourth task force in Copenhagen. The agreed conclusions and recommendations are presented below:
Conclusions:1) Overall there was positive feedback on the quality and timeliness of the circulated
guidelines and syntaxes.2) The used approach was suitable for all participating countries in the project.3) Most countries reported that the production of the national MDL-databases was time
consuming.4) It is important to define the output specifications as early as possible; knowing that the
projects are research oriented and as such will require an iterative process where the final output cannot be determined from the outset of the project.
Recommendations:1) Take into consideration explicit technical requirements in the project to avoid
unnecessary problems and possible delays (both hardware and software).2) Provide more meta description in SAS-syntax, examples of datasets and instructions on
importing files in SAS. This is particularly helpful for countries with limited SAS-knowledge.
3) More clear variable definitions and references to framework regulations regarding project specific output (specifically the BR-variables).
4) Include additional BR-variables, like location and address, for validation purposes.
Micro Data Linking 2014/2015: Methodological report on meta information 13
3. Phase II: Validation
3.1 Introduction
The second phase of the MDL-project consists of various steps of different scope aimed at validating the MDL-database. The main aim of the validation process in the MDL-project is to achieve improved consistency and stability in the data, taking into account the analyses to be carried out. This chapter focusses on the NSI’s experiences with the validation phase.
The key consistency issues in the validation work in this project consist of the following issues: 1) Instability over time: data for the empirical unit is not registered on the same statistical
unit IDs across data sets (same data source, but different reference periods).2) No-match: Data for the empirical unit is not registered on the same statistical unit IDs
across data sets (different data sources).3) Unit representation: Data is registered on the same statistical unit ID across data sets
(different sources and/or different reference periods), but the data does not refer to the same empirical unit.
4) Demographic change: Data is registered on the same statistical unit ID across data sets (different sources and/or different reference periods), but the empirical unit has changed substantially at one (or more) point(s). This may be the case when an enterprise takes over another enterprise.
This chapter summarizes the experiences of the participating countries of the MDL 2014-2015 project and presents the main conclusions and recommendations for further micro data linking projects.
3.2 Experiences validation
The detailed experiences from the NSI’s were gathered in questionnaires that were send out to the participants at the end of the project. These country experiences can be found at the end of this methodological report, in the annexes 4 – 12. A full overview of the mentioned issues/problems and proposals are displayed in annex 3.
This paragraph lists the main validation results and experiences from the participating countries. Also, the mentioned proposals are presented in this paragraph.
Validation results: Five countries used an additional methodology to validate the MDL-database regarding
instability over time: use of other project with more reference years; matching by company name and address; consulting BR-experts; top-down validation using pattern analysis; auxiliary information from Business Demography Statistics and the national Business Register.
The main reasons for the output of the validation check for instability over time were:o SBS is sample / sampling design;o Inconsistencies amongst SBS surveys between NACE branches;
Micro Data Linking 2014/2015: Methodological report on meta information 14

o Mismatch ITGS and SBS due to ITGS being a monthly and SBS being a yearly statistic;
o Enterprises not in SBS scope anymore (either because of different NACE or size class;
o Restructured enterprises outsourcing their business;o Inactivity of enterprises, but still reporting trade (mainly micro enterprises);o Economic circumstances;o Sample coverage amongst ICTeC and SBS;o Too late response to integrate in final SBS database.
Five countries corrected data in the MDL-database as a result of the instability over time validation. Five NSI’s added or replaced ENT_ID’s, two NSI’s added or replaced other variables, and five corrected all variables across the dataset.
Three countries used an additional methodology to validate the MDL-database regarding no match for ITGS: Matching ITGS ‘no-matches’ with same SBS-year via BR using administrative ID; checking company characteristics as EGR, company name, location, persons employed, turnover; control BD for deaths. No countries used an additional ‘no match’ validation method for ITS, although one country added some enterprises in ITS connected to services related to sea and coastal transport.
ITS is not available in two countries, while one country does not produce ITS but receives the data from the national bank.
The main reasons for the output of the validation check for no-match were:o (Foreign/inactive) enterprises in ITGS that are not in SBS;o Mismatch ITGS and SBS due to ITGS being a monthly and SBS being a yearly
statistic;o Different NACE-scope;o SBS is sample / sampling design;o Effect of ‘unit-representation validation’ on the ‘no-match validation’;o Demographic events;o Added enterprises results in more mismatches;o ITS includes ‘third party trade’.
Six countries corrected data in the MDL-database as a result of the no-match validation for ITGS and three countries for ITS. For ITGS these corrections were as follows: adding or replacing ENT-ID’s (6), adding or replacing other variables (4), correcting all variables across the dataset (3), any other correction of the data (1). For ITS this was: adding or replacing ENT-ID’s (3), adding or replacing other variables (1), correcting all variables across the dataset (3), any other correction of the data (0).
Only one NSI used an additional method to validate the MDL-database regarding unit representation for ITGS: using additional information like EFR and demographic events in BD. For ITS no NSI used a complementary method.
The main reasons for the output of the validation check for unit representation were:o Restructuring of enterprises;o Indirect exports;o Different use of enterprise groups;o Controlling companies of tax groups clustered in M and L (ITGS more than one
SBS unit);o ITGS export includes the total value of goods, SBS turnover does not include
this;o Transport related enterprises include value of goods;
Micro Data Linking 2014/2015: Methodological report on meta information 15
o Reporting unit on enterprise level not necessarily represent the same ‘true picture’;
o Added enterprises results in more mismatches. Four countries corrected data in the MDL-database as a result of the unit
representation validation for ITGS and two countries for ITS. For ITGS these corrections were as follows: adding or replacing ENT-ID’s (4), adding or replacing other variables (2), correcting all variables across the dataset (3), any other correction of the data (2). For ITS this was: adding or replacing ENT-ID’s (2), adding or replacing other variables (0), correcting all variables across the dataset (2), any other correction of the data (0).
One country used an additional methodology to validate the MDL-database regarding outliers with demorelations in BR: additional checks were made based on STS information. Two participating NSI’s used an additional method to validate the MDL-database regarding outliers without demorelations in BR. They used auxiliary variables from BR or BD, and consulted BD and BR experts.
The main reasons for the output of the validation check for demographic change were either due to demographic events (like takeovers, mergers and deaths) or due to other reasons for fast growth.
One NSI corrected data in the MDL-database as a result of the demographic change validation regarding outliers with demorelations in BR and two countries corrected data due to the validation of outliers without demorelations. For the validation with demorelations in these corrections were as follows: adding or replacing ENT-ID’s (1), adding or replacing other variables (1), correcting all variables across the dataset (1), any other correction of the data (0). For the validation without demorelations this was: adding or replacing ENT-ID’s (2), adding or replacing other variables (2), correcting all variables across the dataset (1), any other correction of the data (0).
Experiences: The overall feedback of the second phase of the project is positive: ‘good’ (4), ‘very
good’ (3), excellent (2). Some of the feedback was: “valuable insights”, “informative”, “learned a lot about own data”, “improved the quality of our (combined) data”, and “provided validation tables very good help”.
Moreover, all participants agreed that the used approach to validate the MDL-database was suitable.
The circulated guidelines were positively evaluated. The nine participants ranked them as ‘good’ (1), ‘very good’ (4) and ‘excellent’ (4). The guidelines were “clearly structured and comprehensive”, “informative”, and “good and easy to follow” even though at times examples could have been added.
The circulated syntax was positively evaluated. The nine participants ranked them as ‘good’ (4), ‘very good’ (3) and ‘excellent’ (2).
The four validation checks produced mixed results and experiences. For one NSI a specific validation control was very valuable, while for another this check turned out to be less relevant (and vice-versa): “especially no-match and unit representation made data differences more clear which we were able to correct” versus “consumed a lot of time with non-matching and unit representation, and in the end, nothing was done with this”.
The used micro data linking method that is used to produce the tabular output differs in most cases from the regular method that NSI’s use to produce these tables. As a result, it is possible that (considerable) differences with the official data occur.
Most countries agreed that this phase was more time consuming than anticipated.
Micro Data Linking 2014/2015: Methodological report on meta information 16
Some minor mistakes were found in the syntax. These issues were solved promptly. Some countries were not able to include the independent / dependent variable
distinction in the MDL-database. One country reported that some variable definitions and measurements differ when
comparing to each other. One country was unaware of the overall picture during the validation process.
Imputations that were made at the beginning of the validation phase had to be overruled later onwards in the project.
Despite the four validation checks on the micro data, not all implausible cases could be resolved.
Proposals: Define in advance which coherences need to be guaranteed. An evaluation should take please after each phase and not only at the end of the
project. More meta description in SAS-syntax, examples of datasets, instructions on importing
files in SAS. Produce a printer friendly version of the output tables. Find a solution for manually editing ENT_ID’s that need to be corrected. Add also macro validation methods. The validation phase could be more simple and/or focused on the largest enterprises. Addressing issue of different approach of enterprise groups in different statistics. Analyse possibilities to include ITS.
3.3 Conclusions and recommendations
The previous paragraph gave an overview of the experiences of phase 2 from the MDL 2014-2015 participants, including the main validation results and proposals for further improvement. This served as input for the final discussion – held in the fourth task force in Copenhagen. The agreed conclusions and recommendations are presented below:
Conclusions:1) Overall there was positive feedback on the quality and timeliness of the circulated
guidelines and syntaxes.2) The used approach was suitable for all participating countries in the project.3) Most countries reported that the validation of the national MDL-databases was time
consuming.4) Educational experience for all countries. The participants learned more about their
own (micro) data.5) The four validation checks produced mixed results and experiences. For one NSI a
specific validation control was very valuable, while for another this check turned out to be less relevant (and vice-versa).
6) The interpretations of the different national results of validation were mixed. Some reasons were mentioned by many NSI’s, while at the same time there were also quite some reasons for the output in the validation mentioned only by one country (see also annex III).
Micro Data Linking 2014/2015: Methodological report on meta information 17
Recommendations:1) Define beforehand which consistencies of the output tables need to be guaranteed;
amongst themselves and in relation to official data from the NSI’s.2) Provide more meta description in the SAS-syntax and guidelines. This is particularly
helpful for countries with limited SAS-knowledge.3) Add macro validation techniques.4) Focus the validation on the largest enterprises. 5) Evaluate after each phase of the project instead of only at the end of the project.
Micro Data Linking 2014/2015: Methodological report on meta information 18
4. Phase III: Output
4.1 Introduction
In total the MDL 2014-2015 project produces three output deliverables, consisting of a set of tabular data for each topic intended for publication on the Eurostat website and a descriptive analysis in the form of a Statistics Explained article for each topic.
Two outputs are considered to have the potential of becoming future annual deliverables and at the same time supply users with new information about the following type of enterprises:
1) Profiling SMEs versus large enterprises: the reason for choosing this theme is that SMEs are a focal point in European and national enterprise policy. Especially job creation by SMEs is of high policy interest or to which extent the SMEs are directly present on the global markets as well as the existence of SMEs and entrepreneurs are also considered a cultural value of high importance to maintain and promote.
2) Profiling exporters versus non-exporters: the motivation for this output is that exports and thus exporting enterprises are considered crucial for European job creation and value added creation. Therefore it is important to establish the necessary evidence of how exporting enterprises are performing compared to non-exporters.
The third output is more experimental in character due to the statistical registers used for producing this type of output or the approach, i.e. longitudinality:
3) Longitudinal analysis of a panel of enterprises: this analysis utilizes the established database in depth as it not only compares different datasets for each individual year but combines this approach with identity over time of the population of enterprises. From an enterprise policy aspect this analysis creates interesting evidence about which types of enterprises have survived the economic crisis in the best way and which similarities or differences can be observed across countries.
The next paragraph elaborates on the (methodological) choices made in the data analysis for the three output deliverables.
4.2 Data analysis
This paragraph lists the relevant decisions that were made in the data analysis regarding the (tabular) output.
Topic 1: SMEsa) A group head should be identified as a dependent enterprise and attribute to the size
class according to the employment registered at enterprise level. b) Not all countries can split into dependent and independent; they will just fill out the
total of the table. c) Portugal has their own definition of SMEs, and they would like to use this on this
project. However, it was decided that the proposed definition of SMEs should be used by all countries.
Micro Data Linking 2014/2015: Methodological report on meta information 19
d) Definition of the employment size class will be based on persons employed. The Netherlands uses BR information to determine size class, since the employment variable in SBS is not available for each enterprise as SBS is a sample (This count for the other topics as well).
e) It is decided to collect all three employment variables: Number of employees, number of person employed and FTE (This count for the other topics as well)
f) Regarding the variables Personnel cost or Wages and salaries. It is agreed to collect both variables. (This count for the other topics as well)
g) Regarding the background paper on the SME part; export destination and import origin will be deleted as variables, the rest is agreed on.
h) Regarding NACE breakdown; we decided to skip A*38 and to go with sections. Section G will be split into the three (G45, G46 and G47). A supplementary breakdown for analytical purposes will be used as well, dividing manufacturing into two (High tech, low tech (HTM and LMT)). The knowledge intensive business services (KIBS) will be identified as well.
i) Some countries expressed concern regarding the country break down. It was decided to construct table SME 02 with Intra EU, Extra EU: North America, Asia and rest of the world.
j) Further regarding table SME 02, it will be divided into SMEs and large enterprises, total of two groups. The breakdowns on SMEs are kept in table SME 01.
k) Countries can fix any problem they encounter in the way they find best, as long as it is documented in the methodological report.
Topic 2: Tradersa) It was decided to remove the group information from the tables.b) Some countries don’t have information regarding foreign affiliates –it was decided to
add totals to table Trader 01 to overcome this problem. c) The conclusion from TF Helsinki was to have table 01 for both ITS and ITGS. We will
stick to this decision knowing the difficulties of ITS. d) Export-/ import intensity should be calculated after aggregating to the decided NACE
breakdowns. e) We decided on the proposed exporter definition (described in the back ground) f) We decided to skip the A*38 breakdown as with the SMEs. It was decided to use
manufacturing further broken down into high tech and low tech and G46 (Wholesale).
Topic 3: Longitudinal analysisa) The analysis is limited by the way the output tables have been structured. All value
totals refer to the 2008 data and not the other four years.b) However by using the available output data an interesting article can be made with the
focus on demographics and trading status from the 2008 cohort.c) The distinction dependent / independent was ultimately not included in the syntax and
tables.d) A high amount of enterprises are assigned to the ‘unknown’ category in the national
output tables – and the variety within these amounts. The analysis focusses only on the other categories.
e) In the analysis an additional variable was introduced that categorized the enterprises into enterprises that grew to a bigger size class, shrunk to a smaller size class or stayed in the same size class.
Micro Data Linking 2014/2015: Methodological report on meta information 20

4.3 Regular tabular output
The 2014 MDL project has proven the possibility of linking micro data from various sources (SBS, FATS, ITGS, BR…) and produce output (tables) broken down by ownership (control), trader status and size class. The first results will be presented in three statistics explained articles in 2015 and early 2016. These articles use the data that was compiled in the project.
A major purpose of the project is to test the feasibility of the micro data linking approach to produce (regular) statistical output to be considered a supplement to the current annual deliverables of tables as part of SBS.
Using the same data Eurostat will produce a set of tables covering the topics below for the reference years 2008 to 2012. Eurostat wants to update these tables on an annual basis and asks countries to send data on a voluntary basis from 2013 onwards as soon as the data become available. A separate document requesting this data, listing the variables, breakdowns and transmission format will be send to the countries in the first half of 2016. These tables will form a basis and first set of experimental Economic Globalisation Indicators, which will be disseminated in the EGI section of Eurostat’s database.
Participation is on a voluntary basis and does not impose any future obligations on countries.
4.3.1 Tables
We propose to publish five tables based on the output that Eurostat already received from the countries for which we would not need new data. We realise that the breakdown of independent/dependent enterprises is not possible for all countries but nevertheless have asked it because as a new concept in statistics we feel it is important to show.
1. Dependent and independent enterprises by size class and NACE. a. Source: SME01.b. Dependency: dependent, independent, unknown, all c. Size class: micro, small, medium, all SMEs
2. Enterprises by size class and controlling country. a. Source: SME02. b. Controlling country: domestic, foreign, intra-EU, extra-EU, unknown, allc. Size class: SME, large, total
3. Enterprises by trader status and control. a. Source: Trader01b. Trader status: exporter, importer, 2-way trader, non-trader, all c. Controlling country: domestic, foreign, unknown, alld. Destination: intra-EU, extra-EU, both intra and extra, totale. Both for goods (trader01a) and services (trader01b)
Micro Data Linking 2014/2015: Methodological report on meta information 21
4. Exporters by size class, destination and dependencya. Source: Trader02a and trader03 combinedb. Size class: SME, large, totalc. Destination: All (from trader02a) and further breakdown (from trader03)
into EU15, EU13, Russia, Other Europe, China, India, Other Asia, North America, Brazil, ROW
d. Dependency: dependent, independent, unknown, all
5. Importers by size class and dependencya. Source: Trader02bb. Size class: SME, large, totalc. Dependency: dependent, independent, unknown, all
6. Dependent and independent enterprises by size class, NACE and controla. Source: SME01.b. Dependency: dependent, independent, unknown, all c. Size class: micro, small, medium, all SMEsd. Controlling country: domestic, foreign, intra-EU, extra-EU, unknown, all
4.4 Limitations MDL and national sources
From the beginning of the project it was agreed that we should adopt an output orientated approach; meaning that we should try to define the output as soon as possible (based on the most urgent/relevant policy questions). Therefore, already in Lisbon in March 2014 preliminary proposals for analytical output were presented. The final output was agreed upon shortly after the Helsinki meeting in November 2014. As can be seen above the first topic focuses on the characteristics and performance of the SME’s, including the issue of independency. The characteristics of trading enterprises (including their turnover and employment) were central to the second topic. The third topic concentrates on the development of the enterprises, using longitudinal analyses.
However, also the limitations of the national sources played a role in defining the output. The most important limitations for defining the output are discussed below.
An important limitation is that not all NSI’s have access to the micro data of all desired sources. Some national sources are not collected by the NSI’s themselves but by another institution, like the national bank. This is particularly the case with the International Trade in Services Statistics, Outward Foreign Affiliate Statistics, Foreign Direct Investments and Research & Development Statistics. Also, not all NSI’s in the MDL 2014-2015 participated in the non-mandatory International Organization and Sourcing Survey.
The use of different statistical units was another limitation for constructing a MDL database. For example, R&D is collected using different statistical units (enterprises but enterprise groups as well), which makes micro data linking difficult. This is also often the case for OFATS.
Another limitation that needs to be (further) addressed in future MDL projects is the use of incomplete national sources. Estimations of economic indicators based on micro data databases are challenging because of the number and size of gaps corresponding to missing information in
Micro Data Linking 2014/2015: Methodological report on meta information 22
such databases. The report ‘Estimation methods for linked data sources: a review for the Micro Data Linking project’ (which serves as deliverable ‘D4.5 Methodological report on statistical approaches’ of the MDL 2014-2015 project) suggests and reviews several estimation methods ranging from weighting to mass imputation that could be used to deal with the missing data. Moreover, two preliminary case studies dealing with this issue – from Statistics Netherlands and Statistics Germany – are included in the paper.
As the previously mentioned report stresses, it is important to take the issues of missing data into account. To give an example there are some countries that have missing micro data in their Structural Business Statistics. The reason for this is that the SBS in these countries are split up into multiple surveys, divided by NACE sections. Most of these SBS surveys are stratified random population samples. As part of the regular data production for SBS, the sample data is extrapolated to population totals by weighting with survey weights. It is important to realize this complication, as in the MDL 2014-2015 project the size class of enterprises was based on the employment variables of the Structural Business Statistics. Another complication was that the implementation of the trader definition was also based on the SBS (for export intensity turnover is needed and for import intensity purchases of goods and services).
Therefore some NSI’s needed to find tailor-made solutions in order to overcome these complications. Statistics Netherlands, for instance, used BR-variables in order to classify size classes to all enterprises. Another solution for dealing with missings could be the use of a complementary (country specific) source, a source that is not necessarily included in the scope of the project. Statistics Netherlands reported that it was difficult for them to successfully implement the trader-definition, because in the SBS sample many (largely smaller) enterprises were not available on micro level. The strict use of the trader definition led to a significant decrease in the amount of enterprises labelled as trader in the MDL-database, since all non-observed units were automatically assigned as non-traders. The use of additional secondary sources could tackle this issue.
A last important limitation regarding the output of the MDL-project is possible methodological changes in the national sources that influence the interpretation of the data. For example, break in time series due to definition changes, changes in data collection strategy, et cetera. In the Netherlands, for example, the definition of the enterprise group was altered in 2009, causing a break in time series in assigning the characteristic dependency to an enterprise. Similarly, an improvement of the data collection of international trade in goods statistics led to an increase in number of trading enterprises in 2014, since also all (very) small traders are accounted for. The sudden change is in this case largely attributable to better data collection, and not because of abrupt changes in the ‘real world’.
Micro Data Linking 2014/2015: Methodological report on meta information 23
Micro Data Linking 2014/2015: Methodological report on meta information 24

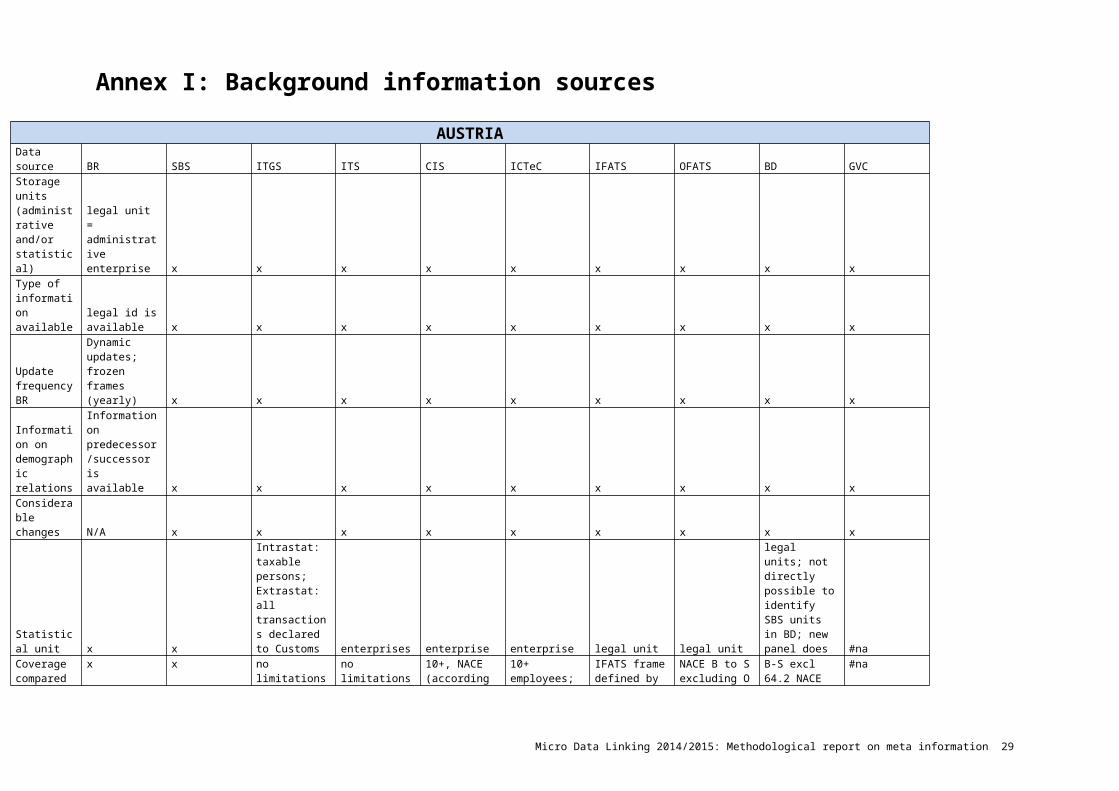
Annex I: Background information sourcesAUSTRIA
Data source BR SBS ITGS ITS CIS ICTeC IFATS OFATS BD GVCStorage units (administrative and/or statistical)
legal unit = administrative enterprise x x x x x x x x x
Type of information available
legal id is available x x x x x x x x x
Update frequency BR
Dynamic updates; frozen frames (yearly) x x x x x x x x x
Information on demographic relations
Information on predecessor/successor is available x x x x x x x x x
Considerable changes N/A x x x x x x x x x
Statistical unit x x
Intrastat: taxable persons; Extrastat: all transactions declared to Customs enterprises enterprise enterprise legal unit legal unit
legal units; not directly possible to identify SBS units in BD; new panel does #na
Coverage compared vs SBS x x
no limitations NACE breakdown
no limitations NACE breakdown
10+, NACE (according Regulation)
10+ employees; see excel file included
IFATS frame defined by SBS population (including NACE K)
NACE B to S excluding O (reporting units = resident units; including natural persons)
B-S excl 64.2 NACE rev 2 #na
Compilation principles
* Cut-off limits x
Intrastat: 300k € (2007-2009); 500k€ (2010-2012); Extrastat: none
€ 50.000 and accordingly € 200.000 depending on NACE classification enterprises 10+ 10+
according to SBS; for small units country of control is country of direct foreign owner, not that of the UCI
Min investment 100k € equity or 1M € balance sheet total affiliate
10K € turnover or at least 1 empl #na
* Extraction population
x Intrastat: Tax authorities supply
Business Register BR BR T-1 data, FDI data, admin data
T-1 data, FDI, media reports
BR and supplementary sources
#na
Micro Data Linking 2014/2015: Methodological report on meta information 25
information for Intrastat register; Extrastat: Custom declarations
* Suppl/compl data x
secondary VAT data N/A non used #na
shareholder data from company register -
VAT, Social Security #na
* Sampling strategy x N/A
cut-off stratified sampling
census 250+; sampling 10-249;
census 250+; stratified random sample: 1/3 of 50-249, 8% of 10-49 census census work in progress #na
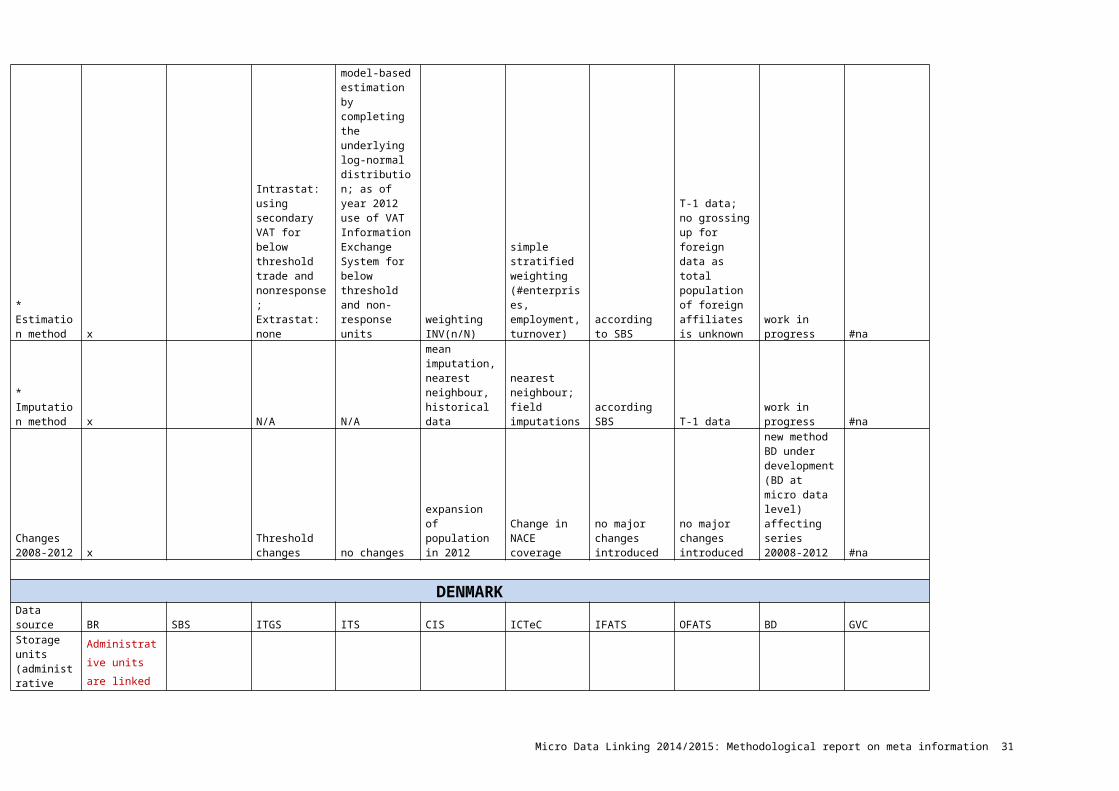
* Estimation method x
Intrastat: using secondary VAT for below threshold trade and nonresponse; Extrastat: none
model-based estimation by completing the underlying log-normal distribution; as of year 2012 use of VAT Information Exchange System for below threshold and non-response units
weighting INV(n/N)
simple stratified weighting (#enterprises, employment, turnover) according to SBS
T-1 data; no grossing up for foreign data as total population of foreign affiliates is unknown work in progress #na
* Imputation method x N/A N/A
mean imputation, nearest neighbour, historical data
nearest neighbour; field imputations according SBS T-1 data work in progress #na
Changes 2008-2012 x
Threshold changes no changes
expansion of population in 2012
Change in NACE coverage
no major changes introduced
no major changes introduced
new method BD under development (BD at micro data level) affecting series 20008-2012 #na
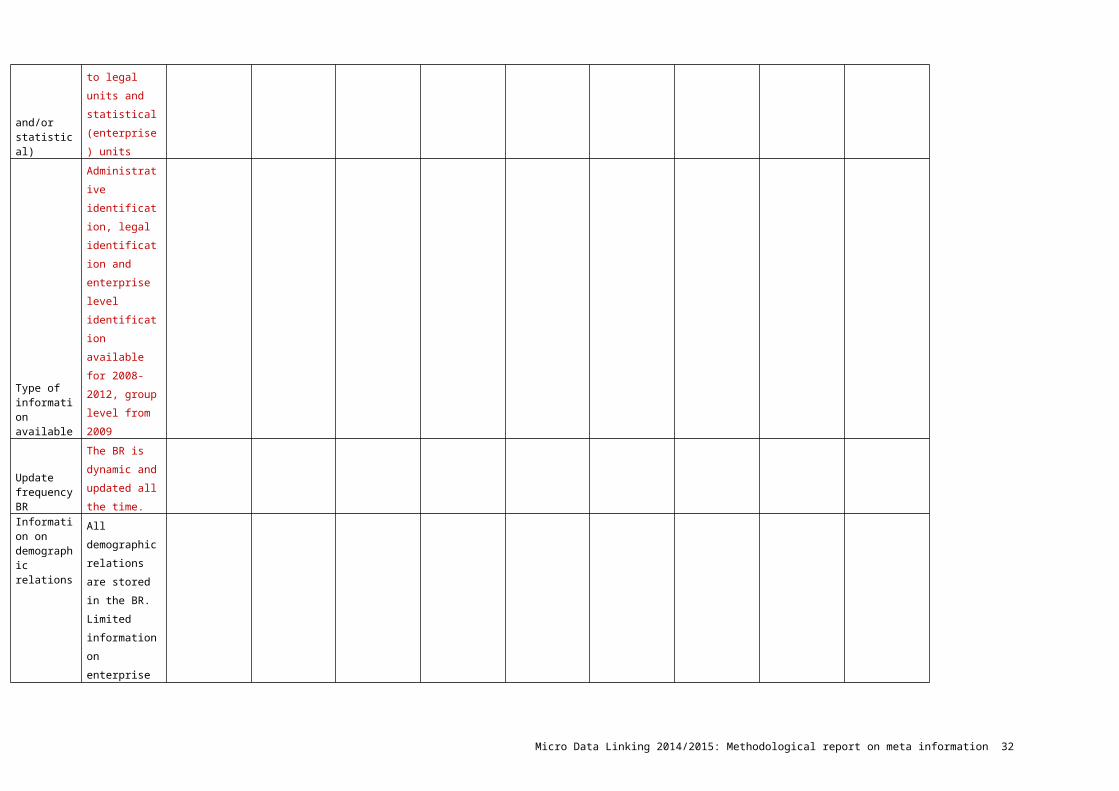
DENMARKData source BR SBS ITGS ITS CIS ICTeC IFATS OFATS BD GVCStorage units (administrative and/or
Administrative
units are linked
Micro Data Linking 2014/2015: Methodological report on meta information 26

statistical)
to legal units and
statistical
(enterprise) units
Type of information available
Administrative
identification,
legal
identification
and enterprise
level
identification
available for
2008-2012,
group level from
2009
Update frequency BR
The BR is
dynamic and
updated all the
time.
Information on demographic relations
All demographic
relations are
stored in the BR.
Limited
information on
enterprise
groups.
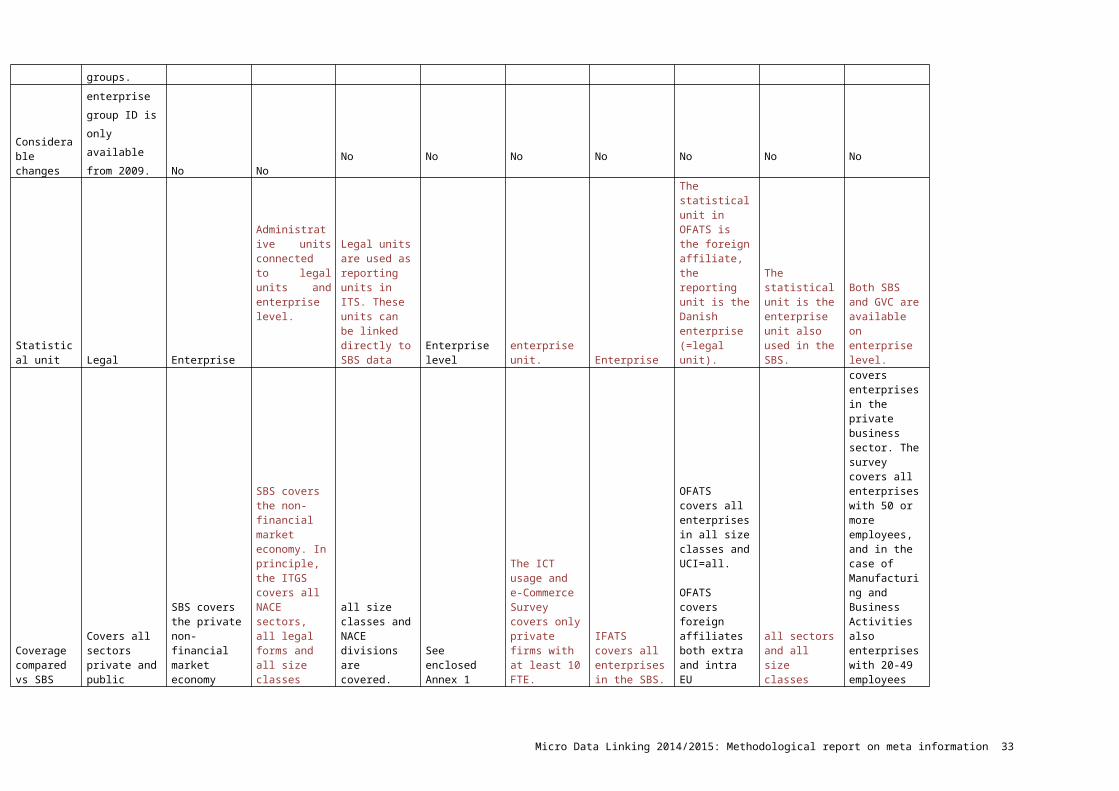
Considerable changes
enterprise group
ID is only
available from
2009. No NoNo No No No No No No
Statistical unit Legal Enterprise Administrative units connected to legal units and enterprise level.
Legal units are used as reporting units in ITS. These units can be linked directly to SBS data
Enterprise level enterprise unit. Enterprise The statistical unit in OFATS is the foreign affiliate, the reporting unit is the Danish
The statistical unit is the enterprise unit also used in the SBS.
Both SBS and GVC are available on enterprise level.
Micro Data Linking 2014/2015: Methodological report on meta information 27
enterprise (=legal unit).
Coverage compared vs SBS
Covers all sectors private and public
SBS covers the private non-financial market economy
SBS covers the non-financial market economy. In principle, the ITGS covers all NACE sectors, all legal forms and all size classes
all size classes and NACE divisions are covered.
See enclosed Annex 1
The ICT usage and e-Commerce Survey covers only private firms with at least 10 FTE.
IFATS covers all enterprises in the SBS.
OFATS covers all enterprises in all size classes and UCI=all.
OFATS covers foreign affiliates both extra and intra EU
all sectors and all size classes
covers enterprises in the private business sector. The survey covers all enterprises with 50 or more employees, and in the case of Manufacturing and Business Activities also enterprises with 20-49 employees
Compilation principles
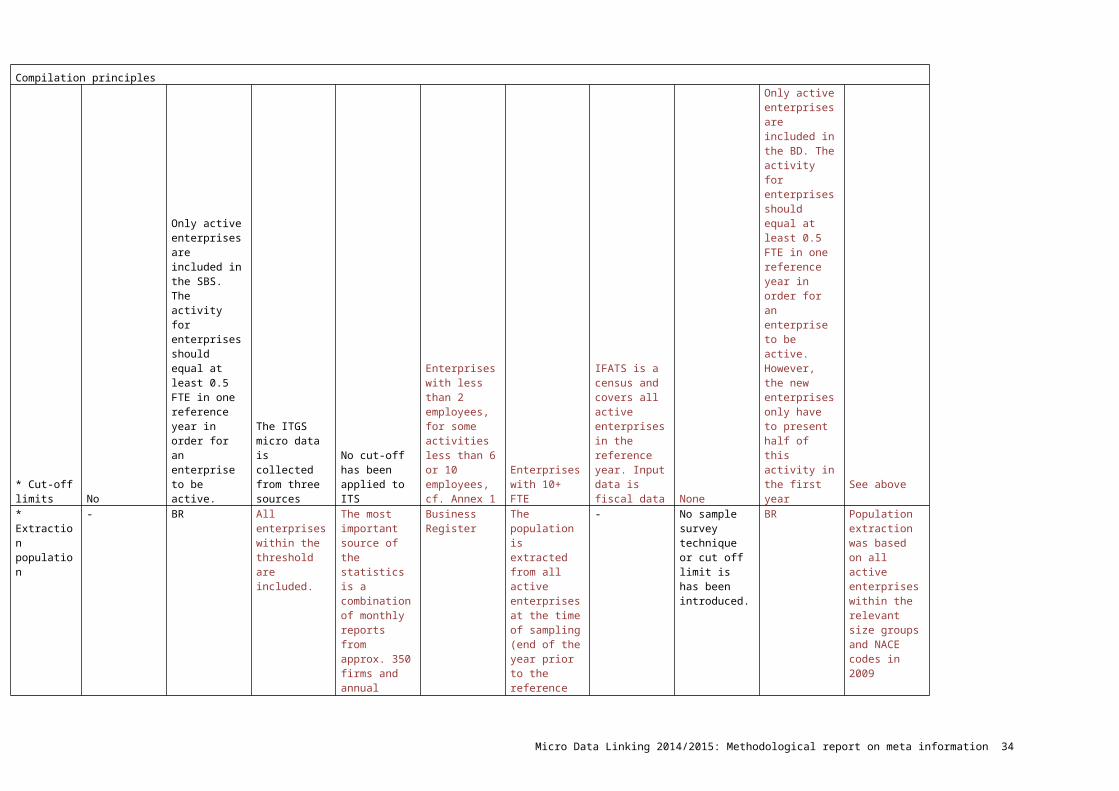
* Cut-off limits No
Only active enterprises are included in the SBS. The activity for enterprises should equal at least 0.5 FTE in one reference year in order for an enterprise to be active.
The ITGS micro data is collected from three sources
No cut-off has been applied to ITS
Enterprises with less than 2 employees, for some activities less than 6 or 10 employees, cf. Annex 1
Enterprises with 10+ FTE
IFATS is a census and covers all active enterprises in the reference year. Input data is fiscal data None
Only active enterprises are included in the BD. The activity for enterprises should equal at least 0.5 FTE in one reference year in order for an enterprise to be active. However, the new enterprises only have to present half of this activity in the first year
See above
* Extraction population - BR
All enterprises within the threshold are included.
The most important source of the statistics is a combination of monthly reports from approx. 350 firms and annual (prior to 2009 quarterly) reports from approx. 1300 firms. Business Register
The population is extracted from all active enterprises at the time of sampling (end of the year prior to the reference year) from the Business Register. -
No sample survey technique or cut off limit is has been introduced. BR
Population extraction was based on all active enterprises within the relevant size groups and NACE codes in 2009
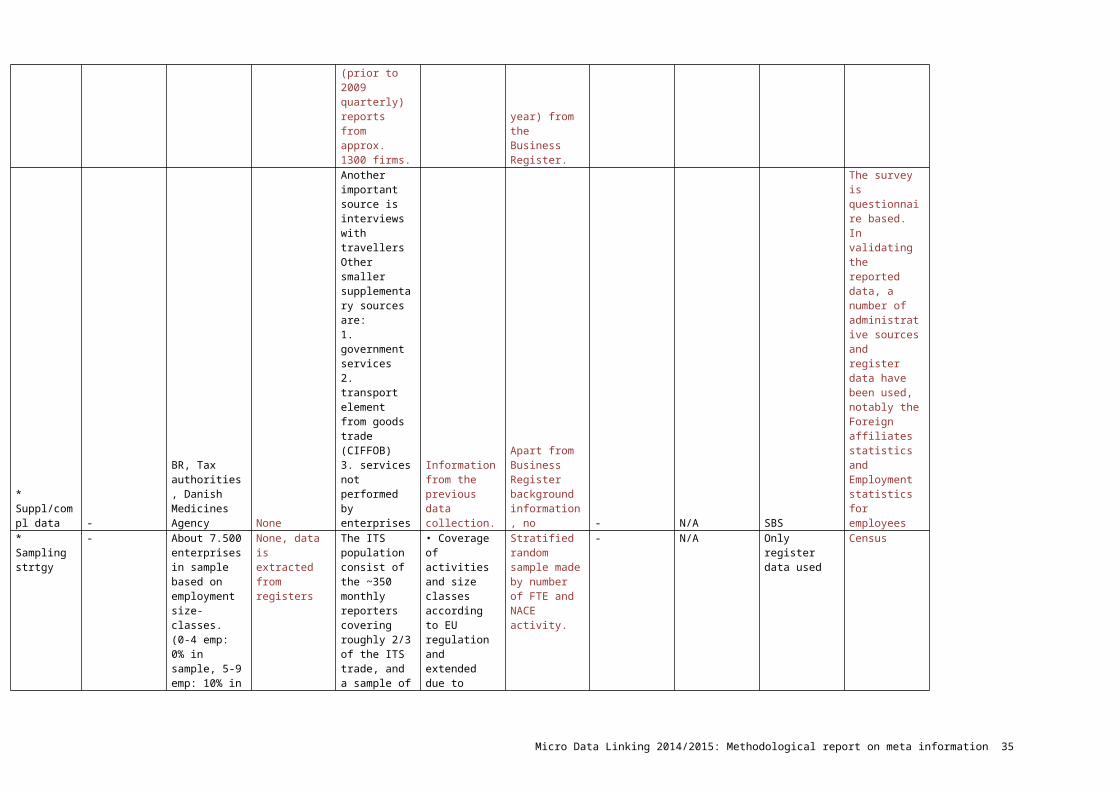
* - BR, Tax None Another Information from Apart from - N/A SBS The survey is
Micro Data Linking 2014/2015: Methodological report on meta information 28
Suppl/compl data
authorities, Danish Medicines Agency
important source is interviews with travellersOther smaller supplementary sources are: 1. government services 2. transport element from goods trade (CIFFOB) 3. services not performed by enterprises
the previous data collection.
Business Register background information, no
questionnaire based. In validating the reported data, a number of administrative sources and register data have been used, notably the Foreign affiliates statistics and Employment statistics for employees
* Sampling strtgy -
About 7.500 enterprises in sample based on employment size-classes. (0-4 emp: 0% in sample, 5-9 emp: 10% in sample, 10-19 emp: 20% in sample, 20-49 emp: 50% in sample, 50+ emp: 100% in sample).
None, data is extracted from registers
The ITS population consist of the ~350 monthly reporters covering roughly 2/3 of the ITS trade, and a sample of ~1300 yearly reporters, that are stratified by activity and size. The activity classes and size classes are customized to optimize the sample for greater accuracy for the total trade of services, and not to represent the different activity classes and size classes in the economy. Updated roughly every 5 year.
• Coverage of activities and size classes according to EU regulation and extended due to national demands. • All with 100(+) employees are included. • All enterprises with 2 or more employees in the activity R&D are included.• All enterprises that have stated a minimum of R&D- or innovation expenses in the previous years’ data collection are included.• Rest of the population: drawn as a rolling sample where app. ¼ to 1/5 of the respondents are replaced each year
Stratified random sample made by number of FTE and NACE activity. - N/A
Only register data used Census
Micro Data Linking 2014/2015: Methodological report on meta information 29
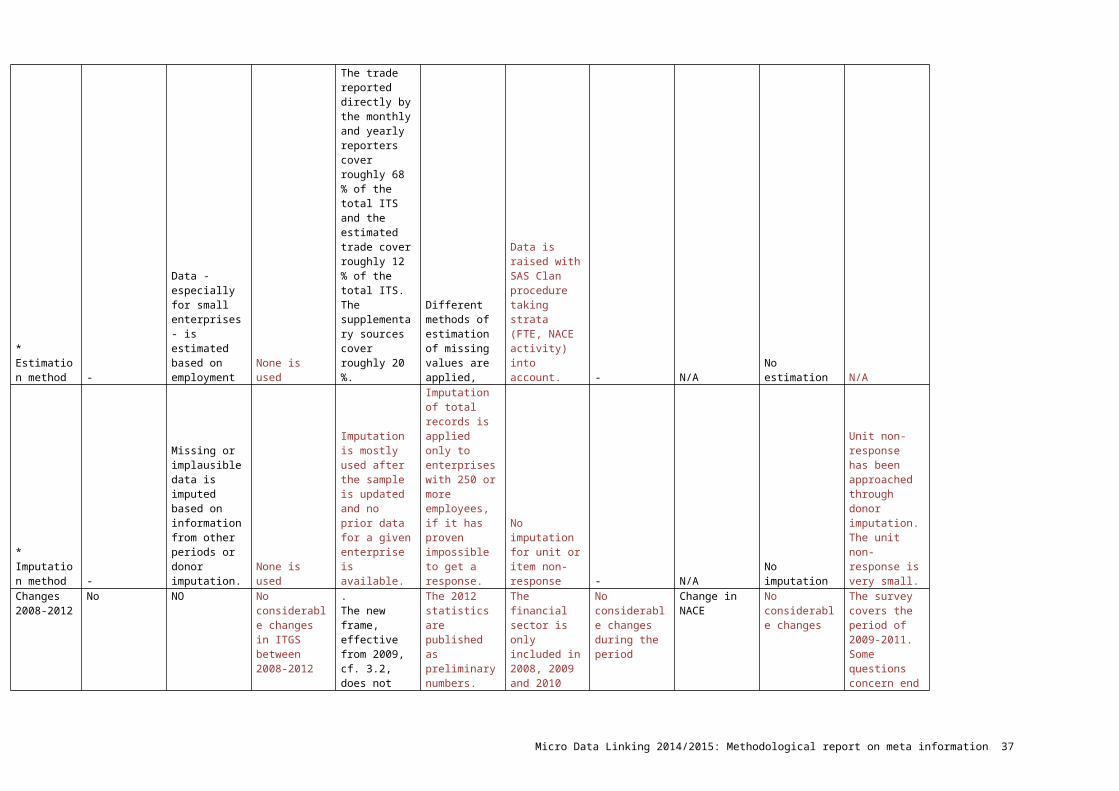
* Estimation method -
Data - especially for small enterprises - is estimated based on employment None is used
The trade reported directly by the monthly and yearly reporters cover roughly 68 % of the total ITS and the estimated trade cover roughly 12 % of the total ITS. The supplementary sources cover roughly 20 %.
Different methods of estimation of missing values are applied,
Data is raised with SAS Clan procedure taking strata (FTE, NACE activity) into account. - N/A No estimation N/A
* Imputation method -
Missing or implausible data is imputed based on information from other periods or donor imputation. None is used
Imputation is mostly used after the sample is updated and no prior data for a given enterprise is available.
Imputation of total records is applied only to enterprises with 250 or more employees, if it has proven impossible to get a response.
No imputation for unit or item non-response - N/A No imputation
Unit non-response has been approached through donor imputation. The unit non-response is very small.
Changes 2008-2012 No NO
No considerable changes in ITGS between 2008-2012
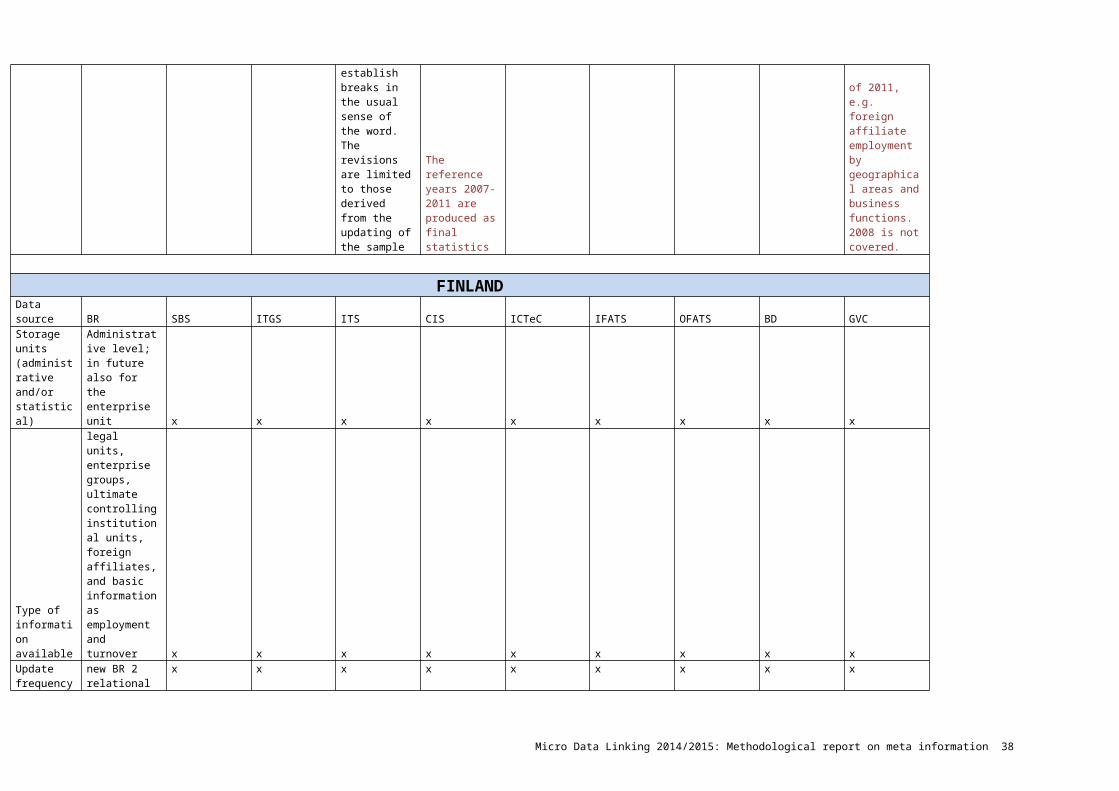
.The new frame, effective from 2009, cf. 3.2, does not establish breaks in the usual sense of the word. The revisions are limited to those derived from the updating of the sample
The 2012 statistics are published as preliminary numbers. The reference years 2007-2011 are produced as final statistics
The financial sector is only included in 2008, 2009 and 2010
No considerable changes during the period Change in NACE
No considerable changes
The survey covers the period of 2009-2011. Some questions concern end of 2011, e.g. foreign affiliate employment by geographical areas and business functions. 2008 is not covered.
FINLANDData source BR SBS ITGS ITS CIS ICTeC IFATS OFATS BD GVC
Storage units Administrative x x x x x x x x x
Micro Data Linking 2014/2015: Methodological report on meta information 30
(administrative and/or statistical)
level; in future also for the enterprise unit
Type of information available
legal units, enterprise groups, ultimate controlling institutional units, foreign affiliates, and basic information as employment and turnover x x x x x x x x x
Update frequency BR
new BR 2 relational databases (1 constantly updated, 1 frozen). Old BR one relational, constantly updated. x x x x x x x x x
Information on demographic relations
Yes, and for all units. Births, change of legal form, continuation of activity, bankruptcy, fusion, merger, and other such data are available from tax administration x x x x x x x x x
Considerable changes N/A x x x x x x x x x
Statistical unit x x Legal units legal units
legal units; no problematic linking legal units legal units legal units
Legal units (17% not in SBS) legal units
Coverage compared vs SBS x x
Smallest importers and exporters are not covered SBS thresholds
partial coverage NACE compared to SBS; enterprise 10+ small differences
IFATS not subset B-N_S95_x_K
OFATS not subset to B-N_S95_x_K
more units than is SBS (all industries, all sizes)
thresholds SBS and IS
Compilation principles
* Cut-off x 200-500k€ 1M€ based on enterprises 10+ 10+ employees N/A N/A enterprises that 100+
Micro Data Linking 2014/2015: Methodological report on meta information 31
limitsdepending year/variable VAT
pay VAT, and/or employ people
* Extraction population x
Intrastat and Custom declarations
Traders T-1 plus new traders VAT above threshold from SBS SBS BR and SBS BR
BR and tax administration records from SBS
* Suppl/compl data x VAT VAT data
SBS and R&D data BR
Group structures from annual reports/financial statements
Group structures from annual reports/financial statements N/A
FATS, web information
* Sampling strtgy x N/A
Stratified sampling based on ownership, employment and industry
census 250+; sampling 10-249;
census 100+/ stratified random sampling 10-99 census census no sampling census
* Estimation method x
2-5 % depending on year/variable
Approx. 4% based on sampling N/A
SAS Clan procedure N/A N/A N/A N/A
* Imputation method x
Based on VAT for below threshold trade 1% imputed
median values depending size class/activity; imputation 1-2 % on totals negligible N/A
estimate not available N/A
weights applied to observed units
Changes 2008-2012 x N/A
Increase of sample size
additional NACE Dic 86,78,88 in 2010 N/A N/A N/A none
ref period 2009-2011
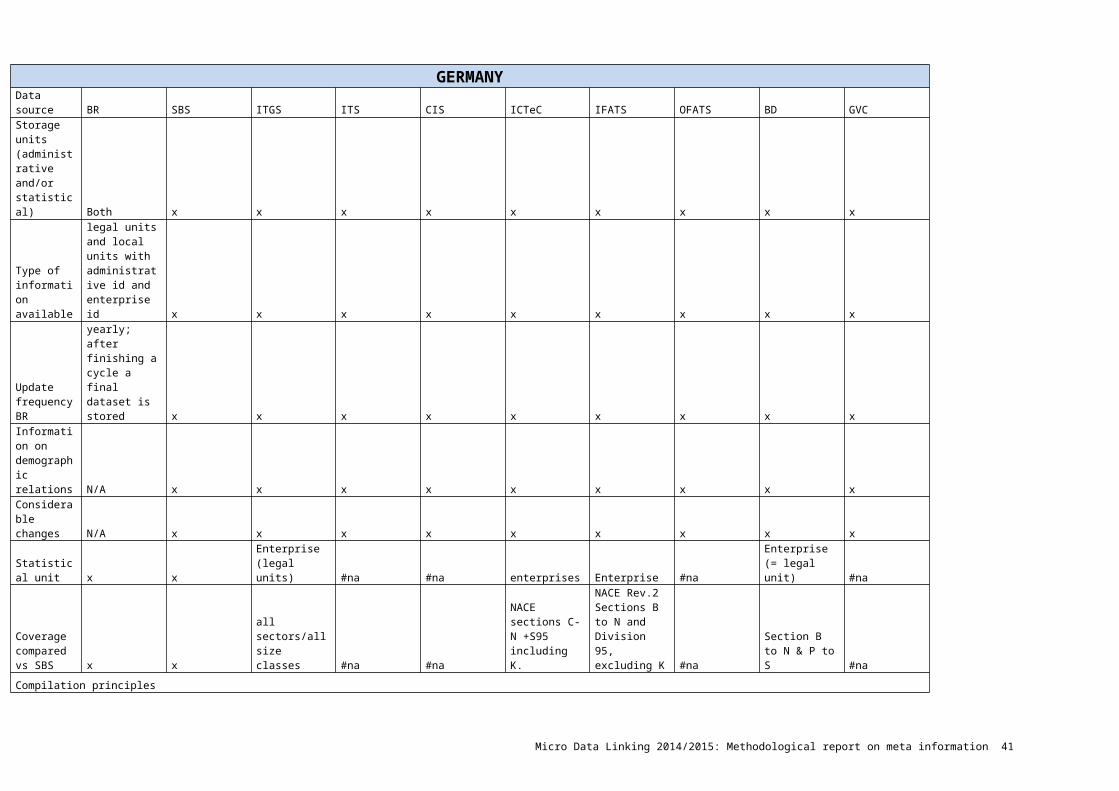
GERMANYData source BR SBS ITGS ITS CIS ICTeC IFATS OFATS BD GVCStorage units (administrative and/or statistical) Both x x x x x x x x x
Type of information available
legal units and local units with administrative id and enterprise id x x x x x x x x x
Update frequency BR
yearly; after finishing a cycle a final dataset is stored x x x x x x x x x
Information on demographic relations N/A x x x x x x x x xConsiderable changes N/A x x x x x x x x x
Micro Data Linking 2014/2015: Methodological report on meta information 32
Statistical unit x xEnterprise (legal units) #na #na enterprises Enterprise #na
Enterprise (= legal unit) #na
Coverage compared vs SBS x x
all sectors/all size classes #na #na
NACE sections C-N +S95 including K.
NACE Rev.2 Sections B to N and Division 95, excluding K #na
Section B to N & P to S #na
Compilation principles
* Cut-off limits x
Intrastat: 300k € (2008); 400k(2009-2011); 500k (2012); Extrastat: none #na #na
10+ employees; shorter questionnaire for <10 employees #na
>17,500 € taxable turnover or >= 1 employees subject to social insurance #na
* Extraction population x
Complete count ( Intrastat: Trade register + Tax register; Extrastat: Custom declarations) #na #na Sample from BR
BR, Bureau Van Dijk #na
Complete count according to Business Register #na
* Suppl/compl data x N/A #na #na N/A
SBS, administrative data from BR #na #na
* Sampling strtgy x N/A #na #na
stratified random sampling (stratified by federal states, NACE, employment size classes) census #na N/A #na
* Estimation method x N/A #na #na
Estimation basing on regressions N/A #na N/A #na
* Imputation method x N/A #na #na
t-1 data, means, auxiliary attributes
T-1 data, imputation by arithmetic means, multiple imputation (from 2012) #na
If no information from BR or SBS about the persons employed the characteristic is estimated #na
Changes 2008-2012 x
Threshold changes #na #na
Switch to NACE Rev. 2 in 2009
2012: new data provider (Bisnode) for enterprise group information #na N/A #na
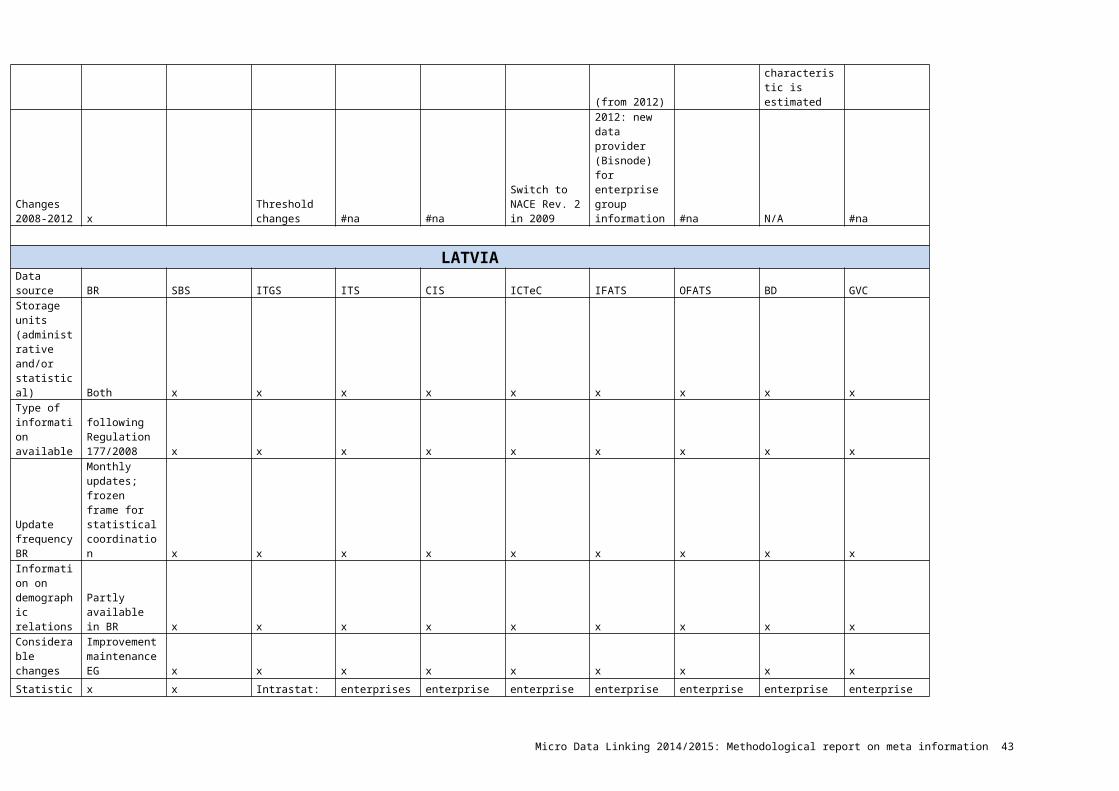
LATVIAData source BR SBS ITGS ITS CIS ICTeC IFATS OFATS BD GVC
Micro Data Linking 2014/2015: Methodological report on meta information 33
Storage units (administrative and/or statistical) Both x x x x x x x x xType of information available
following Regulation 177/2008 x x x x x x x x x
Update frequency BR
Monthly updates; frozen frame for statistical coordination x x x x x x x x x
Information on demographic relations
Partly available in BR x x x x x x x x x
Considerable changes
Improvement maintenance EG x x x x x x x x x
Statistical unit x x
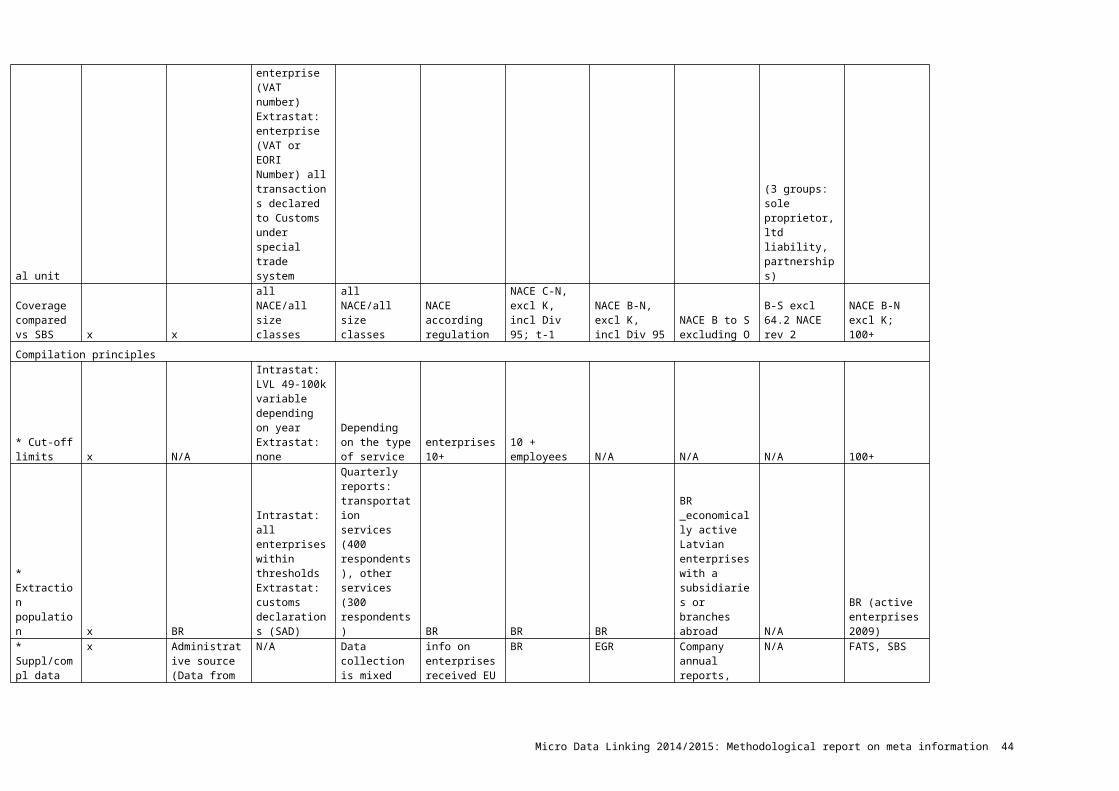
Intrastat: enterprise (VAT number)Extrastat: enterprise (VAT or EORI Number) all transactions declared to Customs under special trade system enterprises enterprise enterprise enterprise enterprise
enterprise (3 groups: sole proprietor, ltd liability, partnerships) enterprise
Coverage compared vs SBS x x
all NACE/all size classes
all NACE/all size classes
NACE according regulation
NACE C-N, excl K, incl Div 95; t-1
NACE B-N, excl K, incl Div 95
NACE B to S excluding O
B-S excl 64.2 NACE rev 2
NACE B-N excl K; 100+
Compilation principles
* Cut-off limits x N/A
Intrastat: LVL 49-100k variable depending on yearExtrastat: none
Depending on the type of service enterprises 10+ 10 + employees N/A N/A N/A 100+
* Extraction population x BR
Intrastat: all enterprises within thresholdsExtrastat: customs declarations (SAD)
Quarterly reports: transportation services (400 respondents), other services (300 respondents) BR BR BR
BR _economically active Latvian enterprises with a subsidiaries or branches abroad N/A
BR (active enterprises 2009)
* x Administrative N/A Data collection is info on BR EGR Company annual N/A FATS, SBS
Micro Data Linking 2014/2015: Methodological report on meta information 34
Suppl/compl data
source (Data from The State Revenue Service of Latvia)
mixed system, surveys supplemented with ITRS. Travellers survey, Central Bank and MFI profit and loss statements.
enterprises received EU funding
reports, European Business Register information.
* Sampling strtgy x
Stratified random sampling N/A
Significant exporters/importers fully covered, other by using threshold depending on the type of service
sampling & census
stratified random sampling Census Census N/A Census
* Estimation method x Neyman
Intrastat estimates based on VAT for nonresponse and below threshold trade disseminated by CN section level and by partner country; Extrastat: none N/A
Weighting INV(n/N)
Horwitz-Thompson N/A N/A N/A N/A
* Imputation method
x Enterprises, which are surveyed exhaustively and, which did not respond with statistical survey as well as non-sampled enterprises, which are covered by mass imputation, are imputed using the data from administrative sources. Imputation of other statistical survey data, data
N/A Surveys data supplemented with ITRS data
N/A N/A N/A Company annual reports, European Business Register information.
N/A imputation from SBS and FATS
Micro Data Linking 2014/2015: Methodological report on meta information 35

of previous period (with correction) or donor data imputation is done if no administrative data have been found. Non-response for enterprises, which are included in the sample survey part are corrected in the weighting procedure.
Changes 2008-2012 x
Threshold changes
Threshold changes
Changes of sampling frame
additional coverage NACE 59,60,72,73 N/A No No none
ref period 2009-2011 (2008 not covered)
THE NETHERLANDSData source BR SBS ITGS ITS CIS ICTeC IFATS OFATS BD GVCStorage units (administrative and/or statistical) Both x x x x x x x x x
Type of information available
legal identification, enterprise unit, local unit, structure and relations enterprise groups x x x x x x x x x
Update frequency BR
Monthly updates; frozen frame for statistical coordination x x x x x x x x x
Information on demographic relations
begin/end, type of demographic event x x x x x x x x x
Considerable Changes in 2009 Changes in 2009 x x x x x x x x
Micro Data Linking 2014/2015: Methodological report on meta information 36
changes
(NACE Rev 1.1 to NACE Rev.2; new definition of enterprise and enterprise group)
(NACE Rev 1.1 to NACE Rev.2; new definition of enterprise and enterprise group)
Statistical unit xEnterprise and enterprise group VAT number
enterprises and enterprise groups enterprise enterprise enterprise enterprise group enterprise enterprise
Coverage compared vs SBS x x
SBS is subset (ITGS covers all NACE)
SBS subset for ITSS 10+ 10+ employees
NACE Rev.2 Sections B to N and Division 95, excluding K (from 2008)
NACE B to S excluding O (from 2010)
Section B to N, excluding K64.2. incl. S95(NACE Rev.2)
SBS business economy excl K; 100+
Compilation principles
* Cut-off limits x Not applicable
Intrastat: 900.000 euros (until 2013); 1,5 Million (as of 2014) Not applicable enterprises 10+ 10+ employees N/A
Balance total in T-1 and T-2 > 23 Million Euros N/A
100+ persons employed
* Extraction population x BR
Intrastat: Tax register; Extrastat: Custom declarations BR from BR BR T-1 data T-1 data
BR (additional checks for economic activity by using VAT, tax, employment data) BR
* Suppl/compl data x
Small enterprises' values are estimated partly by using VAT-tax data
VAT, VIES (as of September 2013), historical data
Central Bank, Banks,SPE's, Travels, time series estimations N/A N/A
SBS, CIS, Employment statistics, external sources (registers)
annual reports of enterprises ; tax data; financial data known in other internal statistics N/A SBS
* Sampling strtgy x
Yearly sample where large enterprises are more likely to be in sample
Intrastat: all VAT numbers trading above threshold; Extrastat: total collection
Large ITS trades full coverage, other by yearly sample
NACE 2 digit and size class
stratified random sampling census
all enterprises in statistic ''finances of large enterprises'' N/A
stratified sampling (size class, NACE)
* Estimation method x weighing
Based on VAT and VIES Direct estimation weighting weighting N/A
annual reports of enterprises N/A N/A
* Imputation method x
Imputation algorithms based on T-1 data and extrapolation of VAT trends.
Based on historical reports
Imputation algorithms depending on data source
merging of strata; donor imputation
nearest neighbour; T-1 data
using suppl/compl. Data
annual reports of enterprises N/A
missing values were replaced by ''unknown''
Changes 2008-2012
x Changes in 2009 (NACE Rev 1.1 to
Threshold changes
No changes Imputation manually (since
Changes in 2009 (NACE Rev 1.1 to
Changes in 2009 (NACE Rev 1.1 to
Changes in 2009 (NACE Rev 1.1 to
Changes in 2009 (NACE Rev 1.1 to
ref period 2009-2011 (2008 not
Micro Data Linking 2014/2015: Methodological report on meta information 37
NACE Rev.2; new definition of enterprise and enterprise group)
2012) instead of automatically
NACE Rev.2; new definition of enterprise and enterprise group)
NACE Rev.2; new definition of enterprise and enterprise group)
NACE Rev.2; new definition of enterprise and enterprise group)
NACE Rev.2; new definition of enterprise and enterprise group) covered)
NORWAYData source BR SBS ITGS ITS CIS ICTeC IFATS OFATS BD GVCStorage units (administrative and/or statistical)
Administrative level x x x x x x x x x
Type of information available
LU id, Ent id, EG id x x x x x x x x x
Update frequency BR
Dynamic/working with provisional datasets x x x x x x x x x
Information on demographic relations
relationship LKAU and enterprise, date change ownership. Enterprise = legal unit x x x x x x x x x
Considerable changes N/A x x x x x x x x x
Statistical unit x x enterprise enterprises enterprise enterprise enterprise enterprise Enterprise enterprise
Coverage compared vs SBS x x
SBS is subset (ITGS covers all NACE)
SBS subset for ITSS
Size class: 5 employees and more, NACE: A-K, M (with some exceptions) #na No differences No differences. no difference Nace B-N excel K
Compilation principles
* Cut-off limits x
Extrastat, no cut off of importance, only single item lines less than NOK 1.000 #na
50 employees (but random sample of smaller enterprises, 5+ employees
2008: 5 or more employers, 2009-2010: 10 or more None
no 'total' OFATS population no 100+
* Extraction population
x Extra: customs declarations. Separate collection exp
Quarterly 3500 as from 2013 q1, previously app 3000
BR Nace 16-6, 68-74, 77-82 +95.1. Only mainland included (not
BR sample survey together with outward FDI. Population based
BR active enterprises 100+ 2009
Micro Data Linking 2014/2015: Methodological report on meta information 38

crude oil natural gas, ships and elec. current both imp/exp covered is 0.05)
on annual reports and other sources
* Suppl/compl data x see above
Travellers survey, and other sources
mainly survey data. Number of employees and turnover from BR N/A EGR from 2010 N/A no #na
* Sampling strtgy x
Extrastat: total collection
extensive information available
Random sample of enterprises with 5-49 employees stratified by NACE and size class. In general 15% sample for enterprises with 5-9 employees and 35% for enterprises 20-49. Smaller sample in some specific NACE
sample 10+ employers, stratified by industry and size of enterprise measured by employment; 10-19 p 7,5%, 20-49 p 15%, 50-99 p 50%, 100-249 p 75% and 250+ all
IFATS: part of SBS
See extraction of population no sampling census
* Estimation method x N/A
simple stratified inflation of the sample
Ratio estimator for enterprises with 5-49 employees. Weights based on number employees (nominal values) and number of variables (qualitative variables) N/A
Directorate of Taxers'register, press and internet
No grossing-up is conducted not relevant N/A
* Imputation method x N/a
Use t-1 data if available
Low degree of imputation due to high unit response rate and also high item response rate N/A
IFATS: according SBS
No delivery and present in T-1, enterprises of a certain size will be imputed not relevant
All enterprises from NACE-rev2 B-N excl K with more than 100 persons employed. This covering almost all enterprises within non-financial sector by the end of year 2009
Changes x No major in 2010/2011 #na 2008: 5 or more Use of EGR No considerable none ref period 2009-
Micro Data Linking 2014/2015: Methodological report on meta information 39

2008-2012 changes
changes concerning sample
In order to make a more comparable time series for non-financial services we have included figures for shipping services from SBS in the years where they are not included the usual data collection for non-financial services.
From 2012 and onwards the maritime services figures are again included on a regular basis in the non-financial services statistics and the relation between reported and published figures is as expected.
Figures for External trade used in the MDL project are imports excluding ships and oil platformsFor exports excl. ships, oil platforms, crude oil, natural gas and condensate.
employers, 2009-2010: 10 or more
improved coverage changes 2011
Micro Data Linking 2014/2015: Methodological report on meta information 40
PORTUGALData source BR SBS ITGS ITS CIS ICTeC IFATS OFATS BD GVCStorage units (administrative and/or statistical) Both x x x x x x x x xType of information available
legal identification x x x x x x x x x
Update frequency BR
daily update. Dynamic register x x x x x x x x x
Information on demographic relations
begin/end, type of demographic event, relation start x x x x x x x x x
Considerable changes N/A x x x x x x x x x
Statistical unit x x VAT person #naenterprise(=legal unit)
enterprise(=legal unit)
enterprise(=legal unit) #na
enterprise(=legal unit)
enterprise(=legal unit)
Coverage compared vs SBS x x
natural persons and non-resident enterprises #na
sample, 3 groups size class ge 10 empl; NACE B-F, H, J, K, M, Q
all size classes; NACE, turnover; acc. Reg 808/2004 No differences #na no differences SBS excl K; 100+
Compilation principles
* Cut-off limits x
Intra-EU: 250k/350k; Extra-EU: none #na
all enterprises surveyed > 9 empl.
turnover quantile 10% N/A #na no 100+
* Extraction population x
Extra: SAD; Intra: BR and VAT #na BR
SBS reference frame
SBS enterprises under foreign control #na
BD produced under SBS data
active enterprises 100+ 2009
* Suppl/compl data x T-1 data Intrastat #na
admin data from IES Admin data IES
Administrative data; EGR data from 2011 on #na N/A #na
* Sampling strtgy x
all enterprises above annual exemption #na
Strata NACE, 10+ empl., ec act., size class, NUTSII
stratified random sampling Census #na no sampling random sampling
* Estimation method x
extensive information available #na
weighting INV(n/N)
weighting (#enterprises, turnover, employment) N/A #na N/A simple grossing
* Imputation method x
extensive information available #na
hot/cold deck imputations, mean imputation, trimmed means
re-weighting (unit non-response) and admin information
first owner or Portugal #na N/A N/A
Micro Data Linking 2014/2015: Methodological report on meta information 41

Changes 2008-2012 x
change in methodology 2010 #na none
change NACE Rev1.1/NACE Rev2
Use of EGR improved coverage #na none N/A
SWEDENData source BR SBS ITGS ITS CIS ICTeC IFATS OFATS BD GVCStorage units (administrative and/or statistical) Both x x x x x x x x x
Type of information available
legal identification, enterprise unit, local unit, structure and relations enterprise groups x x x x x x x x x
Update frequency BR
weekly updates; statistical use: x x x x x x x x x
Information on demographic relations
takeovers etc. using historic information x x x x x x x x x
Considerable changes
inclusion non-resident enterprises and inactive businesses with elderly owners and which has sole proprietorship. x x x x x x x x x
Statistical unit xactivity/enterprise
enterprise (not all VAT numbers match BR) legal units enterprise enterprise legal units legal units enterprise legal units
Coverage compared vs SBS
x x Smallest importers and exporters are not covered
ITSS covers all sectors
Sample for enterprises 10-249 empl. Census 250+ employees and NACE 72. NACE covered in CIS: 05-09, 10-33, 35-39, 46, 49-53, 58, 61-63, 64-66, 71-
10+ empl; NACE whole business sector
whole business sector
SBS including section K
SBS excl K; 100+
Micro Data Linking 2014/2015: Methodological report on meta information 42
72. CIS2012 also covered NACE 47,59,60,73
Compilation principles
* Cut-off limits x
All enterprises are surveyed.
Intrastat: SEK 4.5 M a/d; Extrastat: none
1M SKR Turnover reporting
all enterprises surveyed > 9 empl. 10+ employees no no no 100+
* Extraction population x BR
Intrastat: Tax Authority; Extrastat: Customs Authority
BR, ITGS, FATS, SBS, T-1 information BR BR BR BR
BR active 10+ days BR
* Suppl/compl data x
SBS using compl information from the Swedish tax authority see above
Banks, Exchange Offices, Card Companies
turnover from SBS and Survey Financial enterprises VAT statistics
some info from Bisnode/MM partner database
some info from Bisnode/MM partner database
Bisnode, financial statements
Admin data, OFATS
* Sampling strtgy x
Census off all enterprises. SBS also use surveys on specific variables as cost, revenue and investments.
Intrastat: cut-off; Extrastat: total collection
census and sampling
NACE 2 digit * size classes (681 strata, n=5431)
stratified random sampling Register based Register based not relevant random sampling
* Estimation method x
PPS sampling technique applies on cost/revenue survey. A cut off method applies for the investments survey part of SBS.
Intrastat: monthly aggregate ; Extrastat: quarterly estimate invoiced value
Horwitz Thompson (90% of values)
Horwitz-Thompson on variance
Horwitz-Thompson not relevant not relevant not relevant
Horwitz-Thompson
* Imputation method
x Mean value imputation method applies where missing values are detected. Industry and firm size are the stratification variables.
Intrastat: 10 different automatic imputation methods for estimating the unit non response including the actual VAT value and forecasting methods (ES, ESM, Regression, AR-regression)
Cold deck & reweighting
hot deck imputation in CIS 2012, Banff imputation method were used in CIS2010. Regarding CIS2008 Eurostat developed a SAS-application that, for instance, controlled if the data had illogical answers and
re-weighting (unit non-response)
using T-1 data where missings; <5% imputed for appr. 15% employment stock
using T-1 data where missings; <5% imputed for appr. 15% employment stock
not relevant cold deck; sometimes hot deck
Micro Data Linking 2014/2015: Methodological report on meta information 43
and one non-automatically made imputation method for those PSI's where the reported data is not complete. Extrastat: none
imputed for missing values.
Changes 2008-2012 x none
substantial process improvements
Sample increase 2012
Additional coverage NACE 47, 59, 60, 73 in 2012 none none
Altered definition of concern in year 2010. The definition of Swedish concern include all affiliate firms with or without employees abroad. Also, the industry code for the Swedish affiliate abroad changed in year 2010. Both these changes follow the EU regulations: EU-regulation 716/2007.
Inclusion non-resident enterprises and inactive businesses with elderly owners and which has sole proprietorship. none
Micro Data Linking 2014/2015: Methodological report on meta information 44
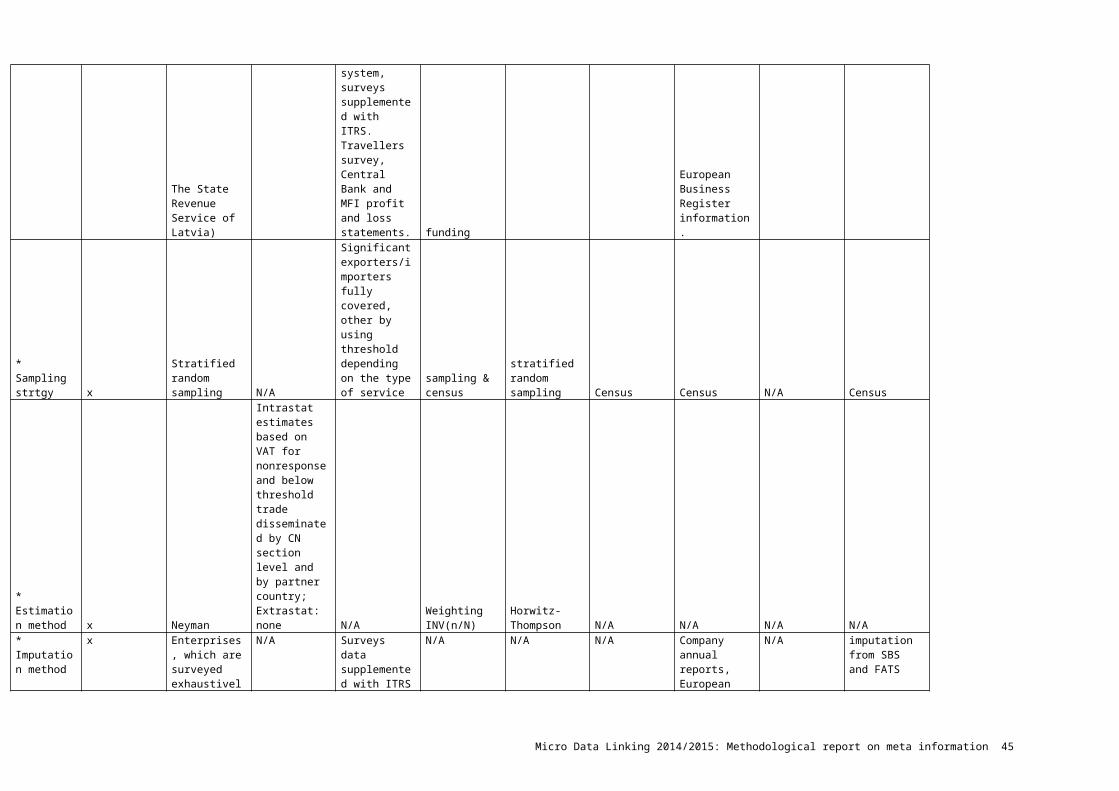
Annex II: Summary of country methodological reportsAUSTRIA DENMARK FINLAND GERMANY LATVIA NETHERLANDS NORWAY PORTUGAL SWEDEN
Phase I: Experiences with the building of the MDL-database1. How would you evaluate the circulated guidelines and SAS-syntaxes for phase 1?
Mistakes in guidelines
Guidelines function very well; Some mistakes corrected in syntax; Different versions of software and different software biggest issue.
A proposal for aggregated data sets for confidentiality checks were rejected by the project leaders. Unaware what consequences are for confidentiality.
Clear structure and visualizations; Instructions clear; Some variable definitions could have been more clear.
In general clear, but some more descriptions in SAS-syntax would be helpful
Guidelines were clear, even for NSI without much SAS-knowledge; Updates in syntax caused considerable extra time.
Guidelines exhaustive, detailed and comprehensive; Syntax efficient despite some minor mistakes.
Syntax easy to adept and apply; Instructions clearly written; Perhaps limit dataset to most relevant variables.
How do you evaluate the circulated guidelines?
5=excellent 5=excellent 4=very good 5=excellent 3=good 4=very good 3=good 4=very good 5=Excellent
How do you evaluate the circulated SAS-syntax?
4=very good
3=good 3=good 4=very good 3=good 4=very good 3=good 4=very good 5=Excellent
2. Did you find the approach to build the MDL-database used
Detailed approach was beneficial
Approach suitable, but appreciated closer
Suitable Suitable Satisfied with approach; Would have preferred to
Quite suitable. But include some useful
Suitable Suitable
Micro Data Linking 2014/2015: Methodological report on meta information 45
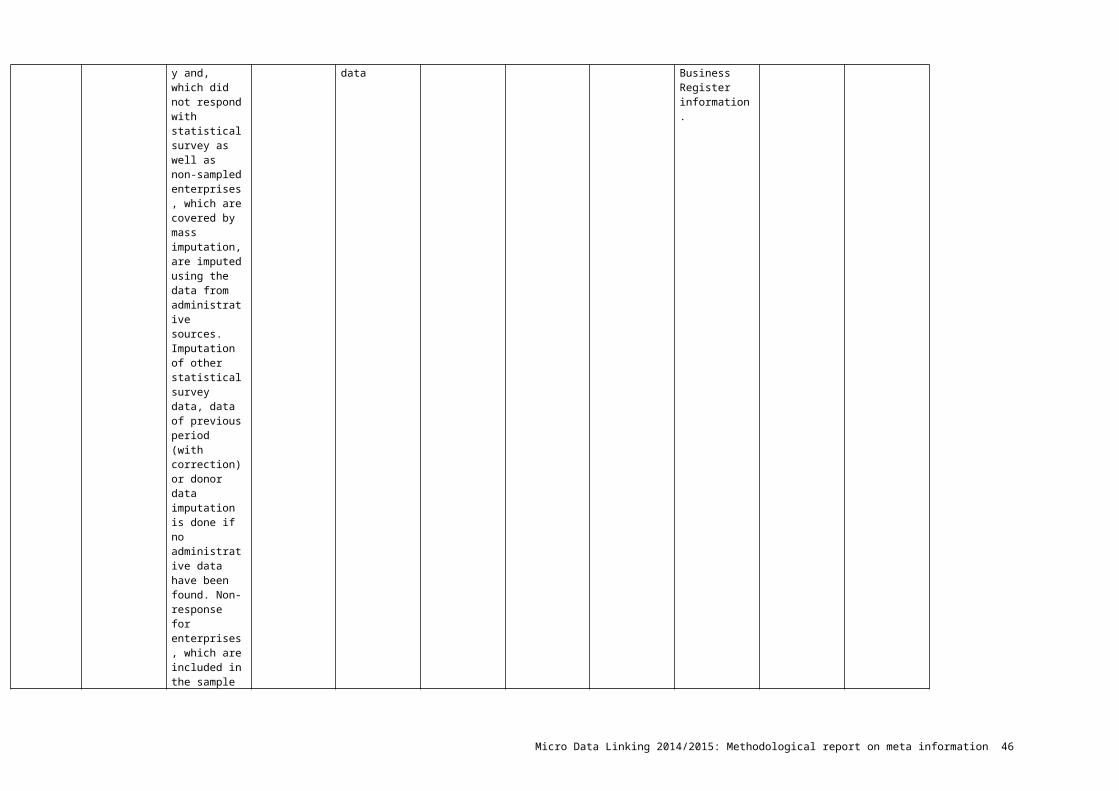
suitable? Would you have preferred a different approach?
but very time consuming
collaboration, for instance to solve confidentiality issue
work in SPSS environment.
variables (like name, address, etc.) when building database.
Summarize your answer by tick marking the table
5=strongly agree
4=agree 4=agree 5=strongly agree 5=strongly agree
4=agree 4=agree 4=agree 5=strongly agree
3. Did you encounter any problems/difficulties with transforming the variables of the national data sources into the standardized manner, as listed in Annex A of the guidelines? Please also report how these issues were solved.
No problems
Most time was spend on understanding data and variables and which to include. Once this was done, entering in database and editing with syntax was simple.
Some variables not included. Most likely specific to Danish circumstances.
Unclear definitions MDL variables, especially BR; references to regulation would have been helpful; some variables not included
Not all enterprises have CN08; CIS as proportions and rounded to nearest figures.
No optimal use of SAS-syntax due to financial/policy constrains regarding use SAS; Rewriting syntax in own environment time-costly
No Making new variables burdensome; Building of CIS, ICT and GVC very burdensome to make but not used in the MDL project.
No
4. Did you encounter any problems/difficulties when running the SAS-syntaxes? Please also report how these issues were solved.
Mistakes in syntax were identified and reported.
Syntax worked. Syntax for phase one very time consuming, other phases less.
SAS code adjusted to fit our different SAS architecture.
SAS code adjusted to fit our SAS version
Error caused by different SAS-version
Several updates made after errors/mistakes in syntax; Individual assistance by DK with country specific errors.
Different Operating Systems
Different SAS versions and minor mistakes
No. All problems were promptly solved by consulting project coordinators.
Micro Data Linking 2014/2015: Methodological report on meta information 46
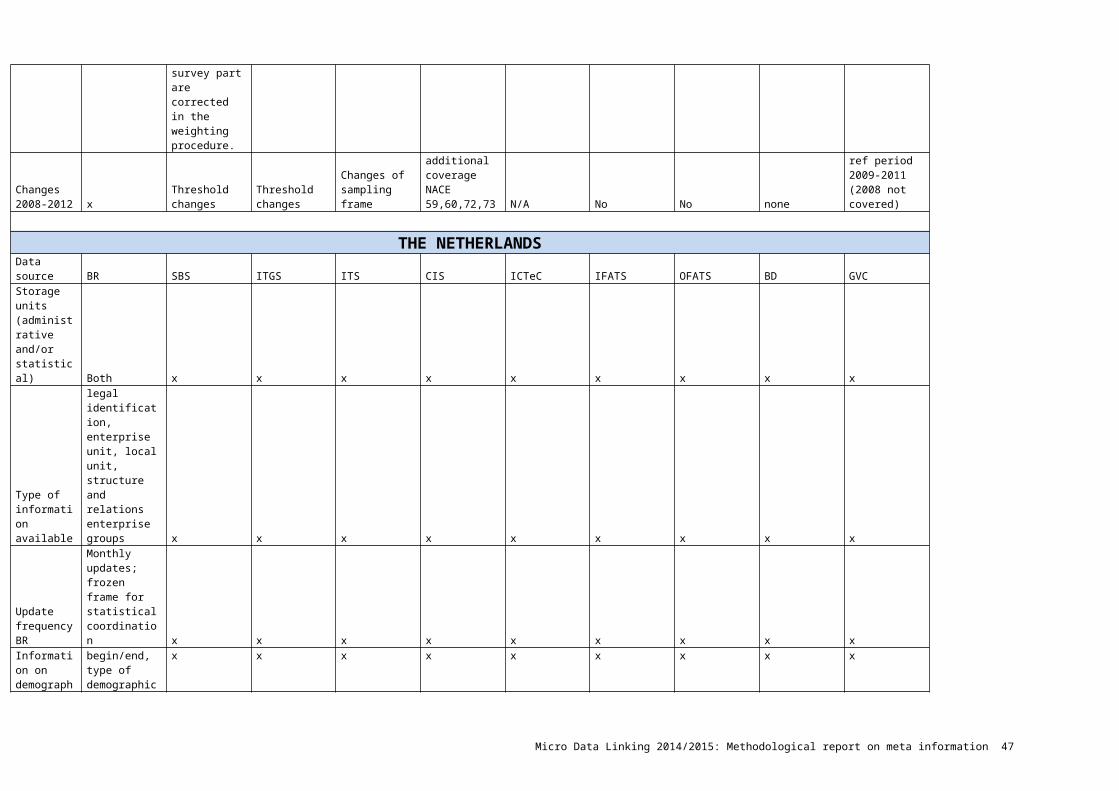
5. Did you encounter any other problems when building the MDL-database? Please also report how these issues were solved.
No. Almost impossible to build this system and make it work for all the first time.
No No Difficulties with importing GVC data from Excel format; dates were converted wrongly
Technical problems: work computers not equipped for running SAS (lack of temporary storage and running space), limited SAS-licences, only limited SAS version available
No Gaps in data and non-availability of data. Gaps in data solved with imputations, however these did not add up to Eurostat totals and as a result not imputed after all; No ENTgrp_ID available in BR.
No
6. What is your overall assessment of phase 1 of the project?
Good. For the new project leaders hectic, but good decisions were made
Building data sets time consuming; Changes in staff
Satisfied At national level review of data updating methodology (double entries, NACE changes) required
Satisfied, besides technical issues.
Good, except for some minor issues
Good Works well.
7. Please report about any proposals you may have for further improvements.
More time for syntax testing to avoid mistakes.
N/A N/A More clear variables definition; reference to framework regulations regarding variables.
Include examples how dataset should look; description about SAS environment; in data file
Addressing technical requirements before or at the beginning of project
Include some useful variables (like name, address, etc.) when building database;
Define earlier which output to disseminate; define á priori which coherences with
Micro Data Linking 2014/2015: Methodological report on meta information 47
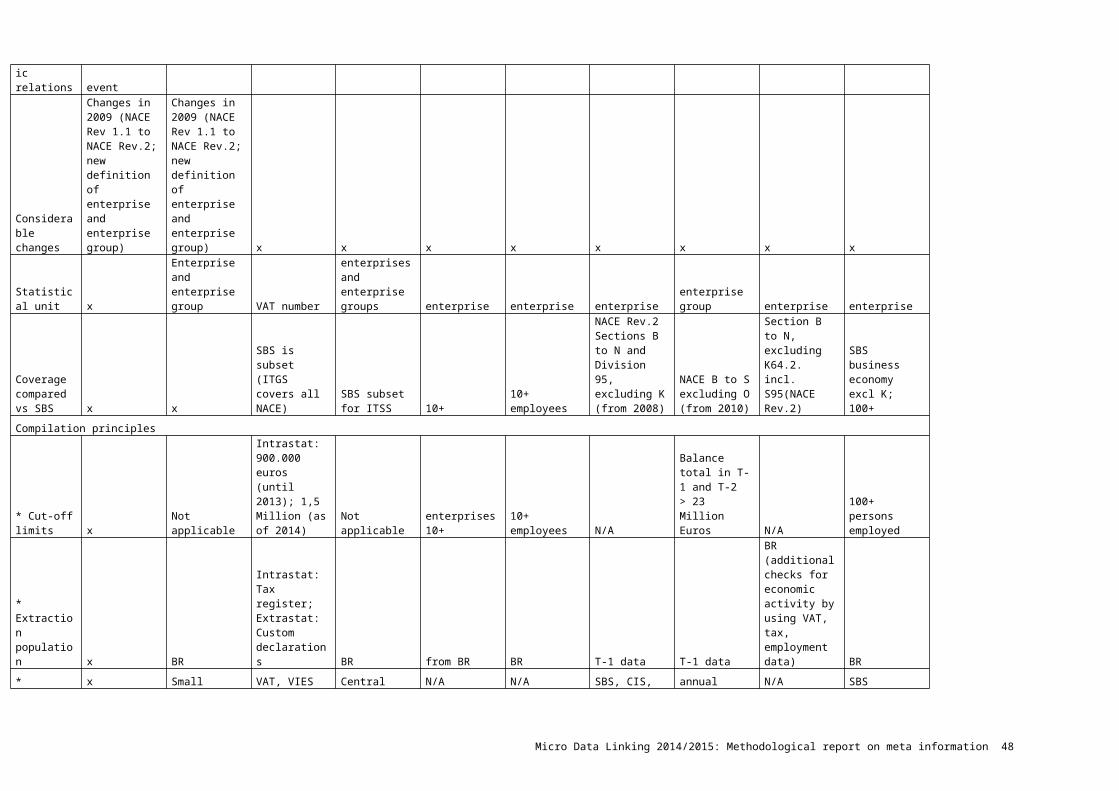
format (Excel, Csv, etc.); instructions on importing data into SAS.
take into consideration different Operating systems; case sensitive "include SAS-programs"etc.
information already disseminated to Eurostat.
Phase II: Validation
3.1 Instability over time1. Besides using the distributed guidelines and syntax for validation, did you use an additional methodology to validate the MDL-database regarding instability over time? Please explain which methodology you used, and its added value.
No. Use of other project with more reference years
No Matching by company name and address (etc.), assessing whether turnover and persons employed were within two standard deviations; consultation of BR experts.
No Top-down macro validation using pattern analysis, presented at TF 3 Wiesbaden. 'Holes' in SBS are matched with BD and BR. Valuable when SBS is sample; No micro data was changed, but some adaptions to sources were made related to definition differences.
Using additional information from BR (establishments over time, relations to enterprises)
No Auxiliary information from BD
Micro Data Linking 2014/2015: Methodological report on meta information 48

2. How do you interpret the results of validation check for instability over time? What are the main reasons for the results?
Restructured enterprises (outsourced operating business to new enterprise or existing enterprise); Enterprises not in SBS scope anymore (NACE or threshold survey)
Not in SBS scope anymore (NACE or threshold survey)
Instability over time mainly in -20 enterprises. They have often inactivity and therefore not in BR.
Holes primarily because SBS is sample and due to sampling designs; Inconsistencies in SBS NACE; relocation enterprise to other federal state and demographic events.
Steep changes in turnover why enterprise failed by sampling previous year; Economic circumstances; Sample coverage between ICTeC and SBS as the sample survey ICT for year t is established as sample for SBS for year t-1.
Holes primarily because SBS is sample; existence of dummy records in sample.
Within some enterprise groups reporting enterprises may change over time, which leads to less coherence within ITGS and between ITGS and SBS.
Most of holes related to late responses; Other holes related to sole proprietors or self-employed without economic activity in the reference year.
One enterprise ID in output
3. Did you correct data in the MDL-database? Please also explain the reason why or why not.
List of holes: 9/28 corrected. Starts big/ends big: 25/50 corrected.
Yes, enhance the link between the data sources
No big reason for action
No. No units surveyed under a different ID in the years of absence.
Yes. Mergers have been corrected; Profiled enterprises have been corrected (reporting unit is replaced to statistical unit).
Yes, dummy records were removed from SBS; 1000-error solved
Yes. Reduce no-match between different data sources within sources and between sources.
No. Initially holes were imputed but later on this decision was overturned.
Yes. Where possible to change ENT_ID this has been done. Not everywhere possible.
Micro Data Linking 2014/2015: Methodological report on meta information 49
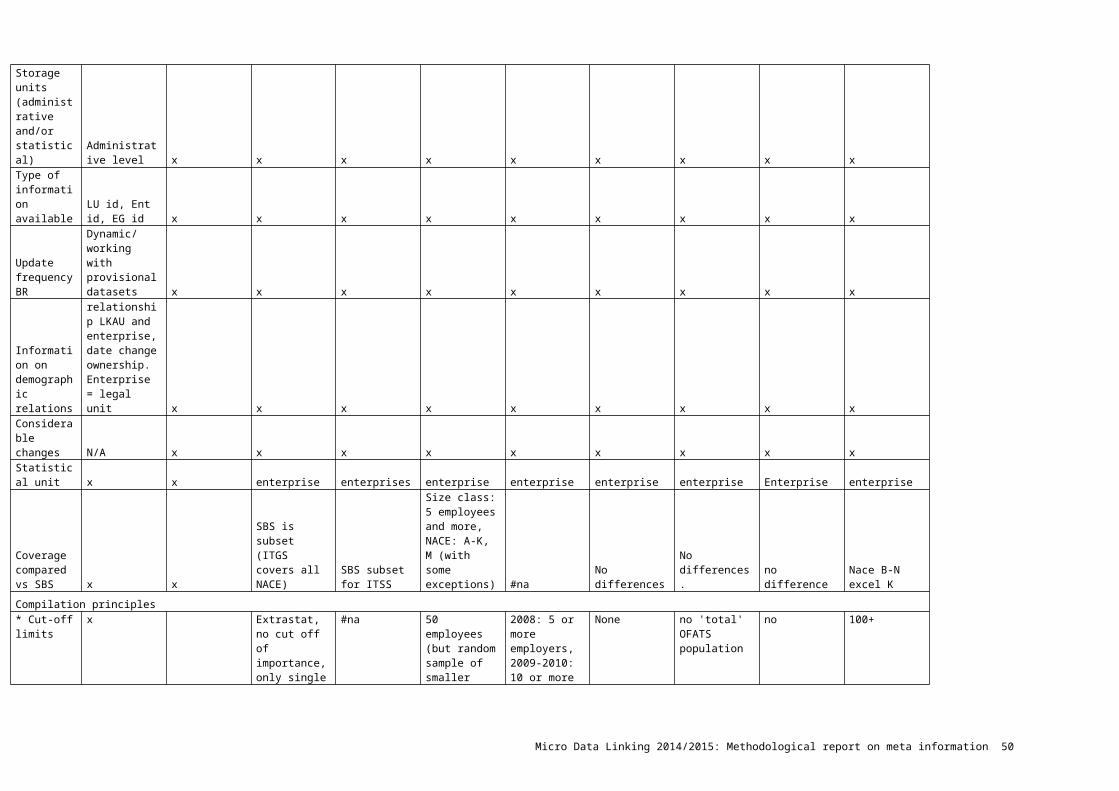
4. If you made corrections in the MDL-database, how did you correct the data in cases where instability over time was detected?Did the correction involve adding or replacing ENT_ID?
Yes Yes N/A N/A Yes, ENT_ID is replaced in SBS
N/A Yes, adding and replacing ENT_ID
N/A Yes. Replacing existing ENT_ID
Did the correction involve adding or replacing any other variables? Which variables?
No No N/A N/A Yes, replacing all other variables in SBS
N/A Yes, values changed due to splitting or merging ENT_ID's
N/A No
Did you correct all variables across datasets in the database?
Yes No N/A N/A Yes N/A Yes, values changed due to splitting or merging ENT_ID's
N/A Yes
If any, did the validation involved any other correction of data?
No N/A No N/A No N/A No
3.2.1 No match: ITGS1. Besides using the distributed guidelines and syntax for
No No No Matching of 'no matches' with SBS via BR; Checking other
No Business demography used to asses no-match
Utilizing information such as enterprise
No No
Micro Data Linking 2014/2015: Methodological report on meta information 50
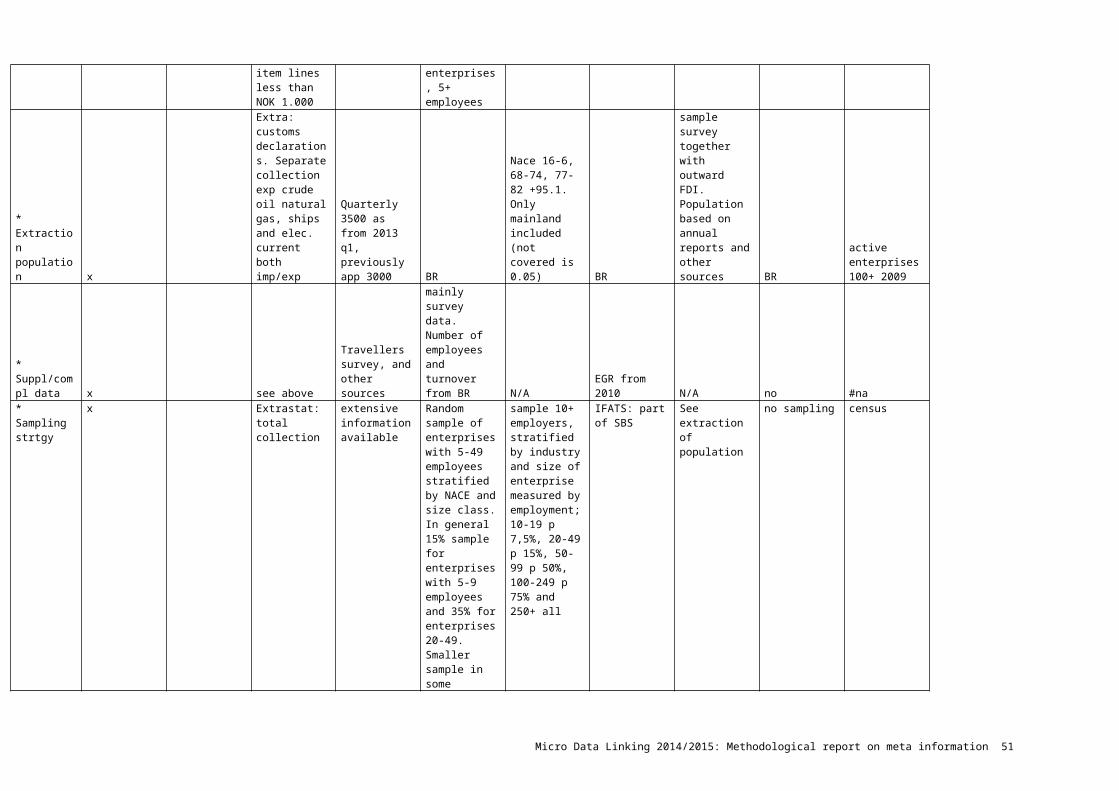
validation, did you use an additional methodology to validate the MDL-database regarding no-match? Please explain which methodology you used, and its added value.
characteristics as company name, turnover, etc.
group register, location and address, and thereby changing ENT_ID's reduced number of no_match.
2. How do you interpret the results of validation check for no-match in ITGS? What are the main reasons for the results?
Foreign enterprises in ITGS that are not in SBS; Difference due to ITGS being a monthly and SBS being a yearly statistic.
Different NACE scope; Enterprises in ITGS not covered in SBS; Difference due to ITGS being a monthly and SBS being a yearly statistic.
Perfect match. Reason is one source register for different data
SBS is sample; sample design; effect of 'unit-representation validation' on the 'no-match validation'
Absent in population and sampling; Merger of enterprise
SBS is sample Above corrections combined with other sources reduced number of no-match enterprises.
Corrected cases related with demographic events, not treated in foreign trade database; enterprises in foreign hands with sole purpose to manage trade transactions; Real deaths; temporary inactivity but reporting trade.
No match caused by sub-units in SBS-survey that have no financial information but report trade; Caused by enterprises classified as inactive but report trade.
3. Did you correct data in the MDL-database? Please
6/35 corrected using 100 million euro
Yes, general changes due to different use of
No No Replacing ENT_ID in ITGS survey
No, validation of sources has already been done at other
Yes. Establish better coherence
Yes Yes
Micro Data Linking 2014/2015: Methodological report on meta information 51
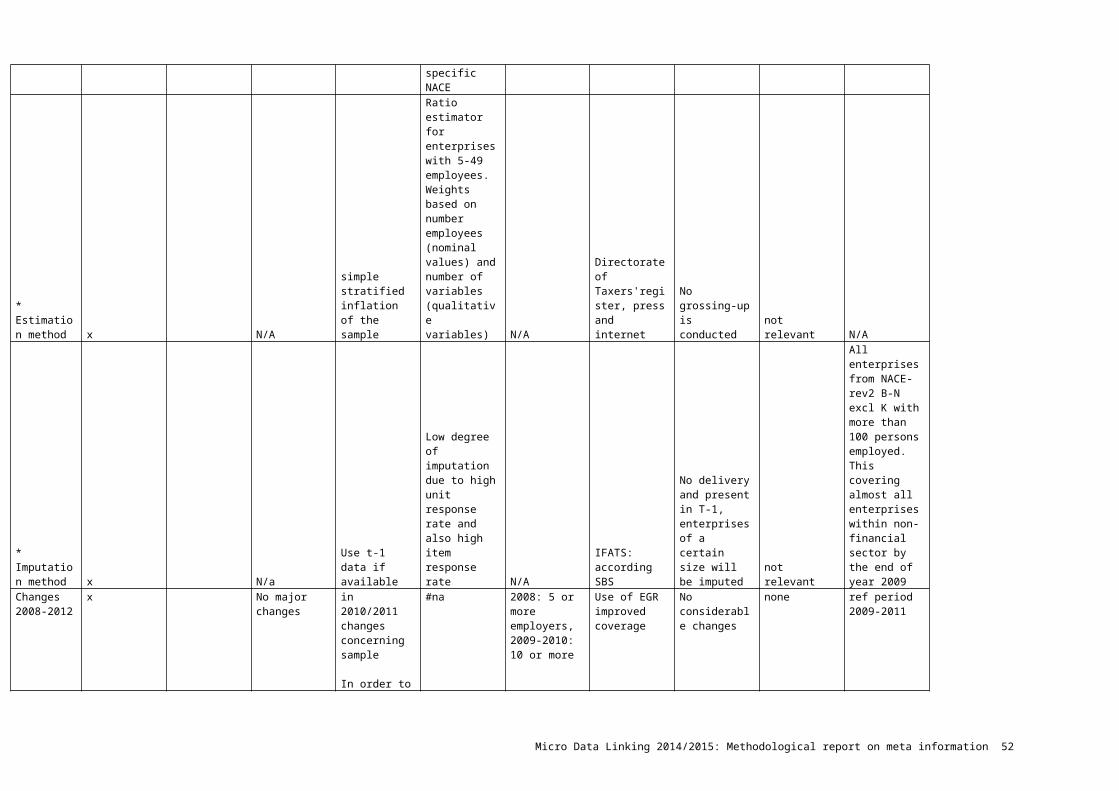
also explain the reason why or why not.
threshold. administrative ID's across sources and enterprise groups
departments to SBS as well as between years of ITGS.
4. If you made corrections in the MDL-database, how did you correct the data in cases where no-match was detected?Did the correction involve adding or replacing ENT_ID?
Yes Yes N/A N/A Yes, replacing ENT_ID in ITGS survey
N/A Yes. Using information such as enterprise group register, address and location, mergers.
Yes. Changing enterprise ID when non-matches were related to demographic events not treated in foreign trade database.
Yes. But mostly maintaining available active ENT_ID by aggregating ID's belonging to sub-units.
Did the correction involve adding or replacing any other variables? Which variables?
No Yes N/A N/A No N/A Adding or dividing variables in order to keep same 'totals' for imports and export.
Yes. Adding variables defined for the respective databases in all years.
Yes. Export/import variables have been updated or revised.
Did you correct all variables across datasets in the database?
Yes Yes N/A N/A No N/A Yes. Correct or adapt the ENT_ID in SBS when
N/A No
Micro Data Linking 2014/2015: Methodological report on meta information 52
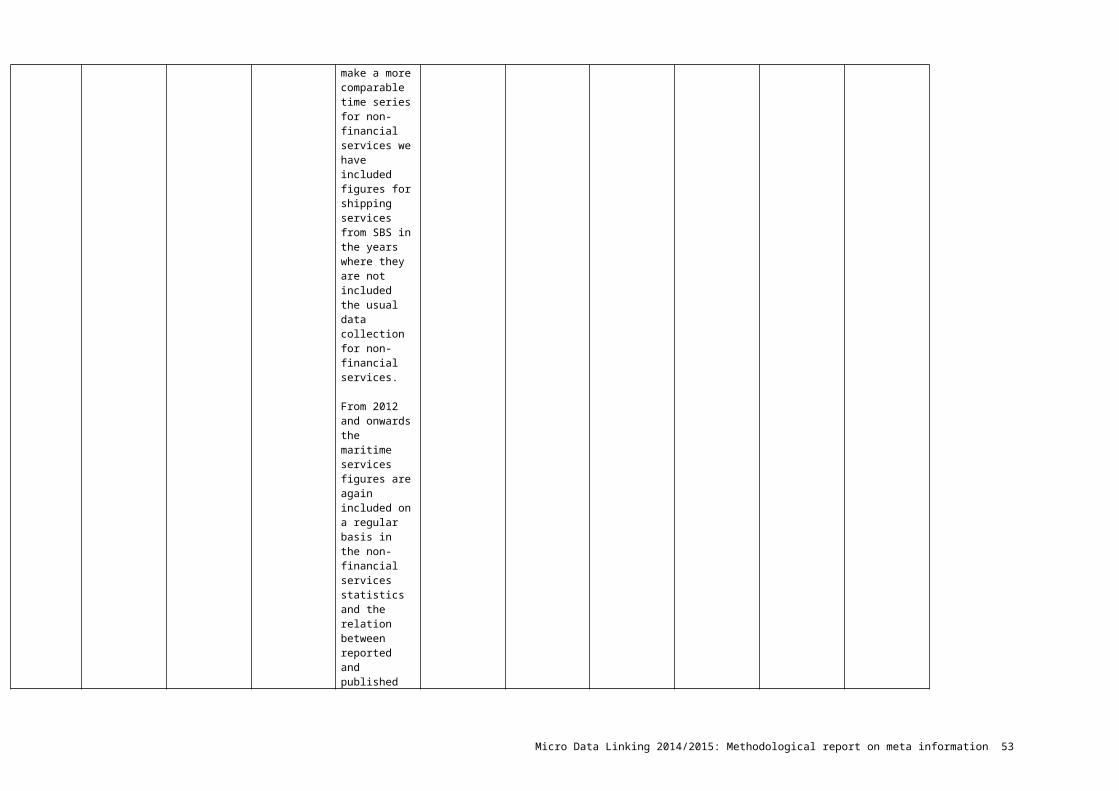
adding or merging ENT_ID's
If any, did the validation involved any other correction of data?
No No N/A N/A No N/A Using the outcome of validation enabled us to correct data in the same manner as explained above.
No No
3.2.2 No match: ITS1. Besides using the distributed guidelines and syntax for validation, did you use an additional methodology to validate the MDL-database regarding no-match? Please explain which methodology you used, and its added value.
No No No N/A No No No correction of ITS; Adding information for services related to sea and coastal transport.
N/A No
2. How do you interpret the results of validation check for no-match in
Foreign enterprises in ITS that are not in SBS; ITS
Different NACE scope; Difference due to ITS being a
Perfect match. Reason is one source register for
N/A Absent in population and sampling; ITS survey
ITS is based on survey, many enterprises do not match with SBS sample.
Number of no-match increases due to adding
N/A No match caused by sub-units in SBS-survey that have no
Micro Data Linking 2014/2015: Methodological report on meta information 53
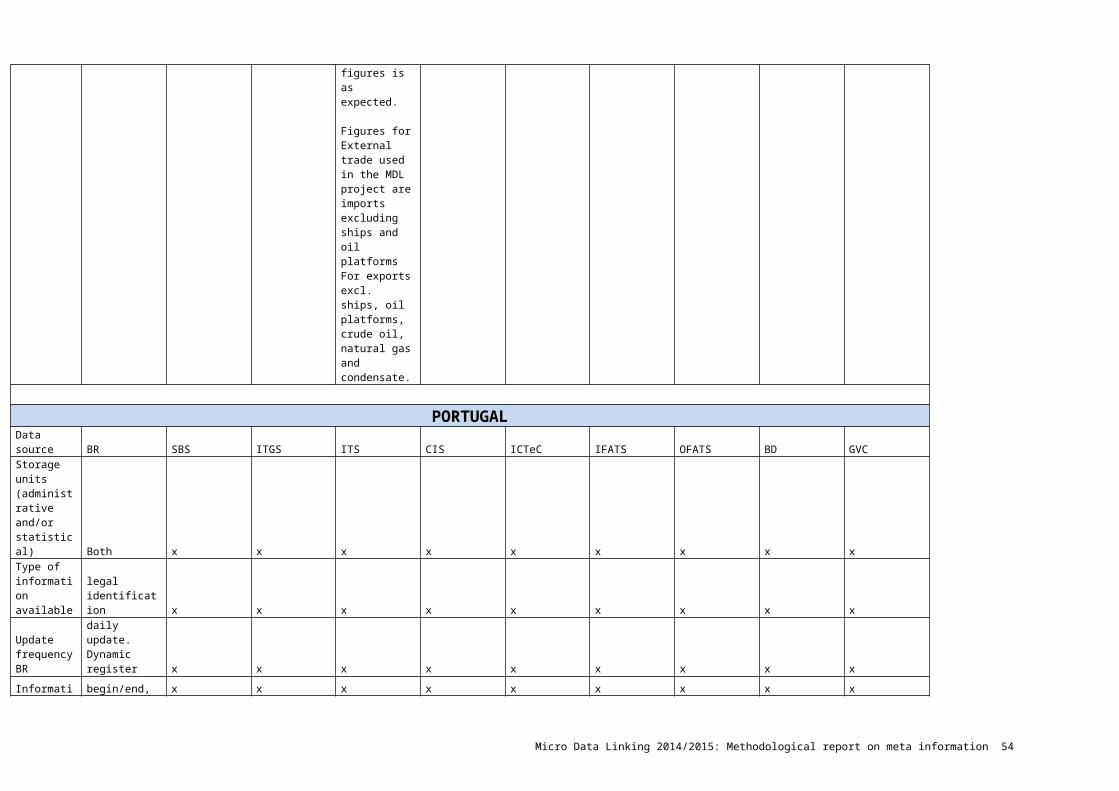
ITS? What are the main reasons for the results?
trade values can switch between enterprises in case of restructuring during year, SBS is on a yearly base.
monthly and SBS being a yearly statistic.
different data from Bank of Latvia
enterprises. financial information but report trade; Caused by enterprises classified as inactive but report trade; ITS includes 'third part trade' which causes abnormal high ratios.
3. Did you correct data in the MDL-database? Please also explain the reason why or why not.
14/18 corrected
Yes, different approach to enterprise groups
No N/A No No, validation of sources has already been done at other departments
No N/A Yes, statistics including sub-units. Not always possible to make ITS and SBS data consistent.
4. If you made corrections in the MDL-database, how did you correct the data in cases where no-match was detected?Did the correction involve adding or replacing ENT_ID?
Yes Yes N/A N/A N/A N/A N/A N/A Yes, replacing.
Did the No No N/A N/A N/A N/A N/A N/A Export/import
Micro Data Linking 2014/2015: Methodological report on meta information 54
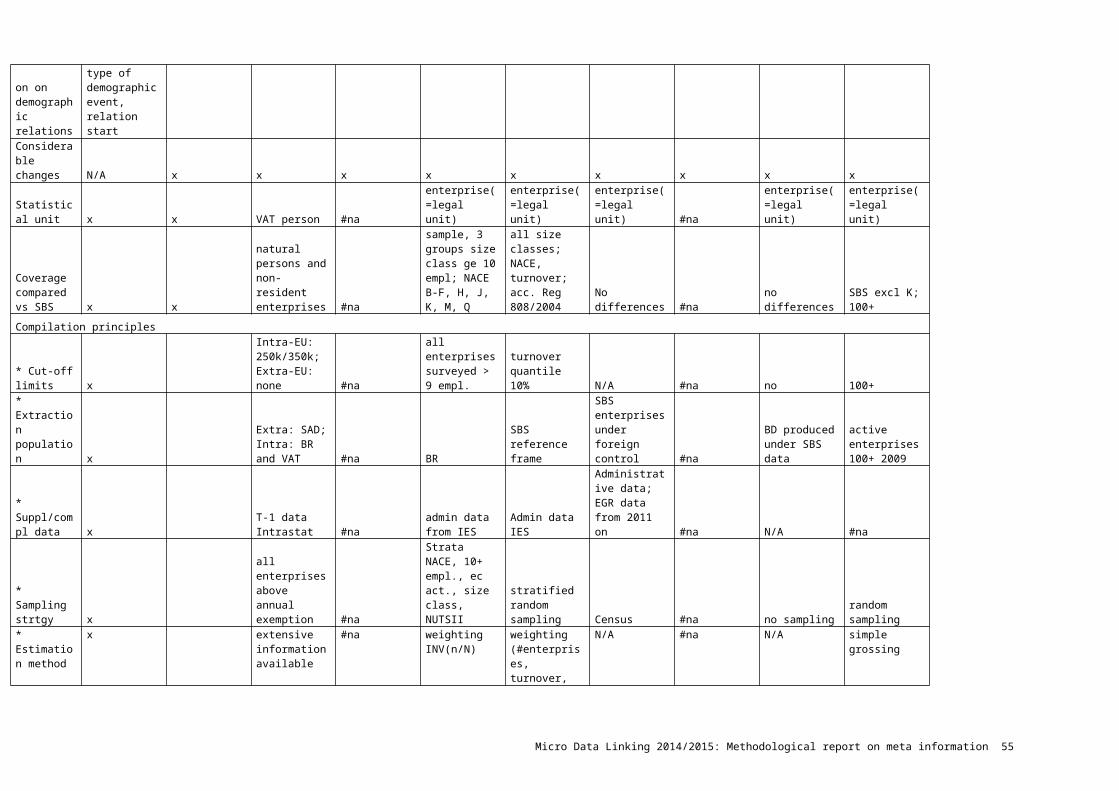
correction involve adding or replacing any other variables? Which variables?
variables have been updated or revised.
Did you correct all variables across datasets in the database?
Yes Yes N/A N/A N/A N/A N/A N/A Yes, corrections made in all available data sources except for GVC, CIS and EC.
If any, did the validation involved any other correction of data?
No No N/A N/A N/A N/A N/A N/A No
3.3.1 Unit representation: ITGS1. Besides using the distributed guidelines and syntax for validation, did you use an additional methodology to validate the MDL-database regarding unit-representation? Please explain which methodology you used, and its
No No No No No No Using additional information like Enterprise Group Register, demographic events in BD
No No
Micro Data Linking 2014/2015: Methodological report on meta information 55
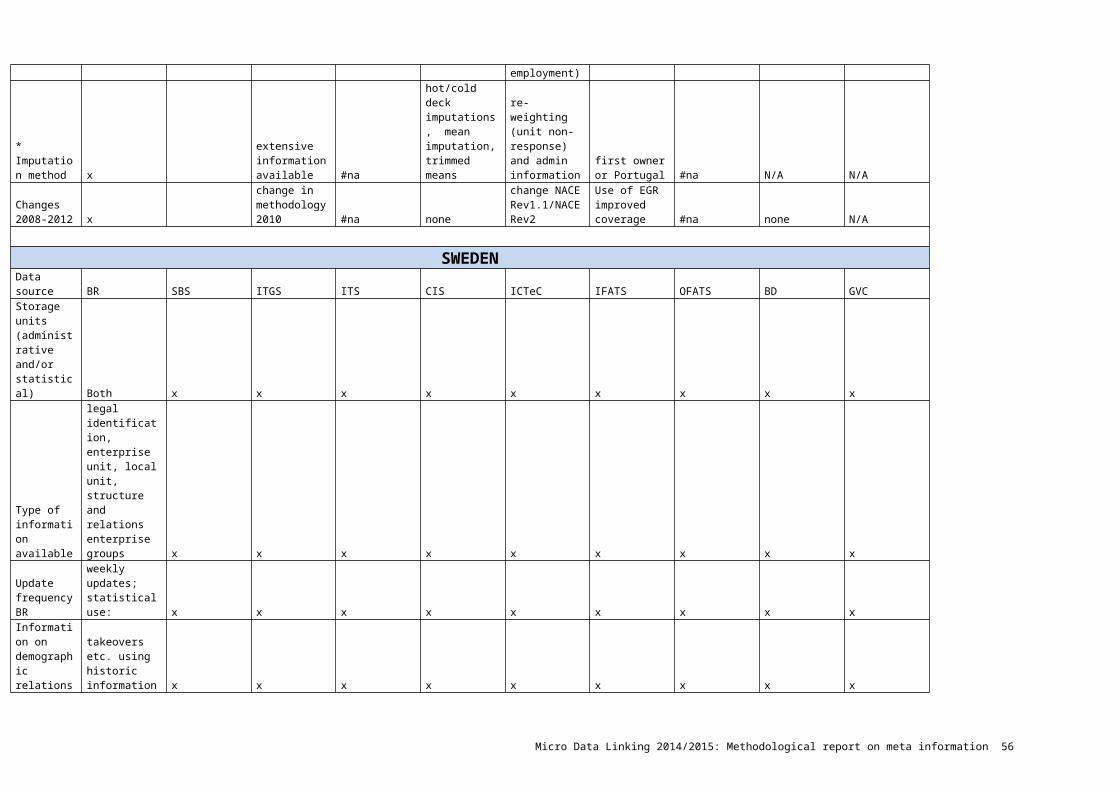
added value.
2. How do you interpret the results of validation check for unit-representation in ITGS? What are the main reasons for the results?
Restructuring of enterprises; indirect export (quasi transit).
different use of enterprise groups
Unit representation very good in Finland; Only few inconsistencies due to reporting practices and internal organizational structure of enterprise.
Controlling companies of tax groups clustered in M and L (ITGS more than one SBS unit) report foreign trade activities
ITGS includes total value of goods furthermore SBS does not include this value
Some NACE sections have high export/turnover ratios, most likely because transporters list transported goods as their export. This is hard to disentangle.
Reporting unit on enterprise level does not necessarily represent the same 'true picture'
In most cases related to enterprises that transport goods: custom agents, trade agents, import/export companies
In some cases higher export than turnover, this is not adjusted; enterprises with only warehouse storage for re-exports in output; Enterprises defined as foreign affiliate with no production but with export in output.
3. Did you correct data in the MDL-database? Please also explain the reason why or why not.
7/125 enterprises corrected (restructuring of enterprises).
Yes, now enterprise ID's are the same
No Yes. Reallocating export and import within tax groups.
No. We cannot reveal which trade amount is value of goods.
No. Only a few 'obvious' mistakes resulting from conversion SAS to SPSS has been fixed.
Yes. The same methods for validation and changing the population of enterprises.
No No
4. If you made corrections in the MDL-database, how did you correct the data in cases where
Micro Data Linking 2014/2015: Methodological report on meta information 56
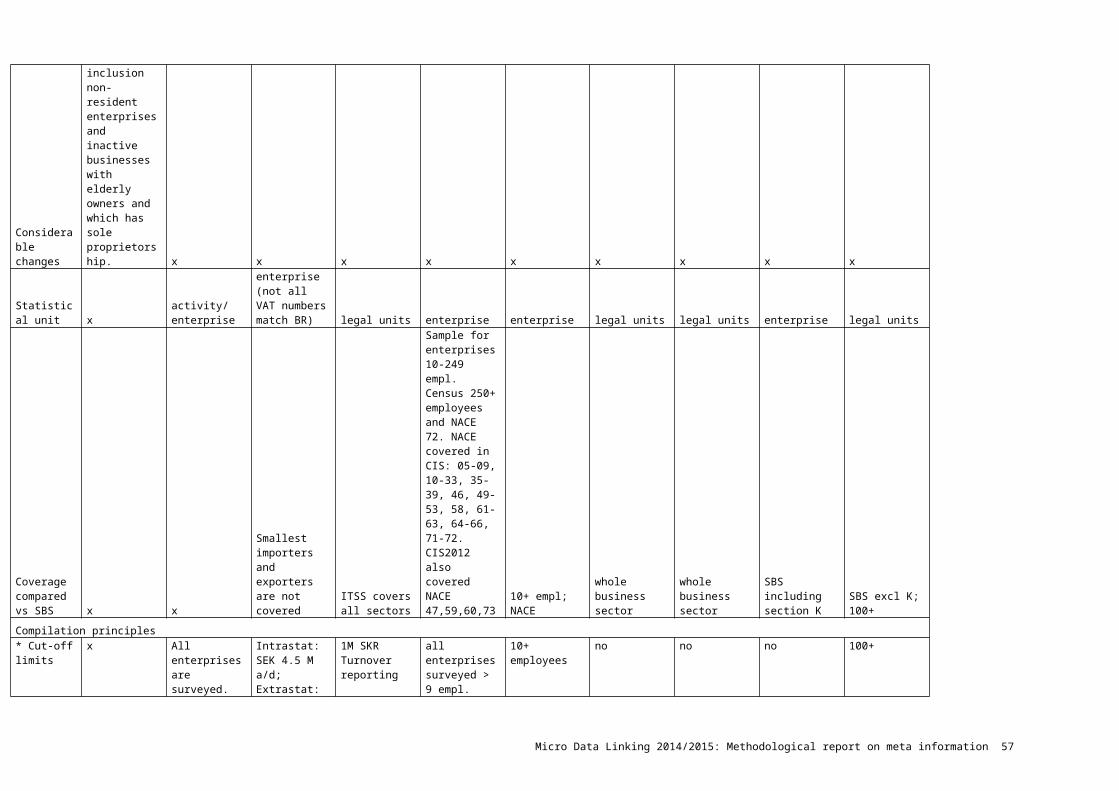
no-match was detected?Did the correction involve adding or replacing ENT_ID?
Yes Yes N/A Yes, adding ENT_ID's
N/A N/A Yes. Using information such as enterprise group register, address and location, mergers.
N/A N/A
Did the correction involve adding or replacing any other variables? Which variables?
No No N/A Yes, 'CL_AREA_GEO_ITGS' was imputed and 'ITGS_type' adjusted for the imputation
N/A N/A Adding or dividing variables in order to keep same 'totals' for imports and export.
N/A N/A
Did you correct all variables across datasets in the database?
Yes Yes N/A No N/A N/A Yes. Correct or adapt the ENT_ID in SBS when adding or merging ENT_ID's
N/A N/A
If any, did the validation involved any other correction of data?
No No N/A Yes, imports were reallocated within tax groups
N/A N/A Using the outcome of validation enabled us to correct data in the same manner as explained above.
N/A N/A
3.3.2 Unit
Micro Data Linking 2014/2015: Methodological report on meta information 57

representation: ITS1. Besides using the distributed guidelines and syntax for validation, did you use an additional methodology to validate the MDL-database regarding unit-representation? Please explain which methodology you used, and its added value.
No No No N/A No No No correction of ITS; Adding information for services related to sea and coastal transport.
N/A No
2. How do you interpret the results of validation check for unit-representation in ITS? What are the main reasons for the results?
Restructuring of enterprises
different use of enterprise groups
Unit representation very good in Finland; Only few inconsistencies due to reporting practices and internal organizational structure of enterprise.
N/A ITS lists turnover from companies and foreign subsidiaries, while SBS only companies value; NACE H include value of agents' revenue that cannot be revealed.
Some NACE sections have high export/turnover ratios, most likely because transporters list transported goods as their export. This is hard to disentangle.
Number of no-match increases due to adding enterprises.
N/A In some cases higher export than turnover, this is not adjusted.
3. Did you 6/48 Yes, now No N/A No No No N/A No
Micro Data Linking 2014/2015: Methodological report on meta information 58

correct data in the MDL-database? Please also explain the reason why or why not.
corrected (restructuring of enterprises)
enterprise ID's are the same
4. If you made corrections in the MDL-database, how did you correct the data in cases where no-match was detected?Did the correction involve adding or replacing ENT_ID?
Yes Yes N/A N/A N/A N/A N/A N/A N/A
Did the correction involve adding or replacing any other variables? Which variables?
No No N/A N/A N/A N/A N/A N/A N/A
Did you correct all variables across datasets in the database?
Yes Yes N/A N/A N/A N/A N/A N/A N/A
If any, did the validation involved any other correction of data?
No No N/A N/A N/A N/A N/A N/A N/A
3.4.1 Demographic
Micro Data Linking 2014/2015: Methodological report on meta information 59
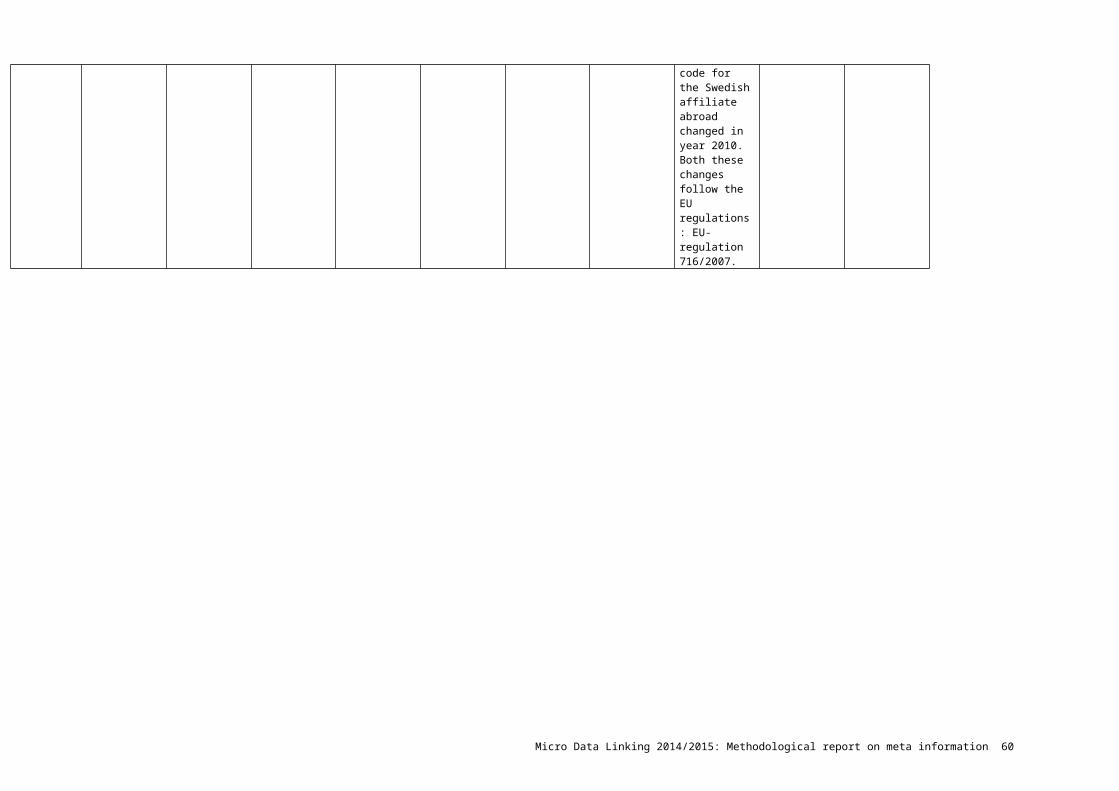
change: Outliers with demorelations in BR1. Besides using the distributed guidelines and syntax for validation, did you use an additional methodology to validate the MDL-database regarding outliers with demorelations in BR? Please explain which methodology you used, and its added value.
No Additional checks based on STS statistics
N/A No No Data to classify demorelations were of bad quality. Therefore all enterprises are in 'outliers without demo group'.
No No, no output
2. How do you interpret the results of the demography validation check with outliers in the BR? What are the main reasons for the results?
High growth related to take-overs
In general demography events are captured correctly, but will continue to validate.
N/A Most ceased to exist, but there were also some mergers
53 enterprises in output. No changes made.
Some outliers identified, but not able to develop routines to handle issue
14/25 marked
N/A
3. Did you correct data in the MDL-database? Please also explain the
No No, but perhaps in the future after additional checks.
N/A No No corrections in micro data. However adaptions made in datasets,
Yes No, only marked.
N/A
Micro Data Linking 2014/2015: Methodological report on meta information 60

reason why or why not.
making the output 'more than one event' possible.
4. If you made corrections in the MDL-database, how did you correct the data in cases where no-match was detected?Did the correction involve adding or replacing ENT_ID?
No N/A N/A N/A N/A Yes N/A N/A
Did the correction involve adding or replacing any other variables? Which variables?
No N/A N/A N/A N/A Yes N/A N/A
Did you correct all variables across datasets in the database?
N/A N/A N/A N/A N/A Yes N/A N/A
If any, did the validation involved any other correction of data?
No N/A N/A N/A N/A No N/A N/A
3.4.2 Demographic change: Outliers without
Micro Data Linking 2014/2015: Methodological report on meta information 61
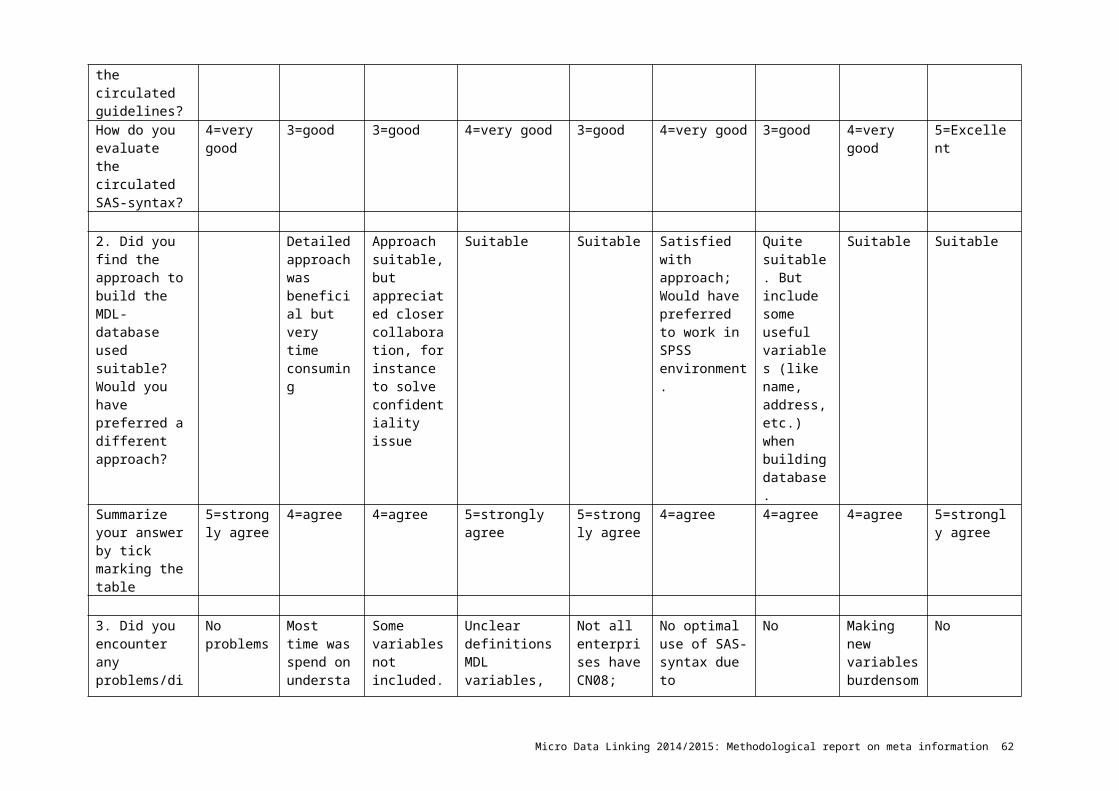
demorelations in BR1. Besides using the distributed guidelines and syntax for validation, did you use an additional methodology to validate the MDL-database regarding outliers with demorelations in BR? Please explain which methodology you used, and its added value.
No No Consultation experts and auxiliary variables from BR were used to identify demographic events
No No No Outcome matched with records of demographic events. 1 enterprise marked for exclusion.
Extra validation using other variables in BD and BR.
2. How do you interpret the results of the demography validation check with outliers in the BR? What are the main reasons for the results?
? Other reasons for fast growth
Not certain about demographic events but after further examination almost all identified units excluded.
Due to development in the enterprise
140 enterprises in output. No changes made.
Same reason as other validation: death, births and enterprise reorganizations.
Due to development within the enterprises' activity.
Each year around 7-10 enterprises in output. 3-4 are yearly changed, due to demographic events like acquisitions and mergers.
3. Did you correct data in the MDL-database? Please also explain the
No No No Yes. One enterprise was corrected due to
No corrections in micro data. However adaptions made in datasets,
Yes. No, only marked
No, output is negligible.
Micro Data Linking 2014/2015: Methodological report on meta information 62
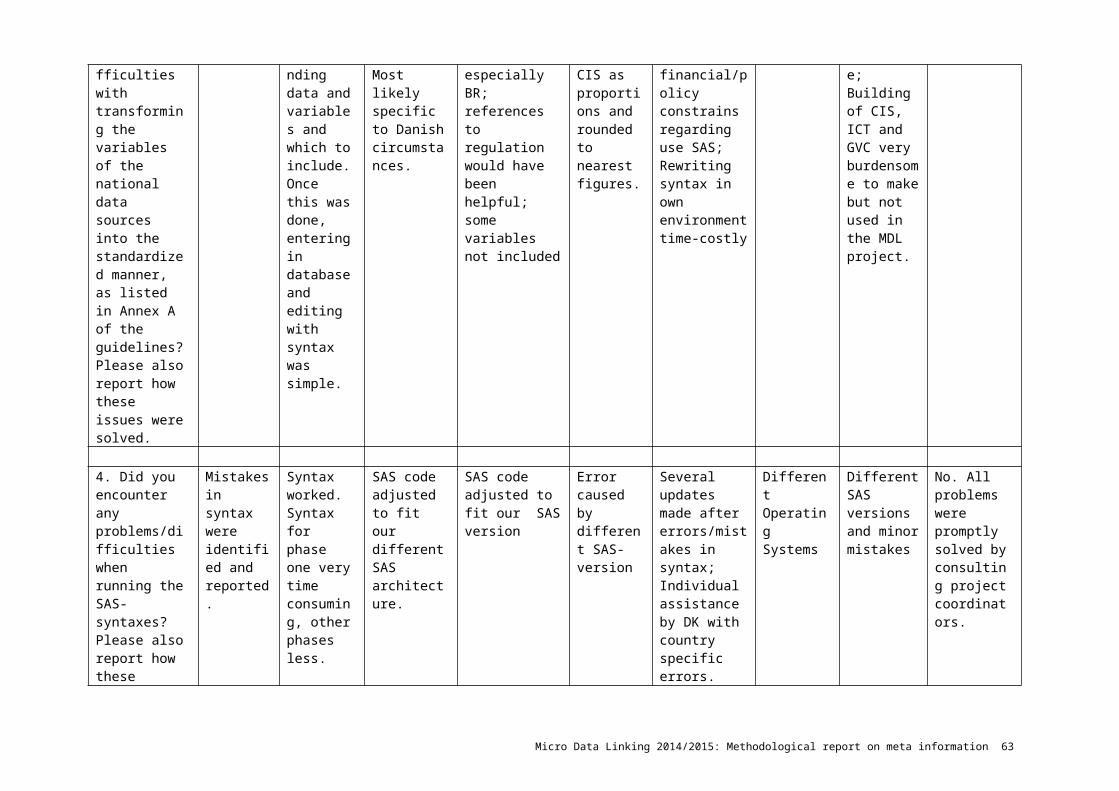
reason why or why not.
demographic event
making the output 'more than one event' possible.
4. If you made corrections in the MDL-database, how did you correct the data in cases where no-match was detected?Did the correction involve adding or replacing ENT_ID?
No N/A N/A ENT_ID has been replaced in ITGS and other datasets
N/A Yes N/A N/A
Did the correction involve adding or replacing any other variables? Which variables?
No N/A N/A N/A Yes N/A N/A
Did you correct all variables across datasets in the database?
N/A N/A N/A N/A Yes N/A N/A
If any, did the validation involved any other correction of data?
No N/A N/A N/A No N/A N/A
Overall experiences
Micro Data Linking 2014/2015: Methodological report on meta information 63
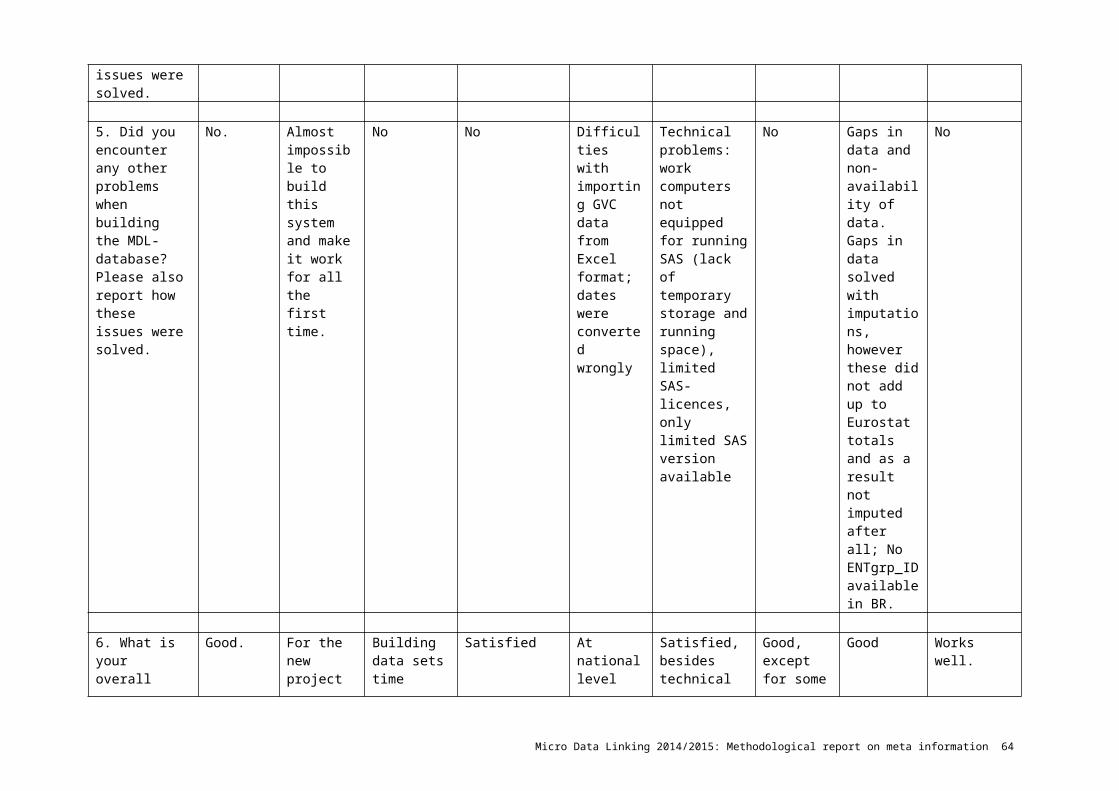
phase II
1. What is your overall assessment of phase 2 of the project?
Learned a lot about own data
Validation approach went well. Especially no match and unit representation.
Not much reason for corrections, but good to see some results
Improved the quality of our combined data and valuable insights about our data. Especially unit representation was very useful
It improved quality of the templates
Informative; questions answered by DK
Provided validation tables very good help; Validation output tables easy for additional analysis/checking.
Not aware of the overall picture during the validation process: imputations that were made had to be overruled later onwards in project; 'No-match' and 'unit- representation' was very time consuming, but nothing was done with it; A learning process without visible results.
Difficult, as variables definitions and measurement differ between sources. Especially ITS hard to validate, and recommendation is not to use them in further analysis; ITGS seem to be of good quality; Comparing SBS with ITGS works well.
Summarize your answer by tick marking the table.
5=excellent 5=excellent 3=good 4=very good 4=very good 3=good 3=good 3=good 4=very good.
2. How would you evaluate the circulated guidelines and
Some minor mistakes in syntax
Fewer comments about syntax,
Well done including the code
Clearly structured and very comprehensive
Guidelines very informative and
Quality of SAS-syntax was good, country specific issues
Guidelines were good and easy to follow
Guidelines comprehensive. Syntax runs without
Instructions clearly written and easy to understand; In
Micro Data Linking 2014/2015: Methodological report on meta information 64
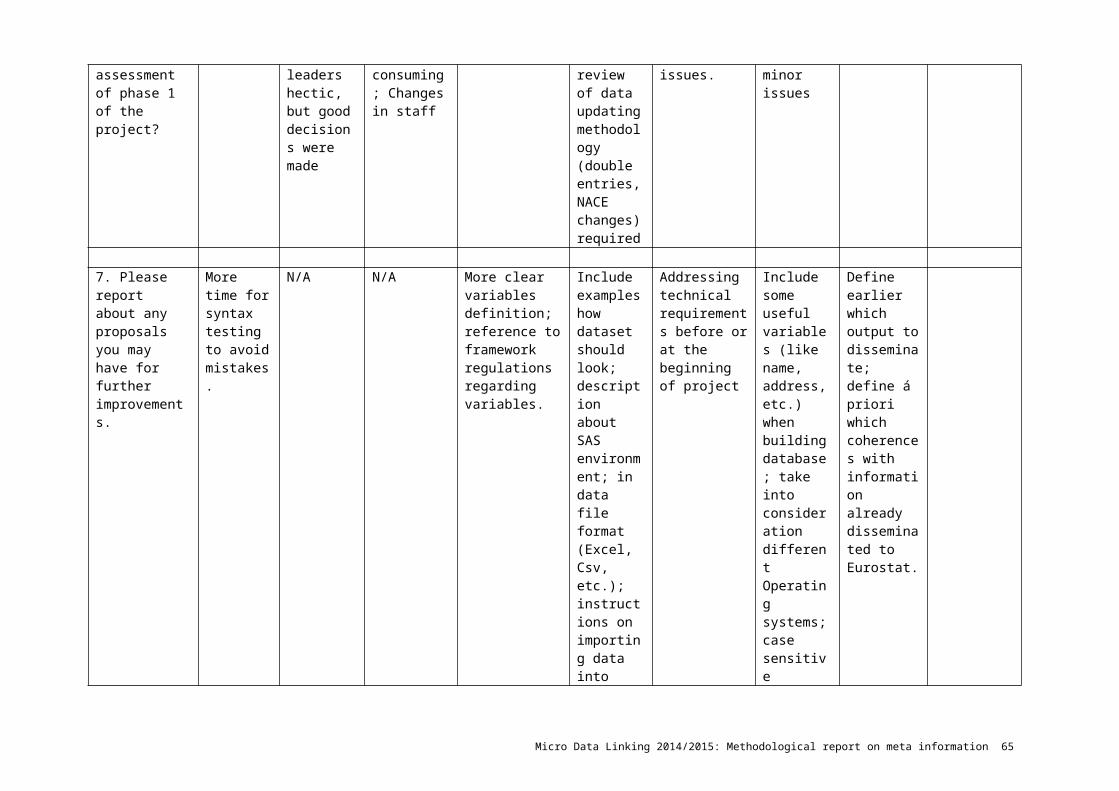
SAS-syntax concerning the validation (phase 2)?
indication approaches functioned well for most other NSI's
received answers to questions; More detailed examples of each validation; More descriptions in SAS-syntax
answered by DK major problems.
case of problems project coordinators were available for help.
Summarize your answer by tick marking the table: guidelines
5=excellent 5=excellent 4=very good 5=excellent 4=very good 4=very good 3=good 4=very good 5=excellent
Summarize your answer by tick marking the table: SAS-syntax
4=very good
5=excellent 4=very good 5=excellent 4=very good 4=very good 3=good 4=very good 5=excellent
3. Did you find the validation approach used suitable? Would you have preferred a different approach?
Yes Very suitable. Learned a lot about own data
Yes Approach was suitable. 'Instability over time' and 'no match' less valuable as 'unit representation' and 'demography'
ITS validation not relevant as handled by Bank of Latvia
Bottom-up approach was suitable. Some issues in datasets were adjusted. Also own top-down validation approach was valuable. Edit: in hind sight, it would have been beneficial to include simple macro validations as well, f.e.
Approach was useful.
Suitable, but maybe should have been simplified.
Yes, although validations could be more limited to big enterprises.
Micro Data Linking 2014/2015: Methodological report on meta information 65
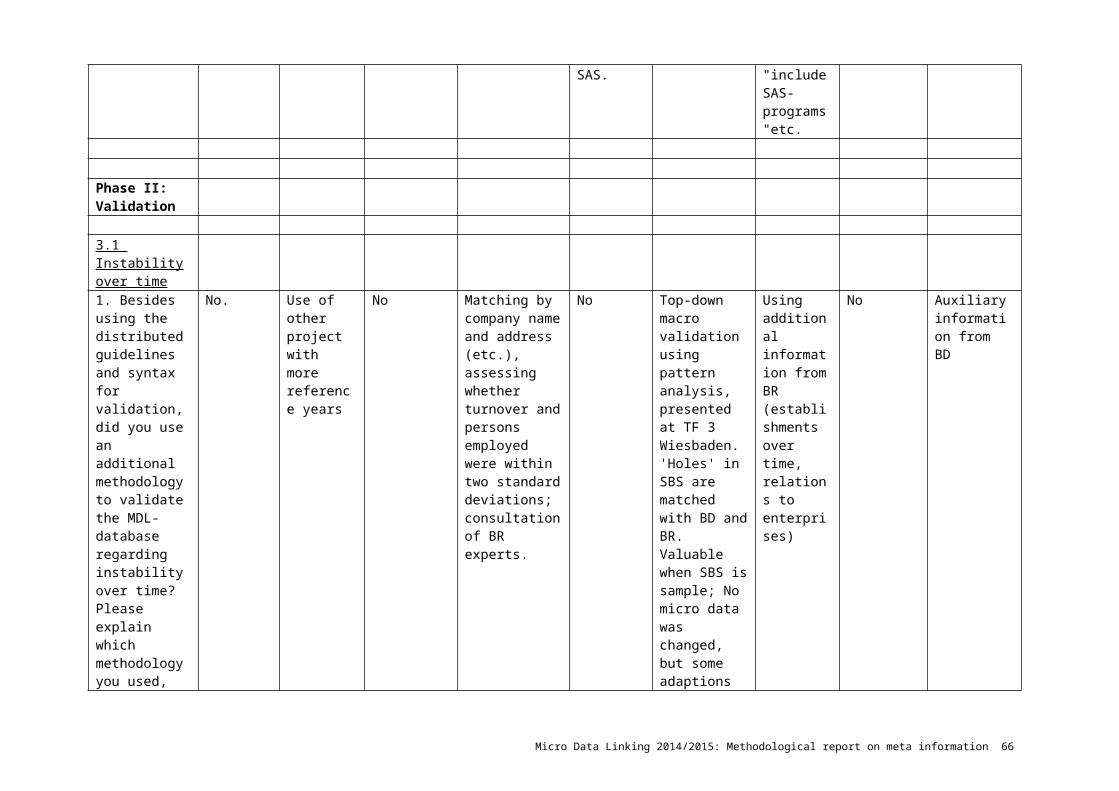
checking totals of each database with original source and with figures already on Eurostat.
4. How would you evaluate the overall quality of your national MDL-database? Are there any considerations that need to be taken into account while producing output tables and analyses?
Very good quality of national MDL-database except for BD data where improvements are expected.
Good quality of national MDL-database. Suitable for business analysis if differences in scope (etc.) are taken into account
Very good condition.
Validation helped to improve quality data; Some inconsistencies remain: some micro data based on sample surveys, as a result difference with official publications, some implausible cases could not be resolved during validation phase.
Further investigate SBS turnover and ITGS export
SAS-limits output; SBS-sample (and weighting variables) make MDL complicated.
ITS is subset; employment variables not available for all NACE sections.
Quality is reasonable; grand totals do not add up to sum of NACE totals due to different use of SBS and BR definition; Control breakdown not available in BR; No information on ITS.
Quality is good and corresponds with official publications; ITS at micro level is problematic.
5. Please report about any proposals you may have for future improvements.
Addressing issue of different approach of enterprise groups in sources; Analyse possibilities to include ITS
Validation output tables could use some meta information; Print friendly version
None Top down validation, using business demography; Edit: in hind sight, it would have been beneficial to include simple macro validations as well, f.e.
Looking for solution to avoid manual work correcting ENT_ID's
Defining output sooner; which consistencies must be guaranteed; evaluation immediately after each phase instead of
Limit validation only to largest enterprises otherwise validation burden to high.
Micro Data Linking 2014/2015: Methodological report on meta information 66
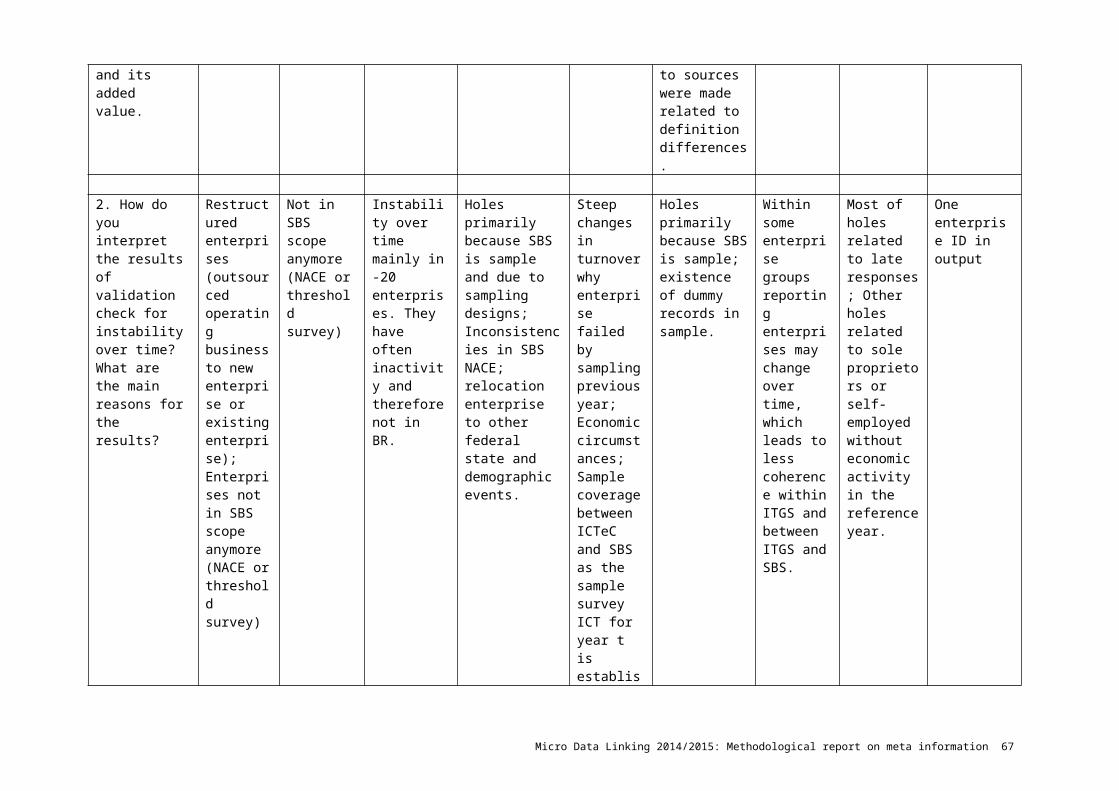
checking totals of each database with original source and with figures already on Eurostat.
long after phase.
Future use MDL-database1. Are you going to carry out more analysis using the linked datasets? If yes, please mention which.
No specific plans, but the intention is to look at further possibilities
Yes, carry out similar analysis at local level using establishment data
Publish article in "WISTA"
Further investigate SBS turnover and ITGS export
No regular data production. But will be updated; Edit: Datasets will be used to help with in-depth analysis future (undefined) national projects/figures.
Not at the moment. Still discussed.
Unclear. Moreover, MDL uses different definitions for exporters and SME than national definitions.
MDL project is used in parallel project aiming to analyse relationship FDI and trade.
2. Do you plan to maintain and (annually) update the MDL-database, and make tabular output without support from other NSI’s or Eurostat? If yes, will it be part of your regular data production?
Applied for Eurostat grant; Utilize database for future Eurostat projects and national purposes.
Plans to continue work
Uncertain. Applied for Eurostat grant. However, for maintaining and updating MDL database more resources are required; Still solving legal issues linking micro data from different sources and permanent
Not yet Area 1: topic 1, 2, 3; Area 2
Unclear. Depends also on resources.
Most probably not, still discussed.
No
Micro Data Linking 2014/2015: Methodological report on meta information 67
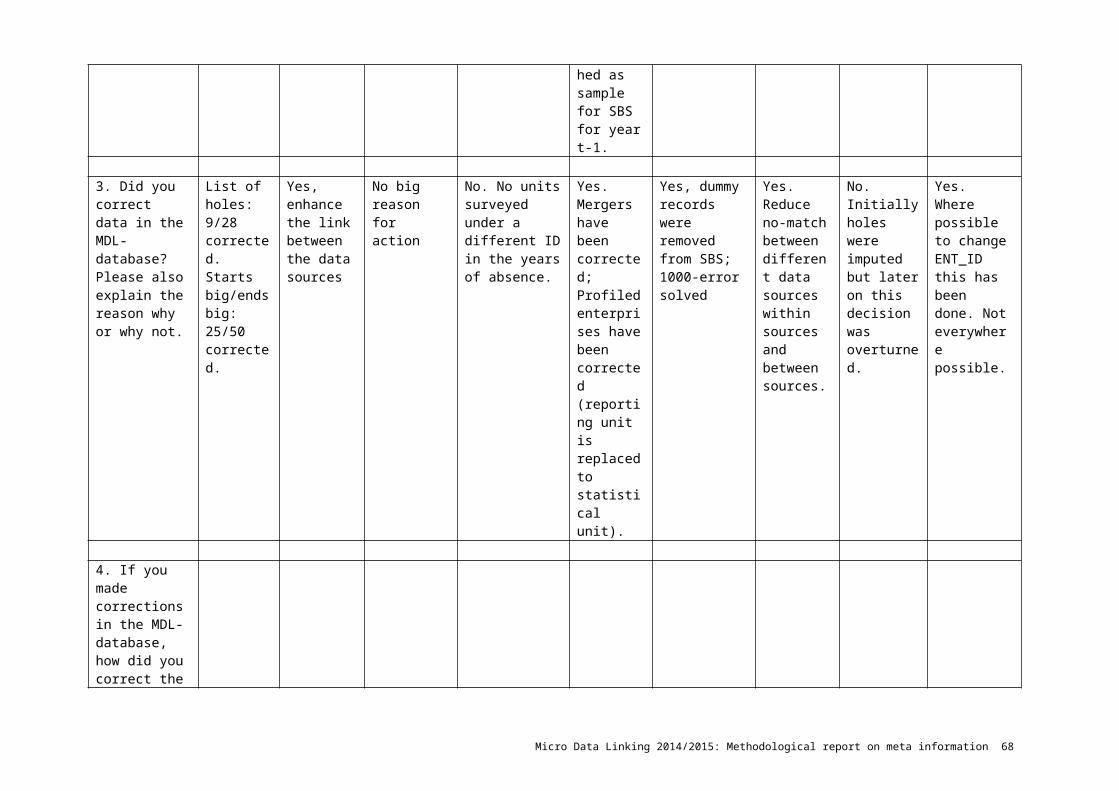
storage; Probably no regular production.
3. Apart from the output produced in this project, can you think of other interesting and policy-relevant analyses that could be done with the linked datasets? Please give a few (1-3) examples that would be most interesting for your country.
Linking MDL with social statistics at employee level to analyse skills aspects and impacts on enterprise performance; Profiling R&D intensive and innovative enterprises; Profiling high growth enterprises
Analysis of developments in ICT sector and innovation
Adding German Structure of Earnings Survey; Analyse enterprise performance for various indicators for different subpopulations as panel data; Connection between foreign trade affinity and economic performance.
Link SBS and BD by different types of enterprises; produce standardized output from other linked datasets.
Are enterprises that are sourcing more financially fit?; which characteristics are vital for survival small enterprises?
Coherence between R&D activity and turnover corrected time-lag effect; R&D related to enterprises with and without export.
Add inter-quartile analysis for some variables (like GVA, GVA per persons employed, wages per person employed) by sector, dimension and exporter profile
Imports of intermediate products and international sourcing of business functions; Analyses of R&D expenditures outsourcing companies.
4. Do you see the possibility to make regular output for Eurostat using the MDL-database?
Yes Needs further discussion
Very sceptical: unclear legal situation; uncertainties regarding available financial resources; open questions regarding extrapolation of micro data for aggregated output.
Not yet. Possible, if SAS constraints are solved.
Depends on resources.
In near future most probably not, but still in discussion.
Yes, but depends on financial support.
Micro Data Linking 2014/2015: Methodological report on meta information 68

Annex III: Availability variablesData Source
ESSname Question/Variable contents
Available 2008
Available 2009
Available 2010
Available 2011
Available 2012
BR ENT_ID Unique enterprise identification 9 9 9 9 9
BRENTgrp_ID Enterprise Group ID 5 6 6 6 6
BR Administrative ID 9 9 9 9 9BR Start date for the enterprise ID 9 9 9 9 9BR End date for the enterprise ID 9 9 9 9 9
BRStart date for the enterprise Group ID 6 6 6 6 6
BR End date for the enterprise Group ID 6 6 6 6 6BR Legal form of the enterprise ID 8 8 8 8 8
BRMain activity of the enterprise (NACE 4-digit) 8 8 8 8 8
BRSecondary activity of the enterprise (NACE 4-digit) 7 7 7 7 7
BROwnership of the enterprise (private/public) 6 6 6 7 7
BR Start date for the main activity 6 6 6 6 6BR Start date for the secondary activity 3 3 3 3 3BR End date for the main activity 6 6 6 6 6BR End date for the secondary activity 2 2 2 2 2
BR
Ownership relation with associated direct ownership indicated as percentages for each enterprise ID 4 5 5 6 7
BR
Information on demographic relations (mergers and acquisitions etc.) 5 5 5 5 5
SBS 12 11 0 Turnover 9 9 9 9 9SBS 12 15 0 Value added at factor cost 9 9 9 9 9SBS 12 17 0 Gross operating surplus 9 9 9 9 9
SBS 13 11 0Total purchases of goods and services 9 9 9 9 9
SBS 13 31 0 Personnel costs 9 9 9 9 9SBS 13 32 0 Wages and salaries 9 9 9 9 9SBS 16 13 0 Number of employees 9 9 9 9 9
SBS 16 14 0Number of employees in full-time equivalents 9 9 9 9 9
SBS NACE 4-digit 9 9 9 9 9ITGS
STAT_ VALUE Import amount 9 9 9 9 8
ITGS
STAT_ VALUE Exports amount 9 9 9 9 8
ITGS
CL_AREA_ GEO
Partner country (country of origin/destination) 8 8 9 9 8
ITGS CN08 Product nomenclature CN08 8-digit 8 8 8 8 7ITGS NACE 4-digit 7 7 7 7 7
Micro Data Linking 2014/2015: Methodological report on meta information 69

ITSSTAT_ VALUE Import amount 6 6 6 6 6
ITSSTAT_ VALUE Exports amount 7 7 7 7 7
ITSCL_AREA_ GEO
Partner country (country of origin/destination) 7 7 7 7 7
ITSBopitem Service nomenclature EBOPS 3-digit 6 6 6 6 6
ITS NACE 4-digit 7 7 7 7 7CIS ENTGP Enterprise part of a group 6 3 7 3 6CIS HO Country of head office 7 1 8 1 6
CISMAREUR Other EU/EFTA/CC market 7 0 7 0 6
CISMAROTH All other countries 6 0 6 0 6
CISINPDGD
Introduced onto the market a new or significantly improved good 7 1 7 1 7
CIS INPDSVIntroduced onto the market a new or significantly improved service 8 1 8 1 7
CISINPDTW
Who mainly developed these products 8 1 6 1 5
CISNEWMKT
Did the enterprise introduce a product new to market 8 1 8 1 7
CISTURNMAR
% of turnover in new or improved products introduced during 2006-2008 that were new to the market 8 1 8 1 7
CIS INPSPD
Introduced onto the market a new or significantly improved method of production 8 1 8 1 7
CIS INPSLG
Introduced onto the market a new or significantly improved logistic, delivery or distribution system 8 1 8 1 7
CIS INPSSU
Introduced onto the market a new or significantly improved supporting activities 8 1 8 1 7
CISINPCSW
Who mainly developed these processes 8 1 6 1 5
CIS RRDIN Engagement in intramural R&D 8 1 8 1 7CIS RDENG Type of engagement in R&D 7 1 7 1 6
CIS RRDINXExpenditure in intramural R&D (in national currency) 8 1 8 1 7
CISRRDEXX
Purchase of extramural R&D (in national currency) 8 1 8 1 7
CIS RMACXExpenditure in acquisition of machinery (in national currency) 8 1 8 1 7
CIS RTOT
Total of these four innovation expenditure categories (in national currency) 8 1 8 1 7
CISFUNLOC
Public funding from local or regional authorities 5 0 4 0 5
CISFUNGMT
Public funding from central government 5 0 4 0 5
CIS FUNEU Public funding from the EU 5 0 4 0 5
CISFUNRTD
Funding from EU's 6th or 7th Framework Programme for RTD 5 0 4 0 5
Micro Data Linking 2014/2015: Methodological report on meta information 70

CIS COCooperation arrangements on innovation activities 8 1 8 1 6
CISORGBUP
New business practices for organising work or procedures 8 1 8 1 7
CISORGWKP
New methods of workplace organisation 8 1 8 1 7
CISORGEXR
New methods of organising external relations 8 1 8 1 7
CISMKTDGP
Significant changes to the aesthetic design or packaging 8 1 8 1 7
CISMKTPDP
New media or techniques for product promotion 8 1 8 1 7
CISMKTPDL
New methods for product placement or sales channels 8 1 8 1 7
CISMKTPRI
New methods of pricing goods or services 8 1 8 1 7
CISMKTMET
2004-06 New or significantly changed sales or distribution methods 3 1 3 1 3
CCIS NACE 4-digit 4 2 4 2 4EC ENT_ID Unique firm id 7 7 7 7 7EC BROAD Firm has broadband 8 8 8 8 8
EC AEBUYFirm orders through computer networks (websites/EDI) 9 9 9 9 9
ECAEBVALPCT % of orders through internet 7 7 5 5 5
EC AESELLFirm sells through computer networks (websites/EDI) 8 8 8 7 7
ECAESVALPCT
% of sales through computer networks (websites/EDI) 8 8 8 7 7
EC IACC Firm has internet 9 9 8 8 8
ECEMPIUSEPCT % of workers with access to internet 8 8 8 7 8
EC INTRA Firm has intranet 9 9 7 4 4
ECEMPINTRAPCT % of workers with access to intranet 5 5 2 2 2
EC CUSE Firm uses computers 7 7 6 7 7
ECEMPCUSEPCT % of workers using computers 8 8 8 6 6
EC WEB Firm has website 8 8 8 8 8EC MOB Firm has mobile access to internet 9 9 7 6 6
EC DIALUPFirm uses a dial-up connection to access the internet 8 9 9 8 8
EC ITERP Enterprise Resource Planning 8 8 5 5 6EC ADE Automated Data Exchange 9 9 8 9 6EC ADESU to suppliers 9 9 7 4 1EC INVREC receiving e-invoices 9 9 6 3 2EC ADECU receiving orders 9 9 6 2 2
ECINVSND sending e-invoices 9 9 5 3 2
ECADEINFO sending product information 9 9 7 7 5
ECADETDOC sending transport documents 9 9 8 9 5
Micro Data Linking 2014/2015: Methodological report on meta information 71
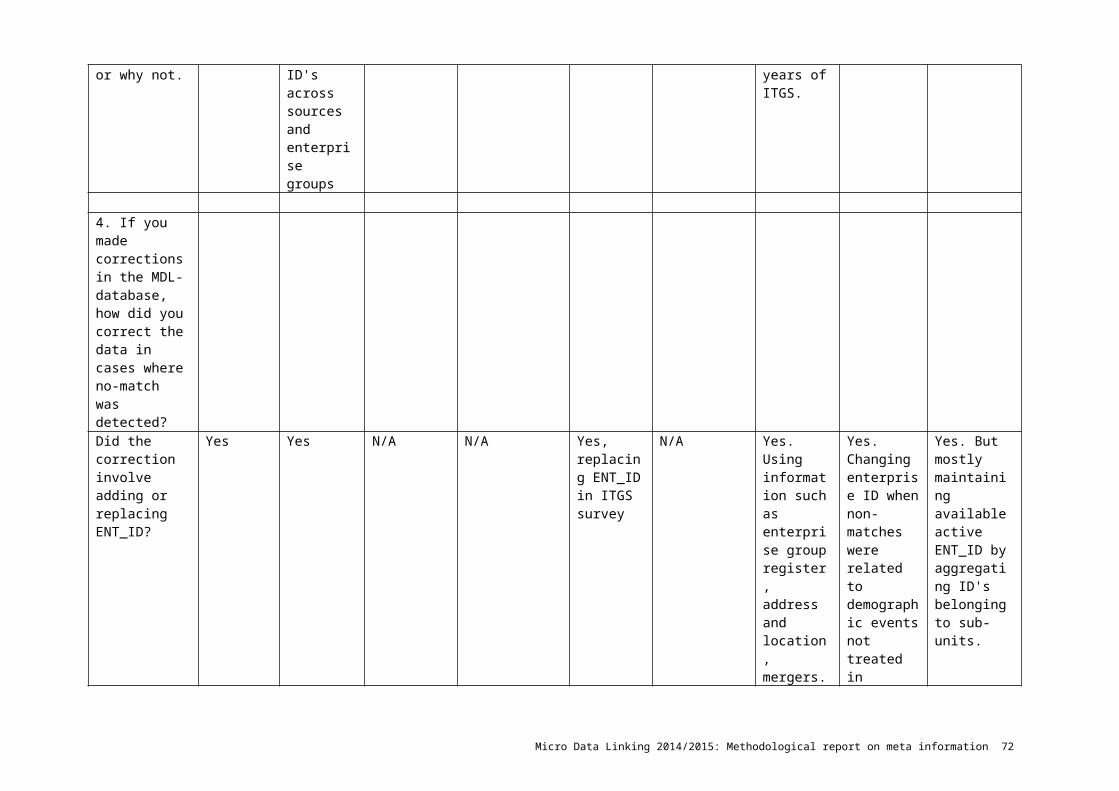
ECADEPAY
Use of ADE for sending payment instructions to financial institutions 9 9 7 9 5
ECADEGOV
Use of ADE for sending or receiving data to/from public authorities 9 9 9 9 4
EC SISU Sharing SCM data with suppliers 8 8 6 5 2EC SICU Sharing SCM data with customers 8 8 4 5 2
ECCRMSTR
share of information with other business functions 9 9 5 6 5
EC CRMANanalyse information for marketing purposes 9 9 6 6 7
ECSISAINV
sales: management of inventory levels 9 9 8 9 6
ECSISAACC sales: accounting 9 9 9 9 5
ECSISAPROD
sales: production or services management 8 8 8 8 4
ECSISADIST sales: distribution management 8 8 8 8 4
ECSIPUINV
purchases: management of inventory levels 8 8 8 8 4
ECSIPUACC purchases: accounting 8 8 8 8 4
EC NACE 4-digit 9 9 9 9 7OFATS Number of foreign affiliates 6 6 6 6 3OFATS
Number of persons employed in foreign affiliates 7 7 7 7 4
OFATS Turnover i foreign affiliates 7 7 7 7 4OFATS Host country of affiliates 7 7 7 7 4IFATS Country of ownership 9 9 9 9 6IFATS NACE 4-digit 9 9 9 9 6BD 11 91 0 Enterprise ID of active enterprises 9 9 9 9 6BD 11 92 0 Enterprise ID of enterprise births 9 9 9 9 6BD 11 93 0 Enterprise ID of enterprise deaths 9 9 9 9 6BD NACE 4-digit 9 9 9 9 6GVC
Enterprise group (from questionnaire Module 1) 1 4 2 3 1
GVC
Enterprise employment by business functions (question 2.2) 1 6 4 5 1
GVC International sourcing (question 3.1) 1 7 5 5 1GVC
International sourcing destination (question 3.3) 1 6 5 5 1
GVC
International sourcing partner (question 3.2) 1 6 5 5 1
GVC
Back-sourcing: Yes/No question and motivation factors (question 3.8 and 8.10) 1 7 5 5 1
GVC Relocation (question 3.11) 1 7 5 5 1GV Foreign affiliates (question 4.1, 4.2, 1 7 5 5 1
Micro Data Linking 2014/2015: Methodological report on meta information 72
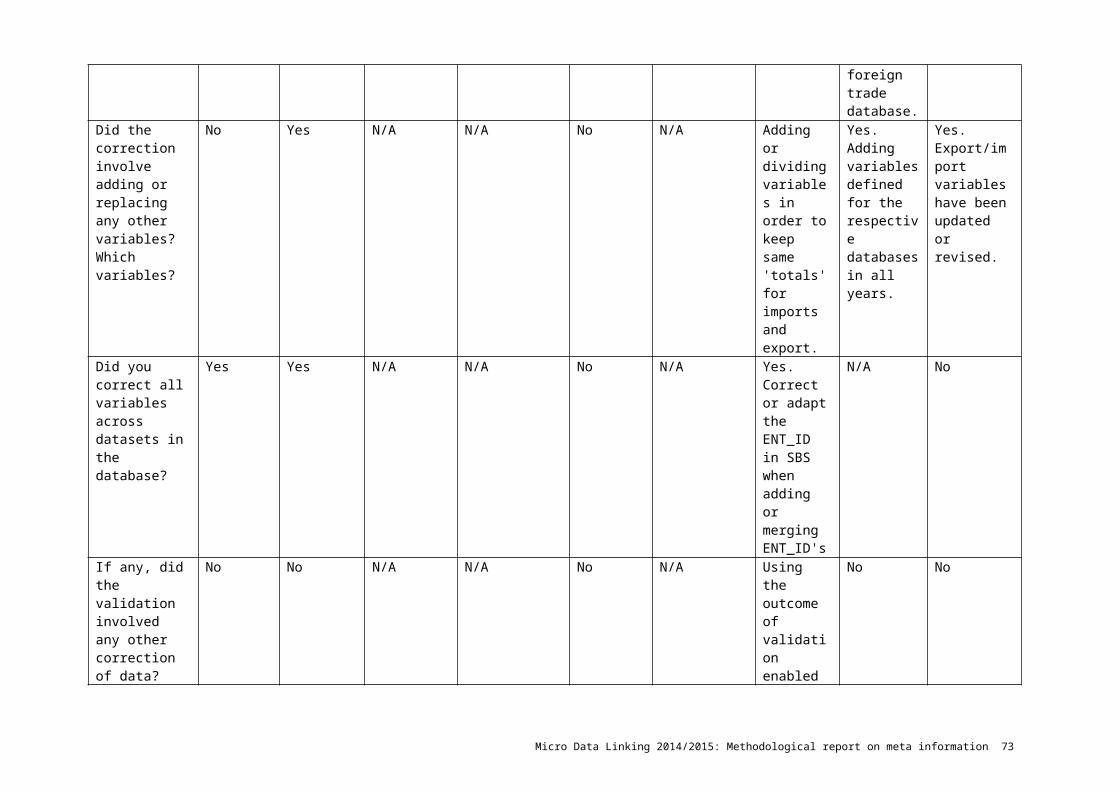
C 4.3, 4.4)GVC
Supplying enterprises abroad (question 5.1, 5.2, 5.3) 1 7 5 5 1
GVC NACE 4-digit 4 7 5 5 3
Micro Data Linking 2014/2015: Methodological report on meta information 73
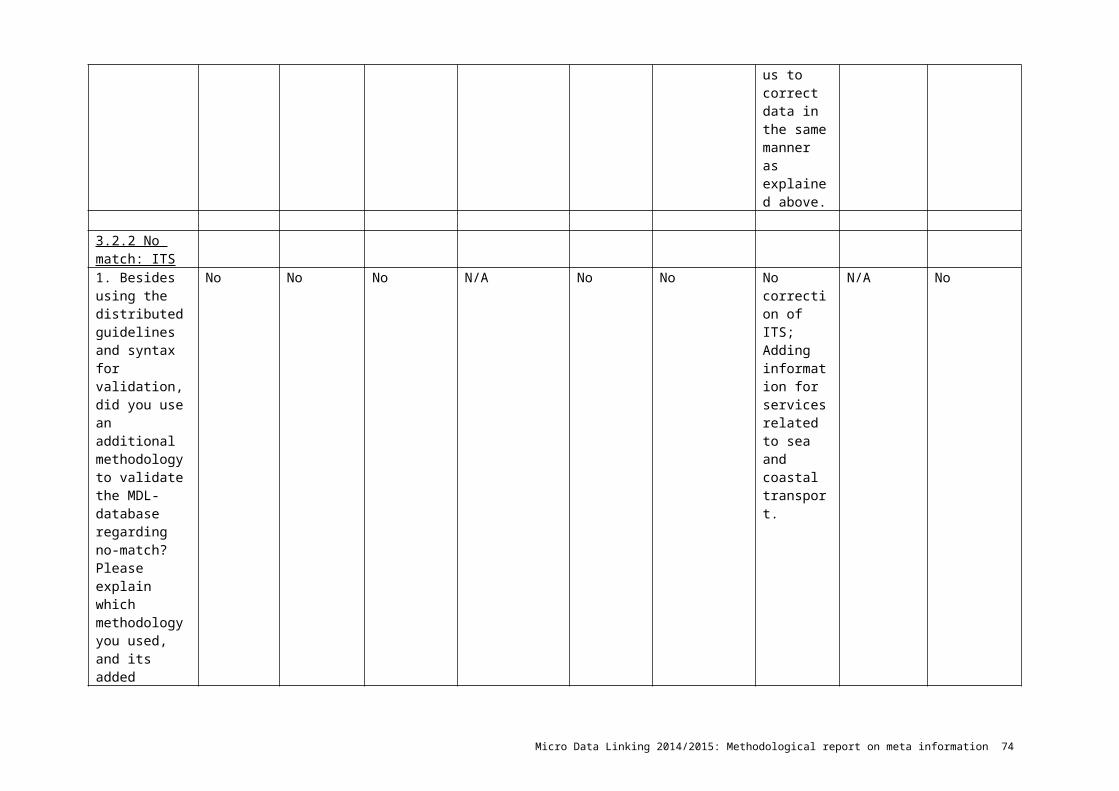
Annex IV: Overview issues
Country CommentsAT
DK FI
DE
LV
NL
NO
PT
SE
TOTAL
Phase 1: Problems / difficulties Time consuming 1 1 1 1 4
Different SAS-version(s) or different statistical software 1 1 1 1 1 1 1 7Minor mistakes in syntax 1 1 1 1 1 5Staff changes 1 1 2Rejection of aggregated confidentiality checks 1 1Closer collaboration appreciated 1 1Some variables could not be included in database 1 1 2Unclear variable definitions 1 1Difficult to make syntax and guidelines uniform for all countries 1 1Not enough description in SAS-syntax 1 1Difficulties importing data in SAS 1 1Computer environment not made for SAS 1 1Much time spend on variables / datasets that were not used 1 1
Phase 1: Proposals More time for syntax testing 1 1
More clear variable definitions 1 1Reference to framework regulations regarding project specific input variables 1 1More descriptions on working with SAS (including examples) 1 1Take in consideration technical requirements (incl. SAS-versions) before or at the beginning of the project 1 1 2Include extra BR variables identifying enterprise, like name, address 1 1Define earlier which output to make 1 1Limit dataset to most relevant variables 1 1
Phase 2: Interpretation validation
Restructured enterprises (outsourced operating business to new or existing enterprise)
1 1 1 3
Micro Data Linking 2014/2015: Methodological report on meta information 74
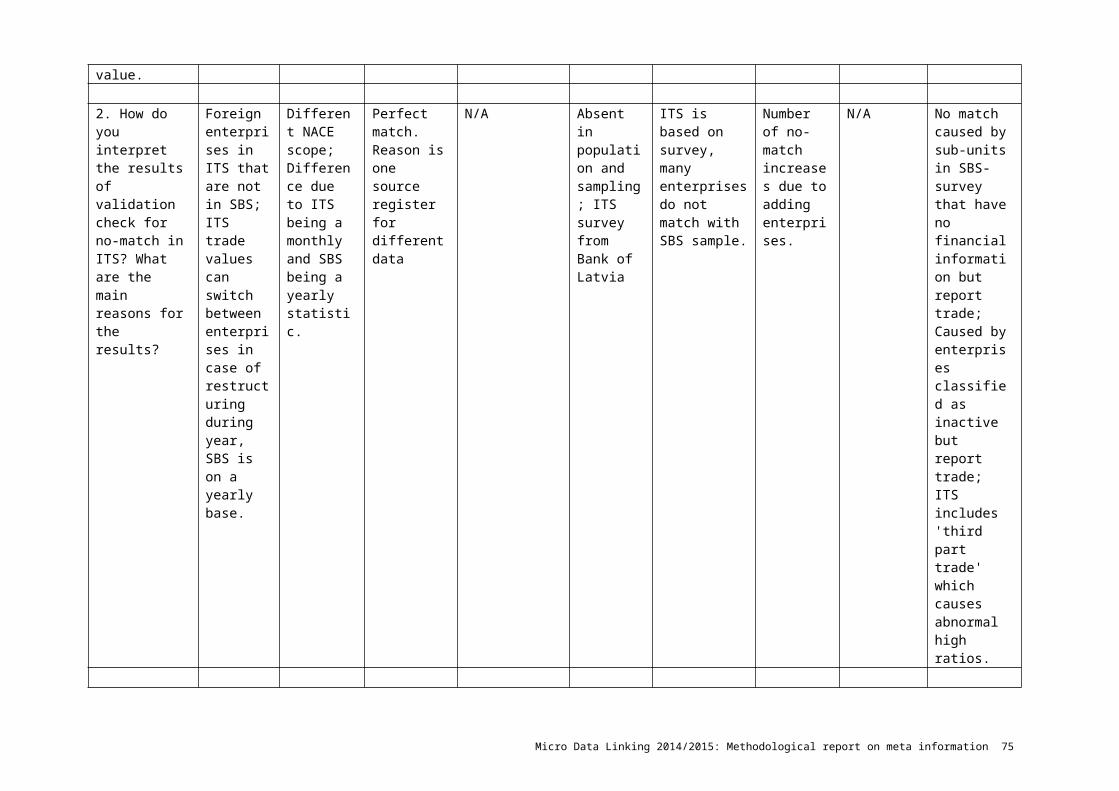
resultsEnterprise not in SBS scope anymore (change in NACE or threshold survey) 1 1 1 3(Foreign) enterprises that are in ITGS but not in SBS 1 1 2Difference due to ITGS being monthly and SBS being yearly statistic. 1 1 2Indirect export (quasi export) 1 1Different use of administrative ID's across sources and enterprise groups 1 1Different approach to enterprise groups 1 1Demographic events 1 1 1 1 1 5Inactivity of (micro/small) enterprises (but reporting trade) 1 1 1 3SBS is sample and sampling design 1 1 2Inconsistencies NACE amongst SBS sample design 1 1Relocation enterprise to other federal state 1 1Effect of 'unit representation' validation on 'no-match' validation 1 1Enterprises report trade activities from more enterprises (f.e. tax groups) 1 1 1 3Economic circumstances 1 1ITS includes sometimes turnover from foreign subsidiaries, while SBS only from company 1 1ITS NACE H include value of agents' revenue 1 1Development within the company 1 1 1 3ITS is sample 1 1Transport related enterprises list value of goods as their export/turnover 1 1 1 3Within enterprise groups, reporting enterprises may change over time 1 1Adding enterprises within ITS (services related to sea and coastal transport) 1 1Too late response 1 1Sub-units in the SBS-survey (no financial information but they report trade) 1 1Third party trade in ITS 1 1Foreign affiliates with no production but substantial export volumes 1 1
Phase 2: Problems /
MDL method differs from 'normal' method (especially when having 1 1 1 3
Micro Data Linking 2014/2015: Methodological report on meta information 75
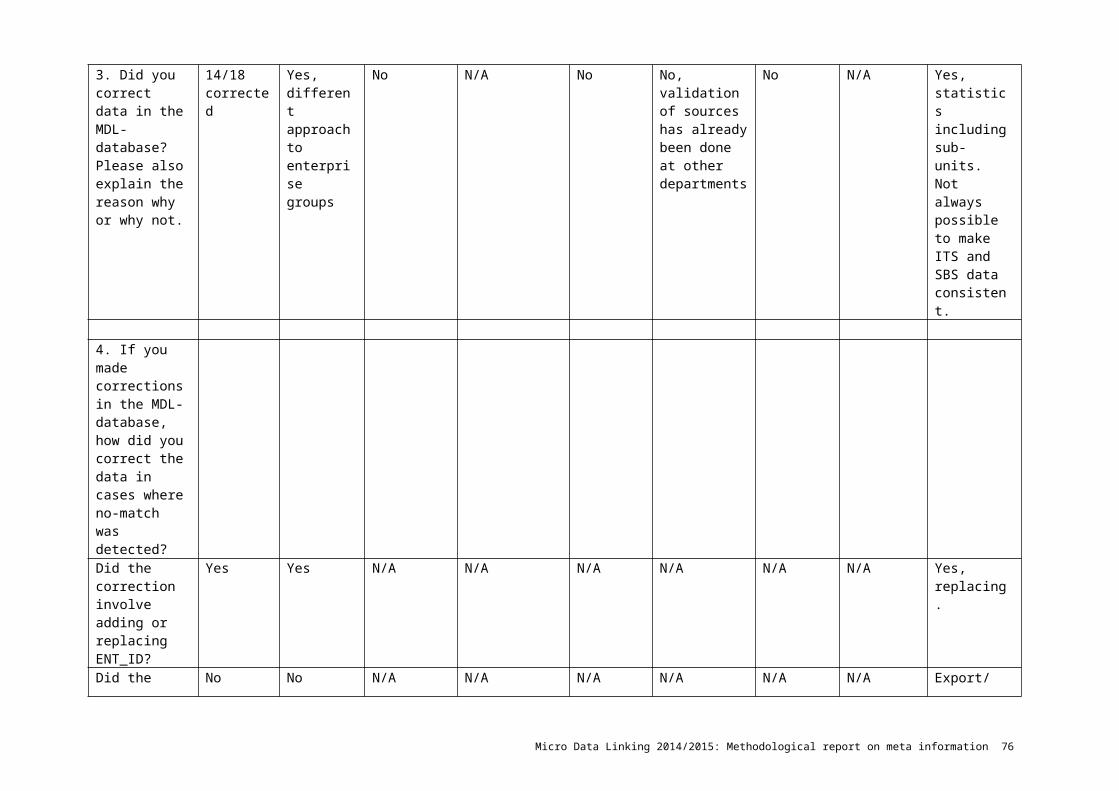
difficulties samples as sources), and as a result considerable difference with official dataSome implausible cases not resolved 1 1Minor mistakes in syntax 1 1Not aware of overall picture validation process 1 1Independent/dependent variable not available 1 1Time consuming 1 1 2ITS variables hard to validate, recommend not to use in further analysis 1 1Variable definitions and measurement differs when comparing to each other 1 1
Phase 2: Proposals
Define in advance which coherences need to be guaranteed regarding earlier send information to Eurostat 1 1 2Addressing issue of different approach enterprise groups 1 1Analyse possibilities to include ITS 1More descriptions on working with SAS (including examples) 1 1 2Print friendly version 1Add some macro validation 1 1Find solution for manually correcting ENT_ID's 1 1Evaluation after each phase, instead at end 1 1Micro validation could be more simple / more focussed on big enterprises 1 1 2
Micro Data Linking 2014/2015: Methodological report on meta information 76
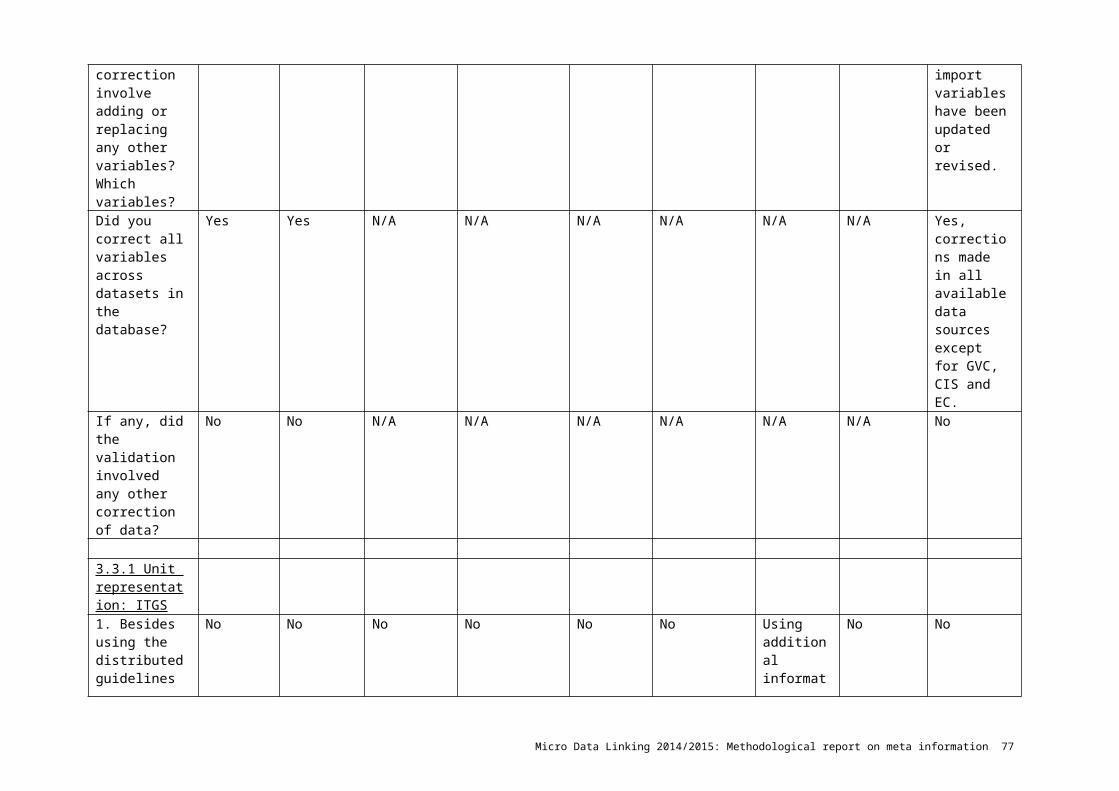
Micro Data Linking 2014/2015: Methodological report on meta information 77