michigan food and agricultural systems profiles - december ... · agricultural revenues4 amount mi...
TRANSCRIPT

Michigan Food and Agricultural Systems Profiles
ALCONA
Area1 674.59 square miles Population2 10,886 Largest City Harrisville Watershed(s) Au Sable, Thunder Bay
Top Commodities by Volume of Sales3
•Milk and other dairy products from cows •Cattle and calves •Other crops and hay •Grains, oilseeds, dry beans, and dry peas •Nursery, greenhouse, floriculture, and sod,
•Forage - land used for all hay and haylage, grass silage, and greenchop •Corn for grain •Wheat for grain •Corn for silage
Top Commodities by Acreage
•Forage •Christmas Trees •Phesants
Agricultural Revenues4 Amount MI top 20 ranking
Total market value of agriculture production $11,399,000 Total crop sales $4,591,000 Total livestock sales $6,808,000
Key Michigan Products
Corn, soy, and wheat 6,987 acres ( 23.12% of cropland) Revenue from corn, soy, and wheat $2,352,000
Vegetables 38 acres ( .13% of cropland) Revenue from vegetables $20,000
Fruit and tree nuts 5 operations Revenue from fruits, tree nuts, and berries N/A
Dairy farms 7 farms Revenue from milk and other dairy $8,715,000
All animal operations 94 operations
Agricultural Land
Total number of farms 235 Total farmland5 38,309 acres
Forage/pasture/non-crop farmland6 8,094 acres Number of farms using certified organic production 2 Number of farms transitioning to organic production 1 Area of greenhouse/nursery operations (sq. ft) n/a

Michigan Food and Agricultural Systems Profiles
Agricultural Chemicals7 Number Percent of MI Total
Fertilizer manufacturers, distributors, and storage facilities 1 0.52% Pesticide storage facilities 0 0.0 %
Processing and Warehousing
Wholesale food processing plants 6 0.3 % Food warehouses 1 0.09% Controlled atmosphere storage facilities 0 0.0 % Dairy processing plants 0 0.0 % Dairy warehouse, transfer, and truck cleaning facilities 0 0.0 % Slaughter facilities (MDARD licensed) 1 2.04% Meat processing plants (MDARD licensed) 11 0.43% Rendering facilities 0 Commercial feed manufacturing facilities 0 Ethanol plants
Retailing and distribution8
Food service establishments (all) 48 0.15% Retail food establishments 22 0.15% Total amount spent by consumers on food (estimate)8 $30,302,820 0.12% Emergency food distribution sites9 5 0.19%
Pounds distributed 104,175 0.13% Students eligible for free or reduced school lunch10 458 0.06% Households receiving FAP (SNAP) benefits11 1,813 0.09%
Total federal funding for SNAP $2,866,685 0.09% Pet population (estimate) 12 5,935 Port(s) of entry none
Local Distribution13
Farmers’ markets 4 U-pick farms/On-farm markets 1 Farms using community Supported Agriculture 0 1 United States Census Bureau State & County Quick Facts: Michigan, http://quickfacts.census.gov/qfd/states/26000.html 2 Michigan Economic Development Corporation Regional Economic Profiles http://www.michiganbusiness.org/cm/Files/Reports/Regional_Economy/Michigan-Economy-Overview.pdf 3 Michigan Farm Bureau, Treasures of Michigan Agriculture, https://www.michfb.com/MI/Treasures/ 4 USDA 2012 AgCensus Statewide profile http://www.agcensus.usda.gov/Publications/2012/Online_Resources/County_Profiles/Michigan/cp99026.pdf 5 Totals from 2012 USDA AgCensus available from National Agricultural Statistics Service http://quickstats.nass.usda.gov/ 6 Includes non-crop farmland, pasture, and woodland pasture acreage 7 Michigan Department of Agriculture and Rural Development, Annual Reports, http://www.michigan.gov/mdard/0,4610,7-125-2968_4811---,00.html 8 Calculated from US Census estimated households in state with Bureau of Labor Statistics estimate of $6,393/household expenditure for food. 9 Food Bank Council of Michigan, http://www.fbcmich.org/site/DocServer/Michigan_Blueprint_to_End_Hunger_2008_web.pdf?docID=1921 estimates rounded to nearest integer 10 Michigan League for Public Policy, Kids Count in Michigan 2013 overview, http://www.mlpp.org/kids-count/michigan-2/mi-data-book-2013 11 USDA measure for 2013 http://www.fns.usda.gov/pd/supplemental-nutrition-assistance-program-snap 12 From 2012 population estimates (US Census Bureau) formula via Ohio Dept of Ag Animal Emergency Response Plan, 2006. Includes dogs, cats, birds, rabbits, rodents, and turtles. 13 Michigan Agritourism Association http://www.michiganfarmfun.com/index.php?option=com_mtree&Itemid=3

Michigan Food and Agricultural Systems Profiles
ALGER
Area1 915.07 square miles Population2 9,560 Largest City Munising Watershed(s) Au Train, Whitefish, Sturgeon
Top Commodities by Volume of Sales3
•Milk and other dairy products from cows •Cattle and calves •Other crops and hay •Hogs and pigs
•Nursery, greenhouse, floriculture, and sod •Fruits, tree nuts, and berries •Vegetables, melons, potatoes, and sweet potatoes •Grains, oilseeds, dry beans, and dry peas
Top Commodities by Acreage
•Forage •Barley •Cattle
Agricultural Revenues4 Amount MI top 20 ranking
Total market value of agriculture production $3,025,000 Total crop sales $890,000 Total livestock sales $2,135,000
Key Michigan Products
Corn, soy, and wheat 219 acres ( 1.62% of cropland) Revenue from corn, soy, and wheat $160,000
Vegetables 56 acres ( .41% of cropland) Revenue from vegetables $156,516
Fruit and tree nuts 6 operations Revenue from fruits, tree nuts, and berries N/A
Dairy farms 6 farms Revenue from milk and other dairy $3,303,000
All animal operations 49 operations
Agricultural Land
Total number of farms 93 Total farmland5 17,781 acres
Forage/pasture/non-crop farmland6 4,276 acres Number of farms using certified organic production 0 Number of farms transitioning to organic production 0 Area of greenhouse/nursery operations (sq. ft) N/A

Michigan Food and Agricultural Systems Profiles
Agricultural Chemicals7 Number Percent of MI Total
Fertilizer manufacturers, distributors, and storage facilities 0 0.0 % Pesticide storage facilities 0 0.0 %
Processing and Warehousing
Wholesale food processing plants 4 0.2 % Food warehouses 3 0.27% Controlled atmosphere storage facilities 0 0.0 % Dairy processing plants 0 0.0 % Dairy warehouse, transfer, and truck cleaning facilities 0 0.0 % Slaughter facilities (MDARD licensed) 0 0.0 % Meat processing plants (MDARD licensed) 5 0.2 % Rendering facilities 0 Commercial feed manufacturing facilities 0 Ethanol plants
Retailing and distribution8
Food service establishments (all) 47 0.15% Retail food establishments 33 0.23% Total amount spent by consumers on food (estimate)8 $22,746,294 0.09% Emergency food distribution sites9 3 0.12%
Pounds distributed 16,516 0.02% Students eligible for free or reduced school lunch10 509 0.07% Households receiving FAP (SNAP) benefits11 1,273 0.07%
Total federal funding for SNAP $2,012,846 0.07% Pet population (estimate) 12 5,212 Port(s) of entry none
Local Distribution13
Farmers’ markets 1 U-pick farms/On-farm markets 0 Farms using community Supported Agriculture 3 1 United States Census Bureau State & County Quick Facts: Michigan, http://quickfacts.census.gov/qfd/states/26000.html 2 Michigan Economic Development Corporation Regional Economic Profiles http://www.michiganbusiness.org/cm/Files/Reports/Regional_Economy/Michigan-Economy-Overview.pdf 3 Michigan Farm Bureau, Treasures of Michigan Agriculture, https://www.michfb.com/MI/Treasures/ 4 USDA 2012 AgCensus Statewide profile http://www.agcensus.usda.gov/Publications/2012/Online_Resources/County_Profiles/Michigan/cp99026.pdf 5 Totals from 2012 USDA AgCensus available from National Agricultural Statistics Service http://quickstats.nass.usda.gov/ 6 Includes non-crop farmland, pasture, and woodland pasture acreage 7 Michigan Department of Agriculture and Rural Development, Annual Reports, http://www.michigan.gov/mdard/0,4610,7-125-2968_4811---,00.html 8 Calculated from US Census estimated households in state with Bureau of Labor Statistics estimate of $6,393/household expenditure for food. 9 Food Bank Council of Michigan, http://www.fbcmich.org/site/DocServer/Michigan_Blueprint_to_End_Hunger_2008_web.pdf?docID=1921 estimates rounded to nearest integer 10 Michigan League for Public Policy, Kids Count in Michigan 2013 overview, http://www.mlpp.org/kids-count/michigan-2/mi-data-book-2013 11 USDA measure for 2013 http://www.fns.usda.gov/pd/supplemental-nutrition-assistance-program-snap 12 From 2012 population estimates (US Census Bureau) formula via Ohio Dept of Ag Animal Emergency Response Plan, 2006. Includes dogs, cats, birds, rabbits, rodents, and turtles. 13 Michigan Agritourism Association http://www.michiganfarmfun.com/index.php?option=com_mtree&Itemid=3

Michigan Food and Agricultural Systems Profiles
ALLEGAN
Area1 825.23 square miles Population2 111,496 Largest City Allegan, South Haven Watershed(s) Kalamazoo, Black, Macatawa
Top Commodities by Volume of Sales3
•Hogs and pigs •Milk and other dairy products from cows •Cattle and calves •Poultry and eggs
•Nursery, greenhouse, floriculture, and sod •Grains, oilseeds, dry beans, and dry peas •Vegetables, melons, potatoes, and sweet potatoes
Top Commodities by Acreage
•Corn •Soybeans •Layers
Agricultural Revenues4 Amount MI top 20 ranking
Total market value of agriculture production $580,835,000 2 Total crop sales $194,085,000 8 Total livestock sales $386,750,000 1
Key Michigan Products
Corn, soy, and wheat 173,420 acres ( 71.68% of cropland)
8
Revenue from corn, soy, and wheat $103,524,000 13 Vegetables 10,518 acres ( 4.35% of cropland) 10
Revenue from vegetables $18,709,000 6 Fruit and tree nuts 88 operations 8
Revenue from fruits, tree nuts, and berries $15,199,000 6 Dairy farms 74 farms 5
Revenue from milk and other dairy $80,950,000 6 All animal operations 549 operations 1
Agricultural Land
Total number of farms 1,396 4 Total farmland5 270,282 acres 7
Forage/pasture/non-crop farmland6 28,335 acres 5 Number of farms using certified organic production 7 Number of farms transitioning to organic production 5 Area of greenhouse/nursery operations (sq. ft) N/A

Michigan Food and Agricultural Systems Profiles
Agricultural Chemicals7 Number Percent of MI Total
Fertilizer manufacturers, distributors, and storage facilities 6 3.14% Pesticide storage facilities 5 3.38%
Processing and Warehousing
Wholesale food processing plants 30 1.5 % Food warehouses 9 0.81% Controlled atmosphere storage facilities 0 0.0 % Dairy processing plants 6 7.59% Dairy warehouse, transfer, and truck cleaning facilities 1 9.09% Slaughter facilities (MDARD licensed) 0 0.0 % Meat processing plants (MDARD licensed) 38 1.5 % Rendering facilities 12 Commercial feed manufacturing facilities 0 Ethanol plants
Retailing and distribution8
Food service establishments (all) 348 1.11% Retail food establishments 163 1.14% Total amount spent by consumers on food (estimate)8 $268,237,494 1.1 % Emergency food distribution sites9 19 0.83%
Pounds distributed 446,277 0.58% Students eligible for free or reduced school lunch10 7,717 1.05% Households receiving FAP (SNAP) benefits11 17,007 0.89%
Total federal funding for SNAP $26,891,183 0.89% Pet population (estimate) 12 60,787 Port(s) of entry none
Local Distribution13
Farmers’ markets 4 U-pick farms/On-farm markets 12 Farms using community Supported Agriculture 10 1 United States Census Bureau State & County Quick Facts: Michigan, http://quickfacts.census.gov/qfd/states/26000.html 2 Michigan Economic Development Corporation Regional Economic Profiles http://www.michiganbusiness.org/cm/Files/Reports/Regional_Economy/Michigan-Economy-Overview.pdf 3 Michigan Farm Bureau, Treasures of Michigan Agriculture, https://www.michfb.com/MI/Treasures/ 4 USDA 2012 AgCensus Statewide profile http://www.agcensus.usda.gov/Publications/2012/Online_Resources/County_Profiles/Michigan/cp99026.pdf 5 Totals from 2012 USDA AgCensus available from National Agricultural Statistics Service http://quickstats.nass.usda.gov/ 6 Includes non-crop farmland, pasture, and woodland pasture acreage 7 Michigan Department of Agriculture and Rural Development, Annual Reports, http://www.michigan.gov/mdard/0,4610,7-125-2968_4811---,00.html 8 Calculated from US Census estimated households in state with Bureau of Labor Statistics estimate of $6,393/household expenditure for food. 9 Food Bank Council of Michigan, http://www.fbcmich.org/site/DocServer/Michigan_Blueprint_to_End_Hunger_2008_web.pdf?docID=1921 estimates rounded to nearest integer 10 Michigan League for Public Policy, Kids Count in Michigan 2013 overview, http://www.mlpp.org/kids-count/michigan-2/mi-data-book-2013 11 USDA measure for 2013 http://www.fns.usda.gov/pd/supplemental-nutrition-assistance-program-snap 12 From 2012 population estimates (US Census Bureau) formula via Ohio Dept of Ag Animal Emergency Response Plan, 2006. Includes dogs, cats, birds, rabbits, rodents, and turtles. 13 Michigan Agritourism Association http://www.michiganfarmfun.com/index.php?option=com_mtree&Itemid=3

Michigan Food and Agricultural Systems Profiles
ALPENA
Area1 571.86 square miles Population2 29,546 Largest City Alpena Watershed(s) Thunder Bay
Top Commodities by Volume of Sales3
•Hogs, Grains, oilseeds, dry beans, and dry peas •Cattle and calves •Other crops and hay
•Vegetables, melons, potatoes, and sweet potatoes •Fruits, tree nuts, and berries
Top Commodities by Acreage
•Forage •Corn •Cattle
Agricultural Revenues4 Amount MI top 20 ranking
Total market value of agriculture production $23,653,000 Total crop sales $9,507,000 Total livestock sales $14,146,000
Key Michigan Products
Corn, soy, and wheat 15,721 acres ( 27.79% of cropland) Revenue from corn, soy, and wheat $6,724,000
Vegetables 93 acres ( .16% of cropland) Revenue from vegetables $223,000
Fruit and tree nuts 12 operations Revenue from fruits, tree nuts, and berries $162,000
Dairy farms 34 farms Revenue from milk and other dairy $27,520,000 13
All animal operations 214 operations
Agricultural Land
Total number of farms 458 Total farmland5 69,274 acres
Forage/pasture/non-crop farmland6 12,711 acres Number of farms using certified organic production 3 Number of farms transitioning to organic production 7 Area of greenhouse/nursery operations (sq. ft) N/A

Michigan Food and Agricultural Systems Profiles
Agricultural Chemicals7 Number Percent of MI Total
Fertilizer manufacturers, distributors, and storage facilities 0 0.0 % Pesticide storage facilities 0 0.0 %
Processing and Warehousing
Wholesale food processing plants 12 0.6 % Food warehouses 15 1.34% Controlled atmosphere storage facilities 0 0.0 % Dairy processing plants 0 0.0 % Dairy warehouse, transfer, and truck cleaning facilities 0 0.0 % Slaughter facilities (MDARD licensed) 1 2.04% Meat processing plants (MDARD licensed) 25 0.99% Rendering facilities 0 Commercial feed manufacturing facilities 0 Ethanol plants
Retailing and distribution8
Food service establishments (all) 127 0.4 % Retail food establishments 51 0.36% Total amount spent by consumers on food (estimate)8 $83,735,514 0.34% Emergency food distribution sites9 5 0.22%
Pounds distributed 111,141 0.14% Students eligible for free or reduced school lunch10 2,249 0.31% Households receiving FAP (SNAP) benefits11 6,345 0.33%
Total federal funding for SNAP $10,032,607 0.33% Pet population (estimate) 12 16,108 Port(s) of entry none
Local Distribution13
Farmers’ markets 2 U-pick farms/On-farm markets 2 Farms using community Supported Agriculture 2 1 United States Census Bureau State & County Quick Facts: Michigan, http://quickfacts.census.gov/qfd/states/26000.html 2 Michigan Economic Development Corporation Regional Economic Profiles http://www.michiganbusiness.org/cm/Files/Reports/Regional_Economy/Michigan-Economy-Overview.pdf 3 Michigan Farm Bureau, Treasures of Michigan Agriculture, https://www.michfb.com/MI/Treasures/ 4 USDA 2012 AgCensus Statewide profile http://www.agcensus.usda.gov/Publications/2012/Online_Resources/County_Profiles/Michigan/cp99026.pdf 5 Totals from 2012 USDA AgCensus available from National Agricultural Statistics Service http://quickstats.nass.usda.gov/ 6 Includes non-crop farmland, pasture, and woodland pasture acreage 7 Michigan Department of Agriculture and Rural Development, Annual Reports, http://www.michigan.gov/mdard/0,4610,7-125-2968_4811---,00.html 8 Calculated from US Census estimated households in state with Bureau of Labor Statistics estimate of $6,393/household expenditure for food. 9 Food Bank Council of Michigan, http://www.fbcmich.org/site/DocServer/Michigan_Blueprint_to_End_Hunger_2008_web.pdf?docID=1921 estimates rounded to nearest integer 10 Michigan League for Public Policy, Kids Count in Michigan 2013 overview, http://www.mlpp.org/kids-count/michigan-2/mi-data-book-2013 11 USDA measure for 2013 http://www.fns.usda.gov/pd/supplemental-nutrition-assistance-program-snap 12 From 2012 population estimates (US Census Bureau) formula via Ohio Dept of Ag Animal Emergency Response Plan, 2006. Includes dogs, cats, birds, rabbits, rodents, and turtles. 13 Michigan Agritourism Association http://www.michiganfarmfun.com/index.php?option=com_mtree&Itemid=3

Michigan Food and Agricultural Systems Profiles
ANTRIM
Area1 475.70 square miles Population2 23,519 Largest City Bellaire Watershed(s) Elk, Pine, Manistee
Top Commodities by Volume of Sales3
•Fruits, tree nuts, and berries •Nursery, greenouse, floriculture, and sod
Top Commodities by Acreage
•Forage •Corn •Pheasants
Agricultural Revenues4 Amount MI top 20 ranking
Total market value of agriculture production $20,996,000 Total crop sales $15,336,000 Total livestock sales $5,660,000
Key Michigan Products
Corn, soy, and wheat 6,193 acres ( 12.15% of cropland) Revenue from corn, soy, and wheat $2,452,000
Vegetables 1,546 acres ( 3.03% of cropland) Revenue from vegetables $4,744,540
Fruit and tree nuts 45 operations 9 Revenue from fruits, tree nuts, and berries $4,049,000 12
Dairy farms 2 farms Revenue from milk and other dairy N/A
All animal operations 126 operations
Agricultural Land
Total number of farms 415 Total farmland5 64,167 acres
Forage/pasture/non-crop farmland6 13,204 acres Number of farms using certified organic production 3 Number of farms transitioning to organic production 9 Area of greenhouse/nursery operations (sq. ft) 1,128

Michigan Food and Agricultural Systems Profiles
Agricultural Chemicals7 Number Percent of MI Total
Fertilizer manufacturers, distributors, and storage facilities 2 1.05% Pesticide storage facilities 0 0.0 %
Processing and Warehousing
Wholesale food processing plants 34 1.7 % Food warehouses 6 0.54% Controlled atmosphere storage facilities 0 0.0 % Dairy processing plants 0 0.0 % Dairy warehouse, transfer, and truck cleaning facilities 0 0.0 % Slaughter facilities (MDARD licensed) 7 14.29% Meat processing plants (MDARD licensed) 24 0.95% Rendering facilities 0 Commercial feed manufacturing facilities 0 Ethanol plants
Retailing and distribution8
Food service establishments (all) 113 0.36% Retail food establishments 74 0.52% Total amount spent by consumers on food (estimate)8 $62,133,567 0.25% Emergency food distribution sites9 6 0.27%
Pounds distributed 390,148 0.5 % Students eligible for free or reduced school lunch10 1,867 0.25% Households receiving FAP (SNAP) benefits11 3,793 0.2 %
Total federal funding for SNAP $5,997,428 0.2 % Pet population (estimate) 12 12,823 Port(s) of entry none
Local Distribution13
Farmers’ markets 5 U-pick farms/On-farm markets 4 Farms using community Supported Agriculture 8 1 United States Census Bureau State & County Quick Facts: Michigan, http://quickfacts.census.gov/qfd/states/26000.html 2 Michigan Economic Development Corporation Regional Economic Profiles http://www.michiganbusiness.org/cm/Files/Reports/Regional_Economy/Michigan-Economy-Overview.pdf 3 Michigan Farm Bureau, Treasures of Michigan Agriculture, https://www.michfb.com/MI/Treasures/ 4 USDA 2012 AgCensus Statewide profile http://www.agcensus.usda.gov/Publications/2012/Online_Resources/County_Profiles/Michigan/cp99026.pdf 5 Totals from 2012 USDA AgCensus available from National Agricultural Statistics Service http://quickstats.nass.usda.gov/ 6 Includes non-crop farmland, pasture, and woodland pasture acreage 7 Michigan Department of Agriculture and Rural Development, Annual Reports, http://www.michigan.gov/mdard/0,4610,7-125-2968_4811---,00.html 8 Calculated from US Census estimated households in state with Bureau of Labor Statistics estimate of $6,393/household expenditure for food. 9 Food Bank Council of Michigan, http://www.fbcmich.org/site/DocServer/Michigan_Blueprint_to_End_Hunger_2008_web.pdf?docID=1921 estimates rounded to nearest integer 10 Michigan League for Public Policy, Kids Count in Michigan 2013 overview, http://www.mlpp.org/kids-count/michigan-2/mi-data-book-2013 11 USDA measure for 2013 http://www.fns.usda.gov/pd/supplemental-nutrition-assistance-program-snap 12 From 2012 population estimates (US Census Bureau) formula via Ohio Dept of Ag Animal Emergency Response Plan, 2006. Includes dogs, cats, birds, rabbits, rodents, and turtles. 13 Michigan Agritourism Association http://www.michiganfarmfun.com/index.php?option=com_mtree&Itemid=3

Michigan Food and Agricultural Systems Profiles
ARENAC
Area1 363.19 square miles Population2 15,871 Largest City Standish Watershed(s) Au Gres, Rifle
Top Commodities by Volume of Sales3
•Grains, Oilseeds •Dry beans, and dry peas •Milk and other dairy products from cows •Other crops and hay
Top Commodities by Acreage
•Corn •Soybeans •Cattle
Agricultural Revenues4 Amount MI top 20 ranking
Total market value of agriculture production $51,202,000 Total crop sales $35,825,000 Total livestock sales $15,377,000
Key Michigan Products
Corn, soy, and wheat 36,922 acres ( 49.89% of cropland) Revenue from corn, soy, and wheat $24,864,000
Vegetables 1,514 acres ( 2.05% of cropland) Revenue from vegetables $2,095,000
Fruit and tree nuts 10 operations Revenue from fruits, tree nuts, and berries $16,000
Dairy farms 18 farms Revenue from milk and other dairy (D)
All animal operations 77 operations
Agricultural Land
Total number of farms 421 Total farmland5 81,677 acres
Forage/pasture/non-crop farmland6 7,667 acres Number of farms using certified organic production 4 Number of farms transitioning to organic production 11 Area of greenhouse/nursery operations (sq. ft) n/a

Michigan Food and Agricultural Systems Profiles
Agricultural Chemicals7 Number Percent of MI Total
Fertilizer manufacturers, distributors, and storage facilities 2 1.05% Pesticide storage facilities 0 0.0 %
Processing and Warehousing
Wholesale food processing plants 5 0.25% Food warehouses 1 0.09% Controlled atmosphere storage facilities 0 0.0 % Dairy processing plants 0 0.0 % Dairy warehouse, transfer, and truck cleaning facilities 1 9.09% Slaughter facilities (MDARD licensed) 0 0.0 % Meat processing plants (MDARD licensed) 17 0.67% Rendering facilities 0 Commercial feed manufacturing facilities 0 Ethanol plants
Retailing and distribution8
Food service establishments (all) 57 0.18% Retail food establishments 41 0.29% Total amount spent by consumers on food (estimate)8 $41,138,955 0.17% Emergency food distribution sites9 4 0.17%
Pounds distributed 48,111 0.06% Students eligible for free or reduced school lunch10 1,430 0.2 % Households receiving FAP (SNAP) benefits11 3,659 0.19%
Total federal funding for SNAP $5,785,549 0.19% Pet population (estimate) 12 8,653 Port(s) of entry none
Local Distribution13
Farmers’ markets 2 U-pick farms/On-farm markets 0 Farms using community Supported Agriculture 2 1 United States Census Bureau State & County Quick Facts: Michigan, http://quickfacts.census.gov/qfd/states/26000.html 2 Michigan Economic Development Corporation Regional Economic Profiles http://www.michiganbusiness.org/cm/Files/Reports/Regional_Economy/Michigan-Economy-Overview.pdf 3 Michigan Farm Bureau, Treasures of Michigan Agriculture, https://www.michfb.com/MI/Treasures/ 4 USDA 2012 AgCensus Statewide profile http://www.agcensus.usda.gov/Publications/2012/Online_Resources/County_Profiles/Michigan/cp99026.pdf 5 Totals from 2012 USDA AgCensus available from National Agricultural Statistics Service http://quickstats.nass.usda.gov/ 6 Includes non-crop farmland, pasture, and woodland pasture acreage 7 Michigan Department of Agriculture and Rural Development, Annual Reports, http://www.michigan.gov/mdard/0,4610,7-125-2968_4811---,00.html 8 Calculated from US Census estimated households in state with Bureau of Labor Statistics estimate of $6,393/household expenditure for food. 9 Food Bank Council of Michigan, http://www.fbcmich.org/site/DocServer/Michigan_Blueprint_to_End_Hunger_2008_web.pdf?docID=1921 estimates rounded to nearest integer 10 Michigan League for Public Policy, Kids Count in Michigan 2013 overview, http://www.mlpp.org/kids-count/michigan-2/mi-data-book-2013 11 USDA measure for 2013 http://www.fns.usda.gov/pd/supplemental-nutrition-assistance-program-snap 12 From 2012 population estimates (US Census Bureau) formula via Ohio Dept of Ag Animal Emergency Response Plan, 2006. Includes dogs, cats, birds, rabbits, rodents, and turtles. 13 Michigan Agritourism Association http://www.michiganfarmfun.com/index.php?option=com_mtree&Itemid=3

Michigan Food and Agricultural Systems Profiles
BARAGA
Area1 898.26 square miles Population2 8,837 Largest City Baraga Watershed(s) Menominee, Portage
Top Commodities by Volume of Sales3
•Cattle and calves •Other crops and hay •Fruits, tree nuts, and berries •Cut Christmas trees
•Short rotation woody crops •Grains, oilseeds •Dry beans and dry peas
Top Commodities by Acreage
•Forage •Barley •Layers
Agricultural Revenues4 Amount MI top 20 ranking
Total market value of agriculture production $1,473,000 Total crop sales $783,000 Total livestock sales $690,000
Key Michigan Products
Corn, soy, and wheat 52 acres ( .40% of cropland) Revenue from corn, soy, and wheat $
Vegetables acres ( .00% of cropland) Revenue from vegetables $6,000
Fruit and tree nuts N/A operations Revenue from fruits, tree nuts, and berries N/A
Dairy farms N/A farms Revenue from milk and other dairy N/A
All animal operations 25 operations
Agricultural Land
Total number of farms 57 Total farmland5 17,732 acres
Forage/pasture/non-crop farmland6 4,774 acres Number of farms using certified organic production 0 Number of farms transitioning to organic production 0 Area of greenhouse/nursery operations (sq. ft) n/a

Michigan Food and Agricultural Systems Profiles
Agricultural Chemicals7 Number Percent of MI Total
Fertilizer manufacturers, distributors, and storage facilities 0 0.0 % Pesticide storage facilities 0 0.0 %
Processing and Warehousing
Wholesale food processing plants 4 0.2 % Food warehouses 2 0.18% Controlled atmosphere storage facilities 0 0.0 % Dairy processing plants 0 0.0 % Dairy warehouse, transfer, and truck cleaning facilities 0 0.0 % Slaughter facilities (MDARD licensed) 0 0.0 % Meat processing plants (MDARD licensed) 4 0.16% Rendering facilities 0 Commercial feed manufacturing facilities 0 Ethanol plants
Retailing and distribution8
Food service establishments (all) 40 0.13% Retail food establishments 13 0.09% Total amount spent by consumers on food (estimate)8 $20,208,273 0.08% Emergency food distribution sites9 11 0.47%
Pounds distributed 106,429 0.14% Students eligible for free or reduced school lunch10 689 0.09% Households receiving FAP (SNAP) benefits11 1,408 0.07%
Total federal funding for SNAP $2,226,306 0.07% Pet population (estimate) 12 4,818 Port(s) of entry none
Local Distribution13
Farmers’ markets 1 U-pick farms/On-farm markets 0 Farms using community Supported Agriculture 0 1 United States Census Bureau State & County Quick Facts: Michigan, http://quickfacts.census.gov/qfd/states/26000.html 2 Michigan Economic Development Corporation Regional Economic Profiles http://www.michiganbusiness.org/cm/Files/Reports/Regional_Economy/Michigan-Economy-Overview.pdf 3 Michigan Farm Bureau, Treasures of Michigan Agriculture, https://www.michfb.com/MI/Treasures/ 4 USDA 2012 AgCensus Statewide profile http://www.agcensus.usda.gov/Publications/2012/Online_Resources/County_Profiles/Michigan/cp99026.pdf 5 Totals from 2012 USDA AgCensus available from National Agricultural Statistics Service http://quickstats.nass.usda.gov/ 6 Includes non-crop farmland, pasture, and woodland pasture acreage 7 Michigan Department of Agriculture and Rural Development, Annual Reports, http://www.michigan.gov/mdard/0,4610,7-125-2968_4811---,00.html 8 Calculated from US Census estimated households in state with Bureau of Labor Statistics estimate of $6,393/household expenditure for food. 9 Food Bank Council of Michigan, http://www.fbcmich.org/site/DocServer/Michigan_Blueprint_to_End_Hunger_2008_web.pdf?docID=1921 estimates rounded to nearest integer 10 Michigan League for Public Policy, Kids Count in Michigan 2013 overview, http://www.mlpp.org/kids-count/michigan-2/mi-data-book-2013 11 USDA measure for 2013 http://www.fns.usda.gov/pd/supplemental-nutrition-assistance-program-snap 12 From 2012 population estimates (US Census Bureau) formula via Ohio Dept of Ag Animal Emergency Response Plan, 2006. Includes dogs, cats, birds, rabbits, rodents, and turtles. 13 Michigan Agritourism Association http://www.michiganfarmfun.com/index.php?option=com_mtree&Itemid=3

Michigan Food and Agricultural Systems Profiles
BARRY
Area1 553.09 square miles Population2 59,081 Largest City Hastings Watershed(s) Grand, Kalamazoo
Top Commodities by Volume of Sales3
•Milk and other dairy products from cows •Grains, oilseeds, dry beans, and dry peas •Cattle and calves •Poultry and eggs
•Nursery, greenhouse, floriculture, and sod •Other crops and hay •Horses, ponies, mules, burros, and donkeys
Top Commodities by Acreage
•Corn •Soybeans •Turkeys
Agricultural Revenues4 Amount MI top 20 ranking
Total market value of agriculture production $140,071,000 Total crop sales $47,415,000 Total livestock sales $92,656,000 9
Key Michigan Products
Corn, soy, and wheat 80,761 acres ( 58.43% of cropland) Revenue from corn, soy, and wheat $42,349,000
Vegetables 286 acres ( .21% of cropland) Revenue from vegetables $253,349
Fruit and tree nuts 18 operations Revenue from fruits, tree nuts, and berries $76,000
Dairy farms 29 farms Revenue from milk and other dairy $42,120,000 10
All animal operations 440 operations 10
Agricultural Land
Total number of farms 1,031 Total farmland5 165,185 acres
Forage/pasture/non-crop farmland6 26,964 acres 9 Number of farms using certified organic production 5 Number of farms transitioning to organic production 15 Area of greenhouse/nursery operations (sq. ft) n/a

Michigan Food and Agricultural Systems Profiles
Agricultural Chemicals7 Number Percent of MI Total
Fertilizer manufacturers, distributors, and storage facilities 1 0.52% Pesticide storage facilities 2 1.35%
Processing and Warehousing
Wholesale food processing plants 10 0.5 % Food warehouses 4 0.36% Controlled atmosphere storage facilities 0 0.0 % Dairy processing plants 2 2.53% Dairy warehouse, transfer, and truck cleaning facilities 0 0.0 % Slaughter facilities (MDARD licensed) 0 0.0 % Meat processing plants (MDARD licensed) 13 0.51% Rendering facilities 0 Commercial feed manufacturing facilities 0 Ethanol plants Carbon Green BioEnergy
Retailing and distribution8
Food service establishments (all) 151 0.48% Retail food establishments 61 0.43% Total amount spent by consumers on food (estimate)8 $143,554,815 0.59% Emergency food distribution sites9 11 0.47%
Pounds distributed 847,385 1.1 % Students eligible for free or reduced school lunch10 3,262 0.44% Households receiving FAP (SNAP) benefits11 8,763 0.46%
Total federal funding for SNAP $13,855,908 0.46% Pet population (estimate) 12 32,211 Port(s) of entry none
Local Distribution13
Farmers’ markets 2 U-pick farms/On-farm markets 2 Farms using community Supported Agriculture 1 1 United States Census Bureau State & County Quick Facts: Michigan, http://quickfacts.census.gov/qfd/states/26000.html 2 Michigan Economic Development Corporation Regional Economic Profiles http://www.michiganbusiness.org/cm/Files/Reports/Regional_Economy/Michigan-Economy-Overview.pdf 3 Michigan Farm Bureau, Treasures of Michigan Agriculture, https://www.michfb.com/MI/Treasures/ 4 USDA 2012 AgCensus Statewide profile http://www.agcensus.usda.gov/Publications/2012/Online_Resources/County_Profiles/Michigan/cp99026.pdf 5 Totals from 2012 USDA AgCensus available from National Agricultural Statistics Service http://quickstats.nass.usda.gov/ 6 Includes non-crop farmland, pasture, and woodland pasture acreage 7 Michigan Department of Agriculture and Rural Development, Annual Reports, http://www.michigan.gov/mdard/0,4610,7-125-2968_4811---,00.html 8 Calculated from US Census estimated households in state with Bureau of Labor Statistics estimate of $6,393/household expenditure for food. 9 Food Bank Council of Michigan, http://www.fbcmich.org/site/DocServer/Michigan_Blueprint_to_End_Hunger_2008_web.pdf?docID=1921 estimates rounded to nearest integer 10 Michigan League for Public Policy, Kids Count in Michigan 2013 overview, http://www.mlpp.org/kids-count/michigan-2/mi-data-book-2013 11 USDA measure for 2013 http://www.fns.usda.gov/pd/supplemental-nutrition-assistance-program-snap 12 From 2012 population estimates (US Census Bureau) formula via Ohio Dept of Ag Animal Emergency Response Plan, 2006. Includes dogs, cats, birds, rabbits, rodents, and turtles. 13 Michigan Agritourism Association http://www.michiganfarmfun.com/index.php?option=com_mtree&Itemid=3

Michigan Food and Agricultural Systems Profiles
BAY
Area1 442.30 square miles Population2 107,697 Largest City Bay City Watershed(s) Saginaw, Kawkawlin, Rifle
Top Commodities by Volume of Sales3
•Grains, oilseeds, dry beans, and dry peas •Other crops and hay •Milk and other dairy products from cows •Nursery, greenhouse, floriculture, and sod •Cattle and calves
Top Commodities by Acreage
•Corn •Soybeans •Quail
Agricultural Revenues4 Amount MI top 20 ranking
Total market value of agriculture production $165,295,000 19 Total crop sales $157,210,000 13 Total livestock sales $8,085,000
Key Michigan Products
Corn, soy, and wheat 119,115 acres ( 64.96% of cropland)
20
Revenue from corn, soy, and wheat $87,967,000 18 Vegetables 15,914 acres ( 8.68% of cropland) 6
Revenue from vegetables $18,564,000 7 Fruit and tree nuts 12 operations
Revenue from fruits, tree nuts, and berries N/A Dairy farms 9 farms
Revenue from milk and other dairy $27,059,000 14 All animal operations 109 operations
Agricultural Land
Total number of farms 766 Total farmland5 193,708 acres 19
Forage/pasture/non-crop farmland6 10,353 acres Number of farms using certified organic production 2 Number of farms transitioning to organic production 0 Area of greenhouse/nursery operations (sq. ft) 64,960

Michigan Food and Agricultural Systems Profiles
Agricultural Chemicals7 Number Percent of MI Total
Fertilizer manufacturers, distributors, and storage facilities 6 3.14% Pesticide storage facilities 5 3.38%
Processing and Warehousing
Wholesale food processing plants 19 0.95% Food warehouses 16 1.43% Controlled atmosphere storage facilities 0 0.0 % Dairy processing plants 0 0.0 % Dairy warehouse, transfer, and truck cleaning facilities 0 0.0 % Slaughter facilities (MDARD licensed) 0 0.0 % Meat processing plants (MDARD licensed) 45 1.77% Rendering facilities 0 Commercial feed manufacturing facilities 0 Ethanol plants
Retailing and distribution8
Food service establishments (all) 384 1.22% Retail food establishments 164 1.15% Total amount spent by consumers on food (estimate)8 $280,767,774 1.15% Emergency food distribution sites9 17 0.73%
Pounds distributed 220,476 0.29% Students eligible for free or reduced school lunch10 7,612 1.04% Households receiving FAP (SNAP) benefits11 20,858 1.09%
Total federal funding for SNAP $32,980,319 1.09% Pet population (estimate) 12 58,716 Port(s) of entry none
Local Distribution13
Farmers’ markets 2 U-pick farms/On-farm markets 0 Farms using community Supported Agriculture 2 1 United States Census Bureau State & County Quick Facts: Michigan, http://quickfacts.census.gov/qfd/states/26000.html 2 Michigan Economic Development Corporation Regional Economic Profiles http://www.michiganbusiness.org/cm/Files/Reports/Regional_Economy/Michigan-Economy-Overview.pdf 3 Michigan Farm Bureau, Treasures of Michigan Agriculture, https://www.michfb.com/MI/Treasures/ 4 USDA 2012 AgCensus Statewide profile http://www.agcensus.usda.gov/Publications/2012/Online_Resources/County_Profiles/Michigan/cp99026.pdf 5 Totals from 2012 USDA AgCensus available from National Agricultural Statistics Service http://quickstats.nass.usda.gov/ 6 Includes non-crop farmland, pasture, and woodland pasture acreage 7 Michigan Department of Agriculture and Rural Development, Annual Reports, http://www.michigan.gov/mdard/0,4610,7-125-2968_4811---,00.html 8 Calculated from US Census estimated households in state with Bureau of Labor Statistics estimate of $6,393/household expenditure for food. 9 Food Bank Council of Michigan, http://www.fbcmich.org/site/DocServer/Michigan_Blueprint_to_End_Hunger_2008_web.pdf?docID=1921 estimates rounded to nearest integer 10 Michigan League for Public Policy, Kids Count in Michigan 2013 overview, http://www.mlpp.org/kids-count/michigan-2/mi-data-book-2013 11 USDA measure for 2013 http://www.fns.usda.gov/pd/supplemental-nutrition-assistance-program-snap 12 From 2012 population estimates (US Census Bureau) formula via Ohio Dept of Ag Animal Emergency Response Plan, 2006. Includes dogs, cats, birds, rabbits, rodents, and turtles. 13 Michigan Agritourism Association http://www.michiganfarmfun.com/index.php?option=com_mtree&Itemid=3

Michigan Food and Agricultural Systems Profiles
BENZIE
Area1 319.70 square miles Population2 17,508 Largest City Beulah Watershed(s) Platte, Betsie
Top Commodities by Volume of Sales3
•Fruits, tree nuts, and berries •Other animals and other animal products •Cattle and calves •Nursery, greenhouse, floriculture, and sod
Top Commodities by Acreage
•Forage •Tart Cherries •Bees
Agricultural Revenues4 Amount MI top 20 ranking
Total market value of agriculture production $6,397,000 Total crop sales $3,320,000 Total livestock sales $3,077,000
Key Michigan Products
Corn, soy, and wheat 2,160 acres ( 13.51% of cropland) Revenue from corn, soy, and wheat $385,000
Vegetables 104 acres ( .65% of cropland) Revenue from vegetables $
Fruit and tree nuts 35 operations 12 Revenue from fruits, tree nuts, and berries $1,967,000 15
Dairy farms N/A farms Revenue from milk and other dairy N/A
All animal operations 57 operations
Agricultural Land
Total number of farms 181 Total farmland5 20,646 acres
Forage/pasture/non-crop farmland6 4,656 acres Number of farms using certified organic production 5 Number of farms transitioning to organic production 19 Area of greenhouse/nursery operations (sq. ft) n/a

Michigan Food and Agricultural Systems Profiles
Agricultural Chemicals7 Number Percent of MI Total
Fertilizer manufacturers, distributors, and storage facilities 0 0.0 % Pesticide storage facilities 0 0.0 %
Processing and Warehousing
Wholesale food processing plants 22 1.1 % Food warehouses 5 0.45% Controlled atmosphere storage facilities 0 0.0 % Dairy processing plants 0 0.0 % Dairy warehouse, transfer, and truck cleaning facilities 0 0.0 % Slaughter facilities (MDARD licensed) 1 2.04% Meat processing plants (MDARD licensed) 13 0.51% Rendering facilities 0 Commercial feed manufacturing facilities 0 Ethanol plants
Retailing and distribution8
Food service establishments (all) 101 0.32% Retail food establishments 40 0.28% Total amount spent by consumers on food (estimate)8 $48,075,360 0.2 % Emergency food distribution sites9 4 0.19%
Pounds distributed 128,558 0.17% Students eligible for free or reduced school lunch10 1,298 0.18% Households receiving FAP (SNAP) benefits11 2,662 0.14%
Total federal funding for SNAP $4,209,110 0.14% Pet population (estimate) 12 9,545 Port(s) of entry none
Local Distribution13
Farmers’ markets 5 U-pick farms/On-farm markets 0 Farms using community Supported Agriculture 6 1 United States Census Bureau State & County Quick Facts: Michigan, http://quickfacts.census.gov/qfd/states/26000.html 2 Michigan Economic Development Corporation Regional Economic Profiles http://www.michiganbusiness.org/cm/Files/Reports/Regional_Economy/Michigan-Economy-Overview.pdf 3 Michigan Farm Bureau, Treasures of Michigan Agriculture, https://www.michfb.com/MI/Treasures/ 4 USDA 2012 AgCensus Statewide profile http://www.agcensus.usda.gov/Publications/2012/Online_Resources/County_Profiles/Michigan/cp99026.pdf 5 Totals from 2012 USDA AgCensus available from National Agricultural Statistics Service http://quickstats.nass.usda.gov/ 6 Includes non-crop farmland, pasture, and woodland pasture acreage 7 Michigan Department of Agriculture and Rural Development, Annual Reports, http://www.michigan.gov/mdard/0,4610,7-125-2968_4811---,00.html 8 Calculated from US Census estimated households in state with Bureau of Labor Statistics estimate of $6,393/household expenditure for food. 9 Food Bank Council of Michigan, http://www.fbcmich.org/site/DocServer/Michigan_Blueprint_to_End_Hunger_2008_web.pdf?docID=1921 estimates rounded to nearest integer 10 Michigan League for Public Policy, Kids Count in Michigan 2013 overview, http://www.mlpp.org/kids-count/michigan-2/mi-data-book-2013 11 USDA measure for 2013 http://www.fns.usda.gov/pd/supplemental-nutrition-assistance-program-snap 12 From 2012 population estimates (US Census Bureau) formula via Ohio Dept of Ag Animal Emergency Response Plan, 2006. Includes dogs, cats, birds, rabbits, rodents, and turtles. 13 Michigan Agritourism Association http://www.michiganfarmfun.com/index.php?option=com_mtree&Itemid=3

Michigan Food and Agricultural Systems Profiles
BERRIEN
Area1 567.75 square miles Population2 156,781 Largest City St. Joseph Watershed(s) St. Joseph
Top Commodities by Volume of Sales3
•Fruits, tree nuts, and berries •Grains, oilseeds, dry beans, and dry peas •Vegetables, melons, potatoes, and sweet potatoes
•Nursery, greenhouse, floriculture, and sod •Hogs and pigs •Milk and other dairy products from cows
Top Commodities by Acreage
•Corn •Soybeans •Hogs
Agricultural Revenues4 Amount MI top 20 ranking
Total market value of agriculture production $161,542,000 20 Total crop sales $145,902,000 15 Total livestock sales $15,640,000
Key Michigan Products
Corn, soy, and wheat 87,210 acres ( 62.07% of cropland) Revenue from corn, soy, and wheat $64,506,000
Vegetables 16,913 acres ( 12.04% of cropland) 5 Revenue from vegetables $39,949,400 2
Fruit and tree nuts 252 operations 2 Revenue from fruits, tree nuts, and berries $19,825,000 4
Dairy farms 7 farms Revenue from milk and other dairy $13,039,000
All animal operations 201 operations
Agricultural Land
Total number of farms 1,063 19 Total farmland5 156,418 acres
Forage/pasture/non-crop farmland6 15,911 acres Number of farms using certified organic production 10 Number of farms transitioning to organic production 21 Area of greenhouse/nursery operations (sq. ft) 143,083

Michigan Food and Agricultural Systems Profiles
Agricultural Chemicals7 Number Percent of MI Total
Fertilizer manufacturers, distributors, and storage facilities 5 2.62% Pesticide storage facilities 3 2.03%
Processing and Warehousing
Wholesale food processing plants 49 2.45% Food warehouses 24 2.15% Controlled atmosphere storage facilities 3 4.55% Dairy processing plants 1 1.27% Dairy warehouse, transfer, and truck cleaning facilities 1 9.09% Slaughter facilities (MDARD licensed) 1 2.04% Meat processing plants (MDARD licensed) 39 1.54% Rendering facilities 0 Commercial feed manufacturing facilities 0 Ethanol plants
Retailing and distribution8
Food service establishments (all) 589 1.87% Retail food establishments 271 1.89% Total amount spent by consumers on food (estimate)8 $391,801,398 1.6 % Emergency food distribution sites9 79 3.41%
Pounds distributed 971,650 1.26% Students eligible for free or reduced school lunch10 14,377 1.96% Households receiving FAP (SNAP) benefits11 32,662 1.71%
Total federal funding for SNAP $51,644,606 1.71% Pet population (estimate) 12 85,477 Port(s) of entry none
Local Distribution13
Farmers’ markets 7 U-pick farms/On-farm markets 22 Farms using community Supported Agriculture 15 1 United States Census Bureau State & County Quick Facts: Michigan, http://quickfacts.census.gov/qfd/states/26000.html 2 Michigan Economic Development Corporation Regional Economic Profiles http://www.michiganbusiness.org/cm/Files/Reports/Regional_Economy/Michigan-Economy-Overview.pdf 3 Michigan Farm Bureau, Treasures of Michigan Agriculture, https://www.michfb.com/MI/Treasures/ 4 USDA 2012 AgCensus Statewide profile http://www.agcensus.usda.gov/Publications/2012/Online_Resources/County_Profiles/Michigan/cp99026.pdf 5 Totals from 2012 USDA AgCensus available from National Agricultural Statistics Service http://quickstats.nass.usda.gov/ 6 Includes non-crop farmland, pasture, and woodland pasture acreage 7 Michigan Department of Agriculture and Rural Development, Annual Reports, http://www.michigan.gov/mdard/0,4610,7-125-2968_4811---,00.html 8 Calculated from US Census estimated households in state with Bureau of Labor Statistics estimate of $6,393/household expenditure for food. 9 Food Bank Council of Michigan, http://www.fbcmich.org/site/DocServer/Michigan_Blueprint_to_End_Hunger_2008_web.pdf?docID=1921 estimates rounded to nearest integer 10 Michigan League for Public Policy, Kids Count in Michigan 2013 overview, http://www.mlpp.org/kids-count/michigan-2/mi-data-book-2013 11 USDA measure for 2013 http://www.fns.usda.gov/pd/supplemental-nutrition-assistance-program-snap 12 From 2012 population estimates (US Census Bureau) formula via Ohio Dept of Ag Animal Emergency Response Plan, 2006. Includes dogs, cats, birds, rabbits, rodents, and turtles. 13 Michigan Agritourism Association http://www.michiganfarmfun.com/index.php?option=com_mtree&Itemid=3

Michigan Food and Agricultural Systems Profiles
BRANCH
Area1 506.37 square miles Population2 45,175 Largest City Coldwater Watershed(s) St. Joseph
Top Commodities by Volume of Sales3
•Grains, oilseeds, dry beans, and dry peas •Hogs and pigs •Milk and other dairy products from cows •Cattle and calves
Top Commodities by Acreage
•Corn •Soybeans •Broilers
Agricultural Revenues4 Amount MI top 20 ranking
Total market value of agriculture production $175,346,000 17 Total crop sales $125,375,000 19 Total livestock sales $49,971,000 16
Key Michigan Products
Corn, soy, and wheat 166,753 acres ( 74.72% of cropland)
10
Revenue from corn, soy, and wheat $110,449,000 10 Vegetables 5,436 acres ( 2.44% of cropland) 18
Revenue from vegetables $ Fruit and tree nuts 17 operations
Revenue from fruits, tree nuts, and berries $61,000 Dairy farms 30 farms
Revenue from milk and other dairy $6,119,000 All animal operations 328 operations
Agricultural Land
Total number of farms 1,054 20 Total farmland5 244,208 acres 10
Forage/pasture/non-crop farmland6 21,048 acres Number of farms using certified organic production 2 Number of farms transitioning to organic production 0 Area of greenhouse/nursery operations (sq. ft) 6,000

Michigan Food and Agricultural Systems Profiles
Agricultural Chemicals7 Number Percent of MI Total
Fertilizer manufacturers, distributors, and storage facilities 2 1.05% Pesticide storage facilities 2 1.35%
Processing and Warehousing
Wholesale food processing plants 5 0.25% Food warehouses 10 0.9 % Controlled atmosphere storage facilities 0 0.0 % Dairy processing plants 0 0.0 % Dairy warehouse, transfer, and truck cleaning facilities 1 9.09% Slaughter facilities (MDARD licensed) 0 0.0 % Meat processing plants (MDARD licensed) 10 0.39% Rendering facilities 3 Commercial feed manufacturing facilities 0 Ethanol plants
Retailing and distribution8
Food service establishments (all) 141 0.45% Retail food establishments 68 0.48% Total amount spent by consumers on food (estimate)8 $102,518,148 0.42% Emergency food distribution sites9 13 0.56%
Pounds distributed 293,356 0.38% Students eligible for free or reduced school lunch10 3,384 0.46% Households receiving FAP (SNAP) benefits11 8,640 0.45%
Total federal funding for SNAP $13,661,423 0.45% Pet population (estimate) 12 24,629 Port(s) of entry none
Local Distribution13
Farmers’ markets 0 U-pick farms/On-farm markets 0 Farms using community Supported Agriculture 5 1 United States Census Bureau State & County Quick Facts: Michigan, http://quickfacts.census.gov/qfd/states/26000.html 2 Michigan Economic Development Corporation Regional Economic Profiles http://www.michiganbusiness.org/cm/Files/Reports/Regional_Economy/Michigan-Economy-Overview.pdf 3 Michigan Farm Bureau, Treasures of Michigan Agriculture, https://www.michfb.com/MI/Treasures/ 4 USDA 2012 AgCensus Statewide profile http://www.agcensus.usda.gov/Publications/2012/Online_Resources/County_Profiles/Michigan/cp99026.pdf 5 Totals from 2012 USDA AgCensus available from National Agricultural Statistics Service http://quickstats.nass.usda.gov/ 6 Includes non-crop farmland, pasture, and woodland pasture acreage 7 Michigan Department of Agriculture and Rural Development, Annual Reports, http://www.michigan.gov/mdard/0,4610,7-125-2968_4811---,00.html 8 Calculated from US Census estimated households in state with Bureau of Labor Statistics estimate of $6,393/household expenditure for food. 9 Food Bank Council of Michigan, http://www.fbcmich.org/site/DocServer/Michigan_Blueprint_to_End_Hunger_2008_web.pdf?docID=1921 estimates rounded to nearest integer 10 Michigan League for Public Policy, Kids Count in Michigan 2013 overview, http://www.mlpp.org/kids-count/michigan-2/mi-data-book-2013 11 USDA measure for 2013 http://www.fns.usda.gov/pd/supplemental-nutrition-assistance-program-snap 12 From 2012 population estimates (US Census Bureau) formula via Ohio Dept of Ag Animal Emergency Response Plan, 2006. Includes dogs, cats, birds, rabbits, rodents, and turtles. 13 Michigan Agritourism Association http://www.michiganfarmfun.com/index.php?option=com_mtree&Itemid=3

Michigan Food and Agricultural Systems Profiles
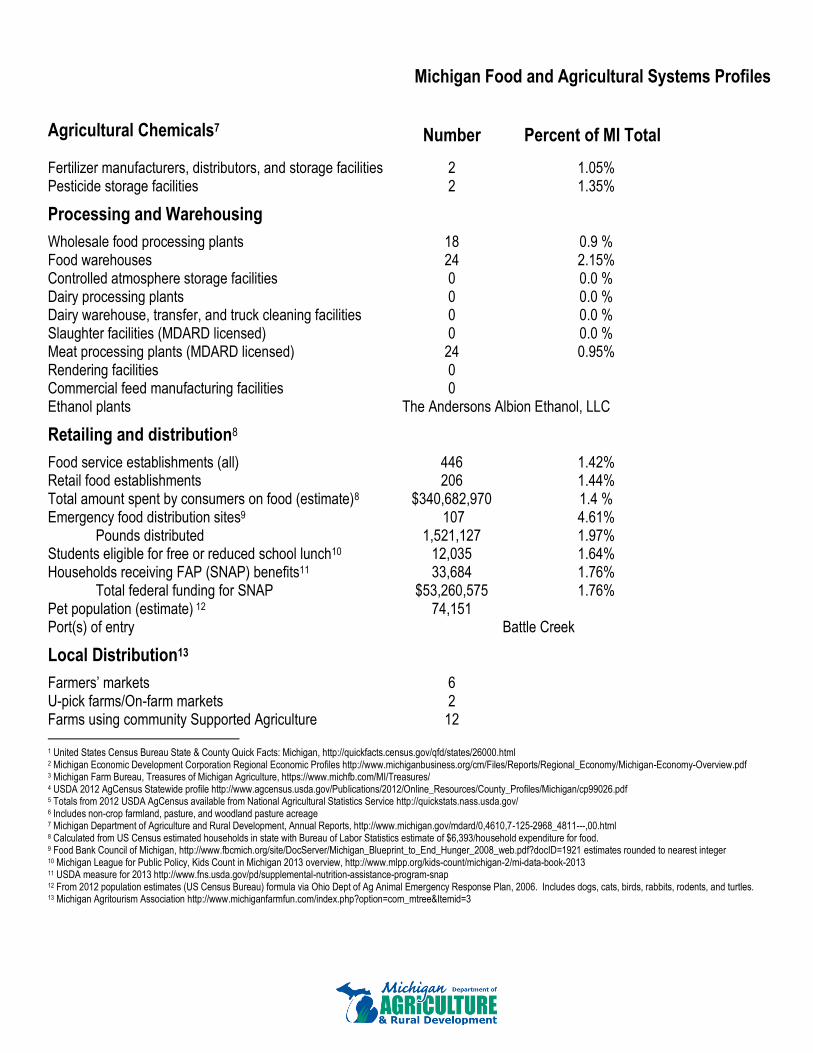
CALHOUN
Area1 706.23 square miles Population2 136,008 Largest City Battle Creek Watershed(s) Kalamazoo, St. Joseph
Top Commodities by Volume of Sales3
•Grains, oilseeds, dry beans, and dry peas •Hogs and pigs •Milk and other dairy products from cows •Cattle and calves, Nursery, greenhouse, floriculture, and sod
Top Commodities by Acreage
•Corn •Soybeans •Hogs
Agricultural Revenues4 Amount MI top 20 ranking
Total market value of agriculture production $133,034,000 Total crop sales $86,006,000 Total livestock sales $47,028,000 20
Key Michigan Products
Corn, soy, and wheat 148,531 acres ( 75.39% of cropland)
16
Revenue from corn, soy, and wheat $75,035,000 Vegetables 378 acres ( .19% of cropland)
Revenue from vegetables $1,909,841 Fruit and tree nuts 17 operations
Revenue from fruits, tree nuts, and berries $288,000 Dairy farms 26 farms
Revenue from milk and other dairy $162,586,000 1 All animal operations 326 operations
Agricultural Land
Total number of farms 1,023 Total farmland5 224,877 acres 13
Forage/pasture/non-crop farmland6 27,860 acres 7 Number of farms using certified organic production 5 Number of farms transitioning to organic production 0 Area of greenhouse/nursery operations (sq. ft) 74,408
Michigan Food and Agricultural Systems Profiles
Agricultural Chemicals7 Number Percent of MI Total
Fertilizer manufacturers, distributors, and storage facilities 2 1.05% Pesticide storage facilities 2 1.35%
Processing and Warehousing
Wholesale food processing plants 18 0.9 % Food warehouses 24 2.15% Controlled atmosphere storage facilities 0 0.0 % Dairy processing plants 0 0.0 % Dairy warehouse, transfer, and truck cleaning facilities 0 0.0 % Slaughter facilities (MDARD licensed) 0 0.0 % Meat processing plants (MDARD licensed) 24 0.95% Rendering facilities 0 Commercial feed manufacturing facilities 0 Ethanol plants The Andersons Albion Ethanol, LLC
Retailing and distribution8
Food service establishments (all) 446 1.42% Retail food establishments 206 1.44% Total amount spent by consumers on food (estimate)8 $340,682,970 1.4 % Emergency food distribution sites9 107 4.61%
Pounds distributed 1,521,127 1.97% Students eligible for free or reduced school lunch10 12,035 1.64% Households receiving FAP (SNAP) benefits11 33,684 1.76%
Total federal funding for SNAP $53,260,575 1.76% Pet population (estimate) 12 74,151 Port(s) of entry Battle Creek
Local Distribution13
Farmers’ markets 6 U-pick farms/On-farm markets 2 Farms using community Supported Agriculture 12 1 United States Census Bureau State & County Quick Facts: Michigan, http://quickfacts.census.gov/qfd/states/26000.html 2 Michigan Economic Development Corporation Regional Economic Profiles http://www.michiganbusiness.org/cm/Files/Reports/Regional_Economy/Michigan-Economy-Overview.pdf 3 Michigan Farm Bureau, Treasures of Michigan Agriculture, https://www.michfb.com/MI/Treasures/ 4 USDA 2012 AgCensus Statewide profile http://www.agcensus.usda.gov/Publications/2012/Online_Resources/County_Profiles/Michigan/cp99026.pdf 5 Totals from 2012 USDA AgCensus available from National Agricultural Statistics Service http://quickstats.nass.usda.gov/ 6 Includes non-crop farmland, pasture, and woodland pasture acreage 7 Michigan Department of Agriculture and Rural Development, Annual Reports, http://www.michigan.gov/mdard/0,4610,7-125-2968_4811---,00.html 8 Calculated from US Census estimated households in state with Bureau of Labor Statistics estimate of $6,393/household expenditure for food. 9 Food Bank Council of Michigan, http://www.fbcmich.org/site/DocServer/Michigan_Blueprint_to_End_Hunger_2008_web.pdf?docID=1921 estimates rounded to nearest integer 10 Michigan League for Public Policy, Kids Count in Michigan 2013 overview, http://www.mlpp.org/kids-count/michigan-2/mi-data-book-2013 11 USDA measure for 2013 http://www.fns.usda.gov/pd/supplemental-nutrition-assistance-program-snap 12 From 2012 population estimates (US Census Bureau) formula via Ohio Dept of Ag Animal Emergency Response Plan, 2006. Includes dogs, cats, birds, rabbits, rodents, and turtles. 13 Michigan Agritourism Association http://www.michiganfarmfun.com/index.php?option=com_mtree&Itemid=3

Michigan Food and Agricultural Systems Profiles
CASS
Area1 490.06 square miles Population2 52,195 Largest City Cassopolis Watershed(s) St. Joseph
Top Commodities by Volume of Sales3
•Hogs and pigs •Grains, oilseeds, dry beans, and dry peas •Vegetables, melons, potatoes, and sweet potatoes
•Fruits, tree nuts, and berries •Nursery, greenhouse, floriculture, and sod •Cattle and calves
Top Commodities by Acreage
•Corn •Soybeans •Hogs
Agricultural Revenues4 Amount MI top 20 ranking
Total market value of agriculture production $187,158,000 16 Total crop sales $125,673,000 18 Total livestock sales $61,485,000 12
Key Michigan Products
Corn, soy, and wheat 125,618 acres ( 74.37% of cropland)
18
Revenue from corn, soy, and wheat $112,825,000 9 Vegetables 7,898 acres ( 4.68% of cropland) 11
Revenue from vegetables $7,905,228 15 Fruit and tree nuts 23 operations 20
Revenue from fruits, tree nuts, and berries N/A Dairy farms 9 farms
Revenue from milk and other dairy $10,360,000 All animal operations 264 operations
Agricultural Land
Total number of farms 798 Total farmland5 188,690 acres 20
Forage/pasture/non-crop farmland6 19,786 acres Number of farms using certified organic production 1 Number of farms transitioning to organic production 27 Area of greenhouse/nursery operations (sq. ft) N/A

Michigan Food and Agricultural Systems Profiles
Agricultural Chemicals7 Number Percent of MI Total
Fertilizer manufacturers, distributors, and storage facilities 3 1.57% Pesticide storage facilities 1 0.68%
Processing and Warehousing
Wholesale food processing plants 8 0.4 % Food warehouses 0 0.0 % Controlled atmosphere storage facilities 0 0.0 % Dairy processing plants 0 0.0 % Dairy warehouse, transfer, and truck cleaning facilities 0 0.0 % Slaughter facilities (MDARD licensed) 3 6.12% Meat processing plants (MDARD licensed) 28 1.1 % Rendering facilities 0 Commercial feed manufacturing facilities 0 Ethanol plants
Retailing and distribution8
Food service establishments (all) 119 0.38% Retail food establishments 59 0.41% Total amount spent by consumers on food (estimate)8 $126,587,793 0.52% Emergency food distribution sites9 9 0.37%
Pounds distributed 221,923 0.29% Students eligible for free or reduced school lunch10 3,892 0.53% Households receiving FAP (SNAP) benefits11 10,368 0.54%
Total federal funding for SNAP $16,393,707 0.54% Pet population (estimate) 12 28,457 Port(s) of entry none
Local Distribution13
Farmers’ markets 1 U-pick farms/On-farm markets 2 Farms using community Supported Agriculture 7 1 United States Census Bureau State & County Quick Facts: Michigan, http://quickfacts.census.gov/qfd/states/26000.html 2 Michigan Economic Development Corporation Regional Economic Profiles http://www.michiganbusiness.org/cm/Files/Reports/Regional_Economy/Michigan-Economy-Overview.pdf 3 Michigan Farm Bureau, Treasures of Michigan Agriculture, https://www.michfb.com/MI/Treasures/ 4 USDA 2012 AgCensus Statewide profile http://www.agcensus.usda.gov/Publications/2012/Online_Resources/County_Profiles/Michigan/cp99026.pdf 5 Totals from 2012 USDA AgCensus available from National Agricultural Statistics Service http://quickstats.nass.usda.gov/ 6 Includes non-crop farmland, pasture, and woodland pasture acreage 7 Michigan Department of Agriculture and Rural Development, Annual Reports, http://www.michigan.gov/mdard/0,4610,7-125-2968_4811---,00.html 8 Calculated from US Census estimated households in state with Bureau of Labor Statistics estimate of $6,393/household expenditure for food. 9 Food Bank Council of Michigan, http://www.fbcmich.org/site/DocServer/Michigan_Blueprint_to_End_Hunger_2008_web.pdf?docID=1921 estimates rounded to nearest integer 10 Michigan League for Public Policy, Kids Count in Michigan 2013 overview, http://www.mlpp.org/kids-count/michigan-2/mi-data-book-2013 11 USDA measure for 2013 http://www.fns.usda.gov/pd/supplemental-nutrition-assistance-program-snap 12 From 2012 population estimates (US Census Bureau) formula via Ohio Dept of Ag Animal Emergency Response Plan, 2006. Includes dogs, cats, birds, rabbits, rodents, and turtles. 13 Michigan Agritourism Association http://www.michiganfarmfun.com/index.php?option=com_mtree&Itemid=3

Michigan Food and Agricultural Systems Profiles
CHARLEVOIX
Area1 416.34 square miles Population2 25,908 Largest City Petosky Watershed(s) Pine
Top Commodities by Volume of Sales3
•Fruits, tree nuts, and berries •Milk and other dairy products from cows •Cattle and calves •Grains, oilseeds, dry beans, and dry peas
•Other crops and hay •Nursery, greenhouse, floriculture, and sod •Other animals and other animal products
Top Commodities by Acreage
•Forage •Corn •Cattle
Agricultural Revenues4 Amount MI top 20 ranking
Total market value of agriculture production $9,917,000 Total crop sales $5,978,000 Total livestock sales $3,939,000
Key Michigan Products
Corn, soy, and wheat 3,811 acres ( 13.14% of cropland) Revenue from corn, soy, and wheat $1,877,000
Vegetables 336 acres ( 1.16% of cropland) Revenue from vegetables $598,000
Fruit and tree nuts 10 operations Revenue from fruits, tree nuts, and berries $1,548,000 17
Dairy farms 7 farms Revenue from milk and other dairy $96,723,000 3
All animal operations 111 operations
Agricultural Land
Total number of farms 297 Total farmland5 37,540 acres
Forage/pasture/non-crop farmland6 8,543 acres Number of farms using certified organic production 0 Number of farms transitioning to organic production 0 Area of greenhouse/nursery operations (sq. ft) N/A

Michigan Food and Agricultural Systems Profiles
Agricultural Chemicals7 Number Percent of MI Total
Fertilizer manufacturers, distributors, and storage facilities 0 0.0 % Pesticide storage facilities 0 0.0 %
Processing and Warehousing
Wholesale food processing plants 18 0.9 % Food warehouses 3 0.27% Controlled atmosphere storage facilities 0 0.0 % Dairy processing plants 0 0.0 % Dairy warehouse, transfer, and truck cleaning facilities 0 0.0 % Slaughter facilities (MDARD licensed) 0 0.0 % Meat processing plants (MDARD licensed) 11 0.43% Rendering facilities 0 Commercial feed manufacturing facilities 0 Ethanol plants
Retailing and distribution8
Food service establishments (all) 168 0.53% Retail food establishments 69 0.48% Total amount spent by consumers on food (estimate)8 $68,398,707 0.28% Emergency food distribution sites9 8 0.34%
Pounds distributed 136,823 0.18% Students eligible for free or reduced school lunch10 1,992 0.27% Households receiving FAP (SNAP) benefits11 3,913 0.2 %
Total federal funding for SNAP $6,187,170 0.2 % Pet population (estimate) 12 14,125 Port(s) of entry none
Local Distribution13
Farmers’ markets 3 U-pick farms/On-farm markets 1 Farms using community Supported Agriculture 1 1 United States Census Bureau State & County Quick Facts: Michigan, http://quickfacts.census.gov/qfd/states/26000.html 2 Michigan Economic Development Corporation Regional Economic Profiles http://www.michiganbusiness.org/cm/Files/Reports/Regional_Economy/Michigan-Economy-Overview.pdf 3 Michigan Farm Bureau, Treasures of Michigan Agriculture, https://www.michfb.com/MI/Treasures/ 4 USDA 2012 AgCensus Statewide profile http://www.agcensus.usda.gov/Publications/2012/Online_Resources/County_Profiles/Michigan/cp99026.pdf 5 Totals from 2012 USDA AgCensus available from National Agricultural Statistics Service http://quickstats.nass.usda.gov/ 6 Includes non-crop farmland, pasture, and woodland pasture acreage 7 Michigan Department of Agriculture and Rural Development, Annual Reports, http://www.michigan.gov/mdard/0,4610,7-125-2968_4811---,00.html 8 Calculated from US Census estimated households in state with Bureau of Labor Statistics estimate of $6,393/household expenditure for food. 9 Food Bank Council of Michigan, http://www.fbcmich.org/site/DocServer/Michigan_Blueprint_to_End_Hunger_2008_web.pdf?docID=1921 estimates rounded to nearest integer 10 Michigan League for Public Policy, Kids Count in Michigan 2013 overview, http://www.mlpp.org/kids-count/michigan-2/mi-data-book-2013 11 USDA measure for 2013 http://www.fns.usda.gov/pd/supplemental-nutrition-assistance-program-snap 12 From 2012 population estimates (US Census Bureau) formula via Ohio Dept of Ag Animal Emergency Response Plan, 2006. Includes dogs, cats, birds, rabbits, rodents, and turtles. 13 Michigan Agritourism Association http://www.michiganfarmfun.com/index.php?option=com_mtree&Itemid=3

Michigan Food and Agricultural Systems Profiles
CHEBOYGAN
Area1 715.26 square miles Population2 26,082 Largest City Cheboygan Watershed(s) Cheboygan
Top Commodities by Volume of Sales3
•Milk and other dairy products from cows •Cattle and calves •Other crops and hay •Nursery, greenhouse, floriculture, and sod •Other animals and other animal products
•Grains, oilseeds, dry beans, and dry peas •Vegetables, melons, potatoes, and sweet potatoes •Poultry and eggs •Horses, ponies, mules, burros, and donkeys
Top Commodities by Acreage
•Forage •Corn •Cattle
Agricultural Revenues4 Amount MI top 20 ranking
Total market value of agriculture production $9,275,000 Total crop sales $5,615,000 Total livestock sales $3,660,000
Key Michigan Products
Corn, soy, and wheat 1,768 acres ( 5.42% of cropland) Revenue from corn, soy, and wheat $556,000
Vegetables 49 acres ( .15% of cropland) Revenue from vegetables $187,000
Fruit and tree nuts 17 operations Revenue from fruits, tree nuts, and berries $3,127,000 14
Dairy farms 5 farms Revenue from milk and other dairy $23,503,000 20
All animal operations 127 operations
Agricultural Land
Total number of farms 313 Total farmland5 45,567 acres
Forage/pasture/non-crop farmland6 12,945 acres Number of farms using certified organic production 1 Number of farms transitioning to organic production 0 Area of greenhouse/nursery operations (sq. ft) n/a

Michigan Food and Agricultural Systems Profiles
Agricultural Chemicals7 Number Percent of MI Total
Fertilizer manufacturers, distributors, and storage facilities 1 0.52% Pesticide storage facilities 0 0.0 %
Processing and Warehousing
Wholesale food processing plants 20 1. % Food warehouses 7 0.63% Controlled atmosphere storage facilities 0 0.0 % Dairy processing plants 0 0.0 % Dairy warehouse, transfer, and truck cleaning facilities 0 0.0 % Slaughter facilities (MDARD licensed) 3 6.12% Meat processing plants (MDARD licensed) 23 0.91% Rendering facilities 0 Commercial feed manufacturing facilities 0 Ethanol plants
Retailing and distribution8
Food service establishments (all) 143 0.45% Retail food establishments 72 0.5 % Total amount spent by consumers on food (estimate)8 $73,257,387 0.3 % Emergency food distribution sites9 5 0.22%
Pounds distributed 145,676 0.19% Students eligible for free or reduced school lunch10 2,031 0.28% Households receiving FAP (SNAP) benefits11 5,339 0.28%
Total federal funding for SNAP $8,441,937 0.28% Pet population (estimate) 12 14,220 Port(s) of entry none
Local Distribution13
Farmers’ markets 2 U-pick farms/On-farm markets 1 Farms using community Supported Agriculture 4 1 United States Census Bureau State & County Quick Facts: Michigan, http://quickfacts.census.gov/qfd/states/26000.html 2 Michigan Economic Development Corporation Regional Economic Profiles http://www.michiganbusiness.org/cm/Files/Reports/Regional_Economy/Michigan-Economy-Overview.pdf 3 Michigan Farm Bureau, Treasures of Michigan Agriculture, https://www.michfb.com/MI/Treasures/ 4 USDA 2012 AgCensus Statewide profile http://www.agcensus.usda.gov/Publications/2012/Online_Resources/County_Profiles/Michigan/cp99026.pdf 5 Totals from 2012 USDA AgCensus available from National Agricultural Statistics Service http://quickstats.nass.usda.gov/ 6 Includes non-crop farmland, pasture, and woodland pasture acreage 7 Michigan Department of Agriculture and Rural Development, Annual Reports, http://www.michigan.gov/mdard/0,4610,7-125-2968_4811---,00.html 8 Calculated from US Census estimated households in state with Bureau of Labor Statistics estimate of $6,393/household expenditure for food. 9 Food Bank Council of Michigan, http://www.fbcmich.org/site/DocServer/Michigan_Blueprint_to_End_Hunger_2008_web.pdf?docID=1921 estimates rounded to nearest integer 10 Michigan League for Public Policy, Kids Count in Michigan 2013 overview, http://www.mlpp.org/kids-count/michigan-2/mi-data-book-2013 11 USDA measure for 2013 http://www.fns.usda.gov/pd/supplemental-nutrition-assistance-program-snap 12 From 2012 population estimates (US Census Bureau) formula via Ohio Dept of Ag Animal Emergency Response Plan, 2006. Includes dogs, cats, birds, rabbits, rodents, and turtles. 13 Michigan Agritourism Association http://www.michiganfarmfun.com/index.php?option=com_mtree&Itemid=3

Michigan Food and Agricultural Systems Profiles
CHIPPEWA
Area1 1,558.42 square miles Population2 38,440 Largest City Sault Ste. Marie Watershed(s) Tahquemenon, Pine, Wiaska, Munuscong, Carp
Top Commodities by Volume of Sales3
•Milk and other dairy products from cows •Other crops and hay •Cattle and calves •Nursery, greenhouse, floriculture, and sod •Grains, oilseeds, dry beans, and dry peas
•Fruits, tree nuts, and berries •Hogs and pigs •Sheep, goats, and their products •Horses, ponies, mules, burros, and donkeys •Aquaculture
Top Commodities by Acreage
•Forage •Oats •Cattle
Agricultural Revenues4 Amount MI top 20 ranking
Total market value of agriculture production $12,566,000 Total crop sales $5,235,000 Total livestock sales $7,331,000
Key Michigan Products
Corn, soy, and wheat 136 acres ( .19% of cropland) Revenue from corn, soy, and wheat $49,000
Vegetables 74 acres ( .10% of cropland) Revenue from vegetables $109,000
Fruit and tree nuts 8 operations Revenue from fruits, tree nuts, and berries $35,000
Dairy farms 11 farms Revenue from milk and other dairy $4,744,000
All animal operations 196 operations
Agricultural Land
Total number of farms 409 Total farmland5 93,032 acres
Forage/pasture/non-crop farmland6 20,744 acres Number of farms using certified organic production 0 Number of farms transitioning to organic production 33 Area of greenhouse/nursery operations (sq. ft) n/a

Michigan Food and Agricultural Systems Profiles
Agricultural Chemicals7 Number Percent of MI Total
Fertilizer manufacturers, distributors, and storage facilities 0 0.0 % Pesticide storage facilities 0 0.0 %
Processing and Warehousing
Wholesale food processing plants 13 0.65% Food warehouses 8 0.72% Controlled atmosphere storage facilities 0 0.0 % Dairy processing plants 0 0.0 % Dairy warehouse, transfer, and truck cleaning facilities 0 0.0 % Slaughter facilities (MDARD licensed) 0 0.0 % Meat processing plants (MDARD licensed) 15 0.59% Rendering facilities 0 Commercial feed manufacturing facilities 0 Ethanol plants
Retailing and distribution8
Food service establishments (all) 175 0.56% Retail food establishments 66 0.46% Total amount spent by consumers on food (estimate)8 $93,734,166 0.38% Emergency food distribution sites9 40 1.74%
Pounds distributed 304,054 0.39% Students eligible for free or reduced school lunch10 2,552 0.35% Households receiving FAP (SNAP) benefits11 6,193 0.32%
Total federal funding for SNAP $9,792,268 0.32% Pet population (estimate) 12 20,957 Port(s) of entry Sault Ste. Marie Bridge (motor and rail)
Local Distribution13
Farmers’ markets 2 U-pick farms/On-farm markets 3 Farms using community Supported Agriculture 4 1 United States Census Bureau State & County Quick Facts: Michigan, http://quickfacts.census.gov/qfd/states/26000.html 2 Michigan Economic Development Corporation Regional Economic Profiles http://www.michiganbusiness.org/cm/Files/Reports/Regional_Economy/Michigan-Economy-Overview.pdf 3 Michigan Farm Bureau, Treasures of Michigan Agriculture, https://www.michfb.com/MI/Treasures/ 4 USDA 2012 AgCensus Statewide profile http://www.agcensus.usda.gov/Publications/2012/Online_Resources/County_Profiles/Michigan/cp99026.pdf 5 Totals from 2012 USDA AgCensus available from National Agricultural Statistics Service http://quickstats.nass.usda.gov/ 6 Includes non-crop farmland, pasture, and woodland pasture acreage 7 Michigan Department of Agriculture and Rural Development, Annual Reports, http://www.michigan.gov/mdard/0,4610,7-125-2968_4811---,00.html 8 Calculated from US Census estimated households in state with Bureau of Labor Statistics estimate of $6,393/household expenditure for food. 9 Food Bank Council of Michigan, http://www.fbcmich.org/site/DocServer/Michigan_Blueprint_to_End_Hunger_2008_web.pdf?docID=1921 estimates rounded to nearest integer 10 Michigan League for Public Policy, Kids Count in Michigan 2013 overview, http://www.mlpp.org/kids-count/michigan-2/mi-data-book-2013 11 USDA measure for 2013 http://www.fns.usda.gov/pd/supplemental-nutrition-assistance-program-snap 12 From 2012 population estimates (US Census Bureau) formula via Ohio Dept of Ag Animal Emergency Response Plan, 2006. Includes dogs, cats, birds, rabbits, rodents, and turtles. 13 Michigan Agritourism Association http://www.michiganfarmfun.com/index.php?option=com_mtree&Itemid=3

Michigan Food and Agricultural Systems Profiles
CLARE
Area1 564.32 square miles Population2 30,995 Largest City Clare Watershed(s) Saginaw, Muskegon
Top Commodities by Volume of Sales3
•Milk and other dairy products from cows •Cattle and calves •Grains, oilseeds, dry beans, and dry peas •Other crops and hay •Hogs and pigs
•Poultry and eggs •Sheep, goats, and their products •Vegetables, melons, potatoes, and sweet potatoes •Fruits, tree nuts, and berries
Top Commodities by Acreage
•Forage •Corn •Cattle
Agricultural Revenues4 Amount MI top 20 ranking
Total market value of agriculture production $20,361,000 Total crop sales $6,172,000 Total livestock sales $14,189,000
Key Michigan Products
Corn, soy, and wheat 8,570 acres ( 19.18% of cropland) Revenue from corn, soy, and wheat $4,124,000
Vegetables 139 acres ( .31% of cropland) Revenue from vegetables $158,438
Fruit and tree nuts 9 operations Revenue from fruits, tree nuts, and berries N/A
Dairy farms 24 farms Revenue from milk and other dairy $11,784,000
All animal operations 226 operations
Agricultural Land
Total number of farms 460 Total farmland5 62,506 acres
Forage/pasture/non-crop farmland6 17,814 acres Number of farms using certified organic production 0 Number of farms transitioning to organic production 0 Area of greenhouse/nursery operations (sq. ft) n/a

Michigan Food and Agricultural Systems Profiles
Agricultural Chemicals7 Number Percent of MI Total
Fertilizer manufacturers, distributors, and storage facilities 0 0.0 % Pesticide storage facilities 0 0.0 %
Processing and Warehousing
Wholesale food processing plants 6 0.3 % Food warehouses 7 0.63% Controlled atmosphere storage facilities 0 0.0 % Dairy processing plants 0 0.0 % Dairy warehouse, transfer, and truck cleaning facilities 0 0.0 % Slaughter facilities (MDARD licensed) 0 0.0 % Meat processing plants (MDARD licensed) 17 0.67% Rendering facilities 0 Commercial feed manufacturing facilities 0 Ethanol plants
Retailing and distribution8
Food service establishments (all) 123 0.39% Retail food establishments 75 0.52% Total amount spent by consumers on food (estimate)8 $85,033,293 0.35% Emergency food distribution sites9 4 0.16%
Pounds distributed 192,300 0.25% Students eligible for free or reduced school lunch10 2,905 0.4 % Households receiving FAP (SNAP) benefits11 8,508 0.44%
Total federal funding for SNAP $13,452,707 0.44% Pet population (estimate) 12 16,898 Port(s) of entry none
Local Distribution13
Farmers’ markets 3 U-pick farms/On-farm markets 0 Farms using community Supported Agriculture 4 1 United States Census Bureau State & County Quick Facts: Michigan, http://quickfacts.census.gov/qfd/states/26000.html 2 Michigan Economic Development Corporation Regional Economic Profiles http://www.michiganbusiness.org/cm/Files/Reports/Regional_Economy/Michigan-Economy-Overview.pdf 3 Michigan Farm Bureau, Treasures of Michigan Agriculture, https://www.michfb.com/MI/Treasures/ 4 USDA 2012 AgCensus Statewide profile http://www.agcensus.usda.gov/Publications/2012/Online_Resources/County_Profiles/Michigan/cp99026.pdf 5 Totals from 2012 USDA AgCensus available from National Agricultural Statistics Service http://quickstats.nass.usda.gov/ 6 Includes non-crop farmland, pasture, and woodland pasture acreage 7 Michigan Department of Agriculture and Rural Development, Annual Reports, http://www.michigan.gov/mdard/0,4610,7-125-2968_4811---,00.html 8 Calculated from US Census estimated households in state with Bureau of Labor Statistics estimate of $6,393/household expenditure for food. 9 Food Bank Council of Michigan, http://www.fbcmich.org/site/DocServer/Michigan_Blueprint_to_End_Hunger_2008_web.pdf?docID=1921 estimates rounded to nearest integer 10 Michigan League for Public Policy, Kids Count in Michigan 2013 overview, http://www.mlpp.org/kids-count/michigan-2/mi-data-book-2013 11 USDA measure for 2013 http://www.fns.usda.gov/pd/supplemental-nutrition-assistance-program-snap 12 From 2012 population estimates (US Census Bureau) formula via Ohio Dept of Ag Animal Emergency Response Plan, 2006. Includes dogs, cats, birds, rabbits, rodents, and turtles. 13 Michigan Agritourism Association http://www.michiganfarmfun.com/index.php?option=com_mtree&Itemid=3

Michigan Food and Agricultural Systems Profiles
CLINTON
Area1 566.41 square miles Population2 75,393 Largest City Lansing (metropolitan area); St. Johns Watershed(s) Grand
Top Commodities by Volume of Sales3
•Milk and other dairy products from cows •Grains, oilseeds, dry beans, and dry peas •Cattle and calves •Other crops and hay •Nursery, greenhouse, floriculture, and sod •Hogs and pigs •Vegetables, melons, potatoes, and sweet potatoes
•Fruits, tree nuts, and berries •Other animals and other animal products •Sheep, goats, and their products •Horses, ponies, mules, burros, and donkeys •Cut Christmas trees and short rotation woody crops •Poultry and eggs
Top Commodities by Acreage
•Corn •Soybeans •Cattle
Agricultural Revenues4 Amount MI top 20 ranking
Total market value of agriculture production $262,630,000 8 Total crop sales $122,553,000 20 Total livestock sales $140,077,000 7
Key Michigan Products
Corn, soy, and wheat 166,021 acres ( 73.62% of cropland)
11
Revenue from corn, soy, and wheat $106,141,000 12 Vegetables 608 acres ( .27% of cropland)
Revenue from vegetables $2,239,371 Fruit and tree nuts 21 operations
Revenue from fruits, tree nuts, and berries $270,000 Dairy farms 66 farms 8
Revenue from milk and other dairy $2,199,000 All animal operations 408 operations 14
Agricultural Land
Total number of farms 1,128 14 Total farmland5 243,815 acres 11
Forage/pasture/non-crop farmland6 18,315 acres Number of farms using certified organic production 20 Number of farms transitioning to organic production 37 Area of greenhouse/nursery operations (sq. ft) N/A

Michigan Food and Agricultural Systems Profiles
Agricultural Chemicals7 Number Percent of MI Total
Fertilizer manufacturers, distributors, and storage facilities 3 1.57% Pesticide storage facilities 1 0.68%
Processing and Warehousing
Wholesale food processing plants 8 0.4 % Food warehouses 6 0.54% Controlled atmosphere storage facilities 0 0.0 % Dairy processing plants 1 1.27% Dairy warehouse, transfer, and truck cleaning facilities 1 9.09% Slaughter facilities (MDARD licensed) 0 0.0 % Meat processing plants (MDARD licensed) 12 0.47% Rendering facilities 0 Commercial feed manufacturing facilities 0 Ethanol plants
Retailing and distribution8
Food service establishments (all) 167 0.53% Retail food establishments 71 0.5 % Total amount spent by consumers on food (estimate)8 $183,108,306 0.75% Emergency food distribution sites9 12 0.51%
Pounds distributed 251,912 0.33% Students eligible for free or reduced school lunch10 2,607 0.36% Households receiving FAP (SNAP) benefits11 7,162 0.37%
Total federal funding for SNAP $11,324,434 0.37% Pet population (estimate) 12 41,104 Port(s) of entry Capital Region International Airport
Local Distribution13
Farmers’ markets 6 U-pick farms/On-farm markets 4 Farms using community Supported Agriculture 8 1 United States Census Bureau State & County Quick Facts: Michigan, http://quickfacts.census.gov/qfd/states/26000.html 2 Michigan Economic Development Corporation Regional Economic Profiles http://www.michiganbusiness.org/cm/Files/Reports/Regional_Economy/Michigan-Economy-Overview.pdf 3 Michigan Farm Bureau, Treasures of Michigan Agriculture, https://www.michfb.com/MI/Treasures/ 4 USDA 2012 AgCensus Statewide profile http://www.agcensus.usda.gov/Publications/2012/Online_Resources/County_Profiles/Michigan/cp99026.pdf 5 Totals from 2012 USDA AgCensus available from National Agricultural Statistics Service http://quickstats.nass.usda.gov/ 6 Includes non-crop farmland, pasture, and woodland pasture acreage 7 Michigan Department of Agriculture and Rural Development, Annual Reports, http://www.michigan.gov/mdard/0,4610,7-125-2968_4811---,00.html 8 Calculated from US Census estimated households in state with Bureau of Labor Statistics estimate of $6,393/household expenditure for food. 9 Food Bank Council of Michigan, http://www.fbcmich.org/site/DocServer/Michigan_Blueprint_to_End_Hunger_2008_web.pdf?docID=1921 estimates rounded to nearest integer 10 Michigan League for Public Policy, Kids Count in Michigan 2013 overview, http://www.mlpp.org/kids-count/michigan-2/mi-data-book-2013 11 USDA measure for 2013 http://www.fns.usda.gov/pd/supplemental-nutrition-assistance-program-snap 12 From 2012 population estimates (US Census Bureau) formula via Ohio Dept of Ag Animal Emergency Response Plan, 2006. Includes dogs, cats, birds, rabbits, rodents, and turtles. 13 Michigan Agritourism Association http://www.michiganfarmfun.com/index.php?option=com_mtree&Itemid=3

Michigan Food and Agricultural Systems Profiles
CRAWFORD
Area1 556.28 square miles Population2 14,043 Largest City Grayling Watershed(s) Au Sable, Manistee
Top Commodities by Volume of Sales3
•Horses, ponies, mules, burros, and donkeys •Sheep, goats, and their products •Nursery, greenhouse, floriculture, and sod •Other crops and hay •Hogs and pigs
Top Commodities by Acreage
•Forage •Christmas Trees •Deer
Agricultural Revenues4 Amount MI top 20 ranking
Total market value of agriculture production $260,000 Total crop sales $70,000 Total livestock sales $190,000
Key Michigan Products
Corn, soy, and wheat 41 acres ( 3.05% of cropland) Revenue from corn, soy, and wheat $15,000
Vegetables 24 acres ( 1.78% of cropland) Revenue from vegetables $10,000
Fruit and tree nuts N/A operations Revenue from fruits, tree nuts, and berries N/A
Dairy farms N/A farms Revenue from milk and other dairy N/A
All animal operations 22 operations
Agricultural Land
Total number of farms 49 Total farmland5 2,755 acres
Forage/pasture/non-crop farmland6 1,409 acres Number of farms using certified organic production 0 Number of farms transitioning to organic production 0 Area of greenhouse/nursery operations (sq. ft) n/a

Michigan Food and Agricultural Systems Profiles
Agricultural Chemicals7 Number Percent of MI Total
Fertilizer manufacturers, distributors, and storage facilities 0 0.0 % Pesticide storage facilities 0 0.0 %
Processing and Warehousing
Wholesale food processing plants 4 0.2 % Food warehouses 2 0.18% Controlled atmosphere storage facilities 0 0.0 % Dairy processing plants 0 0.0 % Dairy warehouse, transfer, and truck cleaning facilities 0 0.0 % Slaughter facilities (MDARD licensed) 0 0.0 % Meat processing plants (MDARD licensed) 6 0.24% Rendering facilities 0 Commercial feed manufacturing facilities 0 Ethanol plants
Retailing and distribution8
Food service establishments (all) 48 0.15% Retail food establishments 29 0.2 % Total amount spent by consumers on food (estimate)8 $37,852,953 0.16% Emergency food distribution sites9 4 0.15%
Pounds distributed 19,758 0.03% Students eligible for free or reduced school lunch10 1,027 0.14% Households receiving FAP (SNAP) benefits11 2,956 0.15%
Total federal funding for SNAP $4,673,978 0.15% Pet population (estimate) 12 7,656 Port(s) of entry none
Local Distribution13
Farmers’ markets 2 U-pick farms/On-farm markets 1 Farms using community Supported Agriculture 1 1 United States Census Bureau State & County Quick Facts: Michigan, http://quickfacts.census.gov/qfd/states/26000.html 2 Michigan Economic Development Corporation Regional Economic Profiles http://www.michiganbusiness.org/cm/Files/Reports/Regional_Economy/Michigan-Economy-Overview.pdf 3 Michigan Farm Bureau, Treasures of Michigan Agriculture, https://www.michfb.com/MI/Treasures/ 4 USDA 2012 AgCensus Statewide profile http://www.agcensus.usda.gov/Publications/2012/Online_Resources/County_Profiles/Michigan/cp99026.pdf 5 Totals from 2012 USDA AgCensus available from National Agricultural Statistics Service http://quickstats.nass.usda.gov/ 6 Includes non-crop farmland, pasture, and woodland pasture acreage 7 Michigan Department of Agriculture and Rural Development, Annual Reports, http://www.michigan.gov/mdard/0,4610,7-125-2968_4811---,00.html 8 Calculated from US Census estimated households in state with Bureau of Labor Statistics estimate of $6,393/household expenditure for food. 9 Food Bank Council of Michigan, http://www.fbcmich.org/site/DocServer/Michigan_Blueprint_to_End_Hunger_2008_web.pdf?docID=1921 estimates rounded to nearest integer 10 Michigan League for Public Policy, Kids Count in Michigan 2013 overview, http://www.mlpp.org/kids-count/michigan-2/mi-data-book-2013 11 USDA measure for 2013 http://www.fns.usda.gov/pd/supplemental-nutrition-assistance-program-snap 12 From 2012 population estimates (US Census Bureau) formula via Ohio Dept of Ag Animal Emergency Response Plan, 2006. Includes dogs, cats, birds, rabbits, rodents, and turtles. 13 Michigan Agritourism Association http://www.michiganfarmfun.com/index.php?option=com_mtree&Itemid=3

Michigan Food and Agricultural Systems Profiles
DELTA
Area1 1,171.10 square miles Population2 37,060 Largest City Escanaba Watershed(s) Sturgeon, Whitefish, Rapid, Days, Escanaba,
Ford
Top Commodities by Volume of Sales3
•Milk and other dairy products from cows •Vegetables, melons, potatoes, and sweet potatoes •Grains, oilseeds, dry beans, and dry peas •Other crops and hay •Nursery, greenhouse, floriculture, and sod
•Hogs and pigs •Horses, ponies, mules, burros, and donkeys •Poultry and eggs •Sheep, goats, and their products
Top Commodities by Acreage
•Forage •Corn •Mink
Agricultural Revenues4 Amount MI top 20 ranking
Total market value of agriculture production $14,966,000 Total crop sales $7,632,000 Total livestock sales $7,334,000
Key Michigan Products
Corn, soy, and wheat 3,935 acres ( 7.20% of cropland) Revenue from corn, soy, and wheat $1,762,000
Vegetables 889 acres ( 1.63% of cropland) Revenue from vegetables $2,411,000
Fruit and tree nuts 11 operations Revenue from fruits, tree nuts, and berries N/A
Dairy farms 22 farms Revenue from milk and other dairy $8,145,000
All animal operations 126 operations
Agricultural Land
Total number of farms 283 Total farmland5 70,832 acres
Forage/pasture/non-crop farmland6 16,166 acres Number of farms using certified organic production 2 Number of farms transitioning to organic production 0 Area of greenhouse/nursery operations (sq. ft) n/a

Michigan Food and Agricultural Systems Profiles
Agricultural Chemicals7 Number Percent of MI Total
Fertilizer manufacturers, distributors, and storage facilities 1 0.52% Pesticide storage facilities 0 0.0 %
Processing and Warehousing
Wholesale food processing plants 16 0.8 % Food warehouses 7 0.63% Controlled atmosphere storage facilities 0 0.0 % Dairy processing plants 0 0.0 % Dairy warehouse, transfer, and truck cleaning facilities 0 0.0 % Slaughter facilities (MDARD licensed) 0 0.0 % Meat processing plants (MDARD licensed) 20 0.79% Rendering facilities 0 Commercial feed manufacturing facilities 0 Ethanol plants
Retailing and distribution8
Food service establishments (all) 162 0.51% Retail food establishments 60 0.42% Total amount spent by consumers on food (estimate)8 $102,741,903 0.42% Emergency food distribution sites9 8 0.36%
Pounds distributed 49,509 0.06% Students eligible for free or reduced school lunch10 2,658 0.36% Households receiving FAP (SNAP) benefits11 6,628 0.35%
Total federal funding for SNAP $10,480,082 0.35% Pet population (estimate) 12 20,205 Port(s) of entry none
Local Distribution13
Farmers’ markets 1 U-pick farms/On-farm markets 5 Farms using community Supported Agriculture 0 1 United States Census Bureau State & County Quick Facts: Michigan, http://quickfacts.census.gov/qfd/states/26000.html 2 Michigan Economic Development Corporation Regional Economic Profiles http://www.michiganbusiness.org/cm/Files/Reports/Regional_Economy/Michigan-Economy-Overview.pdf 3 Michigan Farm Bureau, Treasures of Michigan Agriculture, https://www.michfb.com/MI/Treasures/ 4 USDA 2012 AgCensus Statewide profile http://www.agcensus.usda.gov/Publications/2012/Online_Resources/County_Profiles/Michigan/cp99026.pdf 5 Totals from 2012 USDA AgCensus available from National Agricultural Statistics Service http://quickstats.nass.usda.gov/ 6 Includes non-crop farmland, pasture, and woodland pasture acreage 7 Michigan Department of Agriculture and Rural Development, Annual Reports, http://www.michigan.gov/mdard/0,4610,7-125-2968_4811---,00.html 8 Calculated from US Census estimated households in state with Bureau of Labor Statistics estimate of $6,393/household expenditure for food. 9 Food Bank Council of Michigan, http://www.fbcmich.org/site/DocServer/Michigan_Blueprint_to_End_Hunger_2008_web.pdf?docID=1921 estimates rounded to nearest integer 10 Michigan League for Public Policy, Kids Count in Michigan 2013 overview, http://www.mlpp.org/kids-count/michigan-2/mi-data-book-2013 11 USDA measure for 2013 http://www.fns.usda.gov/pd/supplemental-nutrition-assistance-program-snap 12 From 2012 population estimates (US Census Bureau) formula via Ohio Dept of Ag Animal Emergency Response Plan, 2006. Includes dogs, cats, birds, rabbits, rodents, and turtles. 13 Michigan Agritourism Association http://www.michiganfarmfun.com/index.php?option=com_mtree&Itemid=3

Michigan Food and Agricultural Systems Profiles
DICKINSON
Area1 761.40 square miles Population2 26,158 Largest City Iron Mountain Watershed(s) Menominee, Escanaba, Ford
Top Commodities by Volume of Sales3
•Milk and other dairy products from cows •Vegetables, melons, potatoes, and sweet potatoes •Cattle and calves •Grains, oilseeds, dry beans, and dry peas •Other animals and other animal products
•Horses, ponies, mules, burros, and donkeys •Hogs and pigs •Fruits, tree nuts, and berries •Sheep, goats, and their products
Top Commodities by Acreage
•Forage •Corn •Cattle
Agricultural Revenues4 Amount MI top 20 ranking
Total market value of agriculture production $5,631,000 Total crop sales $2,904,000 Total livestock sales $2,727,000
Key Michigan Products
Corn, soy, and wheat 1,613 acres ( 6.81% of cropland) Revenue from corn, soy, and wheat $607,000
Vegetables 501 acres ( 2.12% of cropland) Revenue from vegetables $1,502,000
Fruit and tree nuts 9 operations Revenue from fruits, tree nuts, and berries $44,000
Dairy farms 6 farms Revenue from milk and other dairy $2,717,000
All animal operations 70 operations
Agricultural Land
Total number of farms 162 Total farmland5 28,614 acres
Forage/pasture/non-crop farmland6 4,944 acres Number of farms using certified organic production 0 Number of farms transitioning to organic production 0 Area of greenhouse/nursery operations (sq. ft) n/a

Michigan Food and Agricultural Systems Profiles
Agricultural Chemicals7 Number Percent of MI Total
Fertilizer manufacturers, distributors, and storage facilities 0 0.0 % Pesticide storage facilities 0 0.0 %
Processing and Warehousing
Wholesale food processing plants 6 0.3 % Food warehouses 10 0.9 % Controlled atmosphere storage facilities 0 0.0 % Dairy processing plants 0 0.0 % Dairy warehouse, transfer, and truck cleaning facilities 0 0.0 % Slaughter facilities (MDARD licensed) 0 0.0 % Meat processing plants (MDARD licensed) 11 0.43% Rendering facilities 0 Commercial feed manufacturing facilities 0 Ethanol plants
Retailing and distribution8
Food service establishments (all) 136 0.43% Retail food establishments 40 0.28% Total amount spent by consumers on food (estimate)8 $72,381,546 0.3 % Emergency food distribution sites9 11 0.47%
Pounds distributed 168,128 0.22% Students eligible for free or reduced school lunch10 1,626 0.22% Households receiving FAP (SNAP) benefits11 3,741 0.2 %
Total federal funding for SNAP $5,915,206 0.2 % Pet population (estimate) 12 14,261 Port(s) of entry none
Local Distribution13
Farmers’ markets 2 U-pick farms/On-farm markets 0 Farms using community Supported Agriculture 0 1 United States Census Bureau State & County Quick Facts: Michigan, http://quickfacts.census.gov/qfd/states/26000.html 2 Michigan Economic Development Corporation Regional Economic Profiles http://www.michiganbusiness.org/cm/Files/Reports/Regional_Economy/Michigan-Economy-Overview.pdf 3 Michigan Farm Bureau, Treasures of Michigan Agriculture, https://www.michfb.com/MI/Treasures/ 4 USDA 2012 AgCensus Statewide profile http://www.agcensus.usda.gov/Publications/2012/Online_Resources/County_Profiles/Michigan/cp99026.pdf 5 Totals from 2012 USDA AgCensus available from National Agricultural Statistics Service http://quickstats.nass.usda.gov/ 6 Includes non-crop farmland, pasture, and woodland pasture acreage 7 Michigan Department of Agriculture and Rural Development, Annual Reports, http://www.michigan.gov/mdard/0,4610,7-125-2968_4811---,00.html 8 Calculated from US Census estimated households in state with Bureau of Labor Statistics estimate of $6,393/household expenditure for food. 9 Food Bank Council of Michigan, http://www.fbcmich.org/site/DocServer/Michigan_Blueprint_to_End_Hunger_2008_web.pdf?docID=1921 estimates rounded to nearest integer 10 Michigan League for Public Policy, Kids Count in Michigan 2013 overview, http://www.mlpp.org/kids-count/michigan-2/mi-data-book-2013 11 USDA measure for 2013 http://www.fns.usda.gov/pd/supplemental-nutrition-assistance-program-snap 12 From 2012 population estimates (US Census Bureau) formula via Ohio Dept of Ag Animal Emergency Response Plan, 2006. Includes dogs, cats, birds, rabbits, rodents, and turtles. 13 Michigan Agritourism Association http://www.michiganfarmfun.com/index.php?option=com_mtree&Itemid=3

Michigan Food and Agricultural Systems Profiles
EATON
Area1 575.18 square miles Population2 107,847 Largest City Lansing (metropolitan area); Charlotte Watershed(s) Grand, Kalamazoo
Top Commodities by Volume of Sales3
•Grains, oilseeds, dry beans, and dry peas •Milk and other dairy products from cows •Cattle and calves •Vegetables, melons, potatoes, and sweet potatoes •Nursery, greenhouse, floriculture, and sod •Other crops and hay
•Hogs and pigs •Horses, ponies, mules, burros, and donkeys •Fruits, tree nuts, and berries •Cut Christmas trees and short rotation woody crops •Sheep, goats, and their products •Poultry and eggs
Top Commodities by Acreage
•Corn •Soybeans •Cattle
Agricultural Revenues4 Amount MI top 20 ranking
Total market value of agriculture production $119,049,000 Total crop sales $99,774,000 Total livestock sales $19,275,000
Key Michigan Products
Corn, soy, and wheat 151,612 acres ( 75.99% of cropland)
15
Revenue from corn, soy, and wheat $94,040,000 16 Vegetables 614 acres ( .31% of cropland)
Revenue from vegetables $2,283,260 Fruit and tree nuts 4 operations
Revenue from fruits, tree nuts, and berries $3,000 Dairy farms 37 farms
Revenue from milk and other dairy $25,522,000 17 All animal operations 411 operations 13
Agricultural Land
Total number of farms 1,163 10 Total farmland5 223,239 acres 15
Forage/pasture/non-crop farmland6 23,722 acres 15 Number of farms using certified organic production 6 Number of farms transitioning to organic production 45 Area of greenhouse/nursery operations (sq. ft) 21,000

Michigan Food and Agricultural Systems Profiles
Agricultural Chemicals7 Number Percent of MI Total
Fertilizer manufacturers, distributors, and storage facilities 6 3.14% Pesticide storage facilities 5 3.38%
Processing and Warehousing
Wholesale food processing plants 28 1.4 % Food warehouses 17 1.52% Controlled atmosphere storage facilities 0 0.0 % Dairy processing plants 1 1.27% Dairy warehouse, transfer, and truck cleaning facilities 0 0.0 % Slaughter facilities (MDARD licensed) 0 0.0 % Meat processing plants (MDARD licensed) 14 0.55% Rendering facilities 0 Commercial feed manufacturing facilities 0 Ethanol plants
Retailing and distribution8
Food service establishments (all) 334 1.06% Retail food establishments 140 0.98% Total amount spent by consumers on food (estimate)8 $276,816,900 1.13% Emergency food distribution sites9 19 0.8 %
Pounds distributed 484,650 0.63% Students eligible for free or reduced school lunch10 6,000 0.82% Households receiving FAP (SNAP) benefits11 14,008 0.73%
Total federal funding for SNAP $22,149,214 0.73% Pet population (estimate) 12 58,798 Port(s) of entry none
Local Distribution13
Farmers’ markets 5 U-pick farms/On-farm markets 1 Farms using community Supported Agriculture 12 1 United States Census Bureau State & County Quick Facts: Michigan, http://quickfacts.census.gov/qfd/states/26000.html 2 Michigan Economic Development Corporation Regional Economic Profiles http://www.michiganbusiness.org/cm/Files/Reports/Regional_Economy/Michigan-Economy-Overview.pdf 3 Michigan Farm Bureau, Treasures of Michigan Agriculture, https://www.michfb.com/MI/Treasures/ 4 USDA 2012 AgCensus Statewide profile http://www.agcensus.usda.gov/Publications/2012/Online_Resources/County_Profiles/Michigan/cp99026.pdf 5 Totals from 2012 USDA AgCensus available from National Agricultural Statistics Service http://quickstats.nass.usda.gov/ 6 Includes non-crop farmland, pasture, and woodland pasture acreage 7 Michigan Department of Agriculture and Rural Development, Annual Reports, http://www.michigan.gov/mdard/0,4610,7-125-2968_4811---,00.html 8 Calculated from US Census estimated households in state with Bureau of Labor Statistics estimate of $6,393/household expenditure for food. 9 Food Bank Council of Michigan, http://www.fbcmich.org/site/DocServer/Michigan_Blueprint_to_End_Hunger_2008_web.pdf?docID=1921 estimates rounded to nearest integer 10 Michigan League for Public Policy, Kids Count in Michigan 2013 overview, http://www.mlpp.org/kids-count/michigan-2/mi-data-book-2013 11 USDA measure for 2013 http://www.fns.usda.gov/pd/supplemental-nutrition-assistance-program-snap 12 From 2012 population estimates (US Census Bureau) formula via Ohio Dept of Ag Animal Emergency Response Plan, 2006. Includes dogs, cats, birds, rabbits, rodents, and turtles. 13 Michigan Agritourism Association http://www.michiganfarmfun.com/index.php?option=com_mtree&Itemid=3

Michigan Food and Agricultural Systems Profiles
EMMET
Area1 467.49 square miles Population2 32,660 Largest City Petosky Watershed(s) Cheboygan
Top Commodities by Volume of Sales3
•Milk and other dairy products from cows •Cattle and calves •Other crops and hay •Nursery, greenhouse, floriculture, and sod •Grains, oilseeds, dry beans, and dry peas
•Vegetables, melons, potatoes, and sweet potatoes •Horses, ponies, mules, burros, and donkeys •Hogs and pigs •Other animals and other animal products •Sheep, goats, and their products
Top Commodities by Acreage
•Forage •Corn •Cattle
Agricultural Revenues4 Amount MI top 20 ranking
Total market value of agriculture production $6,724,000 Total crop sales $4,444,000 Total livestock sales $2,280,000
Key Michigan Products
Corn, soy, and wheat 1,712 acres ( 6.29% of cropland) Revenue from corn, soy, and wheat $637,000
Vegetables 467 acres ( 1.72% of cropland) Revenue from vegetables $1,239,836
Fruit and tree nuts 7 operations Revenue from fruits, tree nuts, and berries $27,000
Dairy farms 5 farms Revenue from milk and other dairy $3,497,000
All animal operations 146 operations
Agricultural Land
Total number of farms 287 Total farmland5 39,805 acres
Forage/pasture/non-crop farmland6 12,578 acres Number of farms using certified organic production 2 Number of farms transitioning to organic production 47 Area of greenhouse/nursery operations (sq. ft) N/A

Michigan Food and Agricultural Systems Profiles
Agricultural Chemicals7 Number Percent of MI Total
Fertilizer manufacturers, distributors, and storage facilities 0 0.0 % Pesticide storage facilities 0 0.0 %
Processing and Warehousing
Wholesale food processing plants 30 1.5 % Food warehouses 12 1.08% Controlled atmosphere storage facilities 0 0.0 % Dairy processing plants 0 0.0 % Dairy warehouse, transfer, and truck cleaning facilities 0 0.0 % Slaughter facilities (MDARD licensed) 0 0.0 % Meat processing plants (MDARD licensed) 32 1.26% Rendering facilities 0 Commercial feed manufacturing facilities 0 Ethanol plants
Retailing and distribution8
Food service establishments (all) 2 0.01% Retail food establishments 95 0.66% Total amount spent by consumers on food (estimate)8 $86,567,613 0.35% Emergency food distribution sites9 15 0.64%
Pounds distributed 529,079 0.68% Students eligible for free or reduced school lunch10 1,977 0.27% Households receiving FAP (SNAP) benefits11 4,895 0.26%
Total federal funding for SNAP $7,739,892 0.26% Pet population (estimate) 12 17,806 Port(s) of entry none
Local Distribution13
Farmers’ markets 3 U-pick farms/On-farm markets 1 Farms using community Supported Agriculture 4 1 United States Census Bureau State & County Quick Facts: Michigan, http://quickfacts.census.gov/qfd/states/26000.html 2 Michigan Economic Development Corporation Regional Economic Profiles http://www.michiganbusiness.org/cm/Files/Reports/Regional_Economy/Michigan-Economy-Overview.pdf 3 Michigan Farm Bureau, Treasures of Michigan Agriculture, https://www.michfb.com/MI/Treasures/ 4 USDA 2012 AgCensus Statewide profile http://www.agcensus.usda.gov/Publications/2012/Online_Resources/County_Profiles/Michigan/cp99026.pdf 5 Totals from 2012 USDA AgCensus available from National Agricultural Statistics Service http://quickstats.nass.usda.gov/ 6 Includes non-crop farmland, pasture, and woodland pasture acreage 7 Michigan Department of Agriculture and Rural Development, Annual Reports, http://www.michigan.gov/mdard/0,4610,7-125-2968_4811---,00.html 8 Calculated from US Census estimated households in state with Bureau of Labor Statistics estimate of $6,393/household expenditure for food. 9 Food Bank Council of Michigan, http://www.fbcmich.org/site/DocServer/Michigan_Blueprint_to_End_Hunger_2008_web.pdf?docID=1921 estimates rounded to nearest integer 10 Michigan League for Public Policy, Kids Count in Michigan 2013 overview, http://www.mlpp.org/kids-count/michigan-2/mi-data-book-2013 11 USDA measure for 2013 http://www.fns.usda.gov/pd/supplemental-nutrition-assistance-program-snap 12 From 2012 population estimates (US Census Bureau) formula via Ohio Dept of Ag Animal Emergency Response Plan, 2006. Includes dogs, cats, birds, rabbits, rodents, and turtles. 13 Michigan Agritourism Association http://www.michiganfarmfun.com/index.php?option=com_mtree&Itemid=3

Michigan Food and Agricultural Systems Profiles
GENESEE
Area1 636.98 square miles Population2 424,969 Largest City Flint Watershed(s) Saginaw
Top Commodities by Volume of Sales3
•Grains, oilseeds, dry beans, and dry peas •Nursery, greenhouse, floriculture, and sod •Milk and other dairy products from cows •Cattle and calves •Other crops and hay •Fruits, tree nuts, and berries •Vegetables, melons, potatoes, and sweet potatoes
•Other animals and other animal products •Horses, ponies, mules, burros, and donkeys •Cut Christmas trees and short rotation woody crops •Hogs and pigs •Poultry and eggs •Sheep, goats, and their products •Aquaculture
Top Commodities by Acreage
•Soybeans •Corn •Cattle
Agricultural Revenues4 Amount MI top 20 ranking
Total market value of agriculture production $91,340,000 Total crop sales $81,039,000 Total livestock sales $10,301,000
Key Michigan Products
Corn, soy, and wheat 80,123 acres ( 72.92% of cropland) Revenue from corn, soy, and wheat $52,211,000
Vegetables 573 acres ( .52% of cropland) Revenue from vegetables $2,500,278
Fruit and tree nuts 13 operations Revenue from fruits, tree nuts, and berries $242,000
Dairy farms 14 farms Revenue from milk and other dairy (D)
All animal operations 282 operations
Agricultural Land
Total number of farms 835 Total farmland5 123,276 acres
Forage/pasture/non-crop farmland6 13,394 acres Number of farms using certified organic production 6 Number of farms transitioning to organic production 49 Area of greenhouse/nursery operations (sq. ft) 13,210
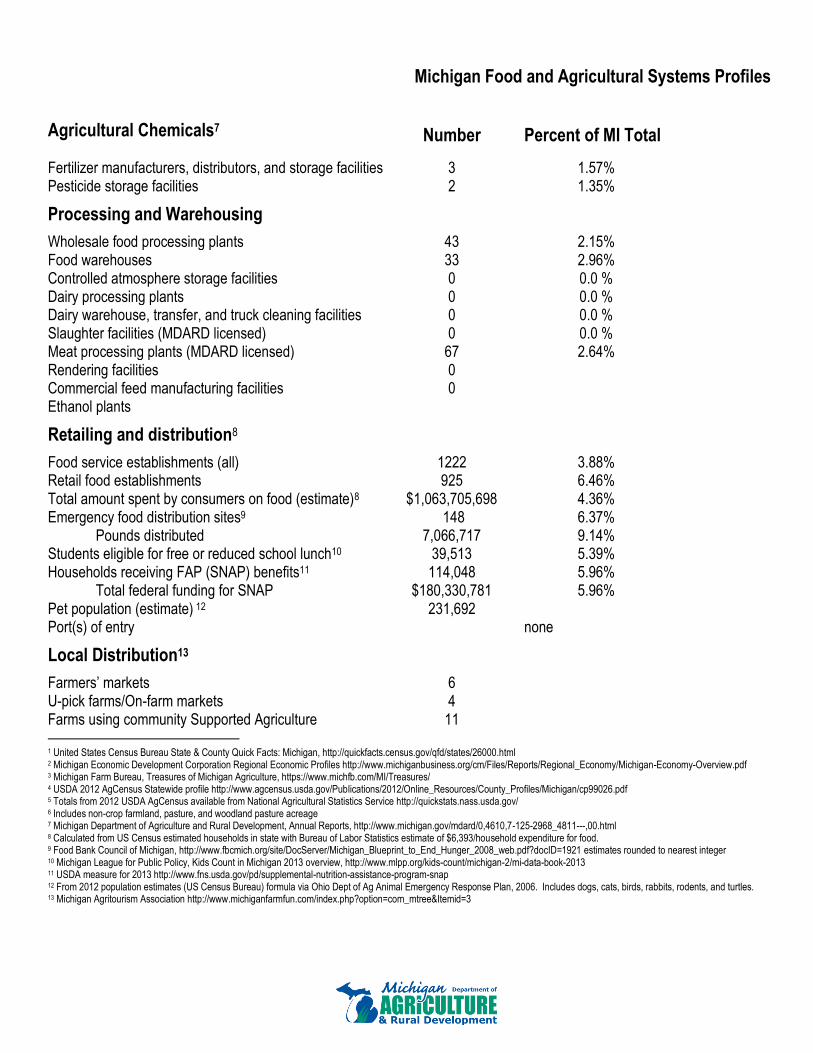
Michigan Food and Agricultural Systems Profiles
Agricultural Chemicals7 Number Percent of MI Total
Fertilizer manufacturers, distributors, and storage facilities 3 1.57% Pesticide storage facilities 2 1.35%
Processing and Warehousing
Wholesale food processing plants 43 2.15% Food warehouses 33 2.96% Controlled atmosphere storage facilities 0 0.0 % Dairy processing plants 0 0.0 % Dairy warehouse, transfer, and truck cleaning facilities 0 0.0 % Slaughter facilities (MDARD licensed) 0 0.0 % Meat processing plants (MDARD licensed) 67 2.64% Rendering facilities 0 Commercial feed manufacturing facilities 0 Ethanol plants
Retailing and distribution8
Food service establishments (all) 1222 3.88% Retail food establishments 925 6.46% Total amount spent by consumers on food (estimate)8 $1,063,705,698 4.36% Emergency food distribution sites9 148 6.37%
Pounds distributed 7,066,717 9.14% Students eligible for free or reduced school lunch10 39,513 5.39% Households receiving FAP (SNAP) benefits11 114,048 5.96%
Total federal funding for SNAP $180,330,781 5.96% Pet population (estimate) 12 231,692 Port(s) of entry none
Local Distribution13
Farmers’ markets 6 U-pick farms/On-farm markets 4 Farms using community Supported Agriculture 11 1 United States Census Bureau State & County Quick Facts: Michigan, http://quickfacts.census.gov/qfd/states/26000.html 2 Michigan Economic Development Corporation Regional Economic Profiles http://www.michiganbusiness.org/cm/Files/Reports/Regional_Economy/Michigan-Economy-Overview.pdf 3 Michigan Farm Bureau, Treasures of Michigan Agriculture, https://www.michfb.com/MI/Treasures/ 4 USDA 2012 AgCensus Statewide profile http://www.agcensus.usda.gov/Publications/2012/Online_Resources/County_Profiles/Michigan/cp99026.pdf 5 Totals from 2012 USDA AgCensus available from National Agricultural Statistics Service http://quickstats.nass.usda.gov/ 6 Includes non-crop farmland, pasture, and woodland pasture acreage 7 Michigan Department of Agriculture and Rural Development, Annual Reports, http://www.michigan.gov/mdard/0,4610,7-125-2968_4811---,00.html 8 Calculated from US Census estimated households in state with Bureau of Labor Statistics estimate of $6,393/household expenditure for food. 9 Food Bank Council of Michigan, http://www.fbcmich.org/site/DocServer/Michigan_Blueprint_to_End_Hunger_2008_web.pdf?docID=1921 estimates rounded to nearest integer 10 Michigan League for Public Policy, Kids Count in Michigan 2013 overview, http://www.mlpp.org/kids-count/michigan-2/mi-data-book-2013 11 USDA measure for 2013 http://www.fns.usda.gov/pd/supplemental-nutrition-assistance-program-snap 12 From 2012 population estimates (US Census Bureau) formula via Ohio Dept of Ag Animal Emergency Response Plan, 2006. Includes dogs, cats, birds, rabbits, rodents, and turtles. 13 Michigan Agritourism Association http://www.michiganfarmfun.com/index.php?option=com_mtree&Itemid=3

Michigan Food and Agricultural Systems Profiles
GLADWIN
Area1 501.78 square miles Population2 25,720 Largest City Gladwin Watershed(s) Saginaw, Kawkawlin
Top Commodities by Volume of Sales3
•Grains, oilseeds, dry beans, and dry peas •Milk and other dairy products from cows •Other crops and hay •Cattle and calves •Other animals and other animal products •Vegetables, melons, potatoes, and sweet potatoes
•Sheep, goats, and their products •Hogs and pigs •Nursery, greenhouse, floriculture, and sod •Horses, ponies, mules, burros, and donkeys •Poultry and eggs •Fruits, tree nuts, and berries •Cut Christmas trees and short rotation woody crops
Top Commodities by Acreage
•Forage •Corn •Cattle
Agricultural Revenues4 Amount MI top 20 ranking
Total market value of agriculture production $19,347,000 Total crop sales $13,658,000 Total livestock sales $5,689,000
Key Michigan Products
Corn, soy, and wheat 14,588 acres ( 27.54% of cropland) Revenue from corn, soy, and wheat $9,133,000
Vegetables 523 acres ( .99% of cropland) Revenue from vegetables $723,000
Fruit and tree nuts 9 operations Revenue from fruits, tree nuts, and berries N/A
Dairy farms 37 farms 20 Revenue from milk and other dairy $3,668,000
All animal operations 250 operations
Agricultural Land
Total number of farms 533 Total farmland5 67,150 acres
Forage/pasture/non-crop farmland6 14,176 acres Number of farms using certified organic production 2 Number of farms transitioning to organic production 51 Area of greenhouse/nursery operations (sq. ft) N/A

Michigan Food and Agricultural Systems Profiles
Agricultural Chemicals7 Number Percent of MI Total
Fertilizer manufacturers, distributors, and storage facilities 1 0.52% Pesticide storage facilities 0 0.0 %
Processing and Warehousing
Wholesale food processing plants 1 0.05% Food warehouses 0 0.0 % Controlled atmosphere storage facilities 0 0.0 % Dairy processing plants 1 1.27% Dairy warehouse, transfer, and truck cleaning facilities 0 0.0 % Slaughter facilities (MDARD licensed) 1 2.04% Meat processing plants (MDARD licensed) 11 0.43% Rendering facilities 0 Commercial feed manufacturing facilities 0 Ethanol plants
Retailing and distribution8
Food service establishments (all) 86 0.27% Retail food establishments 47 0.33% Total amount spent by consumers on food (estimate)8 $71,032,623 0.29% Emergency food distribution sites9 3 0.11%
Pounds distributed 271,063 0.35% Students eligible for free or reduced school lunch10 1,963 0.27% Households receiving FAP (SNAP) benefits11 5,533 0.29%
Total federal funding for SNAP $8,748,687 0.29% Pet population (estimate) 12 14,022 Port(s) of entry none
Local Distribution13
Farmers’ markets 1 U-pick farms/On-farm markets 2 Farms using community Supported Agriculture 0 1 United States Census Bureau State & County Quick Facts: Michigan, http://quickfacts.census.gov/qfd/states/26000.html 2 Michigan Economic Development Corporation Regional Economic Profiles http://www.michiganbusiness.org/cm/Files/Reports/Regional_Economy/Michigan-Economy-Overview.pdf 3 Michigan Farm Bureau, Treasures of Michigan Agriculture, https://www.michfb.com/MI/Treasures/ 4 USDA 2012 AgCensus Statewide profile http://www.agcensus.usda.gov/Publications/2012/Online_Resources/County_Profiles/Michigan/cp99026.pdf 5 Totals from 2012 USDA AgCensus available from National Agricultural Statistics Service http://quickstats.nass.usda.gov/ 6 Includes non-crop farmland, pasture, and woodland pasture acreage 7 Michigan Department of Agriculture and Rural Development, Annual Reports, http://www.michigan.gov/mdard/0,4610,7-125-2968_4811---,00.html 8 Calculated from US Census estimated households in state with Bureau of Labor Statistics estimate of $6,393/household expenditure for food. 9 Food Bank Council of Michigan, http://www.fbcmich.org/site/DocServer/Michigan_Blueprint_to_End_Hunger_2008_web.pdf?docID=1921 estimates rounded to nearest integer 10 Michigan League for Public Policy, Kids Count in Michigan 2013 overview, http://www.mlpp.org/kids-count/michigan-2/mi-data-book-2013 11 USDA measure for 2013 http://www.fns.usda.gov/pd/supplemental-nutrition-assistance-program-snap 12 From 2012 population estimates (US Census Bureau) formula via Ohio Dept of Ag Animal Emergency Response Plan, 2006. Includes dogs, cats, birds, rabbits, rodents, and turtles. 13 Michigan Agritourism Association http://www.michiganfarmfun.com/index.php?option=com_mtree&Itemid=3

Michigan Food and Agricultural Systems Profiles
GOGEBIC
Area1 1,101.85 square miles Population2 16,394 Largest City Ironwood Watershed(s) Ontonagon, Black, Presque Isle, Montreal
Top Commodities by Volume of Sales3
•Cattle and calves •Hogs and pigs •Grains, oilseeds, dry beans, and dry peas
Top Commodities by Acreage
•Forage •Christmas Trees •Cattle
Agricultural Revenues4 Amount MI top 20 ranking
Total market value of agriculture production $497,000 Total crop sales $362,000 Total livestock sales $135,000
Key Michigan Products
Corn, soy, and wheat 44 acres ( .98% of cropland) Revenue from corn, soy, and wheat $30,000
Vegetables acres ( .00% of cropland) Revenue from vegetables $
Fruit and tree nuts 2 operations Revenue from fruits, tree nuts, and berries N/A
Dairy farms N/A farms Revenue from milk and other dairy N/A
All animal operations 24 operations
Agricultural Land
Total number of farms 62 Total farmland5 6,078 acres
Forage/pasture/non-crop farmland6 1,581 acres Number of farms using certified organic production 0 Number of farms transitioning to organic production 0 Area of greenhouse/nursery operations (sq. ft) n/a

Michigan Food and Agricultural Systems Profiles
Agricultural Chemicals7 Number Percent of MI Total
Fertilizer manufacturers, distributors, and storage facilities 0 0.0 % Pesticide storage facilities 0 0.0 %
Processing and Warehousing
Wholesale food processing plants 2 0.1 % Food warehouses 5 0.45% Controlled atmosphere storage facilities 0 0.0 % Dairy processing plants 0 0.0 % Dairy warehouse, transfer, and truck cleaning facilities 0 0.0 % Slaughter facilities (MDARD licensed) 0 0.0 % Meat processing plants (MDARD licensed) 10 0.39% Rendering facilities 0 Commercial feed manufacturing facilities 0 Ethanol plants
Retailing and distribution8
Food service establishments (all) 91 0.29% Retail food establishments 27 0.19% Total amount spent by consumers on food (estimate)8 $46,246,962 0.19% Emergency food distribution sites9 6 0.26%
Pounds distributed 100,321 0.13% Students eligible for free or reduced school lunch10 1,030 0.14% Households receiving FAP (SNAP) benefits11 3,214 0.17%
Total federal funding for SNAP $5,081,923 0.17% Pet population (estimate) 12 8,938 Port(s) of entry none
Local Distribution13
Farmers’ markets 0 U-pick farms/On-farm markets 0 Farms using community Supported Agriculture 0 1 United States Census Bureau State & County Quick Facts: Michigan, http://quickfacts.census.gov/qfd/states/26000.html 2 Michigan Economic Development Corporation Regional Economic Profiles http://www.michiganbusiness.org/cm/Files/Reports/Regional_Economy/Michigan-Economy-Overview.pdf 3 Michigan Farm Bureau, Treasures of Michigan Agriculture, https://www.michfb.com/MI/Treasures/ 4 USDA 2012 AgCensus Statewide profile http://www.agcensus.usda.gov/Publications/2012/Online_Resources/County_Profiles/Michigan/cp99026.pdf 5 Totals from 2012 USDA AgCensus available from National Agricultural Statistics Service http://quickstats.nass.usda.gov/ 6 Includes non-crop farmland, pasture, and woodland pasture acreage 7 Michigan Department of Agriculture and Rural Development, Annual Reports, http://www.michigan.gov/mdard/0,4610,7-125-2968_4811---,00.html 8 Calculated from US Census estimated households in state with Bureau of Labor Statistics estimate of $6,393/household expenditure for food. 9 Food Bank Council of Michigan, http://www.fbcmich.org/site/DocServer/Michigan_Blueprint_to_End_Hunger_2008_web.pdf?docID=1921 estimates rounded to nearest integer 10 Michigan League for Public Policy, Kids Count in Michigan 2013 overview, http://www.mlpp.org/kids-count/michigan-2/mi-data-book-2013 11 USDA measure for 2013 http://www.fns.usda.gov/pd/supplemental-nutrition-assistance-program-snap 12 From 2012 population estimates (US Census Bureau) formula via Ohio Dept of Ag Animal Emergency Response Plan, 2006. Includes dogs, cats, birds, rabbits, rodents, and turtles. 13 Michigan Agritourism Association http://www.michiganfarmfun.com/index.php?option=com_mtree&Itemid=3

Michigan Food and Agricultural Systems Profiles
GRAND TRAVERSE
Area1 464.33 square miles Population2 86,999 Largest City Traverse City Watershed(s) Boardman, Betsie, Platte, Elk
Top Commodities by Volume of Sales3
•Grains, oilseeds, dry beans, and dry peas •Milk and other dairy products from cows •Cattle and calves •Nursery, greenhouse, floriculture, and sod •Horses, ponies, mules, burros, and donkeys
•Fruits, tree nuts, and berries •Other animals and other animal products •Sheep, goats, and their products •Cut Christmas trees and short rotation woody crops
Top Commodities by Acreage
•Forage •Corn •Bees
Agricultural Revenues4 Amount MI top 20 ranking
Total market value of agriculture production $18,246,000 Total crop sales $13,927,000 Total livestock sales $4,319,000
Key Michigan Products
Corn, soy, and wheat 11,015 acres ( 24.68% of cropland) Revenue from corn, soy, and wheat $4,330,000
Vegetables 760 acres ( 1.70% of cropland) Revenue from vegetables $706,770
Fruit and tree nuts 138 operations 4 Revenue from fruits, tree nuts, and berries $6,159,000 9
Dairy farms 5 farms Revenue from milk and other dairy (D)
All animal operations 154 operations
Agricultural Land
Total number of farms 504 Total farmland5 54,558 acres
Forage/pasture/non-crop farmland6 9,925 acres Number of farms using certified organic production 3 Number of farms transitioning to organic production 55 Area of greenhouse/nursery operations (sq. ft) 12,360

Michigan Food and Agricultural Systems Profiles
Agricultural Chemicals7 Number Percent of MI Total
Fertilizer manufacturers, distributors, and storage facilities 2 1.05% Pesticide storage facilities 2 1.35%
Processing and Warehousing
Wholesale food processing plants 76 3.81% Food warehouses 29 2.6 % Controlled atmosphere storage facilities 1 1.52% Dairy processing plants 4 5.06% Dairy warehouse, transfer, and truck cleaning facilities 0 0.0 % Slaughter facilities (MDARD licensed) 1 2.04% Meat processing plants (MDARD licensed) 52 2.05% Rendering facilities 0 Commercial feed manufacturing facilities 0 Ethanol plants
Retailing and distribution8
Food service establishments (all) 368 1.17% Retail food establishments 172 1.2 % Total amount spent by consumers on food (estimate)8 $219,676,266 0.9 % Emergency food distribution sites9 19 0.81%
Pounds distributed 380,471 0.49% Students eligible for free or reduced school lunch10 5,434 0.74% Households receiving FAP (SNAP) benefits11 12,798 0.67%
Total federal funding for SNAP $20,235,983 0.67% Pet population (estimate) 12 47,432 Port(s) of entry none
Local Distribution13
Farmers’ markets 8 U-pick farms/On-farm markets 6 Farms using community Supported Agriculture 8 1 United States Census Bureau State & County Quick Facts: Michigan, http://quickfacts.census.gov/qfd/states/26000.html 2 Michigan Economic Development Corporation Regional Economic Profiles http://www.michiganbusiness.org/cm/Files/Reports/Regional_Economy/Michigan-Economy-Overview.pdf 3 Michigan Farm Bureau, Treasures of Michigan Agriculture, https://www.michfb.com/MI/Treasures/ 4 USDA 2012 AgCensus Statewide profile http://www.agcensus.usda.gov/Publications/2012/Online_Resources/County_Profiles/Michigan/cp99026.pdf 5 Totals from 2012 USDA AgCensus available from National Agricultural Statistics Service http://quickstats.nass.usda.gov/ 6 Includes non-crop farmland, pasture, and woodland pasture acreage 7 Michigan Department of Agriculture and Rural Development, Annual Reports, http://www.michigan.gov/mdard/0,4610,7-125-2968_4811---,00.html 8 Calculated from US Census estimated households in state with Bureau of Labor Statistics estimate of $6,393/household expenditure for food. 9 Food Bank Council of Michigan, http://www.fbcmich.org/site/DocServer/Michigan_Blueprint_to_End_Hunger_2008_web.pdf?docID=1921 estimates rounded to nearest integer 10 Michigan League for Public Policy, Kids Count in Michigan 2013 overview, http://www.mlpp.org/kids-count/michigan-2/mi-data-book-2013 11 USDA measure for 2013 http://www.fns.usda.gov/pd/supplemental-nutrition-assistance-program-snap 12 From 2012 population estimates (US Census Bureau) formula via Ohio Dept of Ag Animal Emergency Response Plan, 2006. Includes dogs, cats, birds, rabbits, rodents, and turtles. 13 Michigan Agritourism Association http://www.michiganfarmfun.com/index.php?option=com_mtree&Itemid=3

Michigan Food and Agricultural Systems Profiles
GRATIOT
Area1 568.46 square miles Population2 42,411 Largest City Ithaca Watershed(s) Saginaw, Grand
Top Commodities by Volume of Sales3
•Grains, oilseeds, dry beans, and dry peas •Milk and other dairy products from cows •Cattle and calves •Nursery, greenhouse, floriculture, and sod •Horses, ponies, mules, burros, and donkeys
•Fruits, tree nuts, and berries •Other animals and other animal products •Sheep, goats, and their products •Cut Christmas trees and short rotation woody crops
Top Commodities by Acreage
•Corn •Soybeans •Pullets
Agricultural Revenues4 Amount MI top 20 ranking
Total market value of agriculture production $345,033,000 6 Total crop sales $199,091,000 6 Total livestock sales $145,942,000 5
Key Michigan Products
Corn, soy, and wheat 205,297 acres ( 75.02% of cropland)
5
Revenue from corn, soy, and wheat $163,884,000 4 Vegetables 7,410 acres ( 2.71% of cropland) 12
Revenue from vegetables $5,399,000 20 Fruit and tree nuts 5 operations
Revenue from fruits, tree nuts, and berries N/A Dairy farms 32 farms
Revenue from milk and other dairy $2,682,000 All animal operations 268 operations
Agricultural Land
Total number of farms 878 Total farmland5 289,376 acres 6
Forage/pasture/non-crop farmland6 15,709 acres Number of farms using certified organic production 12 Number of farms transitioning to organic production 57 Area of greenhouse/nursery operations (sq. ft) n/a

Michigan Food and Agricultural Systems Profiles
Agricultural Chemicals7 Number Percent of MI Total
Fertilizer manufacturers, distributors, and storage facilities 7 3.66% Pesticide storage facilities 5 3.38%
Processing and Warehousing
Wholesale food processing plants 6 0.3 % Food warehouses 2 0.18% Controlled atmosphere storage facilities 0 0.0 % Dairy processing plants 0 0.0 % Dairy warehouse, transfer, and truck cleaning facilities 0 0.0 % Slaughter facilities (MDARD licensed) 1 2.04% Meat processing plants (MDARD licensed) 21 0.83% Rendering facilities 0 Commercial feed manufacturing facilities 0 Ethanol plants
Retailing and distribution8
Food service establishments (all) 138 0.44% Retail food establishments 78 0.54% Total amount spent by consumers on food (estimate)8 $94,111,353 0.39% Emergency food distribution sites9 10 0.44%
Pounds distributed 210,803 0.27% Students eligible for free or reduced school lunch10 4,059 0.55% Households receiving FAP (SNAP) benefits11 7,756 0.41%
Total federal funding for SNAP $12,263,657 0.41% Pet population (estimate) 12 23,122 Port(s) of entry none
Local Distribution13
Farmers’ markets 2 U-pick farms/On-farm markets 2 Farms using community Supported Agriculture 4 1 United States Census Bureau State & County Quick Facts: Michigan, http://quickfacts.census.gov/qfd/states/26000.html 2 Michigan Economic Development Corporation Regional Economic Profiles http://www.michiganbusiness.org/cm/Files/Reports/Regional_Economy/Michigan-Economy-Overview.pdf 3 Michigan Farm Bureau, Treasures of Michigan Agriculture, https://www.michfb.com/MI/Treasures/ 4 USDA 2012 AgCensus Statewide profile http://www.agcensus.usda.gov/Publications/2012/Online_Resources/County_Profiles/Michigan/cp99026.pdf 5 Totals from 2012 USDA AgCensus available from National Agricultural Statistics Service http://quickstats.nass.usda.gov/ 6 Includes non-crop farmland, pasture, and woodland pasture acreage 7 Michigan Department of Agriculture and Rural Development, Annual Reports, http://www.michigan.gov/mdard/0,4610,7-125-2968_4811---,00.html 8 Calculated from US Census estimated households in state with Bureau of Labor Statistics estimate of $6,393/household expenditure for food. 9 Food Bank Council of Michigan, http://www.fbcmich.org/site/DocServer/Michigan_Blueprint_to_End_Hunger_2008_web.pdf?docID=1921 estimates rounded to nearest integer 10 Michigan League for Public Policy, Kids Count in Michigan 2013 overview, http://www.mlpp.org/kids-count/michigan-2/mi-data-book-2013 11 USDA measure for 2013 http://www.fns.usda.gov/pd/supplemental-nutrition-assistance-program-snap 12 From 2012 population estimates (US Census Bureau) formula via Ohio Dept of Ag Animal Emergency Response Plan, 2006. Includes dogs, cats, birds, rabbits, rodents, and turtles. 13 Michigan Agritourism Association http://www.michiganfarmfun.com/index.php?option=com_mtree&Itemid=3

Michigan Food and Agricultural Systems Profiles
HILLSDALE
Area1 598.13 square miles Population2 46,600 Largest City Hillsdale Watershed(s) St. Joseph, Maumee
Top Commodities by Volume of Sales3
•Grains, oilseeds, dry beans, and dry peas •Milk and other dairy products from cows •Hogs and pigs •Cattle and calves •Fruits, tree nuts, and berries
•Horses, ponies, mules, burros, and donkeys •Sheep, goats, and their products •Vegetables, melons, potatoes, and sweet potatoes •Other animals and other animal products •Poultry and eggs
Top Commodities by Acreage
•Corn •Soybeans •Hogs
Agricultural Revenues4 Amount MI top 20 ranking
Total market value of agriculture production $161,533,000 Total crop sales $115,914,000 Total livestock sales $45,619,000
Key Michigan Products
Corn, soy, and wheat 162,548 acres ( 69.37% of cropland)
13
Revenue from corn, soy, and wheat $94,911,000 15 Vegetables 286 acres ( .12% of cropland)
Revenue from vegetables $ Fruit and tree nuts 10 operations
Revenue from fruits, tree nuts, and berries $615,000 20 Dairy farms 66 farms 7
Revenue from milk and other dairy $1,031,000 All animal operations 498 operations 3
Agricultural Land
Total number of farms 1,530 2 Total farmland5 262,363 acres 8
Forage/pasture/non-crop farmland6 28,042 acres 6 Number of farms using certified organic production 6 Number of farms transitioning to organic production 0 Area of greenhouse/nursery operations (sq. ft) n/a

Michigan Food and Agricultural Systems Profiles
Agricultural Chemicals7 Number Percent of MI Total
Fertilizer manufacturers, distributors, and storage facilities 3 1.57% Pesticide storage facilities 3 2.03%
Processing and Warehousing
Wholesale food processing plants 11 0.55% Food warehouses 6 0.54% Controlled atmosphere storage facilities 0 0.0 % Dairy processing plants 0 0.0 % Dairy warehouse, transfer, and truck cleaning facilities 0 0.0 % Slaughter facilities (MDARD licensed) 0 0.0 % Meat processing plants (MDARD licensed) 13 0.51% Rendering facilities 0 Commercial feed manufacturing facilities 0 Ethanol plants
Retailing and distribution8
Food service establishments (all) 139 0.44% Retail food establishments 65 0.45% Total amount spent by consumers on food (estimate)8 $112,241,901 0.46% Emergency food distribution sites9 18 0.78%
Pounds distributed 538,311 0.7 % Students eligible for free or reduced school lunch10 3,697 0.5 % Households receiving FAP (SNAP) benefits11 8,724 0.46%
Total federal funding for SNAP $13,794,242 0.46% Pet population (estimate) 12 25,406 Port(s) of entry none
Local Distribution13
Farmers’ markets 1 U-pick farms/On-farm markets 0 Farms using community Supported Agriculture 5 1 United States Census Bureau State & County Quick Facts: Michigan, http://quickfacts.census.gov/qfd/states/26000.html 2 Michigan Economic Development Corporation Regional Economic Profiles http://www.michiganbusiness.org/cm/Files/Reports/Regional_Economy/Michigan-Economy-Overview.pdf 3 Michigan Farm Bureau, Treasures of Michigan Agriculture, https://www.michfb.com/MI/Treasures/ 4 USDA 2012 AgCensus Statewide profile http://www.agcensus.usda.gov/Publications/2012/Online_Resources/County_Profiles/Michigan/cp99026.pdf 5 Totals from 2012 USDA AgCensus available from National Agricultural Statistics Service http://quickstats.nass.usda.gov/ 6 Includes non-crop farmland, pasture, and woodland pasture acreage 7 Michigan Department of Agriculture and Rural Development, Annual Reports, http://www.michigan.gov/mdard/0,4610,7-125-2968_4811---,00.html 8 Calculated from US Census estimated households in state with Bureau of Labor Statistics estimate of $6,393/household expenditure for food. 9 Food Bank Council of Michigan, http://www.fbcmich.org/site/DocServer/Michigan_Blueprint_to_End_Hunger_2008_web.pdf?docID=1921 estimates rounded to nearest integer 10 Michigan League for Public Policy, Kids Count in Michigan 2013 overview, http://www.mlpp.org/kids-count/michigan-2/mi-data-book-2013 11 USDA measure for 2013 http://www.fns.usda.gov/pd/supplemental-nutrition-assistance-program-snap 12 From 2012 population estimates (US Census Bureau) formula via Ohio Dept of Ag Animal Emergency Response Plan, 2006. Includes dogs, cats, birds, rabbits, rodents, and turtles. 13 Michigan Agritourism Association http://www.michiganfarmfun.com/index.php?option=com_mtree&Itemid=3

Michigan Food and Agricultural Systems Profiles
HOUGHTON
Area1 1,009.10 square miles Population2 36,704 Largest City Houghton Watershed(s) Portage
Top Commodities by Volume of Sales3
•Milk and other dairy products from cows •Other crops and hay •Cattle and calves •Nursery, greenhouse, floriculture, and sod •Fruits, tree nuts, and berries •Vegetables, melons, potatoes, and sweet potatoes •Other animals and other animal products
•Horses, ponies, mules, burros, and donkeys •Grains, oilseeds, dry beans, and dry peas •Poultry and eggs •Hogs and pigs •Sheep, goats, and their products •Cut Christmas trees and short rotation woody crops
Top Commodities by Acreage
•Forage •Barley •Cattle
Agricultural Revenues4 Amount MI top 20 ranking
Total market value of agriculture production $4,014,000 Total crop sales $2,126,000 Total livestock sales $1,888,000
Key Michigan Products
Corn, soy, and wheat 444 acres ( 2.15% of cropland) Revenue from corn, soy, and wheat $239,000
Vegetables 98 acres ( .48% of cropland) Revenue from vegetables $136,000
Fruit and tree nuts 28 operations 16 Revenue from fruits, tree nuts, and berries $242,000
Dairy farms 6 farms Revenue from milk and other dairy $637,000
All animal operations 61 operations
Agricultural Land
Total number of farms 177 Total farmland5 27,194 acres
Forage/pasture/non-crop farmland6 6,573 acres Number of farms using certified organic production 2 Number of farms transitioning to organic production 61 Area of greenhouse/nursery operations (sq. ft) n/a

Michigan Food and Agricultural Systems Profiles
Agricultural Chemicals7 Number Percent of MI Total
Fertilizer manufacturers, distributors, and storage facilities 0 0.0 % Pesticide storage facilities 1 0.68%
Processing and Warehousing
Wholesale food processing plants 13 0.65% Food warehouses 12 1.08% Controlled atmosphere storage facilities 0 0.0 % Dairy processing plants 1 1.27% Dairy warehouse, transfer, and truck cleaning facilities 0 0.0 % Slaughter facilities (MDARD licensed) 0 0.0 % Meat processing plants (MDARD licensed) 12 0.47% Rendering facilities 0 Commercial feed manufacturing facilities 0 Ethanol plants
Retailing and distribution8
Food service establishments (all) 180 0.57% Retail food establishments 55 0.38% Total amount spent by consumers on food (estimate)8 $90,333,090 0.37% Emergency food distribution sites9 27 1.16%
Pounds distributed 347,920 0.45% Students eligible for free or reduced school lunch10 2,682 0.37% Households receiving FAP (SNAP) benefits11 5,561 0.29%
Total federal funding for SNAP $8,792,960 0.29% Pet population (estimate) 12 20,011 Port(s) of entry none
Local Distribution13
Farmers’ markets 4 U-pick farms/On-farm markets 1 Farms using community Supported Agriculture 2 1 United States Census Bureau State & County Quick Facts: Michigan, http://quickfacts.census.gov/qfd/states/26000.html 2 Michigan Economic Development Corporation Regional Economic Profiles http://www.michiganbusiness.org/cm/Files/Reports/Regional_Economy/Michigan-Economy-Overview.pdf 3 Michigan Farm Bureau, Treasures of Michigan Agriculture, https://www.michfb.com/MI/Treasures/ 4 USDA 2012 AgCensus Statewide profile http://www.agcensus.usda.gov/Publications/2012/Online_Resources/County_Profiles/Michigan/cp99026.pdf 5 Totals from 2012 USDA AgCensus available from National Agricultural Statistics Service http://quickstats.nass.usda.gov/ 6 Includes non-crop farmland, pasture, and woodland pasture acreage 7 Michigan Department of Agriculture and Rural Development, Annual Reports, http://www.michigan.gov/mdard/0,4610,7-125-2968_4811---,00.html 8 Calculated from US Census estimated households in state with Bureau of Labor Statistics estimate of $6,393/household expenditure for food. 9 Food Bank Council of Michigan, http://www.fbcmich.org/site/DocServer/Michigan_Blueprint_to_End_Hunger_2008_web.pdf?docID=1921 estimates rounded to nearest integer 10 Michigan League for Public Policy, Kids Count in Michigan 2013 overview, http://www.mlpp.org/kids-count/michigan-2/mi-data-book-2013 11 USDA measure for 2013 http://www.fns.usda.gov/pd/supplemental-nutrition-assistance-program-snap 12 From 2012 population estimates (US Census Bureau) formula via Ohio Dept of Ag Animal Emergency Response Plan, 2006. Includes dogs, cats, birds, rabbits, rodents, and turtles. 13 Michigan Agritourism Association http://www.michiganfarmfun.com/index.php?option=com_mtree&Itemid=3

Michigan Food and Agricultural Systems Profiles
HURON
Area1 835.71 square miles Population2 33,082 Largest City Bad Axe Watershed(s) Willow, Pigeon, Sebewaing
Top Commodities by Volume of Sales3
•Grains, oilseeds, dry beans, and dry peas •Milk and other dairy products from cows •Cattle and calves •Other crops and hay •Vegetables, melons, potatoes, and sweet potatoes •Nursery, greenhouse, floriculture, and sod
•Other animals and other animal products •Fruits, tree nuts, and berries •Horses, ponies, mules, burros, and donkeys •Sheep, goats, and their products •Cut Christmas trees and short rotation woody crops
Top Commodities by Acreage
•Corn •Dry Beans •Layers
Agricultural Revenues4 Amount MI top 20 ranking
Total market value of agriculture production $654,565,000 1 Total crop sales $334,344,000 1 Total livestock sales $320,221,000 2
Key Michigan Products
Corn, soy, and wheat 232,826 acres ( 54.38% of cropland)
3
Revenue from corn, soy, and wheat $176,231,000 2 Vegetables 233 acres ( .05% of cropland)
Revenue from vegetables $1,179,000 Fruit and tree nuts 11 operations
Revenue from fruits, tree nuts, and berries $44,000 Dairy farms 88 farms 3
Revenue from milk and other dairy $599,000 All animal operations 392 operations 17
Agricultural Land
Total number of farms 1,205 9 Total farmland5 452,370 acres 2
Forage/pasture/non-crop farmland6 24,204 acres 14 Number of farms using certified organic production 8 Number of farms transitioning to organic production 63 Area of greenhouse/nursery operations (sq. ft) n/a

Michigan Food and Agricultural Systems Profiles
Agricultural Chemicals7 Number Percent of MI Total
Fertilizer manufacturers, distributors, and storage facilities 13 6.81% Pesticide storage facilities 9 6.08%
Processing and Warehousing
Wholesale food processing plants 22 1.1 % Food warehouses 3 0.27% Controlled atmosphere storage facilities 0 0.0 % Dairy processing plants 0 0.0 % Dairy warehouse, transfer, and truck cleaning facilities 1 9.09% Slaughter facilities (MDARD licensed) 0 0.0 % Meat processing plants (MDARD licensed) 22 0.87% Rendering facilities 0 Commercial feed manufacturing facilities 0 Ethanol plants
Retailing and distribution8
Food service establishments (all) 171 0.54% Retail food establishments 74 0.52% Total amount spent by consumers on food (estimate)8 $89,578,716 0.37% Emergency food distribution sites9 3 0.14%
Pounds distributed 189,768 0.25% Students eligible for free or reduced school lunch10 2,274 0.31% Households receiving FAP (SNAP) benefits11 5,195 0.27%
Total federal funding for SNAP $8,214,247 0.27% Pet population (estimate) 12 18,036 Port(s) of entry none
Local Distribution13
Farmers’ markets 1 U-pick farms/On-farm markets 0 Farms using community Supported Agriculture 3 1 United States Census Bureau State & County Quick Facts: Michigan, http://quickfacts.census.gov/qfd/states/26000.html 2 Michigan Economic Development Corporation Regional Economic Profiles http://www.michiganbusiness.org/cm/Files/Reports/Regional_Economy/Michigan-Economy-Overview.pdf 3 Michigan Farm Bureau, Treasures of Michigan Agriculture, https://www.michfb.com/MI/Treasures/ 4 USDA 2012 AgCensus Statewide profile http://www.agcensus.usda.gov/Publications/2012/Online_Resources/County_Profiles/Michigan/cp99026.pdf 5 Totals from 2012 USDA AgCensus available from National Agricultural Statistics Service http://quickstats.nass.usda.gov/ 6 Includes non-crop farmland, pasture, and woodland pasture acreage 7 Michigan Department of Agriculture and Rural Development, Annual Reports, http://www.michigan.gov/mdard/0,4610,7-125-2968_4811---,00.html 8 Calculated from US Census estimated households in state with Bureau of Labor Statistics estimate of $6,393/household expenditure for food. 9 Food Bank Council of Michigan, http://www.fbcmich.org/site/DocServer/Michigan_Blueprint_to_End_Hunger_2008_web.pdf?docID=1921 estimates rounded to nearest integer 10 Michigan League for Public Policy, Kids Count in Michigan 2013 overview, http://www.mlpp.org/kids-count/michigan-2/mi-data-book-2013 11 USDA measure for 2013 http://www.fns.usda.gov/pd/supplemental-nutrition-assistance-program-snap 12 From 2012 population estimates (US Census Bureau) formula via Ohio Dept of Ag Animal Emergency Response Plan, 2006. Includes dogs, cats, birds, rabbits, rodents, and turtles. 13 Michigan Agritourism Association http://www.michiganfarmfun.com/index.php?option=com_mtree&Itemid=3

Michigan Food and Agricultural Systems Profiles
INGHAM
Area1 556.12 square miles Population2 280,849 Largest City Lansing Watershed(s) Grand River, Huron River
Top Commodities by Volume of Sales3
•Grains, oilseeds, dry beans, and dry peas •Milk and other dairy products from cows •Nursery, greenhouse, floriculture, and sod •Cattle and calves •Vegetables, melons, potatoes, and sweet potatoes
•Hogs and pigs •Other crops and hay •Fruits, tree nuts, and berries •Sheep, goats, and their products •Poultry and eggs
Top Commodities by Acreage
•Corn •Soybeans •Cattle
Agricultural Revenues4 Amount MI top 20 ranking
Total market value of agriculture production $131,340,000 Total crop sales $101,658,000 Total livestock sales $29,682,000
Key Michigan Products
Corn, soy, and wheat 143,834 acres ( 79.09% of cropland)
17
Revenue from corn, soy, and wheat $88,914,000 17 Vegetables 452 acres ( .25% of cropland)
Revenue from vegetables $1,245,320 Fruit and tree nuts 20 operations
Revenue from fruits, tree nuts, and berries $55,000 Dairy farms 30 farms
Revenue from milk and other dairy (D) All animal operations 384 operations 18
Agricultural Land
Total number of farms 944 Total farmland5 200,578 acres 18
Forage/pasture/non-crop farmland6 18,708 acres Number of farms using certified organic production 4 Number of farms transitioning to organic production 65 Area of greenhouse/nursery operations (sq. ft) N/A

Michigan Food and Agricultural Systems Profiles
Agricultural Chemicals7 Number Percent of MI Total
Fertilizer manufacturers, distributors, and storage facilities 7 3.66% Pesticide storage facilities 4 2.7 %
Processing and Warehousing
Wholesale food processing plants 88 4.41% Food warehouses 27 2.42% Controlled atmosphere storage facilities 0 0.0 % Dairy processing plants 3 3.8 % Dairy warehouse, transfer, and truck cleaning facilities 0 0.0 % Slaughter facilities (MDARD licensed) 0 0.0 % Meat processing plants (MDARD licensed) 50 1.97% Rendering facilities 0 Commercial feed manufacturing facilities 0 Ethanol plants
Retailing and distribution8
Food service establishments (all) 1015 3.22% Retail food establishments 370 2.59% Total amount spent by consumers on food (estimate)8 $693,288,885 2.84% Emergency food distribution sites9 98 4.2 %
Pounds distributed 2,313,758 2.99% Students eligible for free or reduced school lunch10 19,973 2.72% Households receiving FAP (SNAP) benefits11 58,204 3.04%
Total federal funding for SNAP $92,031,187 3.04% Pet population (estimate) 12 153,118 Port(s) of entry none
Local Distribution13
Farmers’ markets 14 U-pick farms/On-farm markets 3 Farms using community Supported Agriculture 10 1 United States Census Bureau State & County Quick Facts: Michigan, http://quickfacts.census.gov/qfd/states/26000.html 2 Michigan Economic Development Corporation Regional Economic Profiles http://www.michiganbusiness.org/cm/Files/Reports/Regional_Economy/Michigan-Economy-Overview.pdf 3 Michigan Farm Bureau, Treasures of Michigan Agriculture, https://www.michfb.com/MI/Treasures/ 4 USDA 2012 AgCensus Statewide profile http://www.agcensus.usda.gov/Publications/2012/Online_Resources/County_Profiles/Michigan/cp99026.pdf 5 Totals from 2012 USDA AgCensus available from National Agricultural Statistics Service http://quickstats.nass.usda.gov/ 6 Includes non-crop farmland, pasture, and woodland pasture acreage 7 Michigan Department of Agriculture and Rural Development, Annual Reports, http://www.michigan.gov/mdard/0,4610,7-125-2968_4811---,00.html 8 Calculated from US Census estimated households in state with Bureau of Labor Statistics estimate of $6,393/household expenditure for food. 9 Food Bank Council of Michigan, http://www.fbcmich.org/site/DocServer/Michigan_Blueprint_to_End_Hunger_2008_web.pdf?docID=1921 estimates rounded to nearest integer 10 Michigan League for Public Policy, Kids Count in Michigan 2013 overview, http://www.mlpp.org/kids-count/michigan-2/mi-data-book-2013 11 USDA measure for 2013 http://www.fns.usda.gov/pd/supplemental-nutrition-assistance-program-snap 12 From 2012 population estimates (US Census Bureau) formula via Ohio Dept of Ag Animal Emergency Response Plan, 2006. Includes dogs, cats, birds, rabbits, rodents, and turtles. 13 Michigan Agritourism Association http://www.michiganfarmfun.com/index.php?option=com_mtree&Itemid=3

Michigan Food and Agricultural Systems Profiles
IONIA
Area1 571.30 square miles Population2 63,854 Largest City Ionia Watershed(s) Grand, Huron
Top Commodities by Volume of Sales3
•Milk and other dairy products from cows •Grains, oilseeds, dry beans, and dry peas •Cattle and calves •Other crops and hay •Fruits, tree nuts, and berries •Vegetables, melons, potatoes, and sweet potatoes
•Nursery, greenhouse, floriculture, and sod •Horses, ponies, mules, burros, and donkeys •Sheep, goats and their products •Other animals and other animal products •Cut Christmas trees and short rotation woody crops
Top Commodities by Acreage
•Corn •Soybeans •Layers
Agricultural Revenues4 Amount MI top 20 ranking
Total market value of agriculture production $406,147,000 5 Total crop sales $128,514,000 17 Total livestock sales $277,633,000 3
Key Michigan Products
Corn, soy, and wheat 163,149 acres ( 73.83% of cropland)
12
Revenue from corn, soy, and wheat $114,909,000 8 Vegetables 2,339 acres ( 1.06% of cropland)
Revenue from vegetables $3,640,151 Fruit and tree nuts 17 operations
Revenue from fruits, tree nuts, and berries $1,576,000 16 Dairy farms 63 farms 9
Revenue from milk and other dairy $82,365,000 4 All animal operations 468 operations 6
Agricultural Land
Total number of farms 1,109 17 Total farmland5 248,418 acres 9
Forage/pasture/non-crop farmland6 27,441 acres 8 Number of farms using certified organic production 12 Number of farms transitioning to organic production 67 Area of greenhouse/nursery operations (sq. ft) n/a

Michigan Food and Agricultural Systems Profiles
Agricultural Chemicals7 Number Percent of MI Total
Fertilizer manufacturers, distributors, and storage facilities 3 1.57% Pesticide storage facilities 2 1.35%
Processing and Warehousing
Wholesale food processing plants 14 0.7 % Food warehouses 3 0.27% Controlled atmosphere storage facilities 3 4.55% Dairy processing plants 0 0.0 % Dairy warehouse, transfer, and truck cleaning facilities 1 9.09% Slaughter facilities (MDARD licensed) 0 0.0 % Meat processing plants (MDARD licensed) 25 0.99% Rendering facilities 0 Commercial feed manufacturing facilities 0 Ethanol plants
Retailing and distribution8
Food service establishments (all) 164 0.52% Retail food establishments 75 0.52% Total amount spent by consumers on food (estimate)8 $143,510,064 0.59% Emergency food distribution sites9 15 0.62%
Pounds distributed 297,479 0.38% Students eligible for free or reduced school lunch10 5,490 0.75% Households receiving FAP (SNAP) benefits11 10,605 0.55%
Total federal funding for SNAP $16,768,448 0.55% Pet population (estimate) 12 34,813 Port(s) of entry none
Local Distribution13
Farmers’ markets 3 U-pick farms/On-farm markets 1 Farms using community Supported Agriculture 1 1 United States Census Bureau State & County Quick Facts: Michigan, http://quickfacts.census.gov/qfd/states/26000.html 2 Michigan Economic Development Corporation Regional Economic Profiles http://www.michiganbusiness.org/cm/Files/Reports/Regional_Economy/Michigan-Economy-Overview.pdf 3 Michigan Farm Bureau, Treasures of Michigan Agriculture, https://www.michfb.com/MI/Treasures/ 4 USDA 2012 AgCensus Statewide profile http://www.agcensus.usda.gov/Publications/2012/Online_Resources/County_Profiles/Michigan/cp99026.pdf 5 Totals from 2012 USDA AgCensus available from National Agricultural Statistics Service http://quickstats.nass.usda.gov/ 6 Includes non-crop farmland, pasture, and woodland pasture acreage 7 Michigan Department of Agriculture and Rural Development, Annual Reports, http://www.michigan.gov/mdard/0,4610,7-125-2968_4811---,00.html 8 Calculated from US Census estimated households in state with Bureau of Labor Statistics estimate of $6,393/household expenditure for food. 9 Food Bank Council of Michigan, http://www.fbcmich.org/site/DocServer/Michigan_Blueprint_to_End_Hunger_2008_web.pdf?docID=1921 estimates rounded to nearest integer 10 Michigan League for Public Policy, Kids Count in Michigan 2013 overview, http://www.mlpp.org/kids-count/michigan-2/mi-data-book-2013 11 USDA measure for 2013 http://www.fns.usda.gov/pd/supplemental-nutrition-assistance-program-snap 12 From 2012 population estimates (US Census Bureau) formula via Ohio Dept of Ag Animal Emergency Response Plan, 2006. Includes dogs, cats, birds, rabbits, rodents, and turtles. 13 Michigan Agritourism Association http://www.michiganfarmfun.com/index.php?option=com_mtree&Itemid=3

Michigan Food and Agricultural Systems Profiles
IOSCO
Area1 549.10 square miles Population2 25,809 Largest City Tawas City Watershed(s) Au Gres, Au Sable
Top Commodities by Volume of Sales3
•Milk and other dairy products from cows •Cattle and calves •Grains, oilseeds, dry beans, and dry peas •Other crops and hay •Nursery, greenhouse, floriculture, and sod •Fruits, tree nuts, and berries
•Sheep, goats, and their products •Vegetables, melons, potatoes, and sweet potatoes •Poultry and eggs •Horses, ponies, mules, burros, and donkeys •Hogs and pigs •Cut Christmas trees and short rotation woody crops
Top Commodities by Acreage
•Forage •Corn •Cattle
Agricultural Revenues4 Amount MI top 20 ranking
Total market value of agriculture production $17,083,000 Total crop sales $6,226,000 Total livestock sales $10,857,000
Key Michigan Products
Corn, soy, and wheat 8,431 acres ( 28.69% of cropland) Revenue from corn, soy, and wheat $4,540,000
Vegetables 319 acres ( 1.09% of cropland) Revenue from vegetables $246,000
Fruit and tree nuts 12 operations Revenue from fruits, tree nuts, and berries N/A
Dairy farms 16 farms Revenue from milk and other dairy $2,831,000
All animal operations 116 operations
Agricultural Land
Total number of farms 283 Total farmland5 37,996 acres
Forage/pasture/non-crop farmland6 8,608 acres Number of farms using certified organic production 0 Number of farms transitioning to organic production 0 Area of greenhouse/nursery operations (sq. ft) N/A

Michigan Food and Agricultural Systems Profiles
Agricultural Chemicals7 Number Percent of MI Total
Fertilizer manufacturers, distributors, and storage facilities 1 0.52% Pesticide storage facilities 1 0.68%
Processing and Warehousing
Wholesale food processing plants 2 0.1 % Food warehouses 3 0.27% Controlled atmosphere storage facilities 0 0.0 % Dairy processing plants 0 0.0 % Dairy warehouse, transfer, and truck cleaning facilities 0 0.0 % Slaughter facilities (MDARD licensed) 1 2.04% Meat processing plants (MDARD licensed) 37 1.46% Rendering facilities 0 Commercial feed manufacturing facilities 0 Ethanol plants
Retailing and distribution8
Food service establishments (all) 128 0.41% Retail food establishments 64 0.45% Total amount spent by consumers on food (estimate)8 $69,543,054 0.28% Emergency food distribution sites9 5 0.19%
Pounds distributed 438,071 0.57% Students eligible for free or reduced school lunch10 2,893 0.39% Households receiving FAP (SNAP) benefits11 6,263 0.33%
Total federal funding for SNAP $9,902,950 0.33% Pet population (estimate) 12 14,071 Port(s) of entry none
Local Distribution13
Farmers’ markets 3 U-pick farms/On-farm markets 0 Farms using community Supported Agriculture 4 1 United States Census Bureau State & County Quick Facts: Michigan, http://quickfacts.census.gov/qfd/states/26000.html 2 Michigan Economic Development Corporation Regional Economic Profiles http://www.michiganbusiness.org/cm/Files/Reports/Regional_Economy/Michigan-Economy-Overview.pdf 3 Michigan Farm Bureau, Treasures of Michigan Agriculture, https://www.michfb.com/MI/Treasures/ 4 USDA 2012 AgCensus Statewide profile http://www.agcensus.usda.gov/Publications/2012/Online_Resources/County_Profiles/Michigan/cp99026.pdf 5 Totals from 2012 USDA AgCensus available from National Agricultural Statistics Service http://quickstats.nass.usda.gov/ 6 Includes non-crop farmland, pasture, and woodland pasture acreage 7 Michigan Department of Agriculture and Rural Development, Annual Reports, http://www.michigan.gov/mdard/0,4610,7-125-2968_4811---,00.html 8 Calculated from US Census estimated households in state with Bureau of Labor Statistics estimate of $6,393/household expenditure for food. 9 Food Bank Council of Michigan, http://www.fbcmich.org/site/DocServer/Michigan_Blueprint_to_End_Hunger_2008_web.pdf?docID=1921 estimates rounded to nearest integer 10 Michigan League for Public Policy, Kids Count in Michigan 2013 overview, http://www.mlpp.org/kids-count/michigan-2/mi-data-book-2013 11 USDA measure for 2013 http://www.fns.usda.gov/pd/supplemental-nutrition-assistance-program-snap 12 From 2012 population estimates (US Census Bureau) formula via Ohio Dept of Ag Animal Emergency Response Plan, 2006. Includes dogs, cats, birds, rabbits, rodents, and turtles. 13 Michigan Agritourism Association http://www.michiganfarmfun.com/index.php?option=com_mtree&Itemid=3

Michigan Food and Agricultural Systems Profiles
IRON
Area1 1,166.15 square miles Population2 11,809 Largest City Crystal Falls Watershed(s) Menominee, Ontonagon, Portage
Top Commodities by Volume of Sales3
•Vegetables, melons, potatoes, and sweet potatoes •Cattle and calves •Grains, oilseeds, dry beans, and dry peas
•Poultry and eggs •Hogs and pigs •Sheep, goats, and their products
Top Commodities by Acreage
•Forage •Vegetables •Cattle
Agricultural Revenues4 Amount MI top 20 ranking
Total market value of agriculture production $3,653,000 Total crop sales $3,188,000 Total livestock sales $465,000
Key Michigan Products
Corn, soy, and wheat 282 acres ( 1.61% of cropland) Revenue from corn, soy, and wheat $140,000
Vegetables 584 acres ( 3.34% of cropland) Revenue from vegetables $2,441,000
Fruit and tree nuts 6 operations Revenue from fruits, tree nuts, and berries N/A
Dairy farms N/A farms Revenue from milk and other dairy N/A
All animal operations 48 operations
Agricultural Land
Total number of farms 117 Total farmland5 22,939 acres
Forage/pasture/non-crop farmland6 5,430 acres Number of farms using certified organic production 0 Number of farms transitioning to organic production 0 Area of greenhouse/nursery operations (sq. ft) n/a

Michigan Food and Agricultural Systems Profiles
Agricultural Chemicals7 Number Percent of MI Total
Fertilizer manufacturers, distributors, and storage facilities 0 0.0 % Pesticide storage facilities 0 0.0 %
Processing and Warehousing
Wholesale food processing plants 6 0.3 % Food warehouses 2 0.18% Controlled atmosphere storage facilities 0 0.0 % Dairy processing plants 0 0.0 % Dairy warehouse, transfer, and truck cleaning facilities 0 0.0 % Slaughter facilities (MDARD licensed) 0 0.0 % Meat processing plants (MDARD licensed) 10 0.39% Rendering facilities 0 Commercial feed manufacturing facilities 0 Ethanol plants
Retailing and distribution8
Food service establishments (all) 59 0.19% Retail food establishments 25 0.17% Total amount spent by consumers on food (estimate)8 $33,729,468 0.14% Emergency food distribution sites9 4 0.15%
Pounds distributed 184,657 0.24% Students eligible for free or reduced school lunch10 778 0.11% Households receiving FAP (SNAP) benefits11 2,005 0.1 %
Total federal funding for SNAP $3,170,272 0.1 % Pet population (estimate) 12 6,438 Port(s) of entry none
Local Distribution13
Farmers’ markets 1 U-pick farms/On-farm markets 0 Farms using community Supported Agriculture 0 1 United States Census Bureau State & County Quick Facts: Michigan, http://quickfacts.census.gov/qfd/states/26000.html 2 Michigan Economic Development Corporation Regional Economic Profiles http://www.michiganbusiness.org/cm/Files/Reports/Regional_Economy/Michigan-Economy-Overview.pdf 3 Michigan Farm Bureau, Treasures of Michigan Agriculture, https://www.michfb.com/MI/Treasures/ 4 USDA 2012 AgCensus Statewide profile http://www.agcensus.usda.gov/Publications/2012/Online_Resources/County_Profiles/Michigan/cp99026.pdf 5 Totals from 2012 USDA AgCensus available from National Agricultural Statistics Service http://quickstats.nass.usda.gov/ 6 Includes non-crop farmland, pasture, and woodland pasture acreage 7 Michigan Department of Agriculture and Rural Development, Annual Reports, http://www.michigan.gov/mdard/0,4610,7-125-2968_4811---,00.html 8 Calculated from US Census estimated households in state with Bureau of Labor Statistics estimate of $6,393/household expenditure for food. 9 Food Bank Council of Michigan, http://www.fbcmich.org/site/DocServer/Michigan_Blueprint_to_End_Hunger_2008_web.pdf?docID=1921 estimates rounded to nearest integer 10 Michigan League for Public Policy, Kids Count in Michigan 2013 overview, http://www.mlpp.org/kids-count/michigan-2/mi-data-book-2013 11 USDA measure for 2013 http://www.fns.usda.gov/pd/supplemental-nutrition-assistance-program-snap 12 From 2012 population estimates (US Census Bureau) formula via Ohio Dept of Ag Animal Emergency Response Plan, 2006. Includes dogs, cats, birds, rabbits, rodents, and turtles. 13 Michigan Agritourism Association http://www.michiganfarmfun.com/index.php?option=com_mtree&Itemid=3

Michigan Food and Agricultural Systems Profiles
ISABELLA
Area1 572.68 square miles Population2 70,311 Largest City Mount Pleasant Watershed(s) Saginaw
Top Commodities by Volume of Sales3
•Grains, oilseeds, dry beans, and dry peas •Milk and other dairy products from cows •Cattle and calves •Other crops and hay •Vegetables, melons, potatoes, and sweet potatoes •Hogs and pigs
•Nursery, greenhouse, floriculture, and sod •Fruits, tree nuts, and berries •Horses, ponies, mules, burros, and donkeys •Other animals and other animal products •Sheep, goats, and their products •Cut Christmas trees and short rotation woody crops
Top Commodities by Acreage
•Soybeans •Corn •Cattle
Agricultural Revenues4 Amount MI top 20 ranking
Total market value of agriculture production $119,400,000 Total crop sales $78,428,000 Total livestock sales $40,972,000
Key Michigan Products
Corn, soy, and wheat 107,841 acres ( 63.73% of cropland)
Revenue from corn, soy, and wheat $71,283,000 Vegetables 1,072 acres ( .63% of cropland)
Revenue from vegetables $265,000 Fruit and tree nuts 13 operations
Revenue from fruits, tree nuts, and berries N/A Dairy farms 41 farms 13
Revenue from milk and other dairy $66,145,000 7 All animal operations 330 operations
Agricultural Land
Total number of farms 928 Total farmland5 188,465 acres
Forage/pasture/non-crop farmland6 19,261 acres Number of farms using certified organic production 10 Number of farms transitioning to organic production 73 Area of greenhouse/nursery operations (sq. ft) n/a

Michigan Food and Agricultural Systems Profiles
Agricultural Chemicals7 Number Percent of MI Total
Fertilizer manufacturers, distributors, and storage facilities 4 2.09% Pesticide storage facilities 2 1.35%
Processing and Warehousing
Wholesale food processing plants 15 0.75% Food warehouses 8 0.72% Controlled atmosphere storage facilities 0 0.0 % Dairy processing plants 0 0.0 % Dairy warehouse, transfer, and truck cleaning facilities 0 0.0 % Slaughter facilities (MDARD licensed) 2 4.08% Meat processing plants (MDARD licensed) 32 1.26% Rendering facilities 0 Commercial feed manufacturing facilities 0 Ethanol plants
Retailing and distribution8
Food service establishments (all) 210 0.67% Retail food establishments 90 0.63% Total amount spent by consumers on food (estimate)8 $158,239,536 0.65% Emergency food distribution sites9 4 0.19%
Pounds distributed 425,214 0.55% Students eligible for free or reduced school lunch10 2,798 0.38% Households receiving FAP (SNAP) benefits11 14,702 0.77%
Total federal funding for SNAP $23,246,555 0.77% Pet population (estimate) 12 38,333 Port(s) of entry none
Local Distribution13
Farmers’ markets 3 U-pick farms/On-farm markets 1 Farms using community Supported Agriculture 1 1 United States Census Bureau State & County Quick Facts: Michigan, http://quickfacts.census.gov/qfd/states/26000.html 2 Michigan Economic Development Corporation Regional Economic Profiles http://www.michiganbusiness.org/cm/Files/Reports/Regional_Economy/Michigan-Economy-Overview.pdf 3 Michigan Farm Bureau, Treasures of Michigan Agriculture, https://www.michfb.com/MI/Treasures/ 4 USDA 2012 AgCensus Statewide profile http://www.agcensus.usda.gov/Publications/2012/Online_Resources/County_Profiles/Michigan/cp99026.pdf 5 Totals from 2012 USDA AgCensus available from National Agricultural Statistics Service http://quickstats.nass.usda.gov/ 6 Includes non-crop farmland, pasture, and woodland pasture acreage 7 Michigan Department of Agriculture and Rural Development, Annual Reports, http://www.michigan.gov/mdard/0,4610,7-125-2968_4811---,00.html 8 Calculated from US Census estimated households in state with Bureau of Labor Statistics estimate of $6,393/household expenditure for food. 9 Food Bank Council of Michigan, http://www.fbcmich.org/site/DocServer/Michigan_Blueprint_to_End_Hunger_2008_web.pdf?docID=1921 estimates rounded to nearest integer 10 Michigan League for Public Policy, Kids Count in Michigan 2013 overview, http://www.mlpp.org/kids-count/michigan-2/mi-data-book-2013 11 USDA measure for 2013 http://www.fns.usda.gov/pd/supplemental-nutrition-assistance-program-snap 12 From 2012 population estimates (US Census Bureau) formula via Ohio Dept of Ag Animal Emergency Response Plan, 2006. Includes dogs, cats, birds, rabbits, rodents, and turtles. 13 Michigan Agritourism Association http://www.michiganfarmfun.com/index.php?option=com_mtree&Itemid=3

Michigan Food and Agricultural Systems Profiles
JACKSON
Area1 701.67 square miles Population2 160,150 Largest City Jackson Watershed(s) Grand, Kalamazoo, Raisin
Top Commodities by Volume of Sales3
•Grains, oilseeds, dry beans, and dry peas •Milk and other dairy products from cows •Poultry and eggs •Cattle and calves •Other crops and hay •Nursery, greenhouse, floriculture, and sod •Sheep, goats, and their products
•Horses, ponies, mules, burros, and donkeys •Vegetables, melons, potatoes, and sweet potatoes •Fruits, tree nuts, and berries •Hogs and pigs •Poultry and eggs •Cut Christmas trees and short rotation woody crops
Top Commodities by Acreage
•Corn •Soybeans •Cattle
Agricultural Revenues4 Amount MI top 20 ranking
Total market value of agriculture production $78,186,000 Total crop sales $54,110,000 Total livestock sales $24,076,000
Key Michigan Products
Corn, soy, and wheat 105,878 acres ( 69.92% of cropland)
Revenue from corn, soy, and wheat $48,608,000 Vegetables 756 acres ( .50% of cropland)
Revenue from vegetables $928,000 Fruit and tree nuts 20 operations
Revenue from fruits, tree nuts, and berries N/A Dairy farms 21 farms
Revenue from milk and other dairy $13,868,000 All animal operations 424 operations 11
Agricultural Land
Total number of farms 1,073 18 Total farmland5 183,111 acres
Forage/pasture/non-crop farmland6 31,676 acres 2 Number of farms using certified organic production 1 Number of farms transitioning to organic production 75 Area of greenhouse/nursery operations (sq. ft) N/A

Michigan Food and Agricultural Systems Profiles
Agricultural Chemicals7 Number Percent of MI Total
Fertilizer manufacturers, distributors, and storage facilities 2 1.05% Pesticide storage facilities 1 0.68%
Processing and Warehousing
Wholesale food processing plants 23 1.15% Food warehouses 11 0.99% Controlled atmosphere storage facilities 0 0.0 % Dairy processing plants 0 0.0 % Dairy warehouse, transfer, and truck cleaning facilities 0 0.0 % Slaughter facilities (MDARD licensed) 0 0.0 % Meat processing plants (MDARD licensed) 41 1.62% Rendering facilities 0 Commercial feed manufacturing facilities 0 Ethanol plants
Retailing and distribution8
Food service establishments (all) 435 1.38% Retail food establishments 233 1.63% Total amount spent by consumers on food (estimate)8 $383,253,957 1.57% Emergency food distribution sites9 34 1.46%
Pounds distributed 935,509 1.21% Students eligible for free or reduced school lunch10 12,928 1.76% Households receiving FAP (SNAP) benefits11 31,329 1.64%
Total federal funding for SNAP $49,536,888 1.64% Pet population (estimate) 12 87,313 Port(s) of entry none
Local Distribution13
Farmers’ markets 3 U-pick farms/On-farm markets 2 Farms using community Supported Agriculture 9 1 United States Census Bureau State & County Quick Facts: Michigan, http://quickfacts.census.gov/qfd/states/26000.html 2 Michigan Economic Development Corporation Regional Economic Profiles http://www.michiganbusiness.org/cm/Files/Reports/Regional_Economy/Michigan-Economy-Overview.pdf 3 Michigan Farm Bureau, Treasures of Michigan Agriculture, https://www.michfb.com/MI/Treasures/ 4 USDA 2012 AgCensus Statewide profile http://www.agcensus.usda.gov/Publications/2012/Online_Resources/County_Profiles/Michigan/cp99026.pdf 5 Totals from 2012 USDA AgCensus available from National Agricultural Statistics Service http://quickstats.nass.usda.gov/ 6 Includes non-crop farmland, pasture, and woodland pasture acreage 7 Michigan Department of Agriculture and Rural Development, Annual Reports, http://www.michigan.gov/mdard/0,4610,7-125-2968_4811---,00.html 8 Calculated from US Census estimated households in state with Bureau of Labor Statistics estimate of $6,393/household expenditure for food. 9 Food Bank Council of Michigan, http://www.fbcmich.org/site/DocServer/Michigan_Blueprint_to_End_Hunger_2008_web.pdf?docID=1921 estimates rounded to nearest integer 10 Michigan League for Public Policy, Kids Count in Michigan 2013 overview, http://www.mlpp.org/kids-count/michigan-2/mi-data-book-2013 11 USDA measure for 2013 http://www.fns.usda.gov/pd/supplemental-nutrition-assistance-program-snap 12 From 2012 population estimates (US Census Bureau) formula via Ohio Dept of Ag Animal Emergency Response Plan, 2006. Includes dogs, cats, birds, rabbits, rodents, and turtles. 13 Michigan Agritourism Association http://www.michiganfarmfun.com/index.php?option=com_mtree&Itemid=3
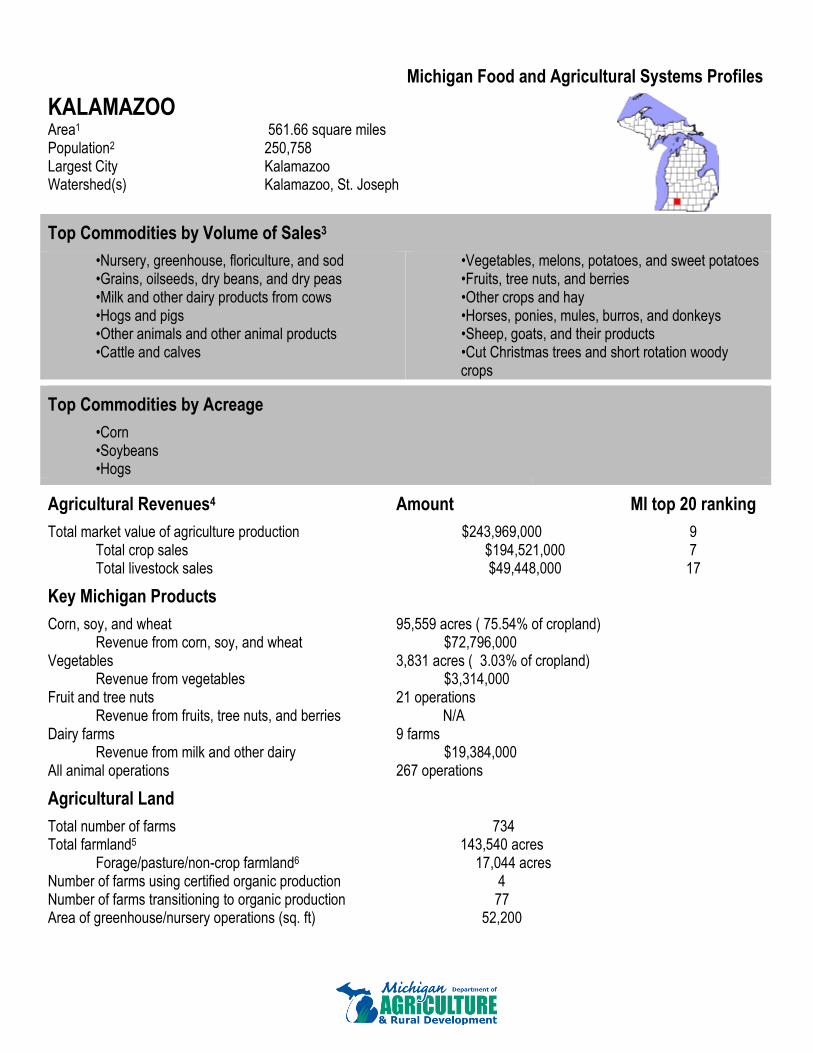
Michigan Food and Agricultural Systems Profiles
KALAMAZOO
Area1 561.66 square miles Population2 250,758 Largest City Kalamazoo Watershed(s) Kalamazoo, St. Joseph
Top Commodities by Volume of Sales3
•Nursery, greenhouse, floriculture, and sod •Grains, oilseeds, dry beans, and dry peas •Milk and other dairy products from cows •Hogs and pigs •Other animals and other animal products •Cattle and calves
•Vegetables, melons, potatoes, and sweet potatoes •Fruits, tree nuts, and berries •Other crops and hay •Horses, ponies, mules, burros, and donkeys •Sheep, goats, and their products •Cut Christmas trees and short rotation woody crops
Top Commodities by Acreage
•Corn •Soybeans •Hogs
Agricultural Revenues4 Amount MI top 20 ranking
Total market value of agriculture production $243,969,000 9 Total crop sales $194,521,000 7 Total livestock sales $49,448,000 17
Key Michigan Products
Corn, soy, and wheat 95,559 acres ( 75.54% of cropland) Revenue from corn, soy, and wheat $72,796,000
Vegetables 3,831 acres ( 3.03% of cropland) Revenue from vegetables $3,314,000
Fruit and tree nuts 21 operations Revenue from fruits, tree nuts, and berries N/A
Dairy farms 9 farms Revenue from milk and other dairy $19,384,000
All animal operations 267 operations
Agricultural Land
Total number of farms 734 Total farmland5 143,540 acres
Forage/pasture/non-crop farmland6 17,044 acres Number of farms using certified organic production 4 Number of farms transitioning to organic production 77 Area of greenhouse/nursery operations (sq. ft) 52,200

Michigan Food and Agricultural Systems Profiles
Agricultural Chemicals7 Number Percent of MI Total
Fertilizer manufacturers, distributors, and storage facilities 3 1.57% Pesticide storage facilities 3 2.03%
Processing and Warehousing
Wholesale food processing plants 51 2.56% Food warehouses 35 3.14% Controlled atmosphere storage facilities 6 9.09% Dairy processing plants 1 1.27% Dairy warehouse, transfer, and truck cleaning facilities 0 0.0 % Slaughter facilities (MDARD licensed) 0 0.0 % Meat processing plants (MDARD licensed) 49 1.93% Rendering facilities 2 Commercial feed manufacturing facilities 0 Ethanol plants
Retailing and distribution8
Food service establishments (all) 822 2.61% Retail food establishments 301 2.1 % Total amount spent by consumers on food (estimate)8 $637,509,960 2.61% Emergency food distribution sites9 95 4.09%
Pounds distributed 1,416,137 1.83% Students eligible for free or reduced school lunch10 17,028 2.32% Households receiving FAP (SNAP) benefits11 48,867 2.55%
Total federal funding for SNAP $77,267,679 2.55% Pet population (estimate) 12 136,713 Port(s) of entry none
Local Distribution13
Farmers’ markets 10 U-pick farms/On-farm markets 4 Farms using community Supported Agriculture 9 1 United States Census Bureau State & County Quick Facts: Michigan, http://quickfacts.census.gov/qfd/states/26000.html 2 Michigan Economic Development Corporation Regional Economic Profiles http://www.michiganbusiness.org/cm/Files/Reports/Regional_Economy/Michigan-Economy-Overview.pdf 3 Michigan Farm Bureau, Treasures of Michigan Agriculture, https://www.michfb.com/MI/Treasures/ 4 USDA 2012 AgCensus Statewide profile http://www.agcensus.usda.gov/Publications/2012/Online_Resources/County_Profiles/Michigan/cp99026.pdf 5 Totals from 2012 USDA AgCensus available from National Agricultural Statistics Service http://quickstats.nass.usda.gov/ 6 Includes non-crop farmland, pasture, and woodland pasture acreage 7 Michigan Department of Agriculture and Rural Development, Annual Reports, http://www.michigan.gov/mdard/0,4610,7-125-2968_4811---,00.html 8 Calculated from US Census estimated households in state with Bureau of Labor Statistics estimate of $6,393/household expenditure for food. 9 Food Bank Council of Michigan, http://www.fbcmich.org/site/DocServer/Michigan_Blueprint_to_End_Hunger_2008_web.pdf?docID=1921 estimates rounded to nearest integer 10 Michigan League for Public Policy, Kids Count in Michigan 2013 overview, http://www.mlpp.org/kids-count/michigan-2/mi-data-book-2013 11 USDA measure for 2013 http://www.fns.usda.gov/pd/supplemental-nutrition-assistance-program-snap 12 From 2012 population estimates (US Census Bureau) formula via Ohio Dept of Ag Animal Emergency Response Plan, 2006. Includes dogs, cats, birds, rabbits, rodents, and turtles. 13 Michigan Agritourism Association http://www.michiganfarmfun.com/index.php?option=com_mtree&Itemid=3

Michigan Food and Agricultural Systems Profiles
KALKASKA
Area1 559.87 square miles Population2 17,121 Largest City Kalkaska Watershed(s) Manistee, Boardman, Elk
Top Commodities by Volume of Sales3
•Vegetables, melons, potatoes, and sweet potatoes •Other crops and hay •Grains, oilseeds, dry beans, and dry peas •Horses, ponies, mules, burros, and donkeys
•Poultry and eggs •Hogs and pigs •Sheep, goats, and their products
Top Commodities by Acreage
•Forage •Vegetables •Layers
Agricultural Revenues4 Amount MI top 20 ranking
Total market value of agriculture production $8,803,000 Total crop sales $8,109,000 Total livestock sales $694,000
Key Michigan Products
Corn, soy, and wheat 2,343 acres ( 11.84% of cropland) Revenue from corn, soy, and wheat $1,299,000
Vegetables 3,878 acres ( 19.60% of cropland) Revenue from vegetables $5,770,000 18
Fruit and tree nuts 6 operations Revenue from fruits, tree nuts, and berries $22,000
Dairy farms N/A farms Revenue from milk and other dairy N/A
All animal operations 88 operations
Agricultural Land
Total number of farms 224 Total farmland5 25,819 acres
Forage/pasture/non-crop farmland6 6,032 acres Number of farms using certified organic production 0 Number of farms transitioning to organic production 79 Area of greenhouse/nursery operations (sq. ft) n/a
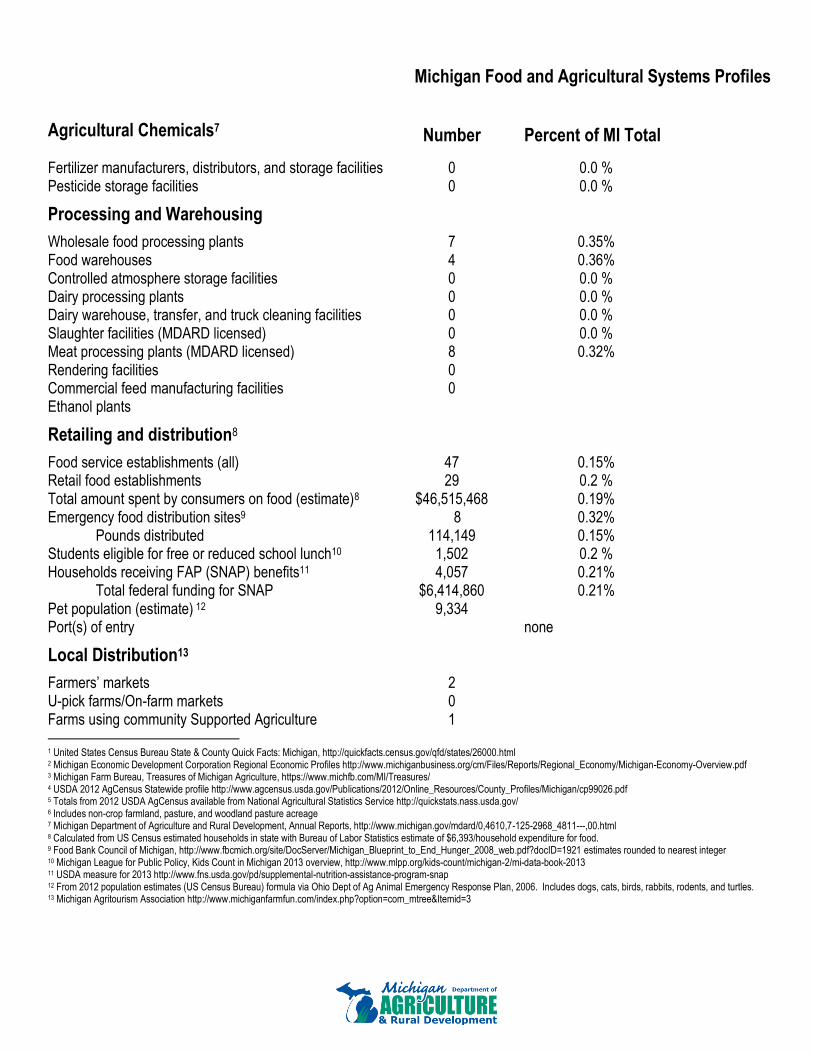
Michigan Food and Agricultural Systems Profiles
Agricultural Chemicals7 Number Percent of MI Total
Fertilizer manufacturers, distributors, and storage facilities 0 0.0 % Pesticide storage facilities 0 0.0 %
Processing and Warehousing
Wholesale food processing plants 7 0.35% Food warehouses 4 0.36% Controlled atmosphere storage facilities 0 0.0 % Dairy processing plants 0 0.0 % Dairy warehouse, transfer, and truck cleaning facilities 0 0.0 % Slaughter facilities (MDARD licensed) 0 0.0 % Meat processing plants (MDARD licensed) 8 0.32% Rendering facilities 0 Commercial feed manufacturing facilities 0 Ethanol plants
Retailing and distribution8
Food service establishments (all) 47 0.15% Retail food establishments 29 0.2 % Total amount spent by consumers on food (estimate)8 $46,515,468 0.19% Emergency food distribution sites9 8 0.32%
Pounds distributed 114,149 0.15% Students eligible for free or reduced school lunch10 1,502 0.2 % Households receiving FAP (SNAP) benefits11 4,057 0.21%
Total federal funding for SNAP $6,414,860 0.21% Pet population (estimate) 12 9,334 Port(s) of entry none
Local Distribution13
Farmers’ markets 2 U-pick farms/On-farm markets 0 Farms using community Supported Agriculture 1 1 United States Census Bureau State & County Quick Facts: Michigan, http://quickfacts.census.gov/qfd/states/26000.html 2 Michigan Economic Development Corporation Regional Economic Profiles http://www.michiganbusiness.org/cm/Files/Reports/Regional_Economy/Michigan-Economy-Overview.pdf 3 Michigan Farm Bureau, Treasures of Michigan Agriculture, https://www.michfb.com/MI/Treasures/ 4 USDA 2012 AgCensus Statewide profile http://www.agcensus.usda.gov/Publications/2012/Online_Resources/County_Profiles/Michigan/cp99026.pdf 5 Totals from 2012 USDA AgCensus available from National Agricultural Statistics Service http://quickstats.nass.usda.gov/ 6 Includes non-crop farmland, pasture, and woodland pasture acreage 7 Michigan Department of Agriculture and Rural Development, Annual Reports, http://www.michigan.gov/mdard/0,4610,7-125-2968_4811---,00.html 8 Calculated from US Census estimated households in state with Bureau of Labor Statistics estimate of $6,393/household expenditure for food. 9 Food Bank Council of Michigan, http://www.fbcmich.org/site/DocServer/Michigan_Blueprint_to_End_Hunger_2008_web.pdf?docID=1921 estimates rounded to nearest integer 10 Michigan League for Public Policy, Kids Count in Michigan 2013 overview, http://www.mlpp.org/kids-count/michigan-2/mi-data-book-2013 11 USDA measure for 2013 http://www.fns.usda.gov/pd/supplemental-nutrition-assistance-program-snap 12 From 2012 population estimates (US Census Bureau) formula via Ohio Dept of Ag Animal Emergency Response Plan, 2006. Includes dogs, cats, birds, rabbits, rodents, and turtles. 13 Michigan Agritourism Association http://www.michiganfarmfun.com/index.php?option=com_mtree&Itemid=3

Michigan Food and Agricultural Systems Profiles
KENT
Area1 846.95 square miles Population2 602,799 Largest City Grand Rapids Watershed(s) Grand River
Top Commodities by Volume of Sales3
•Nursery, greenhouse, floriculture, and sod •Milk and other dairy products from cows •Fruits, tree nuts, and berries •Grains, oilseeds, dry beans, and dry peas •Vegetables, melons, potatoes, and sweet potatoes •Cattle and calves
•Hogs and pigs •Other crops and hay •Horses, ponies, mules, burros, and donkeys •Cut Christmas trees and short rotation woody crops •Sheep, goats, and their products
Top Commodities by Acreage
•Corn •Soybeans •Turkeys
Agricultural Revenues4 Amount MI top 20 ranking
Total market value of agriculture production $231,861,000 12 Total crop sales $180,389,000 10 Total livestock sales $51,472,000 15
Key Michigan Products
Corn, soy, and wheat 75,447 acres ( 56.19% of cropland) Revenue from corn, soy, and wheat $54,425,000
Vegetables 4,829 acres ( 3.60% of cropland) 20 Revenue from vegetables $8,152,639 14
Fruit and tree nuts 106 operations 6 Revenue from fruits, tree nuts, and berries $27,747,000 3
Dairy farms 39 farms 14 Revenue from milk and other dairy $114,912,000 2
All animal operations 465 operations 7
Agricultural Land
Total number of farms 1,159 11 Total farmland5 157,493 acres
Forage/pasture/non-crop farmland6 23,219 acres 16 Number of farms using certified organic production 4 Number of farms transitioning to organic production 81 Area of greenhouse/nursery operations (sq. ft) 207,390

Michigan Food and Agricultural Systems Profiles
Agricultural Chemicals7 Number Percent of MI Total
Fertilizer manufacturers, distributors, and storage facilities 4 2.09% Pesticide storage facilities 4 2.7 %
Processing and Warehousing
Wholesale food processing plants 155 7.77% Food warehouses 114 10.22% Controlled atmosphere storage facilities 29 43.94% Dairy processing plants 3 3.8 % Dairy warehouse, transfer, and truck cleaning facilities 1 9.09% Slaughter facilities (MDARD licensed) 0 0.0 % Meat processing plants (MDARD licensed) 132 5.21% Rendering facilities 0 Commercial feed manufacturing facilities 0 Ethanol plants
Retailing and distribution8
Food service establishments (all) 1985 6.31% Retail food establishments 752 5.25% Total amount spent by consumers on food (estimate)8 $1,458,908,172 5.98% Emergency food distribution sites9 363 15.63%
Pounds distributed 7,219,305 9.34% Students eligible for free or reduced school lunch10 49,300 6.73% Households receiving FAP (SNAP) benefits11 110,040 5.75%
Total federal funding for SNAP $173,993,399 5.75% Pet population (estimate) 12 328,645 Port(s) of entry Grand Rapids International Airport
Local Distribution13
Farmers’ markets 17 U-pick farms/On-farm markets 19 Farms using community Supported Agriculture 13 1 United States Census Bureau State & County Quick Facts: Michigan, http://quickfacts.census.gov/qfd/states/26000.html 2 Michigan Economic Development Corporation Regional Economic Profiles http://www.michiganbusiness.org/cm/Files/Reports/Regional_Economy/Michigan-Economy-Overview.pdf 3 Michigan Farm Bureau, Treasures of Michigan Agriculture, https://www.michfb.com/MI/Treasures/ 4 USDA 2012 AgCensus Statewide profile http://www.agcensus.usda.gov/Publications/2012/Online_Resources/County_Profiles/Michigan/cp99026.pdf 5 Totals from 2012 USDA AgCensus available from National Agricultural Statistics Service http://quickstats.nass.usda.gov/ 6 Includes non-crop farmland, pasture, and woodland pasture acreage 7 Michigan Department of Agriculture and Rural Development, Annual Reports, http://www.michigan.gov/mdard/0,4610,7-125-2968_4811---,00.html 8 Calculated from US Census estimated households in state with Bureau of Labor Statistics estimate of $6,393/household expenditure for food. 9 Food Bank Council of Michigan, http://www.fbcmich.org/site/DocServer/Michigan_Blueprint_to_End_Hunger_2008_web.pdf?docID=1921 estimates rounded to nearest integer 10 Michigan League for Public Policy, Kids Count in Michigan 2013 overview, http://www.mlpp.org/kids-count/michigan-2/mi-data-book-2013 11 USDA measure for 2013 http://www.fns.usda.gov/pd/supplemental-nutrition-assistance-program-snap 12 From 2012 population estimates (US Census Bureau) formula via Ohio Dept of Ag Animal Emergency Response Plan, 2006. Includes dogs, cats, birds, rabbits, rodents, and turtles. 13 Michigan Agritourism Association http://www.michiganfarmfun.com/index.php?option=com_mtree&Itemid=3

Michigan Food and Agricultural Systems Profiles
KEWEENAW
Area1 540.11 square miles Population2 2,144 Largest City Eagle River Watershed(s) Lake Superior drainage
Top Commodities by Volume of Sales3
No data available
Top Commodities by Acreage
No data available
Agricultural Revenues4 Amount MI top 20 ranking
Total market value of agriculture production $ Total crop sales $ Total livestock sales N/A
Key Michigan Products
Corn, soy, and wheat acres (% of cropland) Revenue from corn, soy, and wheat
Vegetables acres (% of cropland) Revenue from vegetables $
Fruit and tree nuts N/A operations Revenue from fruits, tree nuts, and berries N/A
Dairy farms N/A farms Revenue from milk and other dairy N/A
All animal operations 2 operations
Agricultural Land
Total number of farms 6 Total farmland5 318 acres
Forage/pasture/non-crop farmland6 240 acres Number of farms using certified organic production 0 Number of farms transitioning to organic production 0 Area of greenhouse/nursery operations (sq. ft) n/a

Michigan Food and Agricultural Systems Profiles
Agricultural Chemicals7 Number Percent of MI Total
Fertilizer manufacturers, distributors, and storage facilities 0 0.0 % Pesticide storage facilities 0 0.0 %
Processing and Warehousing
Wholesale food processing plants 5 0.25% Food warehouses 0 0.0 % Controlled atmosphere storage facilities 0 0.0 % Dairy processing plants 0 0.0 % Dairy warehouse, transfer, and truck cleaning facilities 0 0.0 % Slaughter facilities (MDARD licensed) 0 0.0 % Meat processing plants (MDARD licensed) 1 0.04% Rendering facilities 0 Commercial feed manufacturing facilities 0 Ethanol plants
Retailing and distribution8
Food service establishments (all) 21 0.07% Retail food establishments 8 0.06% Total amount spent by consumers on food (estimate)8 $6,469,716 0.03% Emergency food distribution sites9 1 0.04%
Pounds distributed 10,590 0.01% Students eligible for free or reduced school lunch10 1 0.0 % Households receiving FAP (SNAP) benefits11 291 0.02%
Total federal funding for SNAP $460,124 0.02% Pet population (estimate) 12 1,169 Port(s) of entry none
Local Distribution13
Farmers’ markets 0 U-pick farms/On-farm markets 0 Farms using community Supported Agriculture 0 1 United States Census Bureau State & County Quick Facts: Michigan, http://quickfacts.census.gov/qfd/states/26000.html 2 Michigan Economic Development Corporation Regional Economic Profiles http://www.michiganbusiness.org/cm/Files/Reports/Regional_Economy/Michigan-Economy-Overview.pdf 3 Michigan Farm Bureau, Treasures of Michigan Agriculture, https://www.michfb.com/MI/Treasures/ 4 USDA 2012 AgCensus Statewide profile http://www.agcensus.usda.gov/Publications/2012/Online_Resources/County_Profiles/Michigan/cp99026.pdf 5 Totals from 2012 USDA AgCensus available from National Agricultural Statistics Service http://quickstats.nass.usda.gov/ 6 Includes non-crop farmland, pasture, and woodland pasture acreage 7 Michigan Department of Agriculture and Rural Development, Annual Reports, http://www.michigan.gov/mdard/0,4610,7-125-2968_4811---,00.html 8 Calculated from US Census estimated households in state with Bureau of Labor Statistics estimate of $6,393/household expenditure for food. 9 Food Bank Council of Michigan, http://www.fbcmich.org/site/DocServer/Michigan_Blueprint_to_End_Hunger_2008_web.pdf?docID=1921 estimates rounded to nearest integer 10 Michigan League for Public Policy, Kids Count in Michigan 2013 overview, http://www.mlpp.org/kids-count/michigan-2/mi-data-book-2013 11 USDA measure for 2013 http://www.fns.usda.gov/pd/supplemental-nutrition-assistance-program-snap 12 From 2012 population estimates (US Census Bureau) formula via Ohio Dept of Ag Animal Emergency Response Plan, 2006. Includes dogs, cats, birds, rabbits, rodents, and turtles. 13 Michigan Agritourism Association http://www.michiganfarmfun.com/index.php?option=com_mtree&Itemid=3

Michigan Food and Agricultural Systems Profiles
LAKE
Area1 567.37 square miles Population2 11,499 Largest City Baldwin Watershed(s) Pere Marquette, Manistee, Big Sable, Muskegon
Top Commodities by Volume of Sales3
•Milk and other dairy products from cows •Other crops and hay •Cattle and calves •Grains, oilseeds, dry beans, and dry peas •Fruits, tree nuts, and berries
•Nursery, greenhouse, floriculture, and sod •Hogs and pigs •Sheep, goats, and their products •Horses, ponies, mules, burros, and donkeys
Top Commodities by Acreage
•Forage •Corn •Cattle
Agricultural Revenues4 Amount MI top 20 ranking
Total market value of agriculture production $4,062,000 Total crop sales $2,290,000 Total livestock sales $1,772,000
Key Michigan Products
Corn, soy, and wheat 3,125 acres ( 16.30% of cropland) Revenue from corn, soy, and wheat $1,568,000
Vegetables 41 acres ( .21% of cropland) Revenue from vegetables $12,500
Fruit and tree nuts 1 operations Revenue from fruits, tree nuts, and berries N/A
Dairy farms 2 farms Revenue from milk and other dairy $6,521,000
All animal operations 77 operations
Agricultural Land
Total number of farms 200 Total farmland5 26,025 acres
Forage/pasture/non-crop farmland6 6,849 acres Number of farms using certified organic production 0 Number of farms transitioning to organic production 0 Area of greenhouse/nursery operations (sq. ft) N/A

Michigan Food and Agricultural Systems Profiles
Agricultural Chemicals7 Number Percent of MI Total
Fertilizer manufacturers, distributors, and storage facilities 0 0.0 % Pesticide storage facilities 0 0.0 %
Processing and Warehousing
Wholesale food processing plants 1 0.05% Food warehouses 2 0.18% Controlled atmosphere storage facilities 0 0.0 % Dairy processing plants 0 0.0 % Dairy warehouse, transfer, and truck cleaning facilities 0 0.0 % Slaughter facilities (MDARD licensed) 0 0.0 % Meat processing plants (MDARD licensed) 5 0.2 % Rendering facilities 0 Commercial feed manufacturing facilities 0 Ethanol plants
Retailing and distribution8
Food service establishments (all) 41 0.13% Retail food establishments 23 0.16% Total amount spent by consumers on food (estimate)8 $26,460,627 0.11% Emergency food distribution sites9 5 0.19%
Pounds distributed 133,132 0.17% Students eligible for free or reduced school lunch10 520 0.07% Households receiving FAP (SNAP) benefits11 3,296 0.17%
Total federal funding for SNAP $5,211,580 0.17% Pet population (estimate) 12 6,269 Port(s) of entry none
Local Distribution13
Farmers’ markets 0 U-pick farms/On-farm markets 0 Farms using community Supported Agriculture 5 1 United States Census Bureau State & County Quick Facts: Michigan, http://quickfacts.census.gov/qfd/states/26000.html 2 Michigan Economic Development Corporation Regional Economic Profiles http://www.michiganbusiness.org/cm/Files/Reports/Regional_Economy/Michigan-Economy-Overview.pdf 3 Michigan Farm Bureau, Treasures of Michigan Agriculture, https://www.michfb.com/MI/Treasures/ 4 USDA 2012 AgCensus Statewide profile http://www.agcensus.usda.gov/Publications/2012/Online_Resources/County_Profiles/Michigan/cp99026.pdf 5 Totals from 2012 USDA AgCensus available from National Agricultural Statistics Service http://quickstats.nass.usda.gov/ 6 Includes non-crop farmland, pasture, and woodland pasture acreage 7 Michigan Department of Agriculture and Rural Development, Annual Reports, http://www.michigan.gov/mdard/0,4610,7-125-2968_4811---,00.html 8 Calculated from US Census estimated households in state with Bureau of Labor Statistics estimate of $6,393/household expenditure for food. 9 Food Bank Council of Michigan, http://www.fbcmich.org/site/DocServer/Michigan_Blueprint_to_End_Hunger_2008_web.pdf?docID=1921 estimates rounded to nearest integer 10 Michigan League for Public Policy, Kids Count in Michigan 2013 overview, http://www.mlpp.org/kids-count/michigan-2/mi-data-book-2013 11 USDA measure for 2013 http://www.fns.usda.gov/pd/supplemental-nutrition-assistance-program-snap 12 From 2012 population estimates (US Census Bureau) formula via Ohio Dept of Ag Animal Emergency Response Plan, 2006. Includes dogs, cats, birds, rabbits, rodents, and turtles. 13 Michigan Agritourism Association http://www.michiganfarmfun.com/index.php?option=com_mtree&Itemid=3
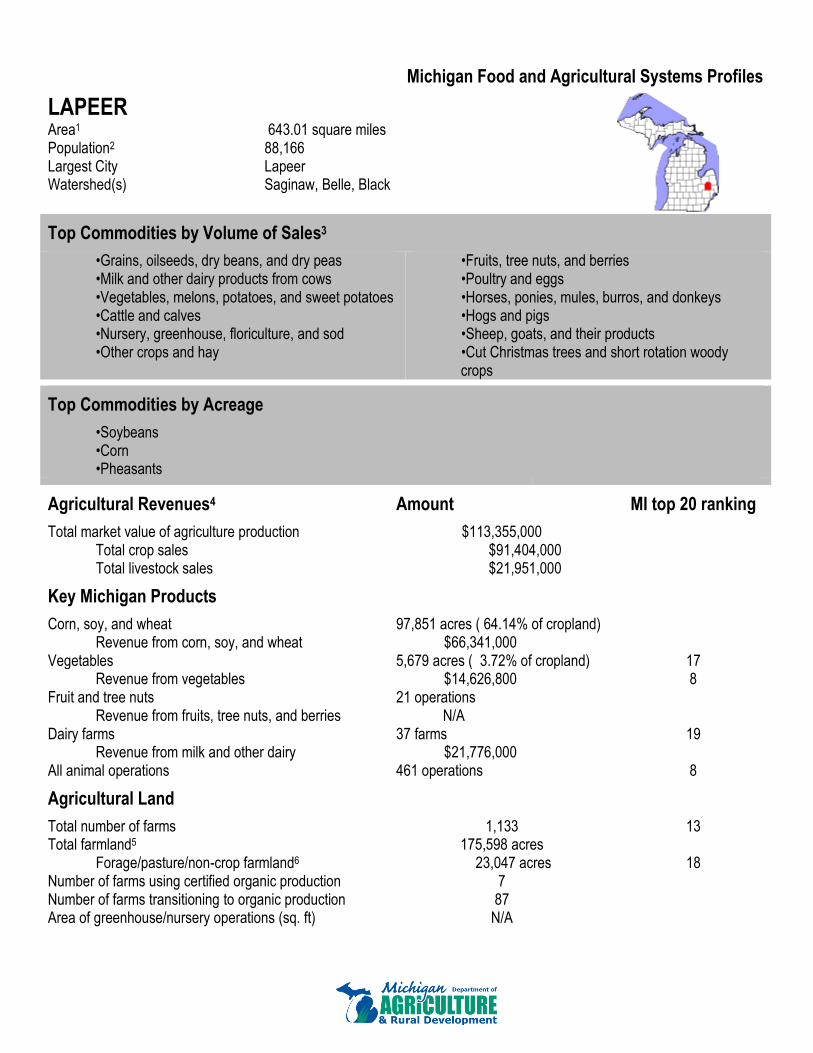
Michigan Food and Agricultural Systems Profiles
LAPEER
Area1 643.01 square miles Population2 88,166 Largest City Lapeer Watershed(s) Saginaw, Belle, Black
Top Commodities by Volume of Sales3
•Grains, oilseeds, dry beans, and dry peas •Milk and other dairy products from cows •Vegetables, melons, potatoes, and sweet potatoes •Cattle and calves •Nursery, greenhouse, floriculture, and sod •Other crops and hay
•Fruits, tree nuts, and berries •Poultry and eggs •Horses, ponies, mules, burros, and donkeys •Hogs and pigs •Sheep, goats, and their products •Cut Christmas trees and short rotation woody crops
Top Commodities by Acreage
•Soybeans •Corn •Pheasants
Agricultural Revenues4 Amount MI top 20 ranking
Total market value of agriculture production $113,355,000 Total crop sales $91,404,000 Total livestock sales $21,951,000
Key Michigan Products
Corn, soy, and wheat 97,851 acres ( 64.14% of cropland) Revenue from corn, soy, and wheat $66,341,000
Vegetables 5,679 acres ( 3.72% of cropland) 17 Revenue from vegetables $14,626,800 8
Fruit and tree nuts 21 operations Revenue from fruits, tree nuts, and berries N/A
Dairy farms 37 farms 19 Revenue from milk and other dairy $21,776,000
All animal operations 461 operations 8
Agricultural Land
Total number of farms 1,133 13 Total farmland5 175,598 acres
Forage/pasture/non-crop farmland6 23,047 acres 18 Number of farms using certified organic production 7 Number of farms transitioning to organic production 87 Area of greenhouse/nursery operations (sq. ft) N/A

Michigan Food and Agricultural Systems Profiles
Agricultural Chemicals7 Number Percent of MI Total
Fertilizer manufacturers, distributors, and storage facilities 2 1.05% Pesticide storage facilities 1 0.68%
Processing and Warehousing
Wholesale food processing plants 17 0.85% Food warehouses 4 0.36% Controlled atmosphere storage facilities 0 0.0 % Dairy processing plants 0 0.0 % Dairy warehouse, transfer, and truck cleaning facilities 0 0.0 % Slaughter facilities (MDARD licensed) 1 2.04% Meat processing plants (MDARD licensed) 39 1.54% Rendering facilities 0 Commercial feed manufacturing facilities 0 Ethanol plants
Retailing and distribution8
Food service establishments (all) 225 0.71% Retail food establishments 120 0.84% Total amount spent by consumers on food (estimate)8 $209,581,719 0.86% Emergency food distribution sites9 15 0.62%
Pounds distributed 319,232 0.41% Students eligible for free or reduced school lunch10 5,925 0.81% Households receiving FAP (SNAP) benefits11 13,265 0.69%
Total federal funding for SNAP $20,974,395 0.69% Pet population (estimate) 12 48,068 Port(s) of entry none
Local Distribution13
Farmers’ markets 4 U-pick farms/On-farm markets 3 Farms using community Supported Agriculture 10 1 United States Census Bureau State & County Quick Facts: Michigan, http://quickfacts.census.gov/qfd/states/26000.html 2 Michigan Economic Development Corporation Regional Economic Profiles http://www.michiganbusiness.org/cm/Files/Reports/Regional_Economy/Michigan-Economy-Overview.pdf 3 Michigan Farm Bureau, Treasures of Michigan Agriculture, https://www.michfb.com/MI/Treasures/ 4 USDA 2012 AgCensus Statewide profile http://www.agcensus.usda.gov/Publications/2012/Online_Resources/County_Profiles/Michigan/cp99026.pdf 5 Totals from 2012 USDA AgCensus available from National Agricultural Statistics Service http://quickstats.nass.usda.gov/ 6 Includes non-crop farmland, pasture, and woodland pasture acreage 7 Michigan Department of Agriculture and Rural Development, Annual Reports, http://www.michigan.gov/mdard/0,4610,7-125-2968_4811---,00.html 8 Calculated from US Census estimated households in state with Bureau of Labor Statistics estimate of $6,393/household expenditure for food. 9 Food Bank Council of Michigan, http://www.fbcmich.org/site/DocServer/Michigan_Blueprint_to_End_Hunger_2008_web.pdf?docID=1921 estimates rounded to nearest integer 10 Michigan League for Public Policy, Kids Count in Michigan 2013 overview, http://www.mlpp.org/kids-count/michigan-2/mi-data-book-2013 11 USDA measure for 2013 http://www.fns.usda.gov/pd/supplemental-nutrition-assistance-program-snap 12 From 2012 population estimates (US Census Bureau) formula via Ohio Dept of Ag Animal Emergency Response Plan, 2006. Includes dogs, cats, birds, rabbits, rodents, and turtles. 13 Michigan Agritourism Association http://www.michiganfarmfun.com/index.php?option=com_mtree&Itemid=3

Michigan Food and Agricultural Systems Profiles
LEELANAU
Area1 347.17 square miles Population2 21,679 Largest City Leland Watershed(s) Lake Michigan drainage
Top Commodities by Volume of Sales3
•Fruits, tree nuts, and berries •Cattle and calves •Nursery, greenhouse, floriculture, and sod •Milk and other dairy products from cows •Other crops and hay
•Grains, oilseeds, dry beans, and dry peas •Vegetables, melons, potatoes, and sweet potatoes •Horses, ponies, mules, burros, and donkeys •Cut Christmas trees and short rotation woody crops •Hogs and pigs
Top Commodities by Acreage
•Tart cherries •Forage •Cattle
Agricultural Revenues4 Amount MI top 20 ranking
Total market value of agriculture production $20,494,000 Total crop sales $17,776,000 Total livestock sales $2,718,000
Key Michigan Products
Corn, soy, and wheat 3,302 acres ( 6.90% of cropland) Revenue from corn, soy, and wheat $724,000
Vegetables 133 acres ( .28% of cropland) Revenue from vegetables $645,559
Fruit and tree nuts 166 operations 3 Revenue from fruits, tree nuts, and berries $14,487,000 7
Dairy farms 4 farms Revenue from milk and other dairy (D)
All animal operations 112 operations
Agricultural Land
Total number of farms 494 Total farmland5 59,481 acres
Forage/pasture/non-crop farmland6 11,612 acres Number of farms using certified organic production 6 Number of farms transitioning to organic production 89 Area of greenhouse/nursery operations (sq. ft) N/A

Michigan Food and Agricultural Systems Profiles
Agricultural Chemicals7 Number Percent of MI Total
Fertilizer manufacturers, distributors, and storage facilities 1 0.52% Pesticide storage facilities 0 0.0 %
Processing and Warehousing
Wholesale food processing plants 49 2.45% Food warehouses 12 1.08% Controlled atmosphere storage facilities 0 0.0 % Dairy processing plants 2 2.53% Dairy warehouse, transfer, and truck cleaning facilities 0 0.0 % Slaughter facilities (MDARD licensed) 0 0.0 % Meat processing plants (MDARD licensed) 37 1.46% Rendering facilities 0 Commercial feed manufacturing facilities 0 Ethanol plants
Retailing and distribution8
Food service establishments (all) 109 0.35% Retail food establishments 68 0.48% Total amount spent by consumers on food (estimate)8 $59,557,188 0.24% Emergency food distribution sites9 2 0.09%
Pounds distributed 40,140 0.05% Students eligible for free or reduced school lunch10 875 0.12% Households receiving FAP (SNAP) benefits11 1,832 0.1 %
Total federal funding for SNAP $2,896,728 0.1 % Pet population (estimate) 12 11,819 Port(s) of entry none
Local Distribution13
Farmers’ markets 7 U-pick farms/On-farm markets 3 Farms using community Supported Agriculture 10 1 United States Census Bureau State & County Quick Facts: Michigan, http://quickfacts.census.gov/qfd/states/26000.html 2 Michigan Economic Development Corporation Regional Economic Profiles http://www.michiganbusiness.org/cm/Files/Reports/Regional_Economy/Michigan-Economy-Overview.pdf 3 Michigan Farm Bureau, Treasures of Michigan Agriculture, https://www.michfb.com/MI/Treasures/ 4 USDA 2012 AgCensus Statewide profile http://www.agcensus.usda.gov/Publications/2012/Online_Resources/County_Profiles/Michigan/cp99026.pdf 5 Totals from 2012 USDA AgCensus available from National Agricultural Statistics Service http://quickstats.nass.usda.gov/ 6 Includes non-crop farmland, pasture, and woodland pasture acreage 7 Michigan Department of Agriculture and Rural Development, Annual Reports, http://www.michigan.gov/mdard/0,4610,7-125-2968_4811---,00.html 8 Calculated from US Census estimated households in state with Bureau of Labor Statistics estimate of $6,393/household expenditure for food. 9 Food Bank Council of Michigan, http://www.fbcmich.org/site/DocServer/Michigan_Blueprint_to_End_Hunger_2008_web.pdf?docID=1921 estimates rounded to nearest integer 10 Michigan League for Public Policy, Kids Count in Michigan 2013 overview, http://www.mlpp.org/kids-count/michigan-2/mi-data-book-2013 11 USDA measure for 2013 http://www.fns.usda.gov/pd/supplemental-nutrition-assistance-program-snap 12 From 2012 population estimates (US Census Bureau) formula via Ohio Dept of Ag Animal Emergency Response Plan, 2006. Includes dogs, cats, birds, rabbits, rodents, and turtles. 13 Michigan Agritourism Association http://www.michiganfarmfun.com/index.php?option=com_mtree&Itemid=3

Michigan Food and Agricultural Systems Profiles
LENAWEE
Area1 749.56 square miles Population2 99,640 Largest City Adrian Watershed(s) Maumee, Raisin
Top Commodities by Volume of Sales3
•Grains, oilseeds, dry beans, and dry peas •Milk and other dairy products from cows •Cattle and calves •Vegetables, melons, potatoes, and sweet potatoes •Hogs and pigs •Nursery, greenhouse, floriculture, and sod
•Cut Christmas trees and short rotation woody crops •Horses, ponies, mules, burros, and donkeys •Other animals and other animal products •Sheep, goats, and their products •Poultry and eggs
Top Commodities by Acreage
•Soybeans •Corn •Cattle
Agricultural Revenues4 Amount MI top 20 ranking
Total market value of agriculture production $204,571,000 14 Total crop sales $144,060,000 16 Total livestock sales $60,511,000 13
Key Michigan Products
Corn, soy, and wheat 247,066 acres ( 76.76% of cropland)
2
Revenue from corn, soy, and wheat $129,191,000 7 Vegetables 5,000 acres ( 1.55% of cropland) 19
Revenue from vegetables $6,573,000 16 Fruit and tree nuts 32 operations 15
Revenue from fruits, tree nuts, and berries $3,698,000 13 Dairy farms 25 farms
Revenue from milk and other dairy (D) All animal operations 394 operations 15
Agricultural Land
Total number of farms 1,618 1 Total farmland5 344,347 acres 3
Forage/pasture/non-crop farmland6 22,494 acres 20 Number of farms using certified organic production 2 Number of farms transitioning to organic production 91 Area of greenhouse/nursery operations (sq. ft) 9,950

Michigan Food and Agricultural Systems Profiles
Agricultural Chemicals7 Number Percent of MI Total
Fertilizer manufacturers, distributors, and storage facilities 9 4.71% Pesticide storage facilities 10 6.76%
Processing and Warehousing
Wholesale food processing plants 18 0.9 % Food warehouses 6 0.54% Controlled atmosphere storage facilities 1 1.52% Dairy processing plants 3 3.8 % Dairy warehouse, transfer, and truck cleaning facilities 0 0.0 % Slaughter facilities (MDARD licensed) 0 0.0 % Meat processing plants (MDARD licensed) 18 0.71% Rendering facilities 3 Commercial feed manufacturing facilities 0 Ethanol plants Green Plains Renewable Energy
Retailing and distribution8
Food service establishments (all) 306 0.97% Retail food establishments 107 0.75% Total amount spent by consumers on food (estimate)8 $240,319,263 0.98% Emergency food distribution sites9 17 0.73%
Pounds distributed 310,005 0.4 % Students eligible for free or reduced school lunch10 7,067 0.96% Households receiving FAP (SNAP) benefits11 17,234 0.9 %
Total federal funding for SNAP $27,250,111 0.9 % Pet population (estimate) 12 54,323 Port(s) of entry none
Local Distribution13
Farmers’ markets 2 U-pick farms/On-farm markets 1 Farms using community Supported Agriculture 4 1 United States Census Bureau State & County Quick Facts: Michigan, http://quickfacts.census.gov/qfd/states/26000.html 2 Michigan Economic Development Corporation Regional Economic Profiles http://www.michiganbusiness.org/cm/Files/Reports/Regional_Economy/Michigan-Economy-Overview.pdf 3 Michigan Farm Bureau, Treasures of Michigan Agriculture, https://www.michfb.com/MI/Treasures/ 4 USDA 2012 AgCensus Statewide profile http://www.agcensus.usda.gov/Publications/2012/Online_Resources/County_Profiles/Michigan/cp99026.pdf 5 Totals from 2012 USDA AgCensus available from National Agricultural Statistics Service http://quickstats.nass.usda.gov/ 6 Includes non-crop farmland, pasture, and woodland pasture acreage 7 Michigan Department of Agriculture and Rural Development, Annual Reports, http://www.michigan.gov/mdard/0,4610,7-125-2968_4811---,00.html 8 Calculated from US Census estimated households in state with Bureau of Labor Statistics estimate of $6,393/household expenditure for food. 9 Food Bank Council of Michigan, http://www.fbcmich.org/site/DocServer/Michigan_Blueprint_to_End_Hunger_2008_web.pdf?docID=1921 estimates rounded to nearest integer 10 Michigan League for Public Policy, Kids Count in Michigan 2013 overview, http://www.mlpp.org/kids-count/michigan-2/mi-data-book-2013 11 USDA measure for 2013 http://www.fns.usda.gov/pd/supplemental-nutrition-assistance-program-snap 12 From 2012 population estimates (US Census Bureau) formula via Ohio Dept of Ag Animal Emergency Response Plan, 2006. Includes dogs, cats, birds, rabbits, rodents, and turtles. 13 Michigan Agritourism Association http://www.michiganfarmfun.com/index.php?option=com_mtree&Itemid=3

Michigan Food and Agricultural Systems Profiles
LIVINGSTON
Area1 565.25 square miles Population2 180,999 Largest City Howell Watershed(s) Saginaw, Huron, Grand
Top Commodities by Volume of Sales3
•Grains, oilseeds, dry beans, and dry peas •Milk and other dairy products from cows •Nursery, greenhouse, floriculture, and sod •Cattle and calves •Horses, ponies, mules, burros, and donkeys
•Other animals and other animal products •Fruits, tree nuts, and berries •Cut Christmas trees and short rotation woody crops •Sheep, goats, and their products •Poultry and eggs
Top Commodities by Acreage
•Corn •Soybeans •Cattle
Agricultural Revenues4 Amount MI top 20 ranking
Total market value of agriculture production $52,251,000 Total crop sales $38,712,000 Total livestock sales $13,539,000
Key Michigan Products
Corn, soy, and wheat 45,242 acres ( 65.29% of cropland) Revenue from corn, soy, and wheat $25,114,000
Vegetables 735 acres ( 1.06% of cropland) Revenue from vegetables $46,379
Fruit and tree nuts 12 operations Revenue from fruits, tree nuts, and berries $124,000
Dairy farms 8 farms Revenue from milk and other dairy $12,221,000
All animal operations 289 operations
Agricultural Land
Total number of farms 734 Total farmland5 86,141 acres
Forage/pasture/non-crop farmland6 16,852 acres Number of farms using certified organic production 2 Number of farms transitioning to organic production 93 Area of greenhouse/nursery operations (sq. ft) N/A

Michigan Food and Agricultural Systems Profiles
Agricultural Chemicals7 Number Percent of MI Total
Fertilizer manufacturers, distributors, and storage facilities 2 1.05% Pesticide storage facilities 2 1.35%
Processing and Warehousing
Wholesale food processing plants 22 1.1 % Food warehouses 12 1.08% Controlled atmosphere storage facilities 0 0.0 % Dairy processing plants 1 1.27% Dairy warehouse, transfer, and truck cleaning facilities 0 0.0 % Slaughter facilities (MDARD licensed) 0 0.0 % Meat processing plants (MDARD licensed) 36 1.42% Rendering facilities 0 Commercial feed manufacturing facilities 0 Ethanol plants
Retailing and distribution8
Food service establishments (all) 408 1.3 % Retail food establishments 164 1.15% Total amount spent by consumers on food (estimate)8 $430,881,807 1.76% Emergency food distribution sites9 13 0.55%
Pounds distributed 1,538,700 1.99% Students eligible for free or reduced school lunch10 5,912 0.81% Households receiving FAP (SNAP) benefits11 14,775 0.77%
Total federal funding for SNAP $23,361,982 0.77% Pet population (estimate) 12 98,680 Port(s) of entry none
Local Distribution13
Farmers’ markets 7 U-pick farms/On-farm markets 6 Farms using community Supported Agriculture 6 1 United States Census Bureau State & County Quick Facts: Michigan, http://quickfacts.census.gov/qfd/states/26000.html 2 Michigan Economic Development Corporation Regional Economic Profiles http://www.michiganbusiness.org/cm/Files/Reports/Regional_Economy/Michigan-Economy-Overview.pdf 3 Michigan Farm Bureau, Treasures of Michigan Agriculture, https://www.michfb.com/MI/Treasures/ 4 USDA 2012 AgCensus Statewide profile http://www.agcensus.usda.gov/Publications/2012/Online_Resources/County_Profiles/Michigan/cp99026.pdf 5 Totals from 2012 USDA AgCensus available from National Agricultural Statistics Service http://quickstats.nass.usda.gov/ 6 Includes non-crop farmland, pasture, and woodland pasture acreage 7 Michigan Department of Agriculture and Rural Development, Annual Reports, http://www.michigan.gov/mdard/0,4610,7-125-2968_4811---,00.html 8 Calculated from US Census estimated households in state with Bureau of Labor Statistics estimate of $6,393/household expenditure for food. 9 Food Bank Council of Michigan, http://www.fbcmich.org/site/DocServer/Michigan_Blueprint_to_End_Hunger_2008_web.pdf?docID=1921 estimates rounded to nearest integer 10 Michigan League for Public Policy, Kids Count in Michigan 2013 overview, http://www.mlpp.org/kids-count/michigan-2/mi-data-book-2013 11 USDA measure for 2013 http://www.fns.usda.gov/pd/supplemental-nutrition-assistance-program-snap 12 From 2012 population estimates (US Census Bureau) formula via Ohio Dept of Ag Animal Emergency Response Plan, 2006. Includes dogs, cats, birds, rabbits, rodents, and turtles. 13 Michigan Agritourism Association http://www.michiganfarmfun.com/index.php?option=com_mtree&Itemid=3

Michigan Food and Agricultural Systems Profiles
LUCE
Area1 899.08 square miles Population2 6,599 Largest City Newberry Watershed(s) Tahquemenon, Two Hearted, Manistique
Top Commodities by Volume of Sales3
•Cattle and calves •Other animals and other animal products •Fruits, tree nuts, and berries
•Other crops and hay •Poultry and eggs
Top Commodities by Acreage
•Forage •Vegetables •Cattle
Agricultural Revenues4 Amount MI top 20 ranking
Total market value of agriculture production $3,615,000 Total crop sales $2,954,000 Total livestock sales $661,000
Key Michigan Products
Corn, soy, and wheat acres ( .00% of cropland) Revenue from corn, soy, and wheat $
Vegetables 5 acres ( .07% of cropland) Revenue from vegetables $
Fruit and tree nuts 1 operations Revenue from fruits, tree nuts, and berries N/A
Dairy farms N/A farms Revenue from milk and other dairy N/A
All animal operations 18 operations
Agricultural Land
Total number of farms 43 Total farmland5 11,599 acres
Forage/pasture/non-crop farmland6 4,825 acres Number of farms using certified organic production 0 Number of farms transitioning to organic production 0 Area of greenhouse/nursery operations (sq. ft) n/a

Michigan Food and Agricultural Systems Profiles
Agricultural Chemicals7 Number Percent of MI Total
Fertilizer manufacturers, distributors, and storage facilities 0 0.0 % Pesticide storage facilities 0 0.0 %
Processing and Warehousing
Wholesale food processing plants 1 0.05% Food warehouses 3 0.27% Controlled atmosphere storage facilities 0 0.0 % Dairy processing plants 0 0.0 % Dairy warehouse, transfer, and truck cleaning facilities 0 0.0 % Slaughter facilities (MDARD licensed) 0 0.0 % Meat processing plants (MDARD licensed) 3 0.12% Rendering facilities 0 Commercial feed manufacturing facilities 0 Ethanol plants
Retailing and distribution8
Food service establishments (all) 34 0.11% Retail food establishments 16 0.11% Total amount spent by consumers on food (estimate)8 $15,368,772 0.06% Emergency food distribution sites9 4 0.15%
Pounds distributed 45,402 0.06% Students eligible for free or reduced school lunch10 346 0.05% Households receiving FAP (SNAP) benefits11 1,116 0.06%
Total federal funding for SNAP $1,764,600 0.06% Pet population (estimate) 12 3,598 Port(s) of entry none
Local Distribution13
Farmers’ markets 1 U-pick farms/On-farm markets 1 Farms using community Supported Agriculture 1 1 United States Census Bureau State & County Quick Facts: Michigan, http://quickfacts.census.gov/qfd/states/26000.html 2 Michigan Economic Development Corporation Regional Economic Profiles http://www.michiganbusiness.org/cm/Files/Reports/Regional_Economy/Michigan-Economy-Overview.pdf 3 Michigan Farm Bureau, Treasures of Michigan Agriculture, https://www.michfb.com/MI/Treasures/ 4 USDA 2012 AgCensus Statewide profile http://www.agcensus.usda.gov/Publications/2012/Online_Resources/County_Profiles/Michigan/cp99026.pdf 5 Totals from 2012 USDA AgCensus available from National Agricultural Statistics Service http://quickstats.nass.usda.gov/ 6 Includes non-crop farmland, pasture, and woodland pasture acreage 7 Michigan Department of Agriculture and Rural Development, Annual Reports, http://www.michigan.gov/mdard/0,4610,7-125-2968_4811---,00.html 8 Calculated from US Census estimated households in state with Bureau of Labor Statistics estimate of $6,393/household expenditure for food. 9 Food Bank Council of Michigan, http://www.fbcmich.org/site/DocServer/Michigan_Blueprint_to_End_Hunger_2008_web.pdf?docID=1921 estimates rounded to nearest integer 10 Michigan League for Public Policy, Kids Count in Michigan 2013 overview, http://www.mlpp.org/kids-count/michigan-2/mi-data-book-2013 11 USDA measure for 2013 http://www.fns.usda.gov/pd/supplemental-nutrition-assistance-program-snap 12 From 2012 population estimates (US Census Bureau) formula via Ohio Dept of Ag Animal Emergency Response Plan, 2006. Includes dogs, cats, birds, rabbits, rodents, and turtles. 13 Michigan Agritourism Association http://www.michiganfarmfun.com/index.php?option=com_mtree&Itemid=3

Michigan Food and Agricultural Systems Profiles
MACKINAC
Area1 1,021.57 square miles Population2 11,087 Largest City St. Ignace Watershed(s) Tahquemenon, Carp, Manistique
Top Commodities by Volume of Sales3
•Milk and other dairy products from cows •Cattle and calves •Other crops and hay •Grains, oilseeds, dry beans, and dry peas
•Horses, ponies, mules, burros, and donkeys •Hogs and pigs •Sheep, goats, and their products •Poultry and eggs
Top Commodities by Acreage
•Forage •Corn •Cattle
Agricultural Revenues4 Amount MI top 20 ranking
Total market value of agriculture production $5,360,000 Total crop sales $1,185,000 Total livestock sales $4,175,000
Key Michigan Products
Corn, soy, and wheat 1,033 acres ( 6.41% of cropland) Revenue from corn, soy, and wheat $136,000
Vegetables 7 acres ( .04% of cropland) Revenue from vegetables $21,000
Fruit and tree nuts 4 operations Revenue from fruits, tree nuts, and berries N/A
Dairy farms 4 farms Revenue from milk and other dairy $24,731,000 19
All animal operations 57 operations
Agricultural Land
Total number of farms 103 Total farmland5 22,420 acres
Forage/pasture/non-crop farmland6 6,310 acres Number of farms using certified organic production 0 Number of farms transitioning to organic production 0 Area of greenhouse/nursery operations (sq. ft) n/a

Michigan Food and Agricultural Systems Profiles
Agricultural Chemicals7 Number Percent of MI Total
Fertilizer manufacturers, distributors, and storage facilities 0 0.0 % Pesticide storage facilities 0 0.0 %
Processing and Warehousing
Wholesale food processing plants 11 0.55% Food warehouses 5 0.45% Controlled atmosphere storage facilities 0 0.0 % Dairy processing plants 4 5.06% Dairy warehouse, transfer, and truck cleaning facilities 0 0.0 % Slaughter facilities (MDARD licensed) 0 0.0 % Meat processing plants (MDARD licensed) 15 0.59% Rendering facilities 0 Commercial feed manufacturing facilities 0 Ethanol plants
Retailing and distribution8
Food service establishments (all) 145 0.46% Retail food establishments 59 0.41% Total amount spent by consumers on food (estimate)8 $31,581,420 0.13% Emergency food distribution sites9 8 0.32%
Pounds distributed 30,487 0.04% Students eligible for free or reduced school lunch10 700 0.1 % Households receiving FAP (SNAP) benefits11 1,503 0.08%
Total federal funding for SNAP $2,376,518 0.08% Pet population (estimate) 12 6,045 Port(s) of entry none
Local Distribution13
Farmers’ markets 1 U-pick farms/On-farm markets 2 Farms using community Supported Agriculture 4 1 United States Census Bureau State & County Quick Facts: Michigan, http://quickfacts.census.gov/qfd/states/26000.html 2 Michigan Economic Development Corporation Regional Economic Profiles http://www.michiganbusiness.org/cm/Files/Reports/Regional_Economy/Michigan-Economy-Overview.pdf 3 Michigan Farm Bureau, Treasures of Michigan Agriculture, https://www.michfb.com/MI/Treasures/ 4 USDA 2012 AgCensus Statewide profile http://www.agcensus.usda.gov/Publications/2012/Online_Resources/County_Profiles/Michigan/cp99026.pdf 5 Totals from 2012 USDA AgCensus available from National Agricultural Statistics Service http://quickstats.nass.usda.gov/ 6 Includes non-crop farmland, pasture, and woodland pasture acreage 7 Michigan Department of Agriculture and Rural Development, Annual Reports, http://www.michigan.gov/mdard/0,4610,7-125-2968_4811---,00.html 8 Calculated from US Census estimated households in state with Bureau of Labor Statistics estimate of $6,393/household expenditure for food. 9 Food Bank Council of Michigan, http://www.fbcmich.org/site/DocServer/Michigan_Blueprint_to_End_Hunger_2008_web.pdf?docID=1921 estimates rounded to nearest integer 10 Michigan League for Public Policy, Kids Count in Michigan 2013 overview, http://www.mlpp.org/kids-count/michigan-2/mi-data-book-2013 11 USDA measure for 2013 http://www.fns.usda.gov/pd/supplemental-nutrition-assistance-program-snap 12 From 2012 population estimates (US Census Bureau) formula via Ohio Dept of Ag Animal Emergency Response Plan, 2006. Includes dogs, cats, birds, rabbits, rodents, and turtles. 13 Michigan Agritourism Association http://www.michiganfarmfun.com/index.php?option=com_mtree&Itemid=3

Michigan Food and Agricultural Systems Profiles
MACOMB
Area1 479.22 square miles Population2 841,184 Largest City Warren Watershed(s) Clinton, Belle
Top Commodities by Volume of Sales3
•Nursery, greenhouse, floriculture, and sod •Grains, oilseeds, dry beans, and dry peas •Vegetables, melons, potatoes, and sweet potatoes •Cattle and calves •Fruits, tree nuts, and berries •Milk and other dairy products from cows
•Other animals and other animal products •Horses, ponies, mules, burros, and donkeys •Aquaculture •Poultry and eggs •Hogs and pigs •Sheep, goats, and their products
Top Commodities by Acreage
•Soybeans •Corn •Cattle
Agricultural Revenues4 Amount MI top 20 ranking
Total market value of agriculture production $73,242,000 Total crop sales $58,381,000 Total livestock sales $14,861,000
Key Michigan Products
Corn, soy, and wheat 45,593 acres ( 74.13% of cropland) Revenue from corn, soy, and wheat $26,459,000
Vegetables 3,134 acres ( 5.10% of cropland) Revenue from vegetables $8,983,125 12
Fruit and tree nuts 16 operations Revenue from fruits, tree nuts, and berries N/A
Dairy farms 11 farms Revenue from milk and other dairy $21,815,000
All animal operations 150 operations
Agricultural Land
Total number of farms 502 Total farmland5 67,960 acres
Forage/pasture/non-crop farmland6 6,456 acres Number of farms using certified organic production 4 Number of farms transitioning to organic production 0 Area of greenhouse/nursery operations (sq. ft) 6,840

Michigan Food and Agricultural Systems Profiles
Agricultural Chemicals7 Number Percent of MI Total
Fertilizer manufacturers, distributors, and storage facilities 6 3.14% Pesticide storage facilities 5 3.38%
Processing and Warehousing
Wholesale food processing plants 73 3.66% Food warehouses 44 3.94% Controlled atmosphere storage facilities 3 4.55% Dairy processing plants 0 0.0 % Dairy warehouse, transfer, and truck cleaning facilities 0 0.0 % Slaughter facilities (MDARD licensed) 0 0.0 % Meat processing plants (MDARD licensed) 131 5.17% Rendering facilities 0 Commercial feed manufacturing facilities 0 Ethanol plants
Retailing and distribution8
Food service establishments (all) 2301 7.31% Retail food establishments 1065 7.44% Total amount spent by consumers on food (estimate)8 $2,113,500,228 8.66% Emergency food distribution sites9 25 1.06%
Pounds distributed 1,651,400 2.14% Students eligible for free or reduced school lunch10 59,403 8.1 % Households receiving FAP (SNAP) benefits11 128,170 6.7 %
Total federal funding for SNAP $202,660,250 6.7 % Pet population (estimate) 12 458,612 Port(s) of entry none
Local Distribution13
Farmers’ markets 8 U-pick farms/On-farm markets 7 Farms using community Supported Agriculture 5 1 United States Census Bureau State & County Quick Facts: Michigan, http://quickfacts.census.gov/qfd/states/26000.html 2 Michigan Economic Development Corporation Regional Economic Profiles http://www.michiganbusiness.org/cm/Files/Reports/Regional_Economy/Michigan-Economy-Overview.pdf 3 Michigan Farm Bureau, Treasures of Michigan Agriculture, https://www.michfb.com/MI/Treasures/ 4 USDA 2012 AgCensus Statewide profile http://www.agcensus.usda.gov/Publications/2012/Online_Resources/County_Profiles/Michigan/cp99026.pdf 5 Totals from 2012 USDA AgCensus available from National Agricultural Statistics Service http://quickstats.nass.usda.gov/ 6 Includes non-crop farmland, pasture, and woodland pasture acreage 7 Michigan Department of Agriculture and Rural Development, Annual Reports, http://www.michigan.gov/mdard/0,4610,7-125-2968_4811---,00.html 8 Calculated from US Census estimated households in state with Bureau of Labor Statistics estimate of $6,393/household expenditure for food. 9 Food Bank Council of Michigan, http://www.fbcmich.org/site/DocServer/Michigan_Blueprint_to_End_Hunger_2008_web.pdf?docID=1921 estimates rounded to nearest integer 10 Michigan League for Public Policy, Kids Count in Michigan 2013 overview, http://www.mlpp.org/kids-count/michigan-2/mi-data-book-2013 11 USDA measure for 2013 http://www.fns.usda.gov/pd/supplemental-nutrition-assistance-program-snap 12 From 2012 population estimates (US Census Bureau) formula via Ohio Dept of Ag Animal Emergency Response Plan, 2006. Includes dogs, cats, birds, rabbits, rodents, and turtles. 13 Michigan Agritourism Association http://www.michiganfarmfun.com/index.php?option=com_mtree&Itemid=3

Michigan Food and Agricultural Systems Profiles
MANISTEE
Area1 542.15 square miles Population2 24,547 Largest City Manistee Watershed(s) Manistee, Betsie
Top Commodities by Volume of Sales3
•Fruits, tree nuts, and berries •Nursery, greenhouse, floriculture, and sod •Cattle and calves •Cut Christmas trees and short rotation woody crops
•Vegetables, melons, potatoes, and sweet potatoes •Other crops and hay
•Grains, oilseeds, dry beans, and dry peas •Milk and other dairy products from cows •Sheep, goats, and their products •Hogs and pigs •Horses, ponies, mules, burros, and donkeys
Top Commodities by Acreage
•Forage •Corn •Layers
Agricultural Revenues4 Amount MI top 20 ranking
Total market value of agriculture production $7,628,000 Total crop sales $6,492,000 Total livestock sales $1,136,000
Key Michigan Products
Corn, soy, and wheat 4,556 acres ( 13.15% of cropland) Revenue from corn, soy, and wheat $1,682,000
Vegetables 664 acres ( 1.92% of cropland) Revenue from vegetables $1,137,918
Fruit and tree nuts 25 operations 18 Revenue from fruits, tree nuts, and berries $1,457,000 18
Dairy farms 1 farms Revenue from milk and other dairy $5,305,000
All animal operations 123 operations
Agricultural Land
Total number of farms 324 Total farmland5 44,298 acres
Forage/pasture/non-crop farmland6 9,645 acres Number of farms using certified organic production 1 Number of farms transitioning to organic production 0 Area of greenhouse/nursery operations (sq. ft) n/a

Michigan Food and Agricultural Systems Profiles
Agricultural Chemicals7 Number Percent of MI Total
Fertilizer manufacturers, distributors, and storage facilities 1 0.52% Pesticide storage facilities 1 0.68%
Processing and Warehousing
Wholesale food processing plants 14 0.7 % Food warehouses 4 0.36% Controlled atmosphere storage facilities 1 1.52% Dairy processing plants 1 1.27% Dairy warehouse, transfer, and truck cleaning facilities 0 0.0 % Slaughter facilities (MDARD licensed) 0 0.0 % Meat processing plants (MDARD licensed) 14 0.55% Rendering facilities 0 Commercial feed manufacturing facilities 0 Ethanol plants
Retailing and distribution8
Food service establishments (all) 112 0.36% Retail food establishments 58 0.41% Total amount spent by consumers on food (estimate)8 $68,072,664 0.28% Emergency food distribution sites9 9 0.39%
Pounds distributed 162,302 0.21% Students eligible for free or reduced school lunch10 1,747 0.24% Households receiving FAP (SNAP) benefits11 4,596 0.24%
Total federal funding for SNAP $7,267,118 0.24% Pet population (estimate) 12 13,383 Port(s) of entry none
Local Distribution13
Farmers’ markets 1 U-pick farms/On-farm markets 2 Farms using community Supported Agriculture 5 1 United States Census Bureau State & County Quick Facts: Michigan, http://quickfacts.census.gov/qfd/states/26000.html 2 Michigan Economic Development Corporation Regional Economic Profiles http://www.michiganbusiness.org/cm/Files/Reports/Regional_Economy/Michigan-Economy-Overview.pdf 3 Michigan Farm Bureau, Treasures of Michigan Agriculture, https://www.michfb.com/MI/Treasures/ 4 USDA 2012 AgCensus Statewide profile http://www.agcensus.usda.gov/Publications/2012/Online_Resources/County_Profiles/Michigan/cp99026.pdf 5 Totals from 2012 USDA AgCensus available from National Agricultural Statistics Service http://quickstats.nass.usda.gov/ 6 Includes non-crop farmland, pasture, and woodland pasture acreage 7 Michigan Department of Agriculture and Rural Development, Annual Reports, http://www.michigan.gov/mdard/0,4610,7-125-2968_4811---,00.html 8 Calculated from US Census estimated households in state with Bureau of Labor Statistics estimate of $6,393/household expenditure for food. 9 Food Bank Council of Michigan, http://www.fbcmich.org/site/DocServer/Michigan_Blueprint_to_End_Hunger_2008_web.pdf?docID=1921 estimates rounded to nearest integer 10 Michigan League for Public Policy, Kids Count in Michigan 2013 overview, http://www.mlpp.org/kids-count/michigan-2/mi-data-book-2013 11 USDA measure for 2013 http://www.fns.usda.gov/pd/supplemental-nutrition-assistance-program-snap 12 From 2012 population estimates (US Census Bureau) formula via Ohio Dept of Ag Animal Emergency Response Plan, 2006. Includes dogs, cats, birds, rabbits, rodents, and turtles. 13 Michigan Agritourism Association http://www.michiganfarmfun.com/index.php?option=com_mtree&Itemid=3

Michigan Food and Agricultural Systems Profiles
MARQUETTE
Area1 1,808.40 square miles Population2 67,098 Largest City Marquette Watershed(s) Escanaba, Menominee, Chocolay, Dead, Ford
Top Commodities by Volume of Sales3
•Milk and other dairy products from cows •Vegetables, melons, potatoes, and sweet potatoes •Other crops and hay •Cattle and calves •Grains, oilseeds, dry beans, and dry peas
•Horses, ponies, mules, burros, and donkeys •Poultry and eggs •Other crops and hay •Sheep, goats, and their products
Top Commodities by Acreage
•Forage •Corn •Cattle
Agricultural Revenues4 Amount MI top 20 ranking
Total market value of agriculture production $2,297,000 Total crop sales $815,000 Total livestock sales $1,482,000
Key Michigan Products
Corn, soy, and wheat 256 acres ( 1.31% of cropland) Revenue from corn, soy, and wheat $6,000
Vegetables 88 acres ( .45% of cropland) Revenue from vegetables $127,000
Fruit and tree nuts 13 operations Revenue from fruits, tree nuts, and berries N/A
Dairy farms 1 farms Revenue from milk and other dairy $9,003,000
All animal operations 81 operations
Agricultural Land
Total number of farms 168 Total farmland5 30,693 acres
Forage/pasture/non-crop farmland6 11,134 acres Number of farms using certified organic production 1 Number of farms transitioning to organic production 0 Area of greenhouse/nursery operations (sq. ft) n/a

Michigan Food and Agricultural Systems Profiles
Agricultural Chemicals7 Number Percent of MI Total
Fertilizer manufacturers, distributors, and storage facilities 1 0.52% Pesticide storage facilities 0 0.0 %
Processing and Warehousing
Wholesale food processing plants 15 0.75% Food warehouses 16 1.43% Controlled atmosphere storage facilities 0 0.0 % Dairy processing plants 1 1.27% Dairy warehouse, transfer, and truck cleaning facilities 0 0.0 % Slaughter facilities (MDARD licensed) 0 0.0 % Meat processing plants (MDARD licensed) 28 1.1 % Rendering facilities 0 Commercial feed manufacturing facilities 0 Ethanol plants
Retailing and distribution8
Food service establishments (all) 254 0.81% Retail food establishments 94 0.66% Total amount spent by consumers on food (estimate)8 $168,289,332 0.69% Emergency food distribution sites9 35 1.49%
Pounds distributed 477,066 0.62% Students eligible for free or reduced school lunch10 3,166 0.43% Households receiving FAP (SNAP) benefits11 10,002 0.52%
Total federal funding for SNAP $15,814,994 0.52% Pet population (estimate) 12 36,582 Port(s) of entry none
Local Distribution13
Farmers’ markets 3 U-pick farms/On-farm markets 0 Farms using community Supported Agriculture 6 1 United States Census Bureau State & County Quick Facts: Michigan, http://quickfacts.census.gov/qfd/states/26000.html 2 Michigan Economic Development Corporation Regional Economic Profiles http://www.michiganbusiness.org/cm/Files/Reports/Regional_Economy/Michigan-Economy-Overview.pdf 3 Michigan Farm Bureau, Treasures of Michigan Agriculture, https://www.michfb.com/MI/Treasures/ 4 USDA 2012 AgCensus Statewide profile http://www.agcensus.usda.gov/Publications/2012/Online_Resources/County_Profiles/Michigan/cp99026.pdf 5 Totals from 2012 USDA AgCensus available from National Agricultural Statistics Service http://quickstats.nass.usda.gov/ 6 Includes non-crop farmland, pasture, and woodland pasture acreage 7 Michigan Department of Agriculture and Rural Development, Annual Reports, http://www.michigan.gov/mdard/0,4610,7-125-2968_4811---,00.html 8 Calculated from US Census estimated households in state with Bureau of Labor Statistics estimate of $6,393/household expenditure for food. 9 Food Bank Council of Michigan, http://www.fbcmich.org/site/DocServer/Michigan_Blueprint_to_End_Hunger_2008_web.pdf?docID=1921 estimates rounded to nearest integer 10 Michigan League for Public Policy, Kids Count in Michigan 2013 overview, http://www.mlpp.org/kids-count/michigan-2/mi-data-book-2013 11 USDA measure for 2013 http://www.fns.usda.gov/pd/supplemental-nutrition-assistance-program-snap 12 From 2012 population estimates (US Census Bureau) formula via Ohio Dept of Ag Animal Emergency Response Plan, 2006. Includes dogs, cats, birds, rabbits, rodents, and turtles. 13 Michigan Agritourism Association http://www.michiganfarmfun.com/index.php?option=com_mtree&Itemid=3

Michigan Food and Agricultural Systems Profiles
MASON
Area1 495.07 square miles Population2 28,724 Largest City Ludington Watershed(s) Pentwater, Lincoln, Big Sable
Top Commodities by Volume of Sales3
•Milk and other dairy products from cows •Grains, oilseeds, dry beans, and dry peas •Vegetables, melons, potatoes, and sweet potatoes •Nursery, greenhouse, floriculture, and sod •Other animals and other animal products
•Poultry and eggs •Horses, ponies, mules, burros, and donkeys •Sheep, goats, and their products •Horses, ponies, mules, burros, and donkeys •Aquaculture
Top Commodities by Acreage
•Forage •Corn •Cattle
Agricultural Revenues4 Amount MI top 20 ranking
Total market value of agriculture production $52,880,000 Total crop sales $31,689,000 Total livestock sales $21,191,000
Key Michigan Products
Corn, soy, and wheat 26,118 acres ( 38.68% of cropland) Revenue from corn, soy, and wheat $15,218,000
Vegetables 7,175 acres ( 10.62% of cropland) 14 Revenue from vegetables $6,027,000 17
Fruit and tree nuts 34 operations 14 Revenue from fruits, tree nuts, and berries $6,000,000 10
Dairy farms 16 farms Revenue from milk and other dairy $37,731,000 11
All animal operations 164 operations
Agricultural Land
Total number of farms 440 Total farmland5 79,048 acres
Forage/pasture/non-crop farmland6 11,518 acres Number of farms using certified organic production 1 Number of farms transitioning to organic production 105 Area of greenhouse/nursery operations (sq. ft) n/a

Michigan Food and Agricultural Systems Profiles
Agricultural Chemicals7 Number Percent of MI Total
Fertilizer manufacturers, distributors, and storage facilities 1 0.52% Pesticide storage facilities 0 0.0 %
Processing and Warehousing
Wholesale food processing plants 19 0.95% Food warehouses 5 0.45% Controlled atmosphere storage facilities 1 1.52% Dairy processing plants 2 2.53% Dairy warehouse, transfer, and truck cleaning facilities 0 0.0 % Slaughter facilities (MDARD licensed) 0 0.0 % Meat processing plants (MDARD licensed) 13 0.51% Rendering facilities 0 Commercial feed manufacturing facilities 0 Ethanol plants
Retailing and distribution8
Food service establishments (all) 125 0.4 % Retail food establishments 50 0.35% Total amount spent by consumers on food (estimate)8 $78,864,048 0.32% Emergency food distribution sites9 8 0.34%
Pounds distributed 212,829 0.28% Students eligible for free or reduced school lunch10 2,424 0.33% Households receiving FAP (SNAP) benefits11 5,909 0.31%
Total federal funding for SNAP $9,343,212 0.31% Pet population (estimate) 12 15,660 Port(s) of entry none
Local Distribution13
Farmers’ markets 2 U-pick farms/On-farm markets 1 Farms using community Supported Agriculture 5 1 United States Census Bureau State & County Quick Facts: Michigan, http://quickfacts.census.gov/qfd/states/26000.html 2 Michigan Economic Development Corporation Regional Economic Profiles http://www.michiganbusiness.org/cm/Files/Reports/Regional_Economy/Michigan-Economy-Overview.pdf 3 Michigan Farm Bureau, Treasures of Michigan Agriculture, https://www.michfb.com/MI/Treasures/ 4 USDA 2012 AgCensus Statewide profile http://www.agcensus.usda.gov/Publications/2012/Online_Resources/County_Profiles/Michigan/cp99026.pdf 5 Totals from 2012 USDA AgCensus available from National Agricultural Statistics Service http://quickstats.nass.usda.gov/ 6 Includes non-crop farmland, pasture, and woodland pasture acreage 7 Michigan Department of Agriculture and Rural Development, Annual Reports, http://www.michigan.gov/mdard/0,4610,7-125-2968_4811---,00.html 8 Calculated from US Census estimated households in state with Bureau of Labor Statistics estimate of $6,393/household expenditure for food. 9 Food Bank Council of Michigan, http://www.fbcmich.org/site/DocServer/Michigan_Blueprint_to_End_Hunger_2008_web.pdf?docID=1921 estimates rounded to nearest integer 10 Michigan League for Public Policy, Kids Count in Michigan 2013 overview, http://www.mlpp.org/kids-count/michigan-2/mi-data-book-2013 11 USDA measure for 2013 http://www.fns.usda.gov/pd/supplemental-nutrition-assistance-program-snap 12 From 2012 population estimates (US Census Bureau) formula via Ohio Dept of Ag Animal Emergency Response Plan, 2006. Includes dogs, cats, birds, rabbits, rodents, and turtles. 13 Michigan Agritourism Association http://www.michiganfarmfun.com/index.php?option=com_mtree&Itemid=3
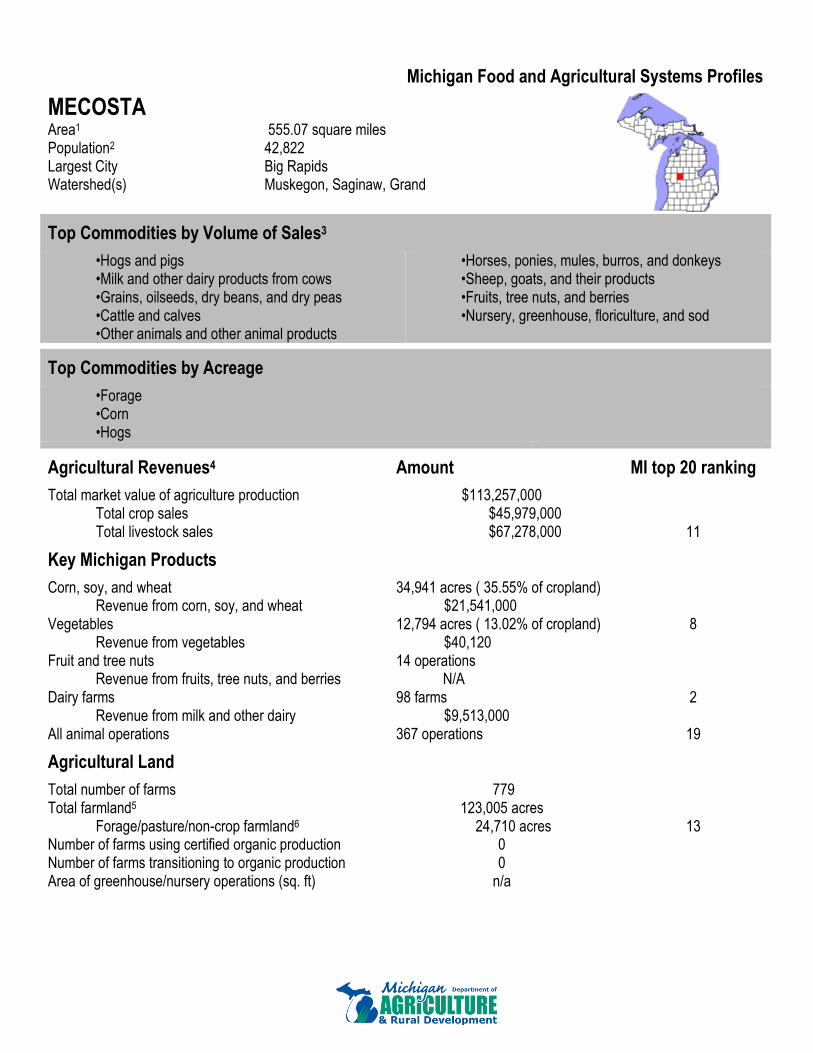
Michigan Food and Agricultural Systems Profiles
MECOSTA
Area1 555.07 square miles Population2 42,822 Largest City Big Rapids Watershed(s) Muskegon, Saginaw, Grand
Top Commodities by Volume of Sales3
•Hogs and pigs •Milk and other dairy products from cows •Grains, oilseeds, dry beans, and dry peas •Cattle and calves •Other animals and other animal products
•Horses, ponies, mules, burros, and donkeys •Sheep, goats, and their products •Fruits, tree nuts, and berries •Nursery, greenhouse, floriculture, and sod
Top Commodities by Acreage
•Forage •Corn •Hogs
Agricultural Revenues4 Amount MI top 20 ranking
Total market value of agriculture production $113,257,000 Total crop sales $45,979,000 Total livestock sales $67,278,000 11
Key Michigan Products
Corn, soy, and wheat 34,941 acres ( 35.55% of cropland) Revenue from corn, soy, and wheat $21,541,000
Vegetables 12,794 acres ( 13.02% of cropland) 8 Revenue from vegetables $40,120
Fruit and tree nuts 14 operations Revenue from fruits, tree nuts, and berries N/A
Dairy farms 98 farms 2 Revenue from milk and other dairy $9,513,000
All animal operations 367 operations 19
Agricultural Land
Total number of farms 779 Total farmland5 123,005 acres
Forage/pasture/non-crop farmland6 24,710 acres 13 Number of farms using certified organic production 0 Number of farms transitioning to organic production 0 Area of greenhouse/nursery operations (sq. ft) n/a

Michigan Food and Agricultural Systems Profiles
Agricultural Chemicals7 Number Percent of MI Total
Fertilizer manufacturers, distributors, and storage facilities 1 0.52% Pesticide storage facilities 1 0.68%
Processing and Warehousing
Wholesale food processing plants 16 0.8 % Food warehouses 5 0.45% Controlled atmosphere storage facilities 0 0.0 % Dairy processing plants 1 1.27% Dairy warehouse, transfer, and truck cleaning facilities 0 0.0 % Slaughter facilities (MDARD licensed) 0 0.0 % Meat processing plants (MDARD licensed) 26 1.03% Rendering facilities 0 Commercial feed manufacturing facilities 0 Ethanol plants
Retailing and distribution8
Food service establishments (all) 132 0.42% Retail food establishments 71 0.5 % Total amount spent by consumers on food (estimate)8 $100,338,135 0.41% Emergency food distribution sites9 8 0.36%
Pounds distributed 228,985 0.3 % Students eligible for free or reduced school lunch10 3,919 0.53% Households receiving FAP (SNAP) benefits11 9,935 0.52%
Total federal funding for SNAP $15,709,055 0.52% Pet population (estimate) 12 23,346 Port(s) of entry none
Local Distribution13
Farmers’ markets 2 U-pick farms/On-farm markets 2 Farms using community Supported Agriculture 5 1 United States Census Bureau State & County Quick Facts: Michigan, http://quickfacts.census.gov/qfd/states/26000.html 2 Michigan Economic Development Corporation Regional Economic Profiles http://www.michiganbusiness.org/cm/Files/Reports/Regional_Economy/Michigan-Economy-Overview.pdf 3 Michigan Farm Bureau, Treasures of Michigan Agriculture, https://www.michfb.com/MI/Treasures/ 4 USDA 2012 AgCensus Statewide profile http://www.agcensus.usda.gov/Publications/2012/Online_Resources/County_Profiles/Michigan/cp99026.pdf 5 Totals from 2012 USDA AgCensus available from National Agricultural Statistics Service http://quickstats.nass.usda.gov/ 6 Includes non-crop farmland, pasture, and woodland pasture acreage 7 Michigan Department of Agriculture and Rural Development, Annual Reports, http://www.michigan.gov/mdard/0,4610,7-125-2968_4811---,00.html 8 Calculated from US Census estimated households in state with Bureau of Labor Statistics estimate of $6,393/household expenditure for food. 9 Food Bank Council of Michigan, http://www.fbcmich.org/site/DocServer/Michigan_Blueprint_to_End_Hunger_2008_web.pdf?docID=1921 estimates rounded to nearest integer 10 Michigan League for Public Policy, Kids Count in Michigan 2013 overview, http://www.mlpp.org/kids-count/michigan-2/mi-data-book-2013 11 USDA measure for 2013 http://www.fns.usda.gov/pd/supplemental-nutrition-assistance-program-snap 12 From 2012 population estimates (US Census Bureau) formula via Ohio Dept of Ag Animal Emergency Response Plan, 2006. Includes dogs, cats, birds, rabbits, rodents, and turtles. 13 Michigan Agritourism Association http://www.michiganfarmfun.com/index.php?option=com_mtree&Itemid=3

Michigan Food and Agricultural Systems Profiles
MENOMINEE
Area1 1,044.08 square miles Population2 23,974 Largest City Menominee Watershed(s) Menominee, Ford, Cedar
Top Commodities by Volume of Sales3
•Milk and other dairy products from cows •Cattle and calves •Grains, oilseeds, dry beans, and dry peas •Other crops and hay •Other animals and other animal products
•Fruits, tree nuts, and berries •Nursery, greenhouse, floriculture, and sod •Vegetables, melons, potatoes, and sweet potatoes •Horses, ponies, mules, burros, and donkeys •Hogs and pigs
Top Commodities by Acreage
•Forage •Corn •Cattle
Agricultural Revenues4 Amount MI top 20 ranking
Total market value of agriculture production $41,402,000 Total crop sales $7,914,000 Total livestock sales $33,488,000
Key Michigan Products
Corn, soy, and wheat 17,003 acres ( 22.32% of cropland) Revenue from corn, soy, and wheat $4,884,000
Vegetables 71 acres ( .09% of cropland) Revenue from vegetables $
Fruit and tree nuts 12 operations Revenue from fruits, tree nuts, and berries $19,000
Dairy farms 39 farms 15 Revenue from milk and other dairy $1,730,000
All animal operations 186 operations
Agricultural Land
Total number of farms 398 Total farmland5 91,900 acres
Forage/pasture/non-crop farmland6 15,719 acres Number of farms using certified organic production 3 Number of farms transitioning to organic production 0 Area of greenhouse/nursery operations (sq. ft) n/a

Michigan Food and Agricultural Systems Profiles
Agricultural Chemicals7 Number Percent of MI Total
Fertilizer manufacturers, distributors, and storage facilities 1 0.52% Pesticide storage facilities 1 0.68%
Processing and Warehousing
Wholesale food processing plants 6 0.3 % Food warehouses 4 0.36% Controlled atmosphere storage facilities 0 0.0 % Dairy processing plants 1 1.27% Dairy warehouse, transfer, and truck cleaning facilities 0 0.0 % Slaughter facilities (MDARD licensed) 0 0.0 % Meat processing plants (MDARD licensed) 19 0.75% Rendering facilities 0 Commercial feed manufacturing facilities 0 Ethanol plants
Retailing and distribution8
Food service establishments (all) 91 0.29% Retail food establishments 35 0.24% Total amount spent by consumers on food (estimate)8 $69,485,517 0.28% Emergency food distribution sites9 1 0.06%
Pounds distributed 5,144 0.01% Students eligible for free or reduced school lunch10 1,643 0.22% Households receiving FAP (SNAP) benefits11 3,938 0.21%
Total federal funding for SNAP $6,226,699 0.21% Pet population (estimate) 12 13,071 Port(s) of entry none
Local Distribution13
Farmers’ markets 5 U-pick farms/On-farm markets 0 Farms using community Supported Agriculture 1 1 United States Census Bureau State & County Quick Facts: Michigan, http://quickfacts.census.gov/qfd/states/26000.html 2 Michigan Economic Development Corporation Regional Economic Profiles http://www.michiganbusiness.org/cm/Files/Reports/Regional_Economy/Michigan-Economy-Overview.pdf 3 Michigan Farm Bureau, Treasures of Michigan Agriculture, https://www.michfb.com/MI/Treasures/ 4 USDA 2012 AgCensus Statewide profile http://www.agcensus.usda.gov/Publications/2012/Online_Resources/County_Profiles/Michigan/cp99026.pdf 5 Totals from 2012 USDA AgCensus available from National Agricultural Statistics Service http://quickstats.nass.usda.gov/ 6 Includes non-crop farmland, pasture, and woodland pasture acreage 7 Michigan Department of Agriculture and Rural Development, Annual Reports, http://www.michigan.gov/mdard/0,4610,7-125-2968_4811---,00.html 8 Calculated from US Census estimated households in state with Bureau of Labor Statistics estimate of $6,393/household expenditure for food. 9 Food Bank Council of Michigan, http://www.fbcmich.org/site/DocServer/Michigan_Blueprint_to_End_Hunger_2008_web.pdf?docID=1921 estimates rounded to nearest integer 10 Michigan League for Public Policy, Kids Count in Michigan 2013 overview, http://www.mlpp.org/kids-count/michigan-2/mi-data-book-2013 11 USDA measure for 2013 http://www.fns.usda.gov/pd/supplemental-nutrition-assistance-program-snap 12 From 2012 population estimates (US Census Bureau) formula via Ohio Dept of Ag Animal Emergency Response Plan, 2006. Includes dogs, cats, birds, rabbits, rodents, and turtles. 13 Michigan Agritourism Association http://www.michiganfarmfun.com/index.php?option=com_mtree&Itemid=3

Michigan Food and Agricultural Systems Profiles
MIDLAND
Area1 516.25 square miles Population2 83,658 Largest City Midland Watershed(s) Saginaw, Kawkawlin
Top Commodities by Volume of Sales3
•Grains, oilseeds, dry beans, and dry peas •Hogs and pigs •Vegetables, melons, potatoes, and sweet potatoes •Horses, ponies, mules, burros, and donkeys
•Other animals and other animal products •Fruits, tree nuts, and berries •Poultry and eggs •Sheep, goats, and their products
Top Commodities by Acreage
•Corn •Soybeans •Cattle
Agricultural Revenues4 Amount MI top 20 ranking
Total market value of agriculture production $70,088,000 Total crop sales $47,595,000 Total livestock sales $22,493,000
Key Michigan Products
Corn, soy, and wheat 49,650 acres ( 61.24% of cropland) Revenue from corn, soy, and wheat $39,690,000
Vegetables 1,408 acres ( 1.74% of cropland) Revenue from vegetables $868,519
Fruit and tree nuts 13 operations Revenue from fruits, tree nuts, and berries $76,000
Dairy farms 2 farms Revenue from milk and other dairy $2,295,000
All animal operations 187 operations
Agricultural Land
Total number of farms 555 Total farmland5 89,543 acres
Forage/pasture/non-crop farmland6 8,469 acres Number of farms using certified organic production 0 Number of farms transitioning to organic production 111 Area of greenhouse/nursery operations (sq. ft) N/A

Michigan Food and Agricultural Systems Profiles
Agricultural Chemicals7 Number Percent of MI Total
Fertilizer manufacturers, distributors, and storage facilities 1 0.52% Pesticide storage facilities 1 0.68%
Processing and Warehousing
Wholesale food processing plants 15 0.75% Food warehouses 9 0.81% Controlled atmosphere storage facilities 0 0.0 % Dairy processing plants 0 0.0 % Dairy warehouse, transfer, and truck cleaning facilities 0 0.0 % Slaughter facilities (MDARD licensed) 0 0.0 % Meat processing plants (MDARD licensed) 27 1.06% Rendering facilities 0 Commercial feed manufacturing facilities 0 Ethanol plants
Retailing and distribution8
Food service establishments (all) 265 0.84% Retail food establishments 102 0.71% Total amount spent by consumers on food (estimate)8 $215,418,528 0.88% Emergency food distribution sites9 25 1.06%
Pounds distributed 393,705 0.51% Students eligible for free or reduced school lunch10 4,346 0.59% Households receiving FAP (SNAP) benefits11 11,669 0.61%
Total federal funding for SNAP $18,450,827 0.61% Pet population (estimate) 12 45,610 Port(s) of entry none
Local Distribution13
Farmers’ markets 2 U-pick farms/On-farm markets 1 Farms using community Supported Agriculture 6 1 United States Census Bureau State & County Quick Facts: Michigan, http://quickfacts.census.gov/qfd/states/26000.html 2 Michigan Economic Development Corporation Regional Economic Profiles http://www.michiganbusiness.org/cm/Files/Reports/Regional_Economy/Michigan-Economy-Overview.pdf 3 Michigan Farm Bureau, Treasures of Michigan Agriculture, https://www.michfb.com/MI/Treasures/ 4 USDA 2012 AgCensus Statewide profile http://www.agcensus.usda.gov/Publications/2012/Online_Resources/County_Profiles/Michigan/cp99026.pdf 5 Totals from 2012 USDA AgCensus available from National Agricultural Statistics Service http://quickstats.nass.usda.gov/ 6 Includes non-crop farmland, pasture, and woodland pasture acreage 7 Michigan Department of Agriculture and Rural Development, Annual Reports, http://www.michigan.gov/mdard/0,4610,7-125-2968_4811---,00.html 8 Calculated from US Census estimated households in state with Bureau of Labor Statistics estimate of $6,393/household expenditure for food. 9 Food Bank Council of Michigan, http://www.fbcmich.org/site/DocServer/Michigan_Blueprint_to_End_Hunger_2008_web.pdf?docID=1921 estimates rounded to nearest integer 10 Michigan League for Public Policy, Kids Count in Michigan 2013 overview, http://www.mlpp.org/kids-count/michigan-2/mi-data-book-2013 11 USDA measure for 2013 http://www.fns.usda.gov/pd/supplemental-nutrition-assistance-program-snap 12 From 2012 population estimates (US Census Bureau) formula via Ohio Dept of Ag Animal Emergency Response Plan, 2006. Includes dogs, cats, birds, rabbits, rodents, and turtles. 13 Michigan Agritourism Association http://www.michiganfarmfun.com/index.php?option=com_mtree&Itemid=3

Michigan Food and Agricultural Systems Profiles
MISSAUKEE
Area1 564.73 square miles Population2 14,816 Largest City Lake City Watershed(s) Muskegon, Manistee
Top Commodities by Volume of Sales3
•Milk and other dairy products from cows •Cattle and calves •Grains, oilseeds, dry beans, and dry peas •Other crops and hay •Vegetables, melons, potatoes, and sweet potatoes
•Other animals and other animal products •Sheep, goats, and their products •Hogs and pigs •Poultry and eggs •Horses, ponies, mules, burros, and donkeys
Top Commodities by Acreage
•Forage •Corn •Cattle
Agricultural Revenues4 Amount MI top 20 ranking
Total market value of agriculture production $126,002,000 Total crop sales $31,202,000 Total livestock sales $94,800,000 8
Key Michigan Products
Corn, soy, and wheat 25,973 acres ( 30.87% of cropland) Revenue from corn, soy, and wheat $10,203,000
Vegetables 322 acres ( .38% of cropland) Revenue from vegetables $1,054,500
Fruit and tree nuts 5 operations Revenue from fruits, tree nuts, and berries $56,000
Dairy farms 51 farms 12 Revenue from milk and other dairy (D)
All animal operations 211 operations
Agricultural Land
Total number of farms 433 Total farmland5 99,510 acres
Forage/pasture/non-crop farmland6 15,361 acres Number of farms using certified organic production 0 Number of farms transitioning to organic production 113 Area of greenhouse/nursery operations (sq. ft) N/A

Michigan Food and Agricultural Systems Profiles
Agricultural Chemicals7 Number Percent of MI Total
Fertilizer manufacturers, distributors, and storage facilities 3 1.57% Pesticide storage facilities 4 2.7 %
Processing and Warehousing
Wholesale food processing plants 10 0.5 % Food warehouses 1 0.09% Controlled atmosphere storage facilities 0 0.0 % Dairy processing plants 0 0.0 % Dairy warehouse, transfer, and truck cleaning facilities 1 9.09% Slaughter facilities (MDARD licensed) 4 8.16% Meat processing plants (MDARD licensed) 12 0.47% Rendering facilities 2 Commercial feed manufacturing facilities 0 Ethanol plants
Retailing and distribution8
Food service establishments (all) 35 0.11% Retail food establishments 21 0.15% Total amount spent by consumers on food (estimate)8 $37,431,015 0.15% Emergency food distribution sites9 8 0.34%
Pounds distributed 114,903 0.15% Students eligible for free or reduced school lunch10 1,283 0.18% Households receiving FAP (SNAP) benefits11 2,824 0.15%
Total federal funding for SNAP $4,465,261 0.15% Pet population (estimate) 12 8,078 Port(s) of entry none
Local Distribution13
Farmers’ markets 0 U-pick farms/On-farm markets 1 Farms using community Supported Agriculture 2 1 United States Census Bureau State & County Quick Facts: Michigan, http://quickfacts.census.gov/qfd/states/26000.html 2 Michigan Economic Development Corporation Regional Economic Profiles http://www.michiganbusiness.org/cm/Files/Reports/Regional_Economy/Michigan-Economy-Overview.pdf 3 Michigan Farm Bureau, Treasures of Michigan Agriculture, https://www.michfb.com/MI/Treasures/ 4 USDA 2012 AgCensus Statewide profile http://www.agcensus.usda.gov/Publications/2012/Online_Resources/County_Profiles/Michigan/cp99026.pdf 5 Totals from 2012 USDA AgCensus available from National Agricultural Statistics Service http://quickstats.nass.usda.gov/ 6 Includes non-crop farmland, pasture, and woodland pasture acreage 7 Michigan Department of Agriculture and Rural Development, Annual Reports, http://www.michigan.gov/mdard/0,4610,7-125-2968_4811---,00.html 8 Calculated from US Census estimated households in state with Bureau of Labor Statistics estimate of $6,393/household expenditure for food. 9 Food Bank Council of Michigan, http://www.fbcmich.org/site/DocServer/Michigan_Blueprint_to_End_Hunger_2008_web.pdf?docID=1921 estimates rounded to nearest integer 10 Michigan League for Public Policy, Kids Count in Michigan 2013 overview, http://www.mlpp.org/kids-count/michigan-2/mi-data-book-2013 11 USDA measure for 2013 http://www.fns.usda.gov/pd/supplemental-nutrition-assistance-program-snap 12 From 2012 population estimates (US Census Bureau) formula via Ohio Dept of Ag Animal Emergency Response Plan, 2006. Includes dogs, cats, birds, rabbits, rodents, and turtles. 13 Michigan Agritourism Association http://www.michiganfarmfun.com/index.php?option=com_mtree&Itemid=3

Michigan Food and Agricultural Systems Profiles
MONROE
Area1 549.39 square miles Population2 151,915 Largest City Monroe Watershed(s) Raisin, Stony Creek, Huron
Top Commodities by Volume of Sales3
•Grains, oilseeds, dry beans, and dry peas •Nursery, greenhouse, floriculture, and sod •Vegetables, melons, potatoes, and sweet potatoes •Cattle and calves •Milk and other dairy products from cows •Aquaculture •Other crops and hay
•Fruits, tree nuts, and berries •Horses, ponies, mules, burros, and donkeys •Hogs and pigs •Other animals and other animal products •Sheep, goats, and their products •Cut Christmas trees and short rotation woody crops •Poultry and eggs
Top Commodities by Acreage
•Corn •Soybeans •Layers
Agricultural Revenues4 Amount MI top 20 ranking
Total market value of agriculture production $173,896,000 18 Total crop sales $166,044,000 11 Total livestock sales $7,852,000
Key Michigan Products
Corn, soy, and wheat 176,239 acres ( 86.68% of cropland)
7
Revenue from corn, soy, and wheat $98,254,000 14 Vegetables 16,930 acres ( 8.33% of cropland) 4
Revenue from vegetables $34,375,000 4 Fruit and tree nuts 34 operations 13
Revenue from fruits, tree nuts, and berries $630,000 19 Dairy farms 5 farms
Revenue from milk and other dairy $4,441,000 All animal operations 245 operations
Agricultural Land
Total number of farms 1,144 12 Total farmland5 214,506 acres 17
Forage/pasture/non-crop farmland6 11,180 acres Number of farms using certified organic production 0 Number of farms transitioning to organic production 115 Area of greenhouse/nursery operations (sq. ft) 39,112

Michigan Food and Agricultural Systems Profiles
Agricultural Chemicals7 Number Percent of MI Total
Fertilizer manufacturers, distributors, and storage facilities 4 2.09% Pesticide storage facilities 2 1.35%
Processing and Warehousing
Wholesale food processing plants 19 0.95% Food warehouses 7 0.63% Controlled atmosphere storage facilities 0 0.0 % Dairy processing plants 2 2.53% Dairy warehouse, transfer, and truck cleaning facilities 0 0.0 % Slaughter facilities (MDARD licensed) 0 0.0 % Meat processing plants (MDARD licensed) 24 0.95% Rendering facilities 0 Commercial feed manufacturing facilities 0 Ethanol plants
Retailing and distribution8
Food service establishments (all) 465 1.48% Retail food establishments 188 1.31% Total amount spent by consumers on food (estimate)8 $372,660,756 1.53% Emergency food distribution sites9 8 0.32%
Pounds distributed 437,225 0.57% Students eligible for free or reduced school lunch10 8,777 1.2 % Households receiving FAP (SNAP) benefits11 20,908 1.09%
Total federal funding for SNAP $33,059,378 1.09% Pet population (estimate) 12 82,824 Port(s) of entry none
Local Distribution13
Farmers’ markets 3 U-pick farms/On-farm markets 3 Farms using community Supported Agriculture 4 1 United States Census Bureau State & County Quick Facts: Michigan, http://quickfacts.census.gov/qfd/states/26000.html 2 Michigan Economic Development Corporation Regional Economic Profiles http://www.michiganbusiness.org/cm/Files/Reports/Regional_Economy/Michigan-Economy-Overview.pdf 3 Michigan Farm Bureau, Treasures of Michigan Agriculture, https://www.michfb.com/MI/Treasures/ 4 USDA 2012 AgCensus Statewide profile http://www.agcensus.usda.gov/Publications/2012/Online_Resources/County_Profiles/Michigan/cp99026.pdf 5 Totals from 2012 USDA AgCensus available from National Agricultural Statistics Service http://quickstats.nass.usda.gov/ 6 Includes non-crop farmland, pasture, and woodland pasture acreage 7 Michigan Department of Agriculture and Rural Development, Annual Reports, http://www.michigan.gov/mdard/0,4610,7-125-2968_4811---,00.html 8 Calculated from US Census estimated households in state with Bureau of Labor Statistics estimate of $6,393/household expenditure for food. 9 Food Bank Council of Michigan, http://www.fbcmich.org/site/DocServer/Michigan_Blueprint_to_End_Hunger_2008_web.pdf?docID=1921 estimates rounded to nearest integer 10 Michigan League for Public Policy, Kids Count in Michigan 2013 overview, http://www.mlpp.org/kids-count/michigan-2/mi-data-book-2013 11 USDA measure for 2013 http://www.fns.usda.gov/pd/supplemental-nutrition-assistance-program-snap 12 From 2012 population estimates (US Census Bureau) formula via Ohio Dept of Ag Animal Emergency Response Plan, 2006. Includes dogs, cats, birds, rabbits, rodents, and turtles. 13 Michigan Agritourism Association http://www.michiganfarmfun.com/index.php?option=com_mtree&Itemid=3

Michigan Food and Agricultural Systems Profiles
MONTCALM
Area1 705.40 square miles Population2 63,261 Largest City Stanton Watershed(s) Grand, Muskegon, Saginaw
Top Commodities by Volume of Sales3
•Vegetables, melons, potatoes, and sweet potatoes •Milk and other dairy products from cows •Grains, oilseeds, dry beans, and dry peas •Cattle and calves •Other crops and hay •Nursery, greenhouse, floriculture, and sod
•Cut Christmas trees and short rotation woody crops •Fruits, tree nuts, and berries •Hogs and pigs •Other animals and other animal products •Horses, ponies, mules, burros, and donkeys •Sheep, goats, and their products
Top Commodities by Acreage
•Corn •Forage •Cattle
Agricultural Revenues4 Amount MI top 20 ranking
Total market value of agriculture production $213,940,000 13 Total crop sales $154,177,000 14 Total livestock sales $59,763,000 14
Key Michigan Products
Corn, soy, and wheat 108,408 acres ( 52.13% of cropland)
Revenue from corn, soy, and wheat $77,740,000 20 Vegetables 41,047 acres ( 19.74% of cropland) 1
Revenue from vegetables $58,534,427 1 Fruit and tree nuts 20 operations
Revenue from fruits, tree nuts, and berries $276,000 Dairy farms 79 farms 4
Revenue from milk and other dairy $7,979,000 All animal operations 460 operations 9
Agricultural Land
Total number of farms 1,127 15 Total farmland5 237,252 acres 12
Forage/pasture/non-crop farmland6 29,278 acres 4 Number of farms using certified organic production 3 Number of farms transitioning to organic production 117 Area of greenhouse/nursery operations (sq. ft) N/A

Michigan Food and Agricultural Systems Profiles
Agricultural Chemicals7 Number Percent of MI Total
Fertilizer manufacturers, distributors, and storage facilities 4 2.09% Pesticide storage facilities 5 3.38%
Processing and Warehousing
Wholesale food processing plants 11 0.55% Food warehouses 1 0.09% Controlled atmosphere storage facilities 0 0.0 % Dairy processing plants 1 1.27% Dairy warehouse, transfer, and truck cleaning facilities 0 0.0 % Slaughter facilities (MDARD licensed) 0 0.0 % Meat processing plants (MDARD licensed) 27 1.06% Rendering facilities 0 Commercial feed manufacturing facilities 0 Ethanol plants
Retailing and distribution8
Food service establishments (all) 190 0.6 % Retail food establishments 111 0.78% Total amount spent by consumers on food (estimate)8 $149,346,873 0.61% Emergency food distribution sites9 28 1.18%
Pounds distributed 795,227 1.03% Students eligible for free or reduced school lunch10 6,635 0.91% Households receiving FAP (SNAP) benefits11 13,564 0.71%
Total federal funding for SNAP $21,447,169 0.71% Pet population (estimate) 12 34,490 Port(s) of entry none
Local Distribution13
Farmers’ markets 4 U-pick farms/On-farm markets 2 Farms using community Supported Agriculture 8 1 United States Census Bureau State & County Quick Facts: Michigan, http://quickfacts.census.gov/qfd/states/26000.html 2 Michigan Economic Development Corporation Regional Economic Profiles http://www.michiganbusiness.org/cm/Files/Reports/Regional_Economy/Michigan-Economy-Overview.pdf 3 Michigan Farm Bureau, Treasures of Michigan Agriculture, https://www.michfb.com/MI/Treasures/ 4 USDA 2012 AgCensus Statewide profile http://www.agcensus.usda.gov/Publications/2012/Online_Resources/County_Profiles/Michigan/cp99026.pdf 5 Totals from 2012 USDA AgCensus available from National Agricultural Statistics Service http://quickstats.nass.usda.gov/ 6 Includes non-crop farmland, pasture, and woodland pasture acreage 7 Michigan Department of Agriculture and Rural Development, Annual Reports, http://www.michigan.gov/mdard/0,4610,7-125-2968_4811---,00.html 8 Calculated from US Census estimated households in state with Bureau of Labor Statistics estimate of $6,393/household expenditure for food. 9 Food Bank Council of Michigan, http://www.fbcmich.org/site/DocServer/Michigan_Blueprint_to_End_Hunger_2008_web.pdf?docID=1921 estimates rounded to nearest integer 10 Michigan League for Public Policy, Kids Count in Michigan 2013 overview, http://www.mlpp.org/kids-count/michigan-2/mi-data-book-2013 11 USDA measure for 2013 http://www.fns.usda.gov/pd/supplemental-nutrition-assistance-program-snap 12 From 2012 population estimates (US Census Bureau) formula via Ohio Dept of Ag Animal Emergency Response Plan, 2006. Includes dogs, cats, birds, rabbits, rodents, and turtles. 13 Michigan Agritourism Association http://www.michiganfarmfun.com/index.php?option=com_mtree&Itemid=3

Michigan Food and Agricultural Systems Profiles
MONTMORENCY
Area1 546.66 square miles Population2 9,773 Largest City Atlanta Watershed(s) Thunder Bay, Cheboygan, Au Sable
Top Commodities by Volume of Sales3
•Milk and other dairy products from cows •Grains, oilseeds, dry beans, and dry peas •Cattle and calves •Other crops and hay •Other animals and other animal products
•Fruits, tree nuts, and berries •Hogs and pigs •Poultry and eggs •Horses, ponies, mules, burros, and donkeys •Sheep, goats, and their products
Top Commodities by Acreage
•Forage •Corn •Cattle
Agricultural Revenues4 Amount MI top 20 ranking
Total market value of agriculture production $8,132,000 Total crop sales $4,295,000 Total livestock sales $3,837,000
Key Michigan Products
Corn, soy, and wheat 6,313 acres ( 32.76% of cropland) Revenue from corn, soy, and wheat $2,988,000
Vegetables 14 acres ( .07% of cropland) Revenue from vegetables $
Fruit and tree nuts 2 operations Revenue from fruits, tree nuts, and berries N/A
Dairy farms 4 farms Revenue from milk and other dairy $81,849,000 5
All animal operations 86 operations
Agricultural Land
Total number of farms 151 Total farmland5 24,337 acres
Forage/pasture/non-crop farmland6 5,066 acres Number of farms using certified organic production 0 Number of farms transitioning to organic production 0 Area of greenhouse/nursery operations (sq. ft) n/a

Michigan Food and Agricultural Systems Profiles
Agricultural Chemicals7 Number Percent of MI Total
Fertilizer manufacturers, distributors, and storage facilities 0 0.0 % Pesticide storage facilities 0 0.0 %
Processing and Warehousing
Wholesale food processing plants 5 0.25% Food warehouses 1 0.09% Controlled atmosphere storage facilities 0 0.0 % Dairy processing plants 0 0.0 % Dairy warehouse, transfer, and truck cleaning facilities 1 9.09% Slaughter facilities (MDARD licensed) 0 0.0 % Meat processing plants (MDARD licensed) 13 0.51% Rendering facilities 0 Commercial feed manufacturing facilities 0 Ethanol plants
Retailing and distribution8
Food service establishments (all) 56 0.18% Retail food establishments 22 0.15% Total amount spent by consumers on food (estimate)8 $27,566,616 0.11% Emergency food distribution sites9 3 0.14%
Pounds distributed 50,213 0.06% Students eligible for free or reduced school lunch10 501 0.07% Households receiving FAP (SNAP) benefits11 2,177 0.11%
Total federal funding for SNAP $3,442,236 0.11% Pet population (estimate) 12 5,328 Port(s) of entry none
Local Distribution13
Farmers’ markets 1 U-pick farms/On-farm markets 0 Farms using community Supported Agriculture 4 1 United States Census Bureau State & County Quick Facts: Michigan, http://quickfacts.census.gov/qfd/states/26000.html 2 Michigan Economic Development Corporation Regional Economic Profiles http://www.michiganbusiness.org/cm/Files/Reports/Regional_Economy/Michigan-Economy-Overview.pdf 3 Michigan Farm Bureau, Treasures of Michigan Agriculture, https://www.michfb.com/MI/Treasures/ 4 USDA 2012 AgCensus Statewide profile http://www.agcensus.usda.gov/Publications/2012/Online_Resources/County_Profiles/Michigan/cp99026.pdf 5 Totals from 2012 USDA AgCensus available from National Agricultural Statistics Service http://quickstats.nass.usda.gov/ 6 Includes non-crop farmland, pasture, and woodland pasture acreage 7 Michigan Department of Agriculture and Rural Development, Annual Reports, http://www.michigan.gov/mdard/0,4610,7-125-2968_4811---,00.html 8 Calculated from US Census estimated households in state with Bureau of Labor Statistics estimate of $6,393/household expenditure for food. 9 Food Bank Council of Michigan, http://www.fbcmich.org/site/DocServer/Michigan_Blueprint_to_End_Hunger_2008_web.pdf?docID=1921 estimates rounded to nearest integer 10 Michigan League for Public Policy, Kids Count in Michigan 2013 overview, http://www.mlpp.org/kids-count/michigan-2/mi-data-book-2013 11 USDA measure for 2013 http://www.fns.usda.gov/pd/supplemental-nutrition-assistance-program-snap 12 From 2012 population estimates (US Census Bureau) formula via Ohio Dept of Ag Animal Emergency Response Plan, 2006. Includes dogs, cats, birds, rabbits, rodents, and turtles. 13 Michigan Agritourism Association http://www.michiganfarmfun.com/index.php?option=com_mtree&Itemid=3

Michigan Food and Agricultural Systems Profiles
MUSKEGON
Area1 499.25 square miles Population2 171,923 Largest City Muskegon Watershed(s) Muskegon, Grand, White
Top Commodities by Volume of Sales3
•Milk and other dairy products from cows •Fruits, tree nuts, and berries •Nursery, greenhouse, floriculture, and sod •Grains, oilseeds, dry beans, and dry peas •Hogs and pigs
•Other animals and other animal products •Horses, ponies, mules, burros, and donkeys •Cut Christmas trees and short rotation woody crops •Sheep, goats, and their products
Top Commodities by Acreage
•Corn •Forage •Turkeys
Agricultural Revenues4 Amount MI top 20 ranking
Total market value of agriculture production $76,000,000 Total crop sales $46,846,000 Total livestock sales $29,154,000
Key Michigan Products
Corn, soy, and wheat 27,455 acres ( 45.17% of cropland) Revenue from corn, soy, and wheat $17,836,000
Vegetables 2,040 acres ( 3.36% of cropland) Revenue from vegetables $3,749,000
Fruit and tree nuts 43 operations 10 Revenue from fruits, tree nuts, and berries $16,107,000 5
Dairy farms 16 farms Revenue from milk and other dairy $5,734,000
All animal operations 226 operations
Agricultural Land
Total number of farms 514 Total farmland5 74,246 acres
Forage/pasture/non-crop farmland6 13,461 acres Number of farms using certified organic production 6 Number of farms transitioning to organic production 121 Area of greenhouse/nursery operations (sq. ft) N/A

Michigan Food and Agricultural Systems Profiles
Agricultural Chemicals7 Number Percent of MI Total
Fertilizer manufacturers, distributors, and storage facilities 0 0.0 % Pesticide storage facilities 1 0.68%
Processing and Warehousing
Wholesale food processing plants 24 1.2 % Food warehouses 16 1.43% Controlled atmosphere storage facilities 2 3.03% Dairy processing plants 1 1.27% Dairy warehouse, transfer, and truck cleaning facilities 0 0.0 % Slaughter facilities (MDARD licensed) 0 0.0 % Meat processing plants (MDARD licensed) 37 1.46% Rendering facilities 0 Commercial feed manufacturing facilities 0 Ethanol plants
Retailing and distribution8
Food service establishments (all) 589 1.87% Retail food establishments 219 1.53% Total amount spent by consumers on food (estimate)8 $417,124,071 1.71% Emergency food distribution sites9 50 2.17%
Pounds distributed 1,937,284 2.51% Students eligible for free or reduced school lunch10 15,867 2.16% Households receiving FAP (SNAP) benefits11 47,501 2.48%
Total federal funding for SNAP $75,107,783 2.48% Pet population (estimate) 12 93,732 Port(s) of entry none
Local Distribution13
Farmers’ markets 6 U-pick farms/On-farm markets 0 Farms using community Supported Agriculture 2 1 United States Census Bureau State & County Quick Facts: Michigan, http://quickfacts.census.gov/qfd/states/26000.html 2 Michigan Economic Development Corporation Regional Economic Profiles http://www.michiganbusiness.org/cm/Files/Reports/Regional_Economy/Michigan-Economy-Overview.pdf 3 Michigan Farm Bureau, Treasures of Michigan Agriculture, https://www.michfb.com/MI/Treasures/ 4 USDA 2012 AgCensus Statewide profile http://www.agcensus.usda.gov/Publications/2012/Online_Resources/County_Profiles/Michigan/cp99026.pdf 5 Totals from 2012 USDA AgCensus available from National Agricultural Statistics Service http://quickstats.nass.usda.gov/ 6 Includes non-crop farmland, pasture, and woodland pasture acreage 7 Michigan Department of Agriculture and Rural Development, Annual Reports, http://www.michigan.gov/mdard/0,4610,7-125-2968_4811---,00.html 8 Calculated from US Census estimated households in state with Bureau of Labor Statistics estimate of $6,393/household expenditure for food. 9 Food Bank Council of Michigan, http://www.fbcmich.org/site/DocServer/Michigan_Blueprint_to_End_Hunger_2008_web.pdf?docID=1921 estimates rounded to nearest integer 10 Michigan League for Public Policy, Kids Count in Michigan 2013 overview, http://www.mlpp.org/kids-count/michigan-2/mi-data-book-2013 11 USDA measure for 2013 http://www.fns.usda.gov/pd/supplemental-nutrition-assistance-program-snap 12 From 2012 population estimates (US Census Bureau) formula via Ohio Dept of Ag Animal Emergency Response Plan, 2006. Includes dogs, cats, birds, rabbits, rodents, and turtles. 13 Michigan Agritourism Association http://www.michiganfarmfun.com/index.php?option=com_mtree&Itemid=3

Michigan Food and Agricultural Systems Profiles
NEWAYGO
Area1 813.20 square miles Population2 48,382 Largest City White Cloud Watershed(s) Muskegon, White, Pere Marquette
Top Commodities by Volume of Sales3
•Milk and other dairy products from cows •Vegetables, melons, potatoes, and sweet potatoes •Cattle and calves •Grains, oilseeds, dry beans, and dry peas •Fruits, tree nuts, and berries
•Poultry and eggs •Nursery, greenhouse, floriculture, and sod •Hogs and pigs •Other animals and other animal products •Horses, ponies, mules, burros, and donkeys
Top Commodities by Acreage
•Forage •Corn •Turkeys
Agricultural Revenues4 Amount MI top 20 ranking
Total market value of agriculture production $113,849,000 Total crop sales $45,412,000 Total livestock sales $68,437,000 10
Key Michigan Products
Corn, soy, and wheat 43,677 acres ( 43.35% of cropland) Revenue from corn, soy, and wheat $24,118,000
Vegetables 11,158 acres ( 11.07% of cropland) 9 Revenue from vegetables $10,308,000 11
Fruit and tree nuts 24 operations 19 Revenue from fruits, tree nuts, and berries $5,298,000 11
Dairy farms 56 farms 11 Revenue from milk and other dairy $1,295,000
All animal operations 416 operations 12
Agricultural Land
Total number of farms 923 Total farmland5 125,663 acres
Forage/pasture/non-crop farmland6 24,912 acres 12 Number of farms using certified organic production 14 Number of farms transitioning to organic production 123 Area of greenhouse/nursery operations (sq. ft) n/a

Michigan Food and Agricultural Systems Profiles
Agricultural Chemicals7 Number Percent of MI Total
Fertilizer manufacturers, distributors, and storage facilities 2 1.05% Pesticide storage facilities 2 1.35%
Processing and Warehousing
Wholesale food processing plants 12 0.6 % Food warehouses 5 0.45% Controlled atmosphere storage facilities 3 4.55% Dairy processing plants 1 1.27% Dairy warehouse, transfer, and truck cleaning facilities 0 0.0 % Slaughter facilities (MDARD licensed) 1 2.04% Meat processing plants (MDARD licensed) 32 1.26% Rendering facilities 1 Commercial feed manufacturing facilities 0 Ethanol plants
Retailing and distribution8
Food service establishments (all) 125 0.4 % Retail food establishments 66 0.46% Total amount spent by consumers on food (estimate)8 $118,129,854 0.48% Emergency food distribution sites9 30 1.29%
Pounds distributed 1,650,833 2.13% Students eligible for free or reduced school lunch10 4,916 0.67% Households receiving FAP (SNAP) benefits11 11,165 0.58%
Total federal funding for SNAP $17,653,910 0.58% Pet population (estimate) 12 26,378 Port(s) of entry none
Local Distribution13
Farmers’ markets 2 U-pick farms/On-farm markets 1 Farms using community Supported Agriculture 6 1 United States Census Bureau State & County Quick Facts: Michigan, http://quickfacts.census.gov/qfd/states/26000.html 2 Michigan Economic Development Corporation Regional Economic Profiles http://www.michiganbusiness.org/cm/Files/Reports/Regional_Economy/Michigan-Economy-Overview.pdf 3 Michigan Farm Bureau, Treasures of Michigan Agriculture, https://www.michfb.com/MI/Treasures/ 4 USDA 2012 AgCensus Statewide profile http://www.agcensus.usda.gov/Publications/2012/Online_Resources/County_Profiles/Michigan/cp99026.pdf 5 Totals from 2012 USDA AgCensus available from National Agricultural Statistics Service http://quickstats.nass.usda.gov/ 6 Includes non-crop farmland, pasture, and woodland pasture acreage 7 Michigan Department of Agriculture and Rural Development, Annual Reports, http://www.michigan.gov/mdard/0,4610,7-125-2968_4811---,00.html 8 Calculated from US Census estimated households in state with Bureau of Labor Statistics estimate of $6,393/household expenditure for food. 9 Food Bank Council of Michigan, http://www.fbcmich.org/site/DocServer/Michigan_Blueprint_to_End_Hunger_2008_web.pdf?docID=1921 estimates rounded to nearest integer 10 Michigan League for Public Policy, Kids Count in Michigan 2013 overview, http://www.mlpp.org/kids-count/michigan-2/mi-data-book-2013 11 USDA measure for 2013 http://www.fns.usda.gov/pd/supplemental-nutrition-assistance-program-snap 12 From 2012 population estimates (US Census Bureau) formula via Ohio Dept of Ag Animal Emergency Response Plan, 2006. Includes dogs, cats, birds, rabbits, rodents, and turtles. 13 Michigan Agritourism Association http://www.michiganfarmfun.com/index.php?option=com_mtree&Itemid=3
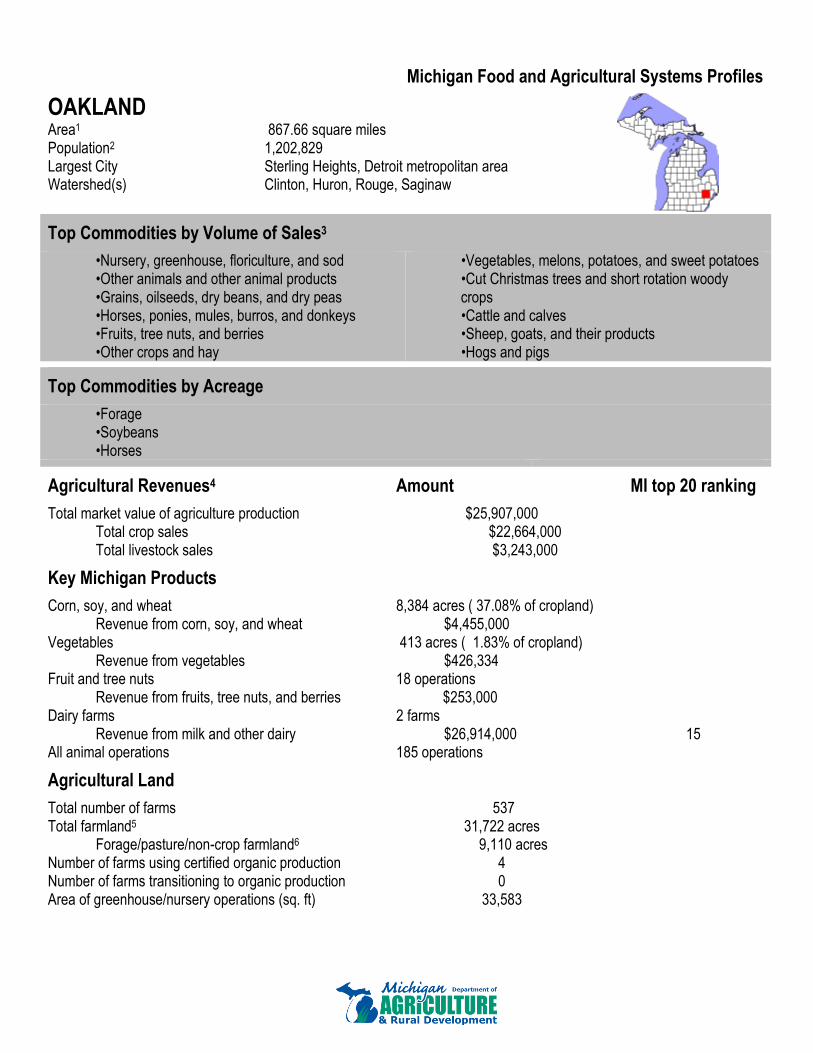
Michigan Food and Agricultural Systems Profiles
OAKLAND
Area1 867.66 square miles Population2 1,202,829 Largest City Sterling Heights, Detroit metropolitan area Watershed(s) Clinton, Huron, Rouge, Saginaw
Top Commodities by Volume of Sales3
•Nursery, greenhouse, floriculture, and sod •Other animals and other animal products •Grains, oilseeds, dry beans, and dry peas •Horses, ponies, mules, burros, and donkeys •Fruits, tree nuts, and berries •Other crops and hay
•Vegetables, melons, potatoes, and sweet potatoes •Cut Christmas trees and short rotation woody crops •Cattle and calves •Sheep, goats, and their products •Hogs and pigs
Top Commodities by Acreage
•Forage •Soybeans •Horses
Agricultural Revenues4 Amount MI top 20 ranking
Total market value of agriculture production $25,907,000 Total crop sales $22,664,000 Total livestock sales $3,243,000
Key Michigan Products
Corn, soy, and wheat 8,384 acres ( 37.08% of cropland) Revenue from corn, soy, and wheat $4,455,000
Vegetables 413 acres ( 1.83% of cropland) Revenue from vegetables $426,334
Fruit and tree nuts 18 operations Revenue from fruits, tree nuts, and berries $253,000
Dairy farms 2 farms Revenue from milk and other dairy $26,914,000 15
All animal operations 185 operations
Agricultural Land
Total number of farms 537 Total farmland5 31,722 acres
Forage/pasture/non-crop farmland6 9,110 acres Number of farms using certified organic production 4 Number of farms transitioning to organic production 0 Area of greenhouse/nursery operations (sq. ft) 33,583

Michigan Food and Agricultural Systems Profiles
Agricultural Chemicals7 Number Percent of MI Total
Fertilizer manufacturers, distributors, and storage facilities 9 4.71% Pesticide storage facilities 7 4.73%
Processing and Warehousing
Wholesale food processing plants 147 7.36% Food warehouses 76 6.81% Controlled atmosphere storage facilities 0 0.0 % Dairy processing plants 5 6.33% Dairy warehouse, transfer, and truck cleaning facilities 0 0.0 % Slaughter facilities (MDARD licensed) 0 0.0 % Meat processing plants (MDARD licensed) 194 7.65% Rendering facilities 6 Commercial feed manufacturing facilities 0 Ethanol plants
Retailing and distribution8
Food service establishments (all) 3937 12.51% Retail food establishments 1412 9.87% Total amount spent by consumers on food (estimate)8 $3,087,678,354 12.65% Emergency food distribution sites9 102 4.37%
Pounds distributed 5,081,765 6.57% Students eligible for free or reduced school lunch10 64,710 8.83% Households receiving FAP (SNAP) benefits11 130,745 6.83%
Total federal funding for SNAP $206,731,797 6.83% Pet population (estimate) 12 655,780 Port(s) of entry Oakland County International Airport
Local Distribution13
Farmers’ markets 24 U-pick farms/On-farm markets 13 Farms using community Supported Agriculture 8 1 United States Census Bureau State & County Quick Facts: Michigan, http://quickfacts.census.gov/qfd/states/26000.html 2 Michigan Economic Development Corporation Regional Economic Profiles http://www.michiganbusiness.org/cm/Files/Reports/Regional_Economy/Michigan-Economy-Overview.pdf 3 Michigan Farm Bureau, Treasures of Michigan Agriculture, https://www.michfb.com/MI/Treasures/ 4 USDA 2012 AgCensus Statewide profile http://www.agcensus.usda.gov/Publications/2012/Online_Resources/County_Profiles/Michigan/cp99026.pdf 5 Totals from 2012 USDA AgCensus available from National Agricultural Statistics Service http://quickstats.nass.usda.gov/ 6 Includes non-crop farmland, pasture, and woodland pasture acreage 7 Michigan Department of Agriculture and Rural Development, Annual Reports, http://www.michigan.gov/mdard/0,4610,7-125-2968_4811---,00.html 8 Calculated from US Census estimated households in state with Bureau of Labor Statistics estimate of $6,393/household expenditure for food. 9 Food Bank Council of Michigan, http://www.fbcmich.org/site/DocServer/Michigan_Blueprint_to_End_Hunger_2008_web.pdf?docID=1921 estimates rounded to nearest integer 10 Michigan League for Public Policy, Kids Count in Michigan 2013 overview, http://www.mlpp.org/kids-count/michigan-2/mi-data-book-2013 11 USDA measure for 2013 http://www.fns.usda.gov/pd/supplemental-nutrition-assistance-program-snap 12 From 2012 population estimates (US Census Bureau) formula via Ohio Dept of Ag Animal Emergency Response Plan, 2006. Includes dogs, cats, birds, rabbits, rodents, and turtles. 13 Michigan Agritourism Association http://www.michiganfarmfun.com/index.php?option=com_mtree&Itemid=3

Michigan Food and Agricultural Systems Profiles
OCEANA
Area1 512.07 square miles Population2 26,521 Largest City Hart Watershed(s) White, Pentwater, Pere Marquette
Top Commodities by Volume of Sales3
•Fruits, tree nuts, and berries •Vegetables, melons, potatoes, and sweet potatoes •Hogs and pigs •Milk and other dairy products from cows •Cut Christmas trees and short rotation woody crops
•Cattle and calves •Other crops and hay •Horses, ponies, mules, burros, and donkeys •Nursery, greenhouse, floriculture, and sod •Sheep, goats, and their products
Top Commodities by Acreage
•Corn •Vegetables •Hogs
Agricultural Revenues4 Amount MI top 20 ranking
Total market value of agriculture production $101,180,000 Total crop sales $64,095,000 Total livestock sales $37,085,000
Key Michigan Products
Corn, soy, and wheat 31,256 acres ( 28.60% of cropland) Revenue from corn, soy, and wheat $18,158,000
Vegetables 23,883 acres ( 21.85% of cropland) 2 Revenue from vegetables $
Fruit and tree nuts 95 operations 7 Revenue from fruits, tree nuts, and berries $12,716,000 8
Dairy farms 25 farms Revenue from milk and other dairy $31,609,000 12
All animal operations 207 operations
Agricultural Land
Total number of farms 609 Total farmland5 127,779 acres
Forage/pasture/non-crop farmland6 18,478 acres Number of farms using certified organic production 12 Number of farms transitioning to organic production 127 Area of greenhouse/nursery operations (sq. ft) n/a

Michigan Food and Agricultural Systems Profiles
Agricultural Chemicals7 Number Percent of MI Total
Fertilizer manufacturers, distributors, and storage facilities 2 1.05% Pesticide storage facilities 2 1.35%
Processing and Warehousing
Wholesale food processing plants 54 2.71% Food warehouses 12 1.08% Controlled atmosphere storage facilities 1 1.52% Dairy processing plants 1 1.27% Dairy warehouse, transfer, and truck cleaning facilities 0 0.0 % Slaughter facilities (MDARD licensed) 2 4.08% Meat processing plants (MDARD licensed) 22 0.87% Rendering facilities 0 Commercial feed manufacturing facilities 0 Ethanol plants
Retailing and distribution8
Food service establishments (all) 106 0.34% Retail food establishments 66 0.46% Total amount spent by consumers on food (estimate)8 $61,718,022 0.25% Emergency food distribution sites9 9 0.38%
Pounds distributed 434,462 0.56% Students eligible for free or reduced school lunch10 2,219 0.3 % Households receiving FAP (SNAP) benefits11 6,753 0.35%
Total federal funding for SNAP $10,677,730 0.35% Pet population (estimate) 12 14,459 Port(s) of entry none
Local Distribution13
Farmers’ markets 1 U-pick farms/On-farm markets 5 Farms using community Supported Agriculture 3 1 United States Census Bureau State & County Quick Facts: Michigan, http://quickfacts.census.gov/qfd/states/26000.html 2 Michigan Economic Development Corporation Regional Economic Profiles http://www.michiganbusiness.org/cm/Files/Reports/Regional_Economy/Michigan-Economy-Overview.pdf 3 Michigan Farm Bureau, Treasures of Michigan Agriculture, https://www.michfb.com/MI/Treasures/ 4 USDA 2012 AgCensus Statewide profile http://www.agcensus.usda.gov/Publications/2012/Online_Resources/County_Profiles/Michigan/cp99026.pdf 5 Totals from 2012 USDA AgCensus available from National Agricultural Statistics Service http://quickstats.nass.usda.gov/ 6 Includes non-crop farmland, pasture, and woodland pasture acreage 7 Michigan Department of Agriculture and Rural Development, Annual Reports, http://www.michigan.gov/mdard/0,4610,7-125-2968_4811---,00.html 8 Calculated from US Census estimated households in state with Bureau of Labor Statistics estimate of $6,393/household expenditure for food. 9 Food Bank Council of Michigan, http://www.fbcmich.org/site/DocServer/Michigan_Blueprint_to_End_Hunger_2008_web.pdf?docID=1921 estimates rounded to nearest integer 10 Michigan League for Public Policy, Kids Count in Michigan 2013 overview, http://www.mlpp.org/kids-count/michigan-2/mi-data-book-2013 11 USDA measure for 2013 http://www.fns.usda.gov/pd/supplemental-nutrition-assistance-program-snap 12 From 2012 population estimates (US Census Bureau) formula via Ohio Dept of Ag Animal Emergency Response Plan, 2006. Includes dogs, cats, birds, rabbits, rodents, and turtles. 13 Michigan Agritourism Association http://www.michiganfarmfun.com/index.php?option=com_mtree&Itemid=3

Michigan Food and Agricultural Systems Profiles
OGEMAW
Area1 563.49 square miles Population2 21,641 Largest City West Branch Watershed(s) Rifle, Au Sable, Saginaw
Top Commodities by Volume of Sales3
•Milk and other dairy products from cows •Cattle and calves •Grains, oilseeds, dry beans, and dry peas •Other crops and hay •Fruits, tree nuts, and berries
•Nursery, greenhouse, floriculture, and sod •Other animals and other animal products •Sheep, goats, and their products •Horses, ponies, mules, burros, and donkeys •Hogs and pigs
Top Commodities by Acreage
•Forage •Corn •Cattle
Agricultural Revenues4 Amount MI top 20 ranking
Total market value of agriculture production $46,260,000 Total crop sales $13,478,000 Total livestock sales $32,782,000
Key Michigan Products
Corn, soy, and wheat 16,869 acres ( 30.47% of cropland) Revenue from corn, soy, and wheat $8,819,000
Vegetables acres ( .00% of cropland) Revenue from vegetables $
Fruit and tree nuts 4 operations Revenue from fruits, tree nuts, and berries $26,000
Dairy farms 38 farms 18 Revenue from milk and other dairy $58,132,000 8
All animal operations 142 operations
Agricultural Land
Total number of farms 280 Total farmland5 68,162 acres
Forage/pasture/non-crop farmland6 12,807 acres Number of farms using certified organic production 0 Number of farms transitioning to organic production 0 Area of greenhouse/nursery operations (sq. ft) n/a

Michigan Food and Agricultural Systems Profiles
Agricultural Chemicals7 Number Percent of MI Total
Fertilizer manufacturers, distributors, and storage facilities 2 1.05% Pesticide storage facilities 1 0.68%
Processing and Warehousing
Wholesale food processing plants 5 0.25% Food warehouses 7 0.63% Controlled atmosphere storage facilities 0 0.0 % Dairy processing plants 0 0.0 % Dairy warehouse, transfer, and truck cleaning facilities 0 0.0 % Slaughter facilities (MDARD licensed) 0 0.0 % Meat processing plants (MDARD licensed) 17 0.67% Rendering facilities 0 Commercial feed manufacturing facilities 0 Ethanol plants
Retailing and distribution8
Food service establishments (all) 84 0.27% Retail food establishments 45 0.31% Total amount spent by consumers on food (estimate)8 $54,276,570 0.22% Emergency food distribution sites9 8 0.34%
Pounds distributed 203,334 0.26% Students eligible for free or reduced school lunch10 1,353 0.18% Households receiving FAP (SNAP) benefits11 5,663 0.3 %
Total federal funding for SNAP $8,954,240 0.3 % Pet population (estimate) 12 11,799 Port(s) of entry none
Local Distribution13
Farmers’ markets 1 U-pick farms/On-farm markets 0 Farms using community Supported Agriculture 1 1 United States Census Bureau State & County Quick Facts: Michigan, http://quickfacts.census.gov/qfd/states/26000.html 2 Michigan Economic Development Corporation Regional Economic Profiles http://www.michiganbusiness.org/cm/Files/Reports/Regional_Economy/Michigan-Economy-Overview.pdf 3 Michigan Farm Bureau, Treasures of Michigan Agriculture, https://www.michfb.com/MI/Treasures/ 4 USDA 2012 AgCensus Statewide profile http://www.agcensus.usda.gov/Publications/2012/Online_Resources/County_Profiles/Michigan/cp99026.pdf 5 Totals from 2012 USDA AgCensus available from National Agricultural Statistics Service http://quickstats.nass.usda.gov/ 6 Includes non-crop farmland, pasture, and woodland pasture acreage 7 Michigan Department of Agriculture and Rural Development, Annual Reports, http://www.michigan.gov/mdard/0,4610,7-125-2968_4811---,00.html 8 Calculated from US Census estimated households in state with Bureau of Labor Statistics estimate of $6,393/household expenditure for food. 9 Food Bank Council of Michigan, http://www.fbcmich.org/site/DocServer/Michigan_Blueprint_to_End_Hunger_2008_web.pdf?docID=1921 estimates rounded to nearest integer 10 Michigan League for Public Policy, Kids Count in Michigan 2013 overview, http://www.mlpp.org/kids-count/michigan-2/mi-data-book-2013 11 USDA measure for 2013 http://www.fns.usda.gov/pd/supplemental-nutrition-assistance-program-snap 12 From 2012 population estimates (US Census Bureau) formula via Ohio Dept of Ag Animal Emergency Response Plan, 2006. Includes dogs, cats, birds, rabbits, rodents, and turtles. 13 Michigan Agritourism Association http://www.michiganfarmfun.com/index.php?option=com_mtree&Itemid=3

Michigan Food and Agricultural Systems Profiles
ONTONAGON
Area1 1,311.23 square miles Population2 6,742 Largest City Ontonagon Watershed(s) Ontonagon, Presque Isle
Top Commodities by Volume of Sales3
•Cattle and calves •Milk and other dairy products from cows
•Grains, oilseeds, dry beans, and dry peas •Horses, ponies, mules, burros, and donkeys
Top Commodities by Acreage
•Forage •Wheat •Cattle
Agricultural Revenues4 Amount MI top 20 ranking
Total market value of agriculture production $2,204,000 Total crop sales $1,656,000 Total livestock sales $548,000
Key Michigan Products
Corn, soy, and wheat 209 acres ( 1.00% of cropland) Revenue from corn, soy, and wheat $
Vegetables 17 acres ( .08% of cropland) Revenue from vegetables $9,000
Fruit and tree nuts 1 operations Revenue from fruits, tree nuts, and berries N/A
Dairy farms 1 farms Revenue from milk and other dairy $25,491,000 18
All animal operations 43 operations
Agricultural Land
Total number of farms 109 Total farmland5 29,063 acres
Forage/pasture/non-crop farmland6 8,165 acres Number of farms using certified organic production 0 Number of farms transitioning to organic production 0 Area of greenhouse/nursery operations (sq. ft) n/a

Michigan Food and Agricultural Systems Profiles
Agricultural Chemicals7 Number Percent of MI Total
Fertilizer manufacturers, distributors, and storage facilities 0 0.0 % Pesticide storage facilities 0 0.0 %
Processing and Warehousing
Wholesale food processing plants 4 0.2 % Food warehouses 1 0.09% Controlled atmosphere storage facilities 0 0.0 % Dairy processing plants 0 0.0 % Dairy warehouse, transfer, and truck cleaning facilities 0 0.0 % Slaughter facilities (MDARD licensed) 0 0.0 % Meat processing plants (MDARD licensed) 3 0.12% Rendering facilities 0 Commercial feed manufacturing facilities 0 Ethanol plants
Retailing and distribution8
Food service establishments (all) 41 0.13% Retail food establishments 14 0.1 % Total amount spent by consumers on food (estimate)8 $21,307,869 0.09% Emergency food distribution sites9 3 0.14%
Pounds distributed 73,179 0.09% Students eligible for free or reduced school lunch10 376 0.05% Households receiving FAP (SNAP) benefits11 1,088 0.06%
Total federal funding for SNAP $1,720,327 0.06% Pet population (estimate) 12 3,676 Port(s) of entry none
Local Distribution13
Farmers’ markets 1 U-pick farms/On-farm markets 0 Farms using community Supported Agriculture 0 1 United States Census Bureau State & County Quick Facts: Michigan, http://quickfacts.census.gov/qfd/states/26000.html 2 Michigan Economic Development Corporation Regional Economic Profiles http://www.michiganbusiness.org/cm/Files/Reports/Regional_Economy/Michigan-Economy-Overview.pdf 3 Michigan Farm Bureau, Treasures of Michigan Agriculture, https://www.michfb.com/MI/Treasures/ 4 USDA 2012 AgCensus Statewide profile http://www.agcensus.usda.gov/Publications/2012/Online_Resources/County_Profiles/Michigan/cp99026.pdf 5 Totals from 2012 USDA AgCensus available from National Agricultural Statistics Service http://quickstats.nass.usda.gov/ 6 Includes non-crop farmland, pasture, and woodland pasture acreage 7 Michigan Department of Agriculture and Rural Development, Annual Reports, http://www.michigan.gov/mdard/0,4610,7-125-2968_4811---,00.html 8 Calculated from US Census estimated households in state with Bureau of Labor Statistics estimate of $6,393/household expenditure for food. 9 Food Bank Council of Michigan, http://www.fbcmich.org/site/DocServer/Michigan_Blueprint_to_End_Hunger_2008_web.pdf?docID=1921 estimates rounded to nearest integer 10 Michigan League for Public Policy, Kids Count in Michigan 2013 overview, http://www.mlpp.org/kids-count/michigan-2/mi-data-book-2013 11 USDA measure for 2013 http://www.fns.usda.gov/pd/supplemental-nutrition-assistance-program-snap 12 From 2012 population estimates (US Census Bureau) formula via Ohio Dept of Ag Animal Emergency Response Plan, 2006. Includes dogs, cats, birds, rabbits, rodents, and turtles. 13 Michigan Agritourism Association http://www.michiganfarmfun.com/index.php?option=com_mtree&Itemid=3

Michigan Food and Agricultural Systems Profiles
OSCEOLA
Area1 566.39 square miles Population2 23,508 Largest City Reed City Watershed(s) Muskegon, Manistee, Saginaw
Top Commodities by Volume of Sales3
•Milk and other dairy products from cows •Cattle and calves •Other crops and hay •Vegetables, melons, potatoes, and sweet potatoes •Grains, oilseeds, dry beans, and dry peas •Cut Christmas trees and short rotation woody crops
•Other animals and other anim
•Sheep, goats, and their products •Hogs and pigs •Fruits, tree nuts, and berries •Nursery, greenhouse, floriculture, and sod •Horses, ponies, mules, burros, and donkeys •Poultry and eggs
Top Commodities by Acreage
•Forage •Corn •Cattle
Agricultural Revenues4 Amount MI top 20 ranking
Total market value of agriculture production $45,684,000 Total crop sales $13,010,000 Total livestock sales $32,674,000
Key Michigan Products
Corn, soy, and wheat 14,954 acres ( 17.67% of cropland) Revenue from corn, soy, and wheat $6,223,000
Vegetables 125 acres ( .15% of cropland) Revenue from vegetables $333,268
Fruit and tree nuts 13 operations Revenue from fruits, tree nuts, and berries $61,000
Dairy farms 59 farms 10 Revenue from milk and other dairy $1,264,000
All animal operations 344 operations
Agricultural Land
Total number of farms 750 Total farmland5 110,562 acres
Forage/pasture/non-crop farmland6 25,910 acres 10 Number of farms using certified organic production 5 Number of farms transitioning to organic production 0 Area of greenhouse/nursery operations (sq. ft) N/A

Michigan Food and Agricultural Systems Profiles
Agricultural Chemicals7 Number Percent of MI Total
Fertilizer manufacturers, distributors, and storage facilities 2 1.05% Pesticide storage facilities 0 0.0 %
Processing and Warehousing
Wholesale food processing plants 14 0.7 % Food warehouses 7 0.63% Controlled atmosphere storage facilities 0 0.0 % Dairy processing plants 0 0.0 % Dairy warehouse, transfer, and truck cleaning facilities 1 9.09% Slaughter facilities (MDARD licensed) 0 0.0 % Meat processing plants (MDARD licensed) 9 0.35% Rendering facilities 0 Commercial feed manufacturing facilities 0 Ethanol plants
Retailing and distribution8
Food service establishments (all) 87 0.28% Retail food establishments 45 0.31% Total amount spent by consumers on food (estimate)8 $57,306,852 0.23% Emergency food distribution sites9 15 0.62%
Pounds distributed 263,650 0.34% Students eligible for free or reduced school lunch10 2,549 0.35% Households receiving FAP (SNAP) benefits11 5,276 0.28%
Total federal funding for SNAP $8,342,323 0.28% Pet population (estimate) 12 12,817 Port(s) of entry none
Local Distribution13
Farmers’ markets 4 U-pick farms/On-farm markets 1 Farms using community Supported Agriculture 5 1 United States Census Bureau State & County Quick Facts: Michigan, http://quickfacts.census.gov/qfd/states/26000.html 2 Michigan Economic Development Corporation Regional Economic Profiles http://www.michiganbusiness.org/cm/Files/Reports/Regional_Economy/Michigan-Economy-Overview.pdf 3 Michigan Farm Bureau, Treasures of Michigan Agriculture, https://www.michfb.com/MI/Treasures/ 4 USDA 2012 AgCensus Statewide profile http://www.agcensus.usda.gov/Publications/2012/Online_Resources/County_Profiles/Michigan/cp99026.pdf 5 Totals from 2012 USDA AgCensus available from National Agricultural Statistics Service http://quickstats.nass.usda.gov/ 6 Includes non-crop farmland, pasture, and woodland pasture acreage 7 Michigan Department of Agriculture and Rural Development, Annual Reports, http://www.michigan.gov/mdard/0,4610,7-125-2968_4811---,00.html 8 Calculated from US Census estimated households in state with Bureau of Labor Statistics estimate of $6,393/household expenditure for food. 9 Food Bank Council of Michigan, http://www.fbcmich.org/site/DocServer/Michigan_Blueprint_to_End_Hunger_2008_web.pdf?docID=1921 estimates rounded to nearest integer 10 Michigan League for Public Policy, Kids Count in Michigan 2013 overview, http://www.mlpp.org/kids-count/michigan-2/mi-data-book-2013 11 USDA measure for 2013 http://www.fns.usda.gov/pd/supplemental-nutrition-assistance-program-snap 12 From 2012 population estimates (US Census Bureau) formula via Ohio Dept of Ag Animal Emergency Response Plan, 2006. Includes dogs, cats, birds, rabbits, rodents, and turtles. 13 Michigan Agritourism Association http://www.michiganfarmfun.com/index.php?option=com_mtree&Itemid=3

Michigan Food and Agricultural Systems Profiles
OSCODA
Area1 565.73 square miles Population2 8,614 Largest City Mio Watershed(s) Au Sable, Thunder Bay
Top Commodities by Volume of Sales3
•Milk and other dairy products from cows •Cattle and calves •Other animals and other animal products •Other crops and hay
•Horses, ponies, mules, burros, and donkeys •Other crops and hay •Nursery, greenhouse, floriculture, and sod •Grains, oilseeds, dry beans, and dry peas
Top Commodities by Acreage
•Forage •Corn •Cattle
Agricultural Revenues4 Amount MI top 20 ranking
Total market value of agriculture production $6,907,000 Total crop sales $1,178,000 Total livestock sales $5,729,000
Key Michigan Products
Corn, soy, and wheat 1,432 acres ( 12.88% of cropland) Revenue from corn, soy, and wheat $
Vegetables 20 acres ( .18% of cropland) Revenue from vegetables $
Fruit and tree nuts 4 operations Revenue from fruits, tree nuts, and berries $10,000
Dairy farms 21 farms Revenue from milk and other dairy $2,482,000
All animal operations 93 operations
Agricultural Land
Total number of farms 145 Total farmland5 16,748 acres
Forage/pasture/non-crop farmland6 5,632 acres Number of farms using certified organic production 5 Number of farms transitioning to organic production 0 Area of greenhouse/nursery operations (sq. ft) n/a

Michigan Food and Agricultural Systems Profiles
Agricultural Chemicals7 Number Percent of MI Total
Fertilizer manufacturers, distributors, and storage facilities 0 0.0 % Pesticide storage facilities 0 0.0 %
Processing and Warehousing
Wholesale food processing plants 9 0.45% Food warehouses 2 0.18% Controlled atmosphere storage facilities 0 0.0 % Dairy processing plants 3 3.8 % Dairy warehouse, transfer, and truck cleaning facilities 0 0.0 % Slaughter facilities (MDARD licensed) 0 0.0 % Meat processing plants (MDARD licensed) 6 0.24% Rendering facilities 0 Commercial feed manufacturing facilities 0 Ethanol plants
Retailing and distribution8
Food service establishments (all) 38 0.12% Retail food establishments 22 0.15% Total amount spent by consumers on food (estimate)8 $24,561,906 0.1 % Emergency food distribution sites9 4 0.15%
Pounds distributed 237,643 0.31% Students eligible for free or reduced school lunch10 648 0.09% Households receiving FAP (SNAP) benefits11 2,104 0.11%
Total federal funding for SNAP $3,326,809 0.11% Pet population (estimate) 12 4,696 Port(s) of entry none
Local Distribution13
Farmers’ markets 1 U-pick farms/On-farm markets 0 Farms using community Supported Agriculture 3 1 United States Census Bureau State & County Quick Facts: Michigan, http://quickfacts.census.gov/qfd/states/26000.html 2 Michigan Economic Development Corporation Regional Economic Profiles http://www.michiganbusiness.org/cm/Files/Reports/Regional_Economy/Michigan-Economy-Overview.pdf 3 Michigan Farm Bureau, Treasures of Michigan Agriculture, https://www.michfb.com/MI/Treasures/ 4 USDA 2012 AgCensus Statewide profile http://www.agcensus.usda.gov/Publications/2012/Online_Resources/County_Profiles/Michigan/cp99026.pdf 5 Totals from 2012 USDA AgCensus available from National Agricultural Statistics Service http://quickstats.nass.usda.gov/ 6 Includes non-crop farmland, pasture, and woodland pasture acreage 7 Michigan Department of Agriculture and Rural Development, Annual Reports, http://www.michigan.gov/mdard/0,4610,7-125-2968_4811---,00.html 8 Calculated from US Census estimated households in state with Bureau of Labor Statistics estimate of $6,393/household expenditure for food. 9 Food Bank Council of Michigan, http://www.fbcmich.org/site/DocServer/Michigan_Blueprint_to_End_Hunger_2008_web.pdf?docID=1921 estimates rounded to nearest integer 10 Michigan League for Public Policy, Kids Count in Michigan 2013 overview, http://www.mlpp.org/kids-count/michigan-2/mi-data-book-2013 11 USDA measure for 2013 http://www.fns.usda.gov/pd/supplemental-nutrition-assistance-program-snap 12 From 2012 population estimates (US Census Bureau) formula via Ohio Dept of Ag Animal Emergency Response Plan, 2006. Includes dogs, cats, birds, rabbits, rodents, and turtles. 13 Michigan Agritourism Association http://www.michiganfarmfun.com/index.php?option=com_mtree&Itemid=3

Michigan Food and Agricultural Systems Profiles
OTSEGO
Area1 514.97 square miles Population2 24,153 Largest City Gaylord Watershed(s) Cheboygan, Au Sable, Manistee
Top Commodities by Volume of Sales3
•Vegetables, melons, potatoes, and sweet potatoes •Other crops and hay •Cattle and Calves •Grains, oilseeds, dry beans, and dry peas •Other animals and other animal products
•Poultry and Eggs •Horses, ponies, mules, burros, and donkeys •Hogs and pigs •Aquaculture
Top Commodities by Acreage
•Forage •Corn •Cattle
Agricultural Revenues4 Amount MI top 20 ranking
Total market value of agriculture production $7,066,000 Total crop sales $6,044,000 Total livestock sales $1,022,000
Key Michigan Products
Corn, soy, and wheat 2,720 acres ( 12.16% of cropland) Revenue from corn, soy, and wheat $1,137,000
Vegetables 788 acres ( 3.52% of cropland) Revenue from vegetables $3,133,050
Fruit and tree nuts 6 operations Revenue from fruits, tree nuts, and berries $35,000
Dairy farms 1 farms Revenue from milk and other dairy $4,756,000
All animal operations 71 operations
Agricultural Land
Total number of farms 180 Total farmland5 32,293 acres
Forage/pasture/non-crop farmland6 9,929 acres Number of farms using certified organic production 2 Number of farms transitioning to organic production 137 Area of greenhouse/nursery operations (sq. ft) n/a

Michigan Food and Agricultural Systems Profiles
Agricultural Chemicals7 Number Percent of MI Total
Fertilizer manufacturers, distributors, and storage facilities 0 0.0 % Pesticide storage facilities 0 0.0 %
Processing and Warehousing
Wholesale food processing plants 10 0.5 % Food warehouses 5 0.45% Controlled atmosphere storage facilities 0 0.0 % Dairy processing plants 0 0.0 % Dairy warehouse, transfer, and truck cleaning facilities 0 0.0 % Slaughter facilities (MDARD licensed) 1 2.04% Meat processing plants (MDARD licensed) 17 0.67% Rendering facilities 0 Commercial feed manufacturing facilities 0 Ethanol plants
Retailing and distribution8
Food service establishments (all) 130 0.41% Retail food establishments 47 0.33% Total amount spent by consumers on food (estimate)8 $62,696,151 0.26% Emergency food distribution sites9 2 0.06%
Pounds distributed 103,534 0.13% Students eligible for free or reduced school lunch10 2,041 0.28% Households receiving FAP (SNAP) benefits11 5,146 0.27%
Total federal funding for SNAP $8,136,769 0.27% Pet population (estimate) 12 13,168 Port(s) of entry none
Local Distribution13
Farmers’ markets 1 U-pick farms/On-farm markets 1 Farms using community Supported Agriculture 2 1 United States Census Bureau State & County Quick Facts: Michigan, http://quickfacts.census.gov/qfd/states/26000.html 2 Michigan Economic Development Corporation Regional Economic Profiles http://www.michiganbusiness.org/cm/Files/Reports/Regional_Economy/Michigan-Economy-Overview.pdf 3 Michigan Farm Bureau, Treasures of Michigan Agriculture, https://www.michfb.com/MI/Treasures/ 4 USDA 2012 AgCensus Statewide profile http://www.agcensus.usda.gov/Publications/2012/Online_Resources/County_Profiles/Michigan/cp99026.pdf 5 Totals from 2012 USDA AgCensus available from National Agricultural Statistics Service http://quickstats.nass.usda.gov/ 6 Includes non-crop farmland, pasture, and woodland pasture acreage 7 Michigan Department of Agriculture and Rural Development, Annual Reports, http://www.michigan.gov/mdard/0,4610,7-125-2968_4811---,00.html 8 Calculated from US Census estimated households in state with Bureau of Labor Statistics estimate of $6,393/household expenditure for food. 9 Food Bank Council of Michigan, http://www.fbcmich.org/site/DocServer/Michigan_Blueprint_to_End_Hunger_2008_web.pdf?docID=1921 estimates rounded to nearest integer 10 Michigan League for Public Policy, Kids Count in Michigan 2013 overview, http://www.mlpp.org/kids-count/michigan-2/mi-data-book-2013 11 USDA measure for 2013 http://www.fns.usda.gov/pd/supplemental-nutrition-assistance-program-snap 12 From 2012 population estimates (US Census Bureau) formula via Ohio Dept of Ag Animal Emergency Response Plan, 2006. Includes dogs, cats, birds, rabbits, rodents, and turtles. 13 Michigan Agritourism Association http://www.michiganfarmfun.com/index.php?option=com_mtree&Itemid=3

Michigan Food and Agricultural Systems Profiles
OTTAWA
Area1 563.47 square miles Population2 264,055 Largest City Holland Watershed(s) Grand, Macatawa
Top Commodities by Volume of Sales3
•Nursery, greenhouse, floriculture, and sod •Poultry and eggs •Fruits, tree nuts, and berries •Milk and other dairy products from cows •Cattle and calves •Grains, oilseeds, dry beans, and dry peas
•Vegetables, melons, potatoes, and sweet potatoes •Hogs and pigs •Other crops and hay •Other animals and other animal products •Horses, ponies, mules, burros, and donkeys •Cut Christmas trees and short rotation woody crops
Top Commodities by Acreage
•Corn •Forage •Layers
Agricultural Revenues4 Amount MI top 20 ranking
Total market value of agriculture production $534,404,000 3 Total crop sales $300,308,000 2 Total livestock sales $234,096,000 4
Key Michigan Products
Corn, soy, and wheat 90,100 acres ( 58.79% of cropland) Revenue from corn, soy, and wheat $50,276,000
Vegetables 6,926 acres ( 4.52% of cropland) 15 Revenue from vegetables $14,378,532 9
Fruit and tree nuts 128 operations 5 Revenue from fruits, tree nuts, and berries $45,536,000 2
Dairy farms 66 farms 6 Revenue from milk and other dairy $1,730,000
All animal operations 510 operations 2
Agricultural Land
Total number of farms 1,363 5 Total farmland5 186,154 acres
Forage/pasture/non-crop farmland6 32,884 acres 1 Number of farms using certified organic production 12 Number of farms transitioning to organic production 139 Area of greenhouse/nursery operations (sq. ft) 12,376,840

Michigan Food and Agricultural Systems Profiles
Agricultural Chemicals7 Number Percent of MI Total
Fertilizer manufacturers, distributors, and storage facilities 6 3.14% Pesticide storage facilities 6 4.05%
Processing and Warehousing
Wholesale food processing plants 63 3.16% Food warehouses 34 3.05% Controlled atmosphere storage facilities 8 12.12% Dairy processing plants 7 8.86% Dairy warehouse, transfer, and truck cleaning facilities 0 0.0 % Slaughter facilities (MDARD licensed) 1 2.04% Meat processing plants (MDARD licensed) 59 2.33% Rendering facilities 0 Commercial feed manufacturing facilities 0 Ethanol plants
Retailing and distribution8
Food service establishments (all) 694 2.2 % Retail food establishments 271 1.89% Total amount spent by consumers on food (estimate)8 $603,428,877 2.47% Emergency food distribution sites9 58 2.51%
Pounds distributed 1,535,641 1.99% Students eligible for free or reduced school lunch10 16,068 2.19% Households receiving FAP (SNAP) benefits11 29,350 1.53%
Total federal funding for SNAP $46,407,727 1.53% Pet population (estimate) 12 143,962 Port(s) of entry none
Local Distribution13
Farmers’ markets 8 U-pick farms/On-farm markets 11 Farms using community Supported Agriculture 10 1 United States Census Bureau State & County Quick Facts: Michigan, http://quickfacts.census.gov/qfd/states/26000.html 2 Michigan Economic Development Corporation Regional Economic Profiles http://www.michiganbusiness.org/cm/Files/Reports/Regional_Economy/Michigan-Economy-Overview.pdf 3 Michigan Farm Bureau, Treasures of Michigan Agriculture, https://www.michfb.com/MI/Treasures/ 4 USDA 2012 AgCensus Statewide profile http://www.agcensus.usda.gov/Publications/2012/Online_Resources/County_Profiles/Michigan/cp99026.pdf 5 Totals from 2012 USDA AgCensus available from National Agricultural Statistics Service http://quickstats.nass.usda.gov/ 6 Includes non-crop farmland, pasture, and woodland pasture acreage 7 Michigan Department of Agriculture and Rural Development, Annual Reports, http://www.michigan.gov/mdard/0,4610,7-125-2968_4811---,00.html 8 Calculated from US Census estimated households in state with Bureau of Labor Statistics estimate of $6,393/household expenditure for food. 9 Food Bank Council of Michigan, http://www.fbcmich.org/site/DocServer/Michigan_Blueprint_to_End_Hunger_2008_web.pdf?docID=1921 estimates rounded to nearest integer 10 Michigan League for Public Policy, Kids Count in Michigan 2013 overview, http://www.mlpp.org/kids-count/michigan-2/mi-data-book-2013 11 USDA measure for 2013 http://www.fns.usda.gov/pd/supplemental-nutrition-assistance-program-snap 12 From 2012 population estimates (US Census Bureau) formula via Ohio Dept of Ag Animal Emergency Response Plan, 2006. Includes dogs, cats, birds, rabbits, rodents, and turtles. 13 Michigan Agritourism Association http://www.michiganfarmfun.com/index.php?option=com_mtree&Itemid=3

Michigan Food and Agricultural Systems Profiles
PRESQUE ISLE
Area1 658.72 square miles Population2 13,298 Largest City Rogers City Watershed(s) Oqueoc, Cheboygan, Thunder Bay
Top Commodities by Volume of Sales3
•Milk and other dairy products from cows •Grains, oilseeds, dry beans, and dry peas •Vegetables, melons, potatoes, and sweet potatoes •Cattle and calves •Other crops and hay •Nursery, greenhouse, floriculture, and sod
•Other animals and other animal products •Horses, ponies, mules, burros, and donkeys •Hogs and pigs •Poultry and eggs •Sheep, goats, and their products
Top Commodities by Acreage
•Forage •Corn •Cattle
Agricultural Revenues4 Amount MI top 20 ranking
Total market value of agriculture production $22,821,000 Total crop sales $17,469,000 Total livestock sales $5,352,000
Key Michigan Products
Corn, soy, and wheat 17,861 acres ( 26.13% of cropland) Revenue from corn, soy, and wheat $9,623,000
Vegetables 1,802 acres ( 2.64% of cropland) Revenue from vegetables $5,142,776
Fruit and tree nuts 9 operations Revenue from fruits, tree nuts, and berries N/A
Dairy farms 11 farms Revenue from milk and other dairy $1,464,000
All animal operations 128 operations
Agricultural Land
Total number of farms 323 Total farmland5 81,536 acres
Forage/pasture/non-crop farmland6 13,190 acres Number of farms using certified organic production 0 Number of farms transitioning to organic production 0 Area of greenhouse/nursery operations (sq. ft) 750
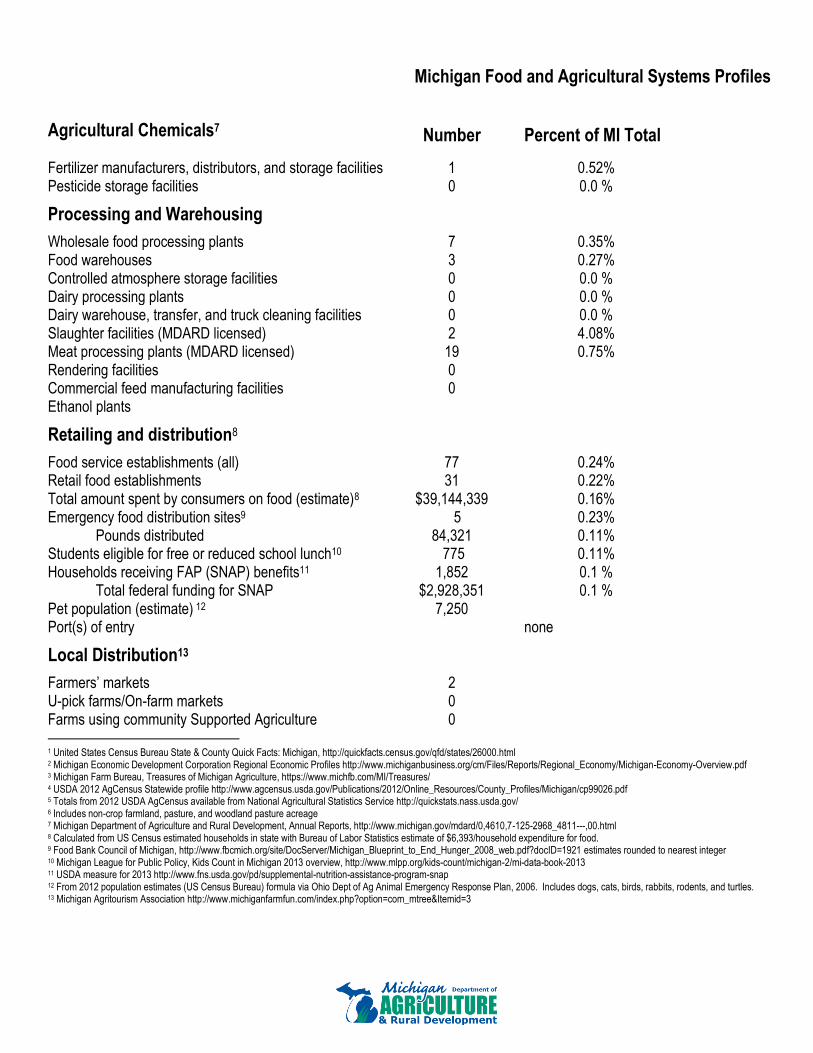
Michigan Food and Agricultural Systems Profiles
Agricultural Chemicals7 Number Percent of MI Total
Fertilizer manufacturers, distributors, and storage facilities 1 0.52% Pesticide storage facilities 0 0.0 %
Processing and Warehousing
Wholesale food processing plants 7 0.35% Food warehouses 3 0.27% Controlled atmosphere storage facilities 0 0.0 % Dairy processing plants 0 0.0 % Dairy warehouse, transfer, and truck cleaning facilities 0 0.0 % Slaughter facilities (MDARD licensed) 2 4.08% Meat processing plants (MDARD licensed) 19 0.75% Rendering facilities 0 Commercial feed manufacturing facilities 0 Ethanol plants
Retailing and distribution8
Food service establishments (all) 77 0.24% Retail food establishments 31 0.22% Total amount spent by consumers on food (estimate)8 $39,144,339 0.16% Emergency food distribution sites9 5 0.23%
Pounds distributed 84,321 0.11% Students eligible for free or reduced school lunch10 775 0.11% Households receiving FAP (SNAP) benefits11 1,852 0.1 %
Total federal funding for SNAP $2,928,351 0.1 % Pet population (estimate) 12 7,250 Port(s) of entry none
Local Distribution13
Farmers’ markets 2 U-pick farms/On-farm markets 0 Farms using community Supported Agriculture 0 1 United States Census Bureau State & County Quick Facts: Michigan, http://quickfacts.census.gov/qfd/states/26000.html 2 Michigan Economic Development Corporation Regional Economic Profiles http://www.michiganbusiness.org/cm/Files/Reports/Regional_Economy/Michigan-Economy-Overview.pdf 3 Michigan Farm Bureau, Treasures of Michigan Agriculture, https://www.michfb.com/MI/Treasures/ 4 USDA 2012 AgCensus Statewide profile http://www.agcensus.usda.gov/Publications/2012/Online_Resources/County_Profiles/Michigan/cp99026.pdf 5 Totals from 2012 USDA AgCensus available from National Agricultural Statistics Service http://quickstats.nass.usda.gov/ 6 Includes non-crop farmland, pasture, and woodland pasture acreage 7 Michigan Department of Agriculture and Rural Development, Annual Reports, http://www.michigan.gov/mdard/0,4610,7-125-2968_4811---,00.html 8 Calculated from US Census estimated households in state with Bureau of Labor Statistics estimate of $6,393/household expenditure for food. 9 Food Bank Council of Michigan, http://www.fbcmich.org/site/DocServer/Michigan_Blueprint_to_End_Hunger_2008_web.pdf?docID=1921 estimates rounded to nearest integer 10 Michigan League for Public Policy, Kids Count in Michigan 2013 overview, http://www.mlpp.org/kids-count/michigan-2/mi-data-book-2013 11 USDA measure for 2013 http://www.fns.usda.gov/pd/supplemental-nutrition-assistance-program-snap 12 From 2012 population estimates (US Census Bureau) formula via Ohio Dept of Ag Animal Emergency Response Plan, 2006. Includes dogs, cats, birds, rabbits, rodents, and turtles. 13 Michigan Agritourism Association http://www.michiganfarmfun.com/index.php?option=com_mtree&Itemid=3

Michigan Food and Agricultural Systems Profiles
ROSCOMMON
Area1 519.64 square miles Population2 24,447 Largest City Houghton Lake Watershed(s) Muskegon, Au Sable, Saginaw
Top Commodities by Volume of Sales3
•Cattle and calves •Other crops and hay •Nursery, greenhouse, floriculture, and sod
•Horses, ponies, mules, burros, and donkeys •Vegetables, melons, potatoes, and sweet potatoes •Sheep, goats, and their products
Top Commodities by Acreage
•Forage •Christmas Trees •Cattle
Agricultural Revenues4 Amount MI top 20 ranking
Total market value of agriculture production $ Total crop sales $290,000 Total livestock sales N/A
Key Michigan Products
Corn, soy, and wheat acres ( .00% of cropland) Revenue from corn, soy, and wheat $41,000
Vegetables acres ( .00% of cropland) Revenue from vegetables $
Fruit and tree nuts N/A operations Revenue from fruits, tree nuts, and berries N/A
Dairy farms N/A farms Revenue from milk and other dairy N/A
All animal operations 20 operations
Agricultural Land
Total number of farms 58 Total farmland5 7,433 acres
Forage/pasture/non-crop farmland6 2,948 acres Number of farms using certified organic production 0 Number of farms transitioning to organic production 0 Area of greenhouse/nursery operations (sq. ft) n/a

Michigan Food and Agricultural Systems Profiles
Agricultural Chemicals7 Number Percent of MI Total
Fertilizer manufacturers, distributors, and storage facilities 0 0.0 % Pesticide storage facilities 0 0.0 %
Processing and Warehousing
Wholesale food processing plants 3 0.15% Food warehouses 6 0.54% Controlled atmosphere storage facilities 0 0.0 % Dairy processing plants 0 0.0 % Dairy warehouse, transfer, and truck cleaning facilities 0 0.0 % Slaughter facilities (MDARD licensed) 0 0.0 % Meat processing plants (MDARD licensed) 12 0.47% Rendering facilities 0 Commercial feed manufacturing facilities 0 Ethanol plants
Retailing and distribution8
Food service establishments (all) 113 0.36% Retail food establishments 55 0.38% Total amount spent by consumers on food (estimate)8 $73,027,239 0.3 % Emergency food distribution sites9 5 0.22%
Pounds distributed 233,367 0.3 % Students eligible for free or reduced school lunch10 2,107 0.29% Households receiving FAP (SNAP) benefits11 6,234 0.33%
Total federal funding for SNAP $9,857,096 0.33% Pet population (estimate) 12 13,328 Port(s) of entry none
Local Distribution13
Farmers’ markets 1 U-pick farms/On-farm markets 1 Farms using community Supported Agriculture 0 1 United States Census Bureau State & County Quick Facts: Michigan, http://quickfacts.census.gov/qfd/states/26000.html 2 Michigan Economic Development Corporation Regional Economic Profiles http://www.michiganbusiness.org/cm/Files/Reports/Regional_Economy/Michigan-Economy-Overview.pdf 3 Michigan Farm Bureau, Treasures of Michigan Agriculture, https://www.michfb.com/MI/Treasures/ 4 USDA 2012 AgCensus Statewide profile http://www.agcensus.usda.gov/Publications/2012/Online_Resources/County_Profiles/Michigan/cp99026.pdf 5 Totals from 2012 USDA AgCensus available from National Agricultural Statistics Service http://quickstats.nass.usda.gov/ 6 Includes non-crop farmland, pasture, and woodland pasture acreage 7 Michigan Department of Agriculture and Rural Development, Annual Reports, http://www.michigan.gov/mdard/0,4610,7-125-2968_4811---,00.html 8 Calculated from US Census estimated households in state with Bureau of Labor Statistics estimate of $6,393/household expenditure for food. 9 Food Bank Council of Michigan, http://www.fbcmich.org/site/DocServer/Michigan_Blueprint_to_End_Hunger_2008_web.pdf?docID=1921 estimates rounded to nearest integer 10 Michigan League for Public Policy, Kids Count in Michigan 2013 overview, http://www.mlpp.org/kids-count/michigan-2/mi-data-book-2013 11 USDA measure for 2013 http://www.fns.usda.gov/pd/supplemental-nutrition-assistance-program-snap 12 From 2012 population estimates (US Census Bureau) formula via Ohio Dept of Ag Animal Emergency Response Plan, 2006. Includes dogs, cats, birds, rabbits, rodents, and turtles. 13 Michigan Agritourism Association http://www.michiganfarmfun.com/index.php?option=com_mtree&Itemid=3
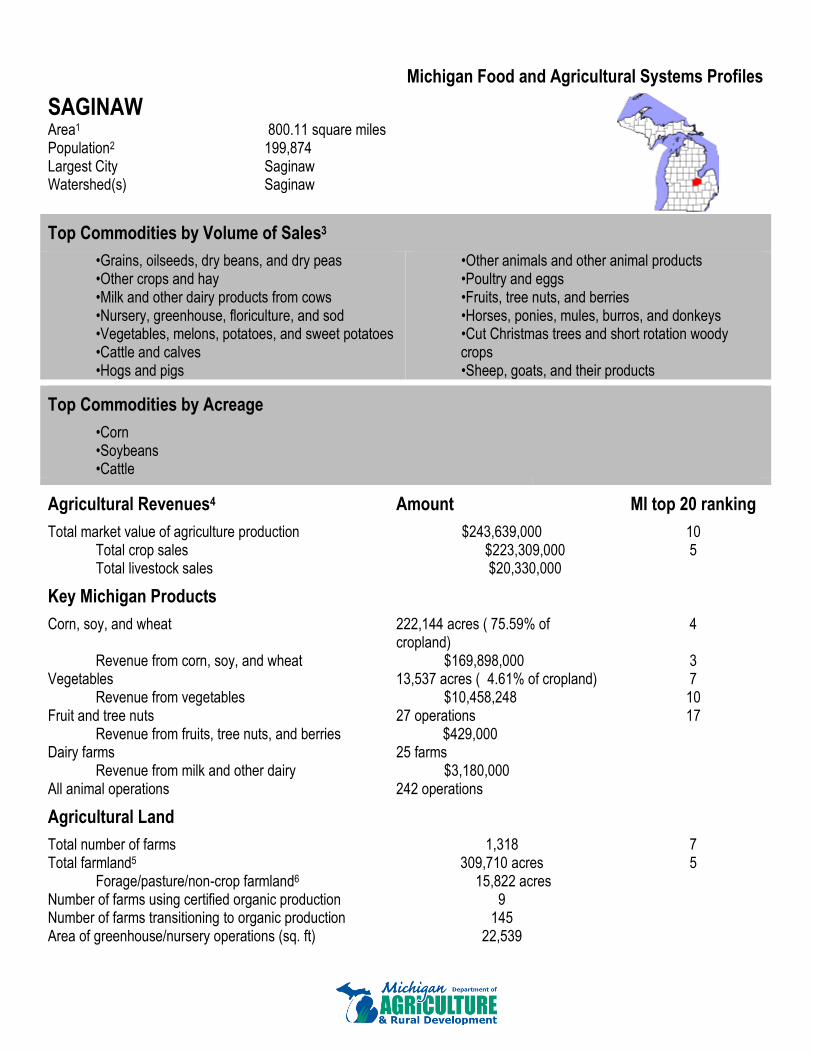
Michigan Food and Agricultural Systems Profiles
SAGINAW
Area1 800.11 square miles Population2 199,874 Largest City Saginaw Watershed(s) Saginaw
Top Commodities by Volume of Sales3
•Grains, oilseeds, dry beans, and dry peas •Other crops and hay •Milk and other dairy products from cows •Nursery, greenhouse, floriculture, and sod •Vegetables, melons, potatoes, and sweet potatoes •Cattle and calves •Hogs and pigs
•Other animals and other animal products •Poultry and eggs •Fruits, tree nuts, and berries •Horses, ponies, mules, burros, and donkeys •Cut Christmas trees and short rotation woody crops •Sheep, goats, and their products
Top Commodities by Acreage
•Corn •Soybeans •Cattle
Agricultural Revenues4 Amount MI top 20 ranking
Total market value of agriculture production $243,639,000 10 Total crop sales $223,309,000 5 Total livestock sales $20,330,000
Key Michigan Products
Corn, soy, and wheat 222,144 acres ( 75.59% of cropland)
4
Revenue from corn, soy, and wheat $169,898,000 3 Vegetables 13,537 acres ( 4.61% of cropland) 7
Revenue from vegetables $10,458,248 10 Fruit and tree nuts 27 operations 17
Revenue from fruits, tree nuts, and berries $429,000 Dairy farms 25 farms
Revenue from milk and other dairy $3,180,000 All animal operations 242 operations
Agricultural Land
Total number of farms 1,318 7 Total farmland5 309,710 acres 5
Forage/pasture/non-crop farmland6 15,822 acres Number of farms using certified organic production 9 Number of farms transitioning to organic production 145 Area of greenhouse/nursery operations (sq. ft) 22,539

Michigan Food and Agricultural Systems Profiles
Agricultural Chemicals7 Number Percent of MI Total
Fertilizer manufacturers, distributors, and storage facilities 12 6.28% Pesticide storage facilities 8 5.41%
Processing and Warehousing
Wholesale food processing plants 20 1. % Food warehouses 27 2.42% Controlled atmosphere storage facilities 0 0.0 % Dairy processing plants 0 0.0 % Dairy warehouse, transfer, and truck cleaning facilities 0 0.0 % Slaughter facilities (MDARD licensed) 1 2.04% Meat processing plants (MDARD licensed) 34 1.34% Rendering facilities 3 Commercial feed manufacturing facilities 0 Ethanol plants
Retailing and distribution8
Food service establishments (all) 670 2.13% Retail food establishments 296 2.07% Total amount spent by consumers on food (estimate)8 $494,984,418 2.03% Emergency food distribution sites9 48 2.08%
Pounds distributed 1,366,828 1.77% Students eligible for free or reduced school lunch10 16,781 2.29% Households receiving FAP (SNAP) benefits11 48,752 2.55%
Total federal funding for SNAP $77,085,843 2.55% Pet population (estimate) 12 108,971 Port(s) of entry none
Local Distribution13
Farmers’ markets 5 U-pick farms/On-farm markets 4 Farms using community Supported Agriculture 4 1 United States Census Bureau State & County Quick Facts: Michigan, http://quickfacts.census.gov/qfd/states/26000.html 2 Michigan Economic Development Corporation Regional Economic Profiles http://www.michiganbusiness.org/cm/Files/Reports/Regional_Economy/Michigan-Economy-Overview.pdf 3 Michigan Farm Bureau, Treasures of Michigan Agriculture, https://www.michfb.com/MI/Treasures/ 4 USDA 2012 AgCensus Statewide profile http://www.agcensus.usda.gov/Publications/2012/Online_Resources/County_Profiles/Michigan/cp99026.pdf 5 Totals from 2012 USDA AgCensus available from National Agricultural Statistics Service http://quickstats.nass.usda.gov/ 6 Includes non-crop farmland, pasture, and woodland pasture acreage 7 Michigan Department of Agriculture and Rural Development, Annual Reports, http://www.michigan.gov/mdard/0,4610,7-125-2968_4811---,00.html 8 Calculated from US Census estimated households in state with Bureau of Labor Statistics estimate of $6,393/household expenditure for food. 9 Food Bank Council of Michigan, http://www.fbcmich.org/site/DocServer/Michigan_Blueprint_to_End_Hunger_2008_web.pdf?docID=1921 estimates rounded to nearest integer 10 Michigan League for Public Policy, Kids Count in Michigan 2013 overview, http://www.mlpp.org/kids-count/michigan-2/mi-data-book-2013 11 USDA measure for 2013 http://www.fns.usda.gov/pd/supplemental-nutrition-assistance-program-snap 12 From 2012 population estimates (US Census Bureau) formula via Ohio Dept of Ag Animal Emergency Response Plan, 2006. Includes dogs, cats, birds, rabbits, rodents, and turtles. 13 Michigan Agritourism Association http://www.michiganfarmfun.com/index.php?option=com_mtree&Itemid=3

Michigan Food and Agricultural Systems Profiles
SANILAC
Area1 721.17 square miles Population2 43,051 Largest City Sandusky Watershed(s) Saginaw, Black
Top Commodities by Volume of Sales3
•Grains, oilseeds, dry beans, and dry peas •Milk and other dairy products from cows •Cattle and calves •Other crops and hay •Nursery, greenhouse, floriculture, and sod
•Vegetables, melons, potatoes, and sweet potatoes •Hogs and pigs •Poultry and eggs •Other animals and other animal products •Horses, ponies, mules, burros, and donkeys
Top Commodities by Acreage
•Soybeans •Corn •Pheasants
Agricultural Revenues4 Amount MI top 20 ranking
Total market value of agriculture production $420,966,000 4 Total crop sales $280,054,000 3 Total livestock sales $140,912,000 6
Key Michigan Products
Corn, soy, and wheat 298,551 acres ( 69.86% of cropland)
1
Revenue from corn, soy, and wheat $203,832,000 1 Vegetables 1,006 acres ( .24% of cropland)
Revenue from vegetables $1,067,160 Fruit and tree nuts 9 operations
Revenue from fruits, tree nuts, and berries $51,000 Dairy farms 134 farms 1
Revenue from milk and other dairy (D) All animal operations 485 operations 4
Agricultural Land
Total number of farms 1,467 3 Total farmland5 456,877 acres 1
Forage/pasture/non-crop farmland6 29,511 acres 3 Number of farms using certified organic production 26 Number of farms transitioning to organic production 151 Area of greenhouse/nursery operations (sq. ft) n/a

Michigan Food and Agricultural Systems Profiles
Agricultural Chemicals7 Number Percent of MI Total
Fertilizer manufacturers, distributors, and storage facilities 6 3.14% Pesticide storage facilities 5 3.38%
Processing and Warehousing
Wholesale food processing plants 18 0.9 % Food warehouses 7 0.63% Controlled atmosphere storage facilities 0 0.0 % Dairy processing plants 0 0.0 % Dairy warehouse, transfer, and truck cleaning facilities 0 0.0 % Slaughter facilities (MDARD licensed) 0 0.0 % Meat processing plants (MDARD licensed) 28 1.1 % Rendering facilities 3 Commercial feed manufacturing facilities 0 Ethanol plants
Retailing and distribution8
Food service establishments (all) 171 0.54% Retail food establishments 84 0.59% Total amount spent by consumers on food (estimate)8 $409,682,619 1.68% Emergency food distribution sites9 6 0.24%
Pounds distributed 485,455 0.63% Students eligible for free or reduced school lunch10 10,640 1.45% Households receiving FAP (SNAP) benefits11 31,494 1.65%
Total federal funding for SNAP $49,797,784 1.65% Pet population (estimate) 12 23,471 Port(s) of entry none
Local Distribution13
Farmers’ markets 2 U-pick farms/On-farm markets 0 Farms using community Supported Agriculture 9 1 United States Census Bureau State & County Quick Facts: Michigan, http://quickfacts.census.gov/qfd/states/26000.html 2 Michigan Economic Development Corporation Regional Economic Profiles http://www.michiganbusiness.org/cm/Files/Reports/Regional_Economy/Michigan-Economy-Overview.pdf 3 Michigan Farm Bureau, Treasures of Michigan Agriculture, https://www.michfb.com/MI/Treasures/ 4 USDA 2012 AgCensus Statewide profile http://www.agcensus.usda.gov/Publications/2012/Online_Resources/County_Profiles/Michigan/cp99026.pdf 5 Totals from 2012 USDA AgCensus available from National Agricultural Statistics Service http://quickstats.nass.usda.gov/ 6 Includes non-crop farmland, pasture, and woodland pasture acreage 7 Michigan Department of Agriculture and Rural Development, Annual Reports, http://www.michigan.gov/mdard/0,4610,7-125-2968_4811---,00.html 8 Calculated from US Census estimated households in state with Bureau of Labor Statistics estimate of $6,393/household expenditure for food. 9 Food Bank Council of Michigan, http://www.fbcmich.org/site/DocServer/Michigan_Blueprint_to_End_Hunger_2008_web.pdf?docID=1921 estimates rounded to nearest integer 10 Michigan League for Public Policy, Kids Count in Michigan 2013 overview, http://www.mlpp.org/kids-count/michigan-2/mi-data-book-2013 11 USDA measure for 2013 http://www.fns.usda.gov/pd/supplemental-nutrition-assistance-program-snap 12 From 2012 population estimates (US Census Bureau) formula via Ohio Dept of Ag Animal Emergency Response Plan, 2006. Includes dogs, cats, birds, rabbits, rodents, and turtles. 13 Michigan Agritourism Association http://www.michiganfarmfun.com/index.php?option=com_mtree&Itemid=3

Michigan Food and Agricultural Systems Profiles
SCHOOLCRAFT
Area1 500.59 square miles Population2 8,478 Largest City Manistique Watershed(s) Manistique
Top Commodities by Volume of Sales3
•Grains, oilseeds, dry beans, and dry peas •Milk and other dairy products from cows •Cattle and calves •Fruits, tree nuts, and berries
•Other animals and other animal products •Vegetables, melons, potatoes, and sweet potatoes •Hogs and pigs
Top Commodities by Acreage
•Forage •Oats •Cattle
Agricultural Revenues4 Amount MI top 20 ranking
Total market value of agriculture production $2,169,000 Total crop sales $1,365,000 Total livestock sales $804,000
Key Michigan Products
Corn, soy, and wheat acres ( .00% of cropland) Revenue from corn, soy, and wheat $
Vegetables 24 acres ( .15% of cropland) Revenue from vegetables $
Fruit and tree nuts 4 operations Revenue from fruits, tree nuts, and berries $13,000
Dairy farms 1 farms Revenue from milk and other dairy $26,170,000 16
All animal operations 24 operations
Agricultural Land
Total number of farms 65 Total farmland5 19,423 acres
Forage/pasture/non-crop farmland6 2,971 acres Number of farms using certified organic production 0 Number of farms transitioning to organic production 0 Area of greenhouse/nursery operations (sq. ft) n/a

Michigan Food and Agricultural Systems Profiles
Agricultural Chemicals7 Number Percent of MI Total
Fertilizer manufacturers, distributors, and storage facilities 0 0.0 % Pesticide storage facilities 0 0.0 %
Processing and Warehousing
Wholesale food processing plants 3 0.15% Food warehouses 3 0.27% Controlled atmosphere storage facilities 0 0.0 % Dairy processing plants 0 0.0 % Dairy warehouse, transfer, and truck cleaning facilities 0 0.0 % Slaughter facilities (MDARD licensed) 0 0.0 % Meat processing plants (MDARD licensed) 2 0.08% Rendering facilities 0 Commercial feed manufacturing facilities 0 Ethanol plants
Retailing and distribution8
Food service establishments (all) 49 0.16% Retail food establishments 23 0.16% Total amount spent by consumers on food (estimate)8 $142,295,394 0.58% Emergency food distribution sites9 3 0.12%
Pounds distributed 54,404 0.07% Students eligible for free or reduced school lunch10 6,507 0.89% Households receiving FAP (SNAP) benefits11 12,967 0.68%
Total federal funding for SNAP $20,503,202 0.68% Pet population (estimate) 12 4,622 Port(s) of entry none
Local Distribution13
Farmers’ markets 1 U-pick farms/On-farm markets 2 Farms using community Supported Agriculture 0 1 United States Census Bureau State & County Quick Facts: Michigan, http://quickfacts.census.gov/qfd/states/26000.html 2 Michigan Economic Development Corporation Regional Economic Profiles http://www.michiganbusiness.org/cm/Files/Reports/Regional_Economy/Michigan-Economy-Overview.pdf 3 Michigan Farm Bureau, Treasures of Michigan Agriculture, https://www.michfb.com/MI/Treasures/ 4 USDA 2012 AgCensus Statewide profile http://www.agcensus.usda.gov/Publications/2012/Online_Resources/County_Profiles/Michigan/cp99026.pdf 5 Totals from 2012 USDA AgCensus available from National Agricultural Statistics Service http://quickstats.nass.usda.gov/ 6 Includes non-crop farmland, pasture, and woodland pasture acreage 7 Michigan Department of Agriculture and Rural Development, Annual Reports, http://www.michigan.gov/mdard/0,4610,7-125-2968_4811---,00.html 8 Calculated from US Census estimated households in state with Bureau of Labor Statistics estimate of $6,393/household expenditure for food. 9 Food Bank Council of Michigan, http://www.fbcmich.org/site/DocServer/Michigan_Blueprint_to_End_Hunger_2008_web.pdf?docID=1921 estimates rounded to nearest integer 10 Michigan League for Public Policy, Kids Count in Michigan 2013 overview, http://www.mlpp.org/kids-count/michigan-2/mi-data-book-2013 11 USDA measure for 2013 http://www.fns.usda.gov/pd/supplemental-nutrition-assistance-program-snap 12 From 2012 population estimates (US Census Bureau) formula via Ohio Dept of Ag Animal Emergency Response Plan, 2006. Includes dogs, cats, birds, rabbits, rodents, and turtles. 13 Michigan Agritourism Association http://www.michiganfarmfun.com/index.php?option=com_mtree&Itemid=3

Michigan Food and Agricultural Systems Profiles
SHIAWASSEE
Area1 962.57 square miles Population2 70,638 Largest City Corunna Watershed(s) Saginaw, Grand
Top Commodities by Volume of Sales3
•Grains, oilseeds, dry beans, and dry peas •Milk and other dairy products from cows •Cattle and calves •Nursery, greenhouse, floriculture, and sod •Other crops and hay •Horses, ponies, mules, burros, and donkeys •Fruits, tree nuts, and berries
•Hogs and pigs •Vegetables, melons, potatoes, and sweet potatoes •Sheep, goats, and their products •Other animals and other animal products •Poultry and eggs •Cut Christmas trees and short rotation woody crops
Top Commodities by Acreage
•Soybeans •Corn •Cattle
Agricultural Revenues4 Amount MI top 20 ranking
Total market value of agriculture production $145,169,000 Total crop sales $113,439,000 Total livestock sales $31,730,000
Key Michigan Products
Corn, soy, and wheat 168,027 acres ( 80.67% of cropland)
9
Revenue from corn, soy, and wheat $106,455,000 11 Vegetables 80 acres ( .04% of cropland)
Revenue from vegetables $365,000 Fruit and tree nuts 5 operations
Revenue from fruits, tree nuts, and berries N/A Dairy farms 25 farms
Revenue from milk and other dairy (D) All animal operations 351 operations
Agricultural Land
Total number of farms 1,033 Total farmland5 223,370 acres 14
Forage/pasture/non-crop farmland6 15,073 acres Number of farms using certified organic production 10 Number of farms transitioning to organic production 155 Area of greenhouse/nursery operations (sq. ft) N/A

Michigan Food and Agricultural Systems Profiles
Agricultural Chemicals7 Number Percent of MI Total
Fertilizer manufacturers, distributors, and storage facilities 5 2.62% Pesticide storage facilities 4 2.7 %
Processing and Warehousing
Wholesale food processing plants 7 0.35% Food warehouses 8 0.72% Controlled atmosphere storage facilities 1 1.52% Dairy processing plants 1 1.27% Dairy warehouse, transfer, and truck cleaning facilities 0 0.0 % Slaughter facilities (MDARD licensed) 1 2.04% Meat processing plants (MDARD licensed) 19 0.75% Rendering facilities 0 Commercial feed manufacturing facilities 0 Ethanol plants
Retailing and distribution8
Food service establishments (all) 203 0.64% Retail food establishments 77 0.54% Total amount spent by consumers on food (estimate)8 $104,928,309 0.43% Emergency food distribution sites9 22 0.95%
Pounds distributed 409,402 0.53% Students eligible for free or reduced school lunch10 3,780 0.52% Households receiving FAP (SNAP) benefits11 9,154 0.48%
Total federal funding for SNAP $14,474,151 0.48% Pet population (estimate) 12 38,512 Port(s) of entry none
Local Distribution13
Farmers’ markets 8 U-pick farms/On-farm markets 2 Farms using community Supported Agriculture 7 1 United States Census Bureau State & County Quick Facts: Michigan, http://quickfacts.census.gov/qfd/states/26000.html 2 Michigan Economic Development Corporation Regional Economic Profiles http://www.michiganbusiness.org/cm/Files/Reports/Regional_Economy/Michigan-Economy-Overview.pdf 3 Michigan Farm Bureau, Treasures of Michigan Agriculture, https://www.michfb.com/MI/Treasures/ 4 USDA 2012 AgCensus Statewide profile http://www.agcensus.usda.gov/Publications/2012/Online_Resources/County_Profiles/Michigan/cp99026.pdf 5 Totals from 2012 USDA AgCensus available from National Agricultural Statistics Service http://quickstats.nass.usda.gov/ 6 Includes non-crop farmland, pasture, and woodland pasture acreage 7 Michigan Department of Agriculture and Rural Development, Annual Reports, http://www.michigan.gov/mdard/0,4610,7-125-2968_4811---,00.html 8 Calculated from US Census estimated households in state with Bureau of Labor Statistics estimate of $6,393/household expenditure for food. 9 Food Bank Council of Michigan, http://www.fbcmich.org/site/DocServer/Michigan_Blueprint_to_End_Hunger_2008_web.pdf?docID=1921 estimates rounded to nearest integer 10 Michigan League for Public Policy, Kids Count in Michigan 2013 overview, http://www.mlpp.org/kids-count/michigan-2/mi-data-book-2013 11 USDA measure for 2013 http://www.fns.usda.gov/pd/supplemental-nutrition-assistance-program-snap 12 From 2012 population estimates (US Census Bureau) formula via Ohio Dept of Ag Animal Emergency Response Plan, 2006. Includes dogs, cats, birds, rabbits, rodents, and turtles. 13 Michigan Agritourism Association http://www.michiganfarmfun.com/index.php?option=com_mtree&Itemid=3

Michigan Food and Agricultural Systems Profiles
ST CLAIR
Area1 1,171.36 square miles Population2 162,678 Largest City Port Huron Watershed(s) Pine, Belle, Black
Top Commodities by Volume of Sales3
•Grains, oilseeds, dry beans, and dry peas •Nursery, greenhouse, floriculture, and sod •Vegetables, melons, potatoes, and sweet potatoes •Milk and other dairy products from cows •Other crops and hay •Cattle and calves •Fruits, tree nuts, and berries
•Horses, ponies, mules, burros, and donkeys •Other animals and other animal products •Poultry and eggs •Cut Christmas trees and short rotation woody crops •Hogs and pigs •Sheep, goats, and their products
Top Commodities by Acreage
•Soybeans •Corn •Cattle
Agricultural Revenues4 Amount MI top 20 ranking
Total market value of agriculture production $107,936,000 Total crop sales $97,871,000 Total livestock sales $10,065,000
Key Michigan Products
Corn, soy, and wheat 122,069 acres ( 74.60% of cropland)
19
Revenue from corn, soy, and wheat $84,998,000 19 Vegetables 1,052 acres ( .64% of cropland)
Revenue from vegetables $2,074,260 Fruit and tree nuts 15 operations
Revenue from fruits, tree nuts, and berries $212,000 Dairy farms 12 farms
Revenue from milk and other dairy (D) All animal operations 340 operations
Agricultural Land
Total number of farms 1,049 Total farmland5 179,967 acres
Forage/pasture/non-crop farmland6 16,334 acres Number of farms using certified organic production 5 Number of farms transitioning to organic production 147 Area of greenhouse/nursery operations (sq. ft) N/A

Michigan Food and Agricultural Systems Profiles
Agricultural Chemicals7 Number Percent of MI Total
Fertilizer manufacturers, distributors, and storage facilities 0 0.0 % Pesticide storage facilities 0 0.0 %
Processing and Warehousing
Wholesale food processing plants 9 0.45% Food warehouses 12 1.08% Controlled atmosphere storage facilities 0 0.0 % Dairy processing plants 0 0.0 % Dairy warehouse, transfer, and truck cleaning facilities 0 0.0 % Slaughter facilities (MDARD licensed) 0 0.0 % Meat processing plants (MDARD licensed) 0 0.0 % Rendering facilities 0 Commercial feed manufacturing facilities 0 Ethanol plants Marysville Ethanol, LLC
Retailing and distribution8
Food service establishments (all) 481 1.53% Retail food establishments 222 1.55% Total amount spent by consumers on food (estimate)8 $23,340,843 0.1 % Emergency food distribution sites9 19 0.8 %
Pounds distributed 1,201,369 1.55% Students eligible for free or reduced school lunch10 473 0.06% Households receiving FAP (SNAP) benefits11 1,407 0.07%
Total federal funding for SNAP $2,224,725 0.07% Pet population (estimate) 12 88,692 Port(s) of entry Port Huron Bridge (motor and rail)
Local Distribution13
Farmers’ markets 2 U-pick farms/On-farm markets 3 Farms using community Supported Agriculture 7 1 United States Census Bureau State & County Quick Facts: Michigan, http://quickfacts.census.gov/qfd/states/26000.html 2 Michigan Economic Development Corporation Regional Economic Profiles http://www.michiganbusiness.org/cm/Files/Reports/Regional_Economy/Michigan-Economy-Overview.pdf 3 Michigan Farm Bureau, Treasures of Michigan Agriculture, https://www.michfb.com/MI/Treasures/ 4 USDA 2012 AgCensus Statewide profile http://www.agcensus.usda.gov/Publications/2012/Online_Resources/County_Profiles/Michigan/cp99026.pdf 5 Totals from 2012 USDA AgCensus available from National Agricultural Statistics Service http://quickstats.nass.usda.gov/ 6 Includes non-crop farmland, pasture, and woodland pasture acreage 7 Michigan Department of Agriculture and Rural Development, Annual Reports, http://www.michigan.gov/mdard/0,4610,7-125-2968_4811---,00.html 8 Calculated from US Census estimated households in state with Bureau of Labor Statistics estimate of $6,393/household expenditure for food. 9 Food Bank Council of Michigan, http://www.fbcmich.org/site/DocServer/Michigan_Blueprint_to_End_Hunger_2008_web.pdf?docID=1921 estimates rounded to nearest integer 10 Michigan League for Public Policy, Kids Count in Michigan 2013 overview, http://www.mlpp.org/kids-count/michigan-2/mi-data-book-2013 11 USDA measure for 2013 http://www.fns.usda.gov/pd/supplemental-nutrition-assistance-program-snap 12 From 2012 population estimates (US Census Bureau) formula via Ohio Dept of Ag Animal Emergency Response Plan, 2006. Includes dogs, cats, birds, rabbits, rodents, and turtles. 13 Michigan Agritourism Association http://www.michiganfarmfun.com/index.php?option=com_mtree&Itemid=3

Michigan Food and Agricultural Systems Profiles
ST JOSEPH
Area1 530.67 square miles Population2 61,264 Largest City Three Rivers Watershed(s) St. Joseph
Top Commodities by Volume of Sales3
•Grains, oilseeds, dry beans, and dry peas •Vegetables, melons, potatoes, and sweet potatoes •Milk and other dairy products from cows •Hogs and pigs •Cattle and calves •Nursery, greenhouse, floriculture, and sod •Other crops and hay
•Poultry and eggs •Other animals and other animal products •Fruits, tree nuts, and berries •Horses, ponies, mules, burros, and donkeys •Sheep, goats, and their products •Cut Christmas trees and short rotation woody crops
Top Commodities by Acreage
•Corn •Soybeans •Broilers
Agricultural Revenues4 Amount MI top 20 ranking
Total market value of agriculture production $238,053,000 11 Total crop sales $190,933,000 9 Total livestock sales $47,120,000 19
Key Michigan Products
Corn, soy, and wheat 157,839 acres ( 77.40% of cropland)
14
Revenue from corn, soy, and wheat $150,935,000 6 Vegetables 21,716 acres ( 10.65% of cropland) 3
Revenue from vegetables $34,461,000 3 Fruit and tree nuts 16 operations
Revenue from fruits, tree nuts, and berries N/A Dairy farms 38 farms 16
Revenue from milk and other dairy (D) All animal operations 362 operations 20
Agricultural Land
Total number of farms 967 Total farmland5 221,745 acres 16
Forage/pasture/non-crop farmland6 17,814 acres Number of farms using certified organic production 14 Number of farms transitioning to organic production 149 Area of greenhouse/nursery operations (sq. ft) n/a

Michigan Food and Agricultural Systems Profiles
Agricultural Chemicals7 Number Percent of MI Total
Fertilizer manufacturers, distributors, and storage facilities 0 0.0 % Pesticide storage facilities 0 0.0 %
Processing and Warehousing
Wholesale food processing plants 12 0.6 % Food warehouses 5 0.45% Controlled atmosphere storage facilities 0 0.0 % Dairy processing plants 1 1.27% Dairy warehouse, transfer, and truck cleaning facilities 0 0.0 % Slaughter facilities (MDARD licensed) 0 0.0 % Meat processing plants (MDARD licensed) 0 0.0 % Rendering facilities 0 Commercial feed manufacturing facilities 0 Ethanol plants
Retailing and distribution8
Food service establishments (all) 199 0.63% Retail food establishments 84 0.59% Total amount spent by consumers on food (estimate)8 $175,027,554 0.72% Emergency food distribution sites9 19 0.82%
Pounds distributed 410,982 0.53% Students eligible for free or reduced school lunch10 5,771 0.79% Households receiving FAP (SNAP) benefits11 13,316 0.7 %
Total federal funding for SNAP $21,055,035 0.7 % Pet population (estimate) 12 33,401 Port(s) of entry none
Local Distribution13
Farmers’ markets 2 U-pick farms/On-farm markets 3 Farms using community Supported Agriculture 9 1 United States Census Bureau State & County Quick Facts: Michigan, http://quickfacts.census.gov/qfd/states/26000.html 2 Michigan Economic Development Corporation Regional Economic Profiles http://www.michiganbusiness.org/cm/Files/Reports/Regional_Economy/Michigan-Economy-Overview.pdf 3 Michigan Farm Bureau, Treasures of Michigan Agriculture, https://www.michfb.com/MI/Treasures/ 4 USDA 2012 AgCensus Statewide profile http://www.agcensus.usda.gov/Publications/2012/Online_Resources/County_Profiles/Michigan/cp99026.pdf 5 Totals from 2012 USDA AgCensus available from National Agricultural Statistics Service http://quickstats.nass.usda.gov/ 6 Includes non-crop farmland, pasture, and woodland pasture acreage 7 Michigan Department of Agriculture and Rural Development, Annual Reports, http://www.michigan.gov/mdard/0,4610,7-125-2968_4811---,00.html 8 Calculated from US Census estimated households in state with Bureau of Labor Statistics estimate of $6,393/household expenditure for food. 9 Food Bank Council of Michigan, http://www.fbcmich.org/site/DocServer/Michigan_Blueprint_to_End_Hunger_2008_web.pdf?docID=1921 estimates rounded to nearest integer 10 Michigan League for Public Policy, Kids Count in Michigan 2013 overview, http://www.mlpp.org/kids-count/michigan-2/mi-data-book-2013 11 USDA measure for 2013 http://www.fns.usda.gov/pd/supplemental-nutrition-assistance-program-snap 12 From 2012 population estimates (US Census Bureau) formula via Ohio Dept of Ag Animal Emergency Response Plan, 2006. Includes dogs, cats, birds, rabbits, rodents, and turtles. 13 Michigan Agritourism Association http://www.michiganfarmfun.com/index.php?option=com_mtree&Itemid=3

Michigan Food and Agricultural Systems Profiles
TUSCOLA
Area1 803.13 square miles Population2 55,678 Largest City Caro Watershed(s) Saginaw, Sebewaing
Top Commodities by Volume of Sales3
•Grains, oilseeds, dry beans, and dry peas •Nursery, greenhouse, floriculture, and sod •Milk and other dairy products from cows •Cattle and calves •Vegetables, melons, potatoes, and sweet potatoes •Other crops and hay
•Sheep, goats, and their products •Horses, ponies, mules, burros, and donkeys •Hogs and pigs •Fruits, tree nuts, and berries •Cut Christmas trees and short rotation woody crops •Poultry and eggs
Top Commodities by Acreage
•Corn •Soybeans •Layers
Agricultural Revenues4 Amount MI top 20 ranking
Total market value of agriculture production $274,446,000 7 Total crop sales $226,266,000 4 Total livestock sales $48,180,000 18
Key Michigan Products
Corn, soy, and wheat 192,676 acres ( 63.66% of cropland)
6
Revenue from corn, soy, and wheat $156,299,000 5 Vegetables 6,135 acres ( 2.03% of cropland) 16
Revenue from vegetables $8,344,465 13 Fruit and tree nuts 16 operations
Revenue from fruits, tree nuts, and berries $120,000 Dairy farms 38 farms 17
Revenue from milk and other dairy $10,970,000 All animal operations 392 operations 16
Agricultural Land
Total number of farms 1,322 6 Total farmland5 325,372 acres 4
Forage/pasture/non-crop farmland6 22,719 acres 19 Number of farms using certified organic production 46 Number of farms transitioning to organic production 157 Area of greenhouse/nursery operations (sq. ft) n/a

Michigan Food and Agricultural Systems Profiles
Agricultural Chemicals7 Number Percent of MI Total
Fertilizer manufacturers, distributors, and storage facilities 6 3.14% Pesticide storage facilities 5 3.38%
Processing and Warehousing
Wholesale food processing plants 12 0.6 % Food warehouses 3 0.27% Controlled atmosphere storage facilities 0 0.0 % Dairy processing plants 0 0.0 % Dairy warehouse, transfer, and truck cleaning facilities 0 0.0 % Slaughter facilities (MDARD licensed) 0 0.0 % Meat processing plants (MDARD licensed) 26 1.03% Rendering facilities 0 Commercial feed manufacturing facilities 0 Ethanol plants POET Biorefining - Caro
Retailing and distribution8
Food service establishments (all) 149 0.47% Retail food establishments 80 0.56% Total amount spent by consumers on food (estimate)8 $135,806,499 0.56% Emergency food distribution sites9 12 0.51%
Pounds distributed 295,531 0.38% Students eligible for free or reduced school lunch10 5,216 0.71% Households receiving FAP (SNAP) benefits11 10,524 0.55%
Total federal funding for SNAP $16,640,372 0.55% Pet population (estimate) 12 30,356 Port(s) of entry none
Local Distribution13
Farmers’ markets 2 U-pick farms/On-farm markets 0 Farms using community Supported Agriculture 7 1 United States Census Bureau State & County Quick Facts: Michigan, http://quickfacts.census.gov/qfd/states/26000.html 2 Michigan Economic Development Corporation Regional Economic Profiles http://www.michiganbusiness.org/cm/Files/Reports/Regional_Economy/Michigan-Economy-Overview.pdf 3 Michigan Farm Bureau, Treasures of Michigan Agriculture, https://www.michfb.com/MI/Treasures/ 4 USDA 2012 AgCensus Statewide profile http://www.agcensus.usda.gov/Publications/2012/Online_Resources/County_Profiles/Michigan/cp99026.pdf 5 Totals from 2012 USDA AgCensus available from National Agricultural Statistics Service http://quickstats.nass.usda.gov/ 6 Includes non-crop farmland, pasture, and woodland pasture acreage 7 Michigan Department of Agriculture and Rural Development, Annual Reports, http://www.michigan.gov/mdard/0,4610,7-125-2968_4811---,00.html 8 Calculated from US Census estimated households in state with Bureau of Labor Statistics estimate of $6,393/household expenditure for food. 9 Food Bank Council of Michigan, http://www.fbcmich.org/site/DocServer/Michigan_Blueprint_to_End_Hunger_2008_web.pdf?docID=1921 estimates rounded to nearest integer 10 Michigan League for Public Policy, Kids Count in Michigan 2013 overview, http://www.mlpp.org/kids-count/michigan-2/mi-data-book-2013 11 USDA measure for 2013 http://www.fns.usda.gov/pd/supplemental-nutrition-assistance-program-snap 12 From 2012 population estimates (US Census Bureau) formula via Ohio Dept of Ag Animal Emergency Response Plan, 2006. Includes dogs, cats, birds, rabbits, rodents, and turtles. 13 Michigan Agritourism Association http://www.michiganfarmfun.com/index.php?option=com_mtree&Itemid=3

Michigan Food and Agricultural Systems Profiles
VAN BUREN
Area1 607.47 square miles Population2 76,157 Largest City Paw Paw, South Haven Watershed(s) St. Joseph, Black, Kalamazoo
Top Commodities by Volume of Sales3
•Nursery, greenhouse, floriculture, and sod •Grains, oilseeds, dry beans, and dry peas •Vegetables, melons, potatoes, and sweet potatoes •Poultry and eggs •Aquaculture •Horses, ponies, mules, burros, and donkeys
•Other crops and hay •Other animals and other animal products •Sheep, goats, and their products •Hogs and pigs •Milk and other dairy products from cows
Top Commodities by Acreage
•Corn •Soybeans •Hogs
Agricultural Revenues4 Amount MI top 20 ranking
Total market value of agriculture production $194,665,000 15 Total crop sales $161,414,000 12 Total livestock sales $33,251,000
Key Michigan Products
Corn, soy, and wheat 76,760 acres ( 51.42% of cropland) Revenue from corn, soy, and wheat $58,293,000
Vegetables 7,280 acres ( 4.88% of cropland) 13 Revenue from vegetables $28,891,050 5
Fruit and tree nuts 307 operations 1 Revenue from fruits, tree nuts, and berries $60,033,000 1
Dairy farms 14 farms Revenue from milk and other dairy $18,673,000
All animal operations 272 operations
Agricultural Land
Total number of farms 1,113 16 Total farmland5 175,121 acres
Forage/pasture/non-crop farmland6 25,833 acres 11 Number of farms using certified organic production 3 Number of farms transitioning to organic production 159 Area of greenhouse/nursery operations (sq. ft) N/A

Michigan Food and Agricultural Systems Profiles
Agricultural Chemicals7 Number Percent of MI Total
Fertilizer manufacturers, distributors, and storage facilities 2 1.05% Pesticide storage facilities 3 2.03%
Processing and Warehousing
Wholesale food processing plants 36 1.8 % Food warehouses 13 1.16% Controlled atmosphere storage facilities 3 4.55% Dairy processing plants 2 2.53% Dairy warehouse, transfer, and truck cleaning facilities 0 0.0 % Slaughter facilities (MDARD licensed) 0 0.0 % Meat processing plants (MDARD licensed) 23 0.91% Rendering facilities 0 Commercial feed manufacturing facilities 0 Ethanol plants
Retailing and distribution8
Food service establishments (all) 248 0.79% Retail food establishments 138 0.96% Total amount spent by consumers on food (estimate)8 $181,420,554 0.74% Emergency food distribution sites9 23 1. %
Pounds distributed 271,279 0.35% Students eligible for free or reduced school lunch10 8,551 1.17% Households receiving FAP (SNAP) benefits11 17,288 0.9 %
Total federal funding for SNAP $27,335,495 0.9 % Pet population (estimate) 12 41,521 Port(s) of entry none
Local Distribution13
Farmers’ markets 6 U-pick farms/On-farm markets 15 Farms using community Supported Agriculture 11 1 United States Census Bureau State & County Quick Facts: Michigan, http://quickfacts.census.gov/qfd/states/26000.html 2 Michigan Economic Development Corporation Regional Economic Profiles http://www.michiganbusiness.org/cm/Files/Reports/Regional_Economy/Michigan-Economy-Overview.pdf 3 Michigan Farm Bureau, Treasures of Michigan Agriculture, https://www.michfb.com/MI/Treasures/ 4 USDA 2012 AgCensus Statewide profile http://www.agcensus.usda.gov/Publications/2012/Online_Resources/County_Profiles/Michigan/cp99026.pdf 5 Totals from 2012 USDA AgCensus available from National Agricultural Statistics Service http://quickstats.nass.usda.gov/ 6 Includes non-crop farmland, pasture, and woodland pasture acreage 7 Michigan Department of Agriculture and Rural Development, Annual Reports, http://www.michigan.gov/mdard/0,4610,7-125-2968_4811---,00.html 8 Calculated from US Census estimated households in state with Bureau of Labor Statistics estimate of $6,393/household expenditure for food. 9 Food Bank Council of Michigan, http://www.fbcmich.org/site/DocServer/Michigan_Blueprint_to_End_Hunger_2008_web.pdf?docID=1921 estimates rounded to nearest integer 10 Michigan League for Public Policy, Kids Count in Michigan 2013 overview, http://www.mlpp.org/kids-count/michigan-2/mi-data-book-2013 11 USDA measure for 2013 http://www.fns.usda.gov/pd/supplemental-nutrition-assistance-program-snap 12 From 2012 population estimates (US Census Bureau) formula via Ohio Dept of Ag Animal Emergency Response Plan, 2006. Includes dogs, cats, birds, rabbits, rodents, and turtles. 13 Michigan Agritourism Association http://www.michiganfarmfun.com/index.php?option=com_mtree&Itemid=3
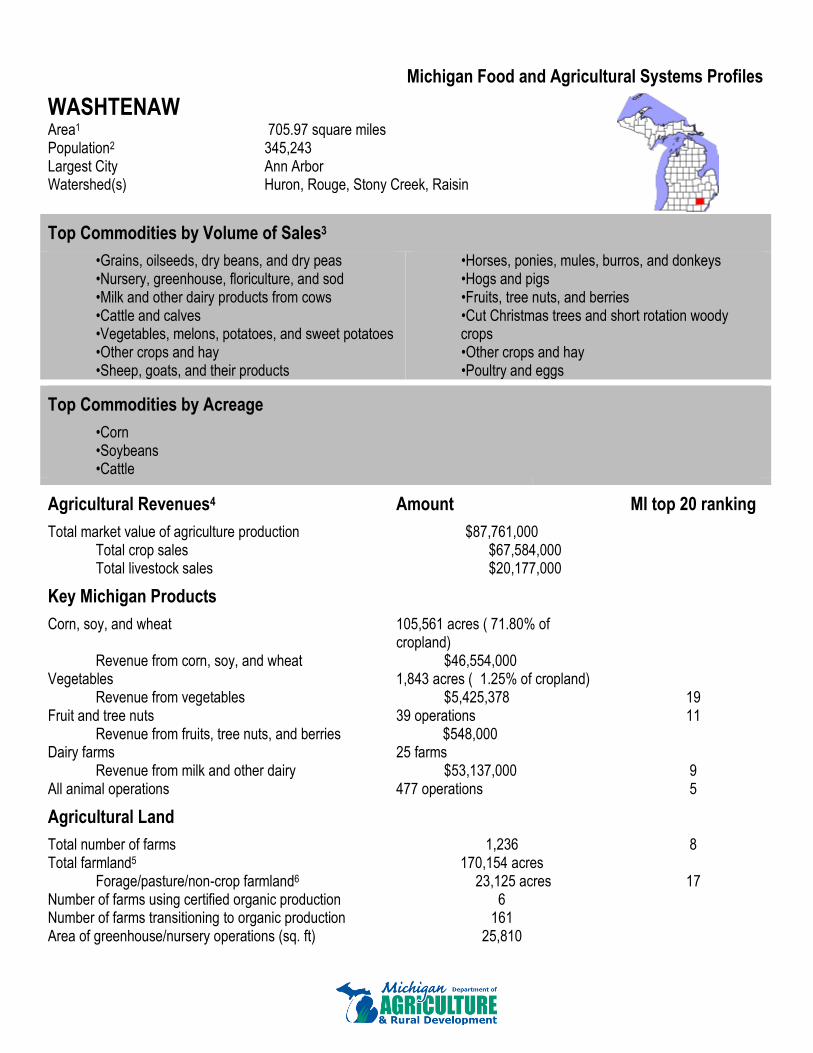
Michigan Food and Agricultural Systems Profiles
WASHTENAW
Area1 705.97 square miles Population2 345,243 Largest City Ann Arbor Watershed(s) Huron, Rouge, Stony Creek, Raisin
Top Commodities by Volume of Sales3
•Grains, oilseeds, dry beans, and dry peas •Nursery, greenhouse, floriculture, and sod •Milk and other dairy products from cows •Cattle and calves •Vegetables, melons, potatoes, and sweet potatoes •Other crops and hay •Sheep, goats, and their products
•Horses, ponies, mules, burros, and donkeys •Hogs and pigs •Fruits, tree nuts, and berries •Cut Christmas trees and short rotation woody crops •Other crops and hay •Poultry and eggs
Top Commodities by Acreage
•Corn •Soybeans •Cattle
Agricultural Revenues4 Amount MI top 20 ranking
Total market value of agriculture production $87,761,000 Total crop sales $67,584,000 Total livestock sales $20,177,000
Key Michigan Products
Corn, soy, and wheat 105,561 acres ( 71.80% of cropland)
Revenue from corn, soy, and wheat $46,554,000 Vegetables 1,843 acres ( 1.25% of cropland)
Revenue from vegetables $5,425,378 19 Fruit and tree nuts 39 operations 11
Revenue from fruits, tree nuts, and berries $548,000 Dairy farms 25 farms
Revenue from milk and other dairy $53,137,000 9 All animal operations 477 operations 5
Agricultural Land
Total number of farms 1,236 8 Total farmland5 170,154 acres
Forage/pasture/non-crop farmland6 23,125 acres 17 Number of farms using certified organic production 6 Number of farms transitioning to organic production 161 Area of greenhouse/nursery operations (sq. ft) 25,810

Michigan Food and Agricultural Systems Profiles
Agricultural Chemicals7 Number Percent of MI Total
Fertilizer manufacturers, distributors, and storage facilities 3 1.57% Pesticide storage facilities 3 2.03%
Processing and Warehousing
Wholesale food processing plants 60 3.01% Food warehouses 24 2.15% Controlled atmosphere storage facilities 0 0.0 % Dairy processing plants 4 5.06% Dairy warehouse, transfer, and truck cleaning facilities 0 0.0 % Slaughter facilities (MDARD licensed) 0 0.0 % Meat processing plants (MDARD licensed) 46 1.81% Rendering facilities 1 Commercial feed manufacturing facilities 0 Ethanol plants
Retailing and distribution8
Food service establishments (all) 1191 3.78% Retail food establishments 386 2.7 % Total amount spent by consumers on food (estimate)8 $862,307,019 3.53% Emergency food distribution sites9 119 5.12%
Pounds distributed 4,828,303 6.24% Students eligible for free or reduced school lunch10 14,516 1.98% Households receiving FAP (SNAP) benefits11 40,690 2.13%
Total federal funding for SNAP $64,338,344 2.13% Pet population (estimate) 12 188,226 Port(s) of entry none
Local Distribution13
Farmers’ markets 18 U-pick farms/On-farm markets 11 Farms using community Supported Agriculture 21 1 United States Census Bureau State & County Quick Facts: Michigan, http://quickfacts.census.gov/qfd/states/26000.html 2 Michigan Economic Development Corporation Regional Economic Profiles http://www.michiganbusiness.org/cm/Files/Reports/Regional_Economy/Michigan-Economy-Overview.pdf 3 Michigan Farm Bureau, Treasures of Michigan Agriculture, https://www.michfb.com/MI/Treasures/ 4 USDA 2012 AgCensus Statewide profile http://www.agcensus.usda.gov/Publications/2012/Online_Resources/County_Profiles/Michigan/cp99026.pdf 5 Totals from 2012 USDA AgCensus available from National Agricultural Statistics Service http://quickstats.nass.usda.gov/ 6 Includes non-crop farmland, pasture, and woodland pasture acreage 7 Michigan Department of Agriculture and Rural Development, Annual Reports, http://www.michigan.gov/mdard/0,4610,7-125-2968_4811---,00.html 8 Calculated from US Census estimated households in state with Bureau of Labor Statistics estimate of $6,393/household expenditure for food. 9 Food Bank Council of Michigan, http://www.fbcmich.org/site/DocServer/Michigan_Blueprint_to_End_Hunger_2008_web.pdf?docID=1921 estimates rounded to nearest integer 10 Michigan League for Public Policy, Kids Count in Michigan 2013 overview, http://www.mlpp.org/kids-count/michigan-2/mi-data-book-2013 11 USDA measure for 2013 http://www.fns.usda.gov/pd/supplemental-nutrition-assistance-program-snap 12 From 2012 population estimates (US Census Bureau) formula via Ohio Dept of Ag Animal Emergency Response Plan, 2006. Includes dogs, cats, birds, rabbits, rodents, and turtles. 13 Michigan Agritourism Association http://www.michiganfarmfun.com/index.php?option=com_mtree&Itemid=3
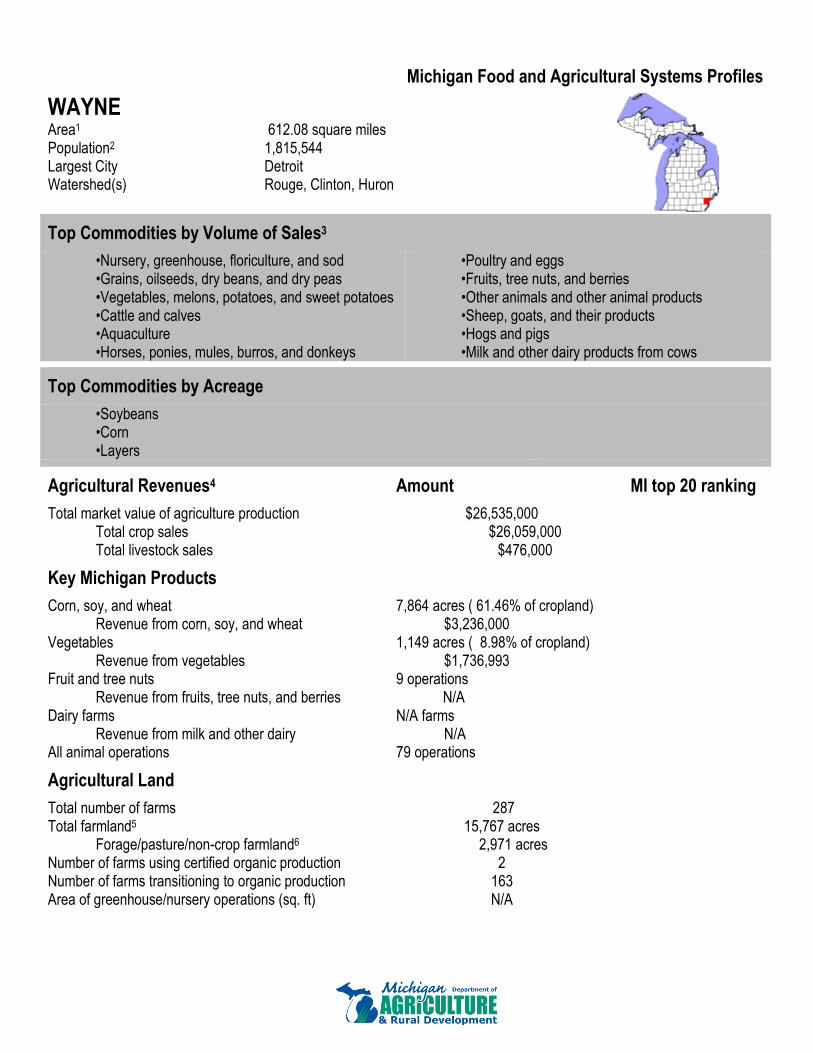
Michigan Food and Agricultural Systems Profiles
WAYNE
Area1 612.08 square miles Population2 1,815,544 Largest City Detroit Watershed(s) Rouge, Clinton, Huron
Top Commodities by Volume of Sales3
•Nursery, greenhouse, floriculture, and sod •Grains, oilseeds, dry beans, and dry peas •Vegetables, melons, potatoes, and sweet potatoes •Cattle and calves •Aquaculture •Horses, ponies, mules, burros, and donkeys
•Poultry and eggs •Fruits, tree nuts, and berries •Other animals and other animal products •Sheep, goats, and their products •Hogs and pigs •Milk and other dairy products from cows
Top Commodities by Acreage
•Soybeans •Corn •Layers
Agricultural Revenues4 Amount MI top 20 ranking
Total market value of agriculture production $26,535,000 Total crop sales $26,059,000 Total livestock sales $476,000
Key Michigan Products
Corn, soy, and wheat 7,864 acres ( 61.46% of cropland) Revenue from corn, soy, and wheat $3,236,000
Vegetables 1,149 acres ( 8.98% of cropland) Revenue from vegetables $1,736,993
Fruit and tree nuts 9 operations Revenue from fruits, tree nuts, and berries N/A
Dairy farms N/A farms Revenue from milk and other dairy N/A
All animal operations 79 operations
Agricultural Land
Total number of farms 287 Total farmland5 15,767 acres
Forage/pasture/non-crop farmland6 2,971 acres Number of farms using certified organic production 2 Number of farms transitioning to organic production 163 Area of greenhouse/nursery operations (sq. ft) N/A

Michigan Food and Agricultural Systems Profiles
Agricultural Chemicals7 Number Percent of MI Total
Fertilizer manufacturers, distributors, and storage facilities 2 1.05% Pesticide storage facilities 3 2.03%
Processing and Warehousing
Wholesale food processing plants 211 10.57% Food warehouses 194 17.38% Controlled atmosphere storage facilities 0 0.0 % Dairy processing plants 10 12.66% Dairy warehouse, transfer, and truck cleaning facilities 0 0.0 % Slaughter facilities (MDARD licensed) 10 20.41% Meat processing plants (MDARD licensed) 368 14.51% Rendering facilities 8 Commercial feed manufacturing facilities 0 Ethanol plants
Retailing and distribution8
Food service establishments (all) 5230 16.61% Retail food establishments 2822 19.72% Total amount spent by consumers on food (estimate)8 $4,310,563,359 17.66% Emergency food distribution sites9 249 10.71%
Pounds distributed 18,772,885 24.28% Students eligible for free or reduced school lunch10 169,626 23.14% Households receiving FAP (SNAP) benefits11 535,011 27.95%
Total federal funding for SNAP $845,950,403 27.95% Pet population (estimate) 12 989,830 Port(s) of entry Ambassador Bridge, Detroit Metro Airport, Willow Run Airport, Port of Detroit
Local Distribution13
Farmers’ markets 32 U-pick farms/On-farm markets 5 Farms using community Supported Agriculture 11 1 United States Census Bureau State & County Quick Facts: Michigan, http://quickfacts.census.gov/qfd/states/26000.html 2 Michigan Economic Development Corporation Regional Economic Profiles http://www.michiganbusiness.org/cm/Files/Reports/Regional_Economy/Michigan-Economy-Overview.pdf 3 Michigan Farm Bureau, Treasures of Michigan Agriculture, https://www.michfb.com/MI/Treasures/ 4 USDA 2012 AgCensus Statewide profile http://www.agcensus.usda.gov/Publications/2012/Online_Resources/County_Profiles/Michigan/cp99026.pdf 5 Totals from 2012 USDA AgCensus available from National Agricultural Statistics Service http://quickstats.nass.usda.gov/ 6 Includes non-crop farmland, pasture, and woodland pasture acreage 7 Michigan Department of Agriculture and Rural Development, Annual Reports, http://www.michigan.gov/mdard/0,4610,7-125-2968_4811---,00.html 8 Calculated from US Census estimated households in state with Bureau of Labor Statistics estimate of $6,393/household expenditure for food. 9 Food Bank Council of Michigan, http://www.fbcmich.org/site/DocServer/Michigan_Blueprint_to_End_Hunger_2008_web.pdf?docID=1921 estimates rounded to nearest integer 10 Michigan League for Public Policy, Kids Count in Michigan 2013 overview, http://www.mlpp.org/kids-count/michigan-2/mi-data-book-2013 11 USDA measure for 2013 http://www.fns.usda.gov/pd/supplemental-nutrition-assistance-program-snap 12 From 2012 population estimates (US Census Bureau) formula via Ohio Dept of Ag Animal Emergency Response Plan, 2006. Includes dogs, cats, birds, rabbits, rodents, and turtles. 13 Michigan Agritourism Association http://www.michiganfarmfun.com/index.php?option=com_mtree&Itemid=3

Michigan Food and Agricultural Systems Profiles
WEXFORD
Area1 565.00 square miles Population2 32,761 Largest City Cadillac Watershed(s) Manistee, Muskegon
Top Commodities by Volume of Sales3
•Cattle and calves •Milk and other dairy products from cows •Cut Christmas trees and short rotation woody crops
•Other crops and hay •Grains, oilseeds, dry beans, and dry peas •Other animals and other animal products
•Nursery, greenhouse, floriculture, and sod •Fruits, tree nuts, and berries •Hogs and pigs •Vegetables, melons, potatoes, and sweet potatoes •Horses, ponies, mules, burros, and donkeys •Sheep, goats, and their products
Top Commodities by Acreage
•Forage •Christmas Trees •Phesants
Agricultural Revenues4 Amount MI top 20 ranking
Total market value of agriculture production $9,676,000 Total crop sales $4,829,000 Total livestock sales $4,847,000
Key Michigan Products
Corn, soy, and wheat 5,312 acres ( 16.54% of cropland) Revenue from corn, soy, and wheat $2,027,000
Vegetables 88 acres ( .27% of cropland) Revenue from vegetables $259,000
Fruit and tree nuts 14 operations Revenue from fruits, tree nuts, and berries $49,000
Dairy farms 17 farms Revenue from milk and other dairy $13,318,000
All animal operations 147 operations
Agricultural Land
Total number of farms 357 Total farmland5 40,333 acres
Forage/pasture/non-crop farmland6 8,213 acres Number of farms using certified organic production 0 Number of farms transitioning to organic production 0 Area of greenhouse/nursery operations (sq. ft) n/a

Michigan Food and Agricultural Systems Profiles
Agricultural Chemicals7 Number Percent of MI Total
Fertilizer manufacturers, distributors, and storage facilities 0 0.0 % Pesticide storage facilities 0 0.0 %
Processing and Warehousing
Wholesale food processing plants 19 0.95% Food warehouses 9 0.81% Controlled atmosphere storage facilities 0 0.0 % Dairy processing plants 0 0.0 % Dairy warehouse, transfer, and truck cleaning facilities 0 0.0 % Slaughter facilities (MDARD licensed) 2 4.08% Meat processing plants (MDARD licensed) 26 1.03% Rendering facilities 0 Commercial feed manufacturing facilities 0 Ethanol plants
Retailing and distribution8
Food service establishments (all) 123 0.39% Retail food establishments 60 0.42% Total amount spent by consumers on food (estimate)8 $78,665,865 0.32% Emergency food distribution sites9 19 0.83%
Pounds distributed 276,583 0.36% Students eligible for free or reduced school lunch10 2,900 0.4 % Households receiving FAP (SNAP) benefits11 8,192 0.43%
Total federal funding for SNAP $12,953,053 0.43% Pet population (estimate) 12 17,861 Port(s) of entry none
Local Distribution13
Farmers’ markets 1 U-pick farms/On-farm markets 1 Farms using community Supported Agriculture 1 1 United States Census Bureau State & County Quick Facts: Michigan, http://quickfacts.census.gov/qfd/states/26000.html 2 Michigan Economic Development Corporation Regional Economic Profiles http://www.michiganbusiness.org/cm/Files/Reports/Regional_Economy/Michigan-Economy-Overview.pdf 3 Michigan Farm Bureau, Treasures of Michigan Agriculture, https://www.michfb.com/MI/Treasures/ 4 USDA 2012 AgCensus Statewide profile http://www.agcensus.usda.gov/Publications/2012/Online_Resources/County_Profiles/Michigan/cp99026.pdf 5 Totals from 2012 USDA AgCensus available from National Agricultural Statistics Service http://quickstats.nass.usda.gov/ 6 Includes non-crop farmland, pasture, and woodland pasture acreage 7 Michigan Department of Agriculture and Rural Development, Annual Reports, http://www.michigan.gov/mdard/0,4610,7-125-2968_4811---,00.html 8 Calculated from US Census estimated households in state with Bureau of Labor Statistics estimate of $6,393/household expenditure for food. 9 Food Bank Council of Michigan, http://www.fbcmich.org/site/DocServer/Michigan_Blueprint_to_End_Hunger_2008_web.pdf?docID=1921 estimates rounded to nearest integer 10 Michigan League for Public Policy, Kids Count in Michigan 2013 overview, http://www.mlpp.org/kids-count/michigan-2/mi-data-book-2013 11 USDA measure for 2013 http://www.fns.usda.gov/pd/supplemental-nutrition-assistance-program-snap 12 From 2012 population estimates (US Census Bureau) formula via Ohio Dept of Ag Animal Emergency Response Plan, 2006. Includes dogs, cats, birds, rabbits, rodents, and turtles. 13 Michigan Agritourism Association http://www.michiganfarmfun.com/index.php?option=com_mtree&Itemid=3