michael newton, uw madison - pages.stat.wisc.edupages.stat.wisc.edu/~newton/talks/bbb7.pdf ·...
TRANSCRIPT

Advances in model-based gene-set analysis
Michael Newton, UW Madison
BBB-7, February 13, 2014
Copyright M.A. NewtonThursday, February 13, 14

first a short story about tumor polyclonality
Thursday, February 13, 14

The Biology of Cancer, Garland Science2007
normal tissue
tumor tissue
Thursday, February 13, 14

The Biology of Cancer, Garland Science2007Thursday, February 13, 14

Improved lineage marking systems reveal polyclonality of intestinal tumors
Rich Halberg
Thursday, February 13, 14

Transformation of epithelial cells through recruitmentleads to polyclonal intestinal tumorsAndrew T. Thliverisa,1, Brittany Schwefelb,1, Linda Clipsonc, Lauren Pleshd, Christopher D. Zahmc, Alyssa A. Leystrac,Mary Kay Washingtone, Ruth Sullivanf,g, Dustin A. Demingh, Michael A. Newtonb,g,i, and Richard B. Halbergd,g,2
aDepartment of Ophthalmology and Visual Sciences, bDepartment of Statistics, cDepartment of Oncology, dDivision of Gastroenterology and Hepatology,Department of Medicine, fResearch Animal Resource Center, hDivision of Hematology and Oncology, Department of Medicine, iDepartment of Biostatisticsand Medical Informatics, gUW Carbone Cancer Center, University of Wisconsin, Madison, WI 53704; and eDepartment of Pathology and Vanderbilt-IngramCancer Center, Vanderbilt University School of Medicine, Nashville, TN 37232
Edited by Paul Polakis, Genentech, Inc., South San Francisco, CA, and accepted by the Editorial Board May 20, 2013 (received for review March 8, 2013)
Intestinal tumors from mice and humans can have a polyclonalorigin. Statistical analyses indicate that the best explanation forthis source of intratumoral heterogeneity is the presence ofinteractions among multiple progenitors. We sought to betterunderstand the nature of these interactions. An initial progenitorcould recruit others by facilitating the transformation of one ormore neighboring cells. Alternatively, two progenitors that areindependently initiated could simply cooperate to form a singletumor. These possibilities were tested by analyzing tumors fromaggregation chimeras that were generated by fusing togetherembryos with unequal predispositions to tumor development.Strikingly, numerous polyclonal tumors were observed even whenone genetic component was highly, if not completely, resistant tospontaneous tumorigenesis in the intestine. Moreover, the ob-served number of polyclonal tumors could be explained by thefacilitated transformation of a single neighbor within 144 μm of aninitial progenitor. These findings strongly support recruitment in-stead of cooperation. Thus, it is conceivable that these interactionsare necessary for tumors to thrive, so blocking them might bea highly effective method for preventing the formation of tumorsin the intestine and other tissues.
colon cancer | spatial statistics | clonal interactions | mouse model
Tumors are often heterogeneous with respect to several dis-tinguishable properties, including differentiation state, pro-
liferation rate, metastatic potential, and therapeutic response.Two models to explain intratumoral heterogeneity have beenproposed. The clonal evolution model asserts that differentsubclones arise from a single progenitor as a consequence ofmolecular changes followed by selection for dissimilar micro-environments within a tumor (1). By contrast, the cancer stemcell model contends that a small population of stem cells origi-nating from a single progenitor is responsible for tumor main-tenance but the progeny can differentiate in several diverse ways(1). A key assumption in both models is that tumors are derivedfrom a single progenitor.Evidence is steadily accruing that intestinal tumors are often
polyclonal rather than monoclonal (2). Merritt et al. (3) dem-onstrated that hereditary tumors in the mouse intestine are oftenderived from multiple progenitors. In this study, aggregationchimeras were generated by fusing embryos carrying the Minallele of the Adenomatous polyposis coli gene (ApcMin/+) toembryos carrying Min and the Rosa26 lineage marker (ApcMin/+
R26+). Clonal structure was assessed in histologic sections oftumors stained for the lineage marker. A significant number(8%) of early adenomas were heterotypic, being composed ofcells from the two different embryos. Using a similar approach,Thliveris et al. (4) demonstrated that carcinogen-induced tumorsin mice are also derived from multiple progenitors. In bothstudies, the intestines consisted of small blue and white patches.This chimeric pattern increases the power to detect polyclonalitybecause a heterotypic tumor forming on a border between thetwo colors is clearly polyclonal, whereas a homotypic tumorcould be polyclonal as the result of being derived from two
progenitors with the same R26 status or else monoclonal. Thefindings from the Merritt and Thliveris studies are consistentwith those of other investigators demonstrating that hereditaryand sporadic colorectal tumors in humans are often polyclonal(5, 6). Therefore, multiple progenitors contributing to a singletumor are an additional source of intratumoral heterogeneity.Although evidence supports the existence of polyclonality, this
phenomenon could have been merely a consequence of randomcollision between independently derived tumors instead of nec-essary clonal interactions. In the Merritt study, the aggregationchimeras developed far too many tumors to rule out randomcollision. To distinguish between the possible explanations forpolyclonality, Thliveris et al. (7) generated aggregation chimerasthat developed relatively few intestinal tumors. They found thatthe percentage of heterotypic tumors was still high (20%), eventhough the multiplicity of tumors was very low. This observationwhen combined with statistical analyses ruled out random colli-sion and favored clonal interactions. In the Thliveris study (7),tumor phenotypes were linked with image data describing thepattern of chimerism to estimate the range of clonal interactions.They found that interactions occurring between progenitors inneighboring crypts (i.e., 40–120 μm apart) were sufficient to ac-count for the percentage of heterotypic tumors that was observed.Thus, polyclonality could be explained by multiple progenitorsinteracting over a very short distance.The details of clonal interactions during the initial stages of
tumorigenesis remain unknown. One possibility is some formof recruitment in which a single progenitor, following the loss ofApc activity, subsequently facilitates the neoplastic transformationof one or more neighboring cells. Alternatively, multiple inde-pendently derived progenitors arising in close proximity mighteffectively cooperate and gain a selective growth advantage overan isolated progenitor. Although prior studies of tumor clonalitywere unable to distinguish between recruitment and coopera-tion, the two models predict different frequencies of heterotypictumors in aggregation chimeras formed from embryos that haveunequal susceptibilities to tumorigenesis. On the basis of thisrealization, we characterized clonal interactions by generatingand analyzing two types of aggregation chimeras: C57BL/6 (B6)ApcMin/+ ! Apc1638N/+ R26+ and B6 ApcMin/+ ! Apc+/+ R26+,because B6 ApcMin/+ mice spontaneously develop many more in-testinal tumors than either B6Apc1638N/+mice or B6Apc+/+mice (8).
Author contributions: A.T.T. and R.B.H. designed research; A.T.T., L.C., L.P., C.D.Z., A.A.L.,D.A.D., and R.B.H. performed research; B.S. and M.A.N. contributed new reagents/analytictools; A.T.T., B.S., L.C., L.P., C.D.Z., A.A.L., M.K.W., R.S., D.A.D., M.A.N., and R.B.H. analyzeddata; and A.T.T., B.S., M.A.N., and R.B.H. wrote the paper.
The authors declare no conflict of interest.
This article is a PNAS Direct Submission. P.P. is a guest editor invited by the EditorialBoard.1A.T.T. and B.S. contributed equally to this work.2To whom correspondence should be addressed. E-mail: [email protected].
This article contains supporting information online at www.pnas.org/lookup/suppl/doi:10.1073/pnas.1303064110/-/DCSupplemental.
www.pnas.org/cgi/doi/10.1073/pnas.1303064110 PNAS | July 9, 2013 | vol. 110 | no. 28 | 11523–11528
MED
ICALSC
IENCE
S
Improved lineage marking systems reveal polyclonality of intestinal tumors
Rich Halberg
Thursday, February 13, 14

ways. One key difference is the way in which aggregation chi-meras were constructed. In our study, the Apc+/+ embryo alwayscarried the R26 lineage marker because it is easier to detect bluecells in a predominanlty white mass than it is to detect white cellsin a predominantly blue mass. In the previous studies, the em-bryo carrying the lineage marker varied from chimera to chi-mera. Another key difference is how the intestines and tumorswere analyzed. In our study the entire intestinal tract was re-moved, stained, and scored, and then all of the tumors wereisolated, embedded in paraffin, and sectioned through andthrough for pathological assessment. In the previous studies only
a third of the intestinal tract was removed, and then tumors weresampled from areas in which blue tissue and white tissue werejuxtaposed. Finally, in our study, sections from each tumorwere examined by two pathologists. Our findings with two sets ofaggregation chimeras indicate that an initial progenitor is able torecruit a nearby wild-type partner.How does an initial progenitor recruit neighboring cells? A
number of different mechanisms are possible. The loss of Apcactivity in the initial progenitor could trigger the loss of Apcactivity in neighboring cells. An ApcMin/+ cell could lose the wild-type copy of Apc by point mutation or somatic recombination(10) and be transformed into its neoplastic counterpart. Thisinitial progenitor and its immediate descendants might expressmitogenic factors that increase the rate of cellular proliferationin neighboring cells. Rapid proliferation might result in sponta-neous mutations in Apc and consequent loss of activity andneoplastic transformation. Kuraguchi et al. (11) found that in-testinal tumors from Apc1638N/+ mice lacking DNA mismatchactivity often carried two distinct somatic mutations in Apc. Inaddition, Thirlwell et al. (6) found that tumors from patientsafflicted with familial adenomatous polyposis often carried twodistinct somatic mutations. Thus, recruitment could be mediatedthrough additional genetic events, particularly in the context ofhereditary cancers. However, if recruitment involved only Apcmutations, the number of polyclonal tumors should be higher inApcMin/+ ! Apc1638N/+ R26+ aggregation chimeras, in which onlytwo hits are required for the development of polyclonal tumors,than in ApcMin/+ ! Apc+/+ R26+ aggregation chimeras, in whichthree are required. However, the number of polyclonal tumorswas comparable in ApcMin/+ ! Apc1638N/+ R26+ and ApcMin/+ !Apc+/+ R26+ aggregation chimeras even though in the first setboth embryos carry a germ-line Apc mutation and in the secondset only one embryo carries a germ-line Apc mutation. Analyzingthe status of Apc in polyclonal tumors in this study is extremelychallenging given the amount of tissue that is available and thecondition of the tissue after X-gal staining, which is harsh, in-volving two fixation steps and an overnight incubation at 37 °C.Another possible mechanism for recruitment is paracrine on-
cogenic signaling. The initial ApcMin/+ progenitor after the loss ofApc activity and its immediate progeny could produce signalingfactors that facilitate transformation of neighboring cells that areresponsive to the signal. For example, secreted Wnt moleculescould lead to the translocation of β-catenin to the nucleus inneighboring cells that are expressing Frizzled receptors. β-Cat-enin is clearly localized to the nucleus in neoplastic cells that arederived from the ApcMin/+, Apc1638N/+, and even the Apc+/+ lin-eages (Fig. 4). Thus, recruitment might involve signaling insteadof additional genetic events in certain biological contexts.Thirlwell et al. (6) have demonstrated that some sporadic coloncancers were polyclonal, consisting of dysplastic crypts that carrymutations in Apc and those that do not.Several lines of investigation support the notion that re-
cruitment could be mediated by Wnt molecules. Neoplastic cellsin which β-catenin is localized to the nucleus protrude out fromthe normal crypt structure (12). This change in position wouldplace an initial progenitor and its immediate progeny in closeproximity to neighboring cells such that secreted factors couldelicit changes in signaling. Once β-catenin has translocated to thenucleus, it stimulates the expression of numerous genes, in-cluding Wnt3A (13). Several Wnt signaling molecules are trans-forming factors in vitro and in vivo (14–16). Epithelial cellsexpressing Wnt1 can transform other epithelial cells. Mammarytumors that are induced by a virus in GR mice are usuallypolyclonal with two or more mutually interdependent cell pop-ulations, but only one population expresses activated Wnt1 (15).Similarly, stromal cells expressing Wnt1 can transform epithelialcells. Fibroblasts expressing Wnt1 elicit a morphological trans-formation of neighboring mammary epithelial cells in cocultureexperiments when the neighboring cells are responsive to thesignal (16). Recently, other investigators have suggested thatWnt signaling is a marker of colon cancer stem cells (CSC) and
Fig. 2. Tumors from ApcMin/+ ! Apc1638N/+ R26+ aggregation chimeras canhave a polyclonal origin. The mice were generated and killed when mori-bund. The intestinal tract was removed and stained with X-Gal. ApcMin/+ cellsare white, and Apc1638N/+ cells carrying R26+ are blue. (A and B) The intestinewas photographed (A) and digitized (B) for statistical analysis. (C) Tumors(wholemount) were then excised, embedded in paraffin, and sectioned. (D)Sections were stained with hematoxylin and eosin to determine whethera tumor was composed of white, blue, or a mixture of white and blueneoplastic cells. (Scale bar, 200 μm.)
Fig. 3. Tumors from ApcMin/+ ! Apc+/+ R26+ aggregation chimeras can havea polyclonal origin. (A and B) The intestines from these chimeras area patchwork ofApcMin/+ cells (white) andApc+/+ R26+ cells (blue) as evidencedin this representative image, which was photographed (A) and digitized (B).(C andD) Several tumors were heterotypic, being composed of both cell typesas indicated in the wholemount and verified by histology. (Scale bar, 200 μm.)
11526 | www.pnas.org/cgi/doi/10.1073/pnas.1303064110 Thliveris et al.Thursday, February 13, 14

Statistics involved in evaluating the mechanism:
• random collision?• co-operation?• recruitment?
Thursday, February 13, 14

gene set analysis
be careful about the prior!
Thursday, February 13, 14

Zhishi Wang
Qiuling He Bret Larget
Thursday, February 13, 14

How do we concisely summarize the functional content of a gene list?
I.E. how do we integrate two data sources?
Endogenous:
Exogenous:
gene list
functional categories (e.g., Gene Ontology, Reactome)
selected from genome in gene-level analysis
Thursday, February 13, 14

yes
no
yes no
in functional category?
on gene list?
Most common approach: one category at a time
Thursday, February 13, 14

yes
no
yes no
in functional category?
on gene list?
Most common approach: one category at a time
Thursday, February 13, 14

Example Type 2 Diabetes (T2D) GWAS
Morris et al. 2012, Nat Gen
Thursday, February 13, 14

6
Table S3: T2D: Like Tables 3 and S1, but selected for small adjusted Fisher p-value; coverage 22GOID Term (up to 40 characters) Statistics P.MFA P.MGSA FisherQ
GO:0002793 positive regulation of peptide secretion 5/50 0 0.279 0.003GO:0090277 positive regulation of peptide hormone s 5/49 0 0.337 0.003GO:0046888 negative regulation of hormone secretion 4/43 0 0.149 0.018GO:0033613 activating transcription factor binding 4/43 0.066 0.305 0.018GO:0032024 positive regulation of insulin secretion 4/41 0.964 0.372 0.016GO:0046323 glucose import 5/41 0 0.143 0.001GO:0050994 regulation of lipid catabolic process 4/40 0 0.173 0.015GO:0045913 positive regulation of carbohydrate meta 6/38 0 0.028 0GO:0005978 glycogen biosynthetic process 5/37 0 0.016 0.001GO:0009250 glucan biosynthetic process 5/37 0 0.02 0.001GO:0046324 regulation of glucose import 4/37 0 0.017 0.012GO:0010676 positive regulation of cellular carbohyd 6/35 0 0.027 0GO:0032881 regulation of polysaccharide metabolic p 5/32 0 0.025 0GO:0032885 regulation of polysaccharide biosyntheti 5/30 0 0.02 0GO:0010907 positive regulation of glucose metabolic 6/28 0 0.02 0GO:0070873 regulation of glycogen metabolic process 5/28 0 0.022 0GO:0010828 positive regulation of glucose transport 4/27 0.002 0.019 0.004GO:0045923 positive regulation of fatty acid metabo 4/27 0 0.013 0.004GO:0002792 negative regulation of peptide secretion 4/26 0 0.171 0.003GO:0005979 regulation of glycogen biosynthetic proc 5/26 0 0.022 0GO:0010962 regulation of glucan biosynthetic proces 5/26 0 0.022 0GO:0046326 positive regulation of glucose import 4/25 0.038 0.025 0.003GO:0090278 negative regulation of peptide hormone s 4/25 0.004 0.208 0.003GO:0046676 negative regulation of insulin secretion 4/23 0.996 0.201 0.003GO:0006110 regulation of glycolysis 3/20 0 0.002 0.031GO:0006111 regulation of gluconeogenesis 3/17 0 0.004 0.019GO:0035987 endodermal cell di↵erentiation 3/17 0 0.207 0.019GO:0070875 positive regulation of glycogen metaboli 5/15 0 0.025 0GO:0005159 insulin-like growth factor receptor bind 3/14 0.01 0.003 0.013GO:0045725 positive regulation of glycogen biosynth 5/13 0.095 0.026 0GO:0046321 positive regulation of fatty acid oxidat 3/11 0.001 0.014 0.006GO:0031017 exocrine pancreas development 3/8 0.946 0.6 0.003
Table S4: T2D; GO terms with MFA marginal posterior activation probability exceeding 0.5. All ofthese sets are in the MAP estimate (Table S1).
GOID Term (up to 40 characters) Statistics P.MFA P.MGSA FisherQ
GO:0001077 RNA polymerase II core promoter proximal 3/45 0.517 0.028 0.161GO:0032024 positive regulation of insulin secretion 4/41 0.964 0.372 0.016GO:0033138 positive regulation of peptidyl-serine p 2/35 0.537 0.096 0.756GO:0046676 negative regulation of insulin secretion 4/23 0.996 0.201 0.003GO:0035774 positive regulation of insulin secretion 0/9 0.964 0.002 1GO:0001714 endodermal cell fate specification 2/8 0.596 0.036 0.091GO:0031017 exocrine pancreas development 3/8 0.946 0.6 0.003GO:0005638 lamin filament 2/5 0.79 0.4 0.051
T2D GWAS
• 77 T2D genes
• 58 of them have GO[5:50] annotation
• 32 terms with q-value < .05
Thursday, February 13, 14

• connected if share T2D gene
x
0031017
004632100457250005159
0070875
0006111
0035987
0006110
0046676
0046326
0090278
0002
792
0005
979
0010
962
0010
828
0045
923 0010907
0070873
00328850032881
0010676
0005978
0009250
0046324
0045913
0050994
00320240046323
00468880033613
0090
277
0002
793
●
●●●●●●●●●●●●●●●●●
●●●●●●●●●●●●
●●3
35
3
5
3
3
3
44
44
55 4 4 6 5
55
65
5
4
6
4
4
5
44
55
A.
cov = 22mcov = 265
x
y
0031017
0070491
0017
148
0019
915
0010
506
●
●
●●●3
3
23
2
B.
cov = 13mcov = 169
y
0032460
0005638
0001714
0031017
0006983
0035774
0070365
0046676
0033138
0032024
0001077●●●●
●●
●
●
●
●
●
22232
02
4
2
4
3
C.
cov = 26mcov = 156
Thursday, February 13, 14

x
0031017
004632100457250005159
0070875
0006111
0035987
0006110
0046676
0046326
0090278
0002
792
0005
979
0010
962
0010
828
0045
923 0010907
0070873
00328850032881
0010676
0005978
0009250
0046324
0045913
0050994
00320240046323
00468880033613
0090
277
0002
793
●
●●●●●●●●●●●●●●●●●
●●●●●●●●●●●●
●●3
35
3
5
3
3
3
44
44
55 4 4 6 5
55
65
5
4
6
4
4
5
44
55
A.
cov = 22mcov = 265
x
y
0031017
0070491
0017
148
0019
915
0010
506
●
●
●●●3
3
23
2
B.
cov = 13mcov = 169
y
0032460
0005638
0001714
0031017
0006983
0035774
0070365
0046676
0033138
0032024
0001077●●●●
●●
●
●
●
●
●
22232
02
4
2
4
3
C.
cov = 26mcov = 156
• complicated• redundant• imprecise
Thursday, February 13, 14

A Bayesian multivariate approach: model-based gene set analysis (MGSA)
Bauer et al. 2010, 2011
Thursday, February 13, 14

• 5 terms with P[active] > 1/2
x
0031017
004632100457250005159
0070875
0006111
0035987
0006110
0046676
0046326
0090278
0002
792
0005
979
0010
962
0010
828
0045
923 0010907
0070873
00328850032881
0010676
0005978
0009250
0046324
0045913
0050994
00320240046323
00468880033613
0090
277
0002
793
●
●●●●●●●●●●●●●●●●●
●●●●●●●●●●●●
●●3
35
3
5
3
3
3
44
44
55 4 4 6 5
55
65
5
4
6
4
4
5
44
55
A.
cov = 22mcov = 265
x
y
0031017
007049100
1714
8
0019
915
0010
506
●
●
●●●3
3
23
2
B.
cov = 13mcov = 169
y
0032460
0005638
0001714
0031017
0006983
0035774
0070365
0046676
0033138
0032024
0001077●●●●
●●
●
●
●
●
●
22232
02
4
2
4
3
C.
cov = 26mcov = 156
• simpler• less
redundant• less
sensitive
Thursday, February 13, 14

A Bayesian multivariate approach: multi-functional analyzer (MFA)
Wang et al. 2013
arXiv: 1310.6322
Thursday, February 13, 14

• 11 inferred active terms (MAP)
x
0031017
004632100457250005159
0070875
0006111
0035987
0006110
0046676
0046326
0090278
0002
792
0005
979
0010
962
0010
828
0045
923 0010907
0070873
00328850032881
0010676
0005978
0009250
0046324
0045913
0050994
00320240046323
00468880033613
0090
277
0002
793
●
●●●●●●●●●●●●●●●●●
●●●●●●●●●●●●
●●3
35
3
5
3
3
3
44
44
55 4 4 6 5
55
65
5
4
6
4
4
5
44
55
A.
cov = 22mcov = 265
x
y
0031017
007049100
1714
8
0019
915
0010
506
●
●
●●●3
3
23
2
B.
cov = 13mcov = 169
y
0032460
0005638
0001714
0031017
0006983
0035774
0070365
0046676
0033138
0032024
0001077●●●●
●●
●
●
●
●
●
22232
02
4
2
4
3
C.
cov = 26mcov = 156
Thursday, February 13, 14
x
0031017
004632100457250005159
0070875
0006111
0035987
0006110
0046676
0046326
0090278
0002
792
0005
979
0010
962
0010
828
0045
923 0010907
0070873
00328850032881
0010676
0005978
0009250
0046324
0045913
0050994
00320240046323
00468880033613
0090
277
0002
793
●
●●●●●●●●●●●●●●●●●
●●●●●●●●●●●●
●●3
35
3
5
3
3
3
44
44
55 4 4 6 5
55
65
5
4
6
4
4
5
44
55
A.
cov = 22mcov = 265
xy
0031017
0070491
0017
148
0019
915
0010
506
●
●
●●●3
3
23
2
B.
cov = 13mcov = 169
y
0032460
0005638
0001714
0031017
0006983
0035774
0070365
0046676
0033138
0032024
0001077●●●●
●●
●
●
●
●
●
22232
02
4
2
4
3
C.
cov = 26mcov = 156
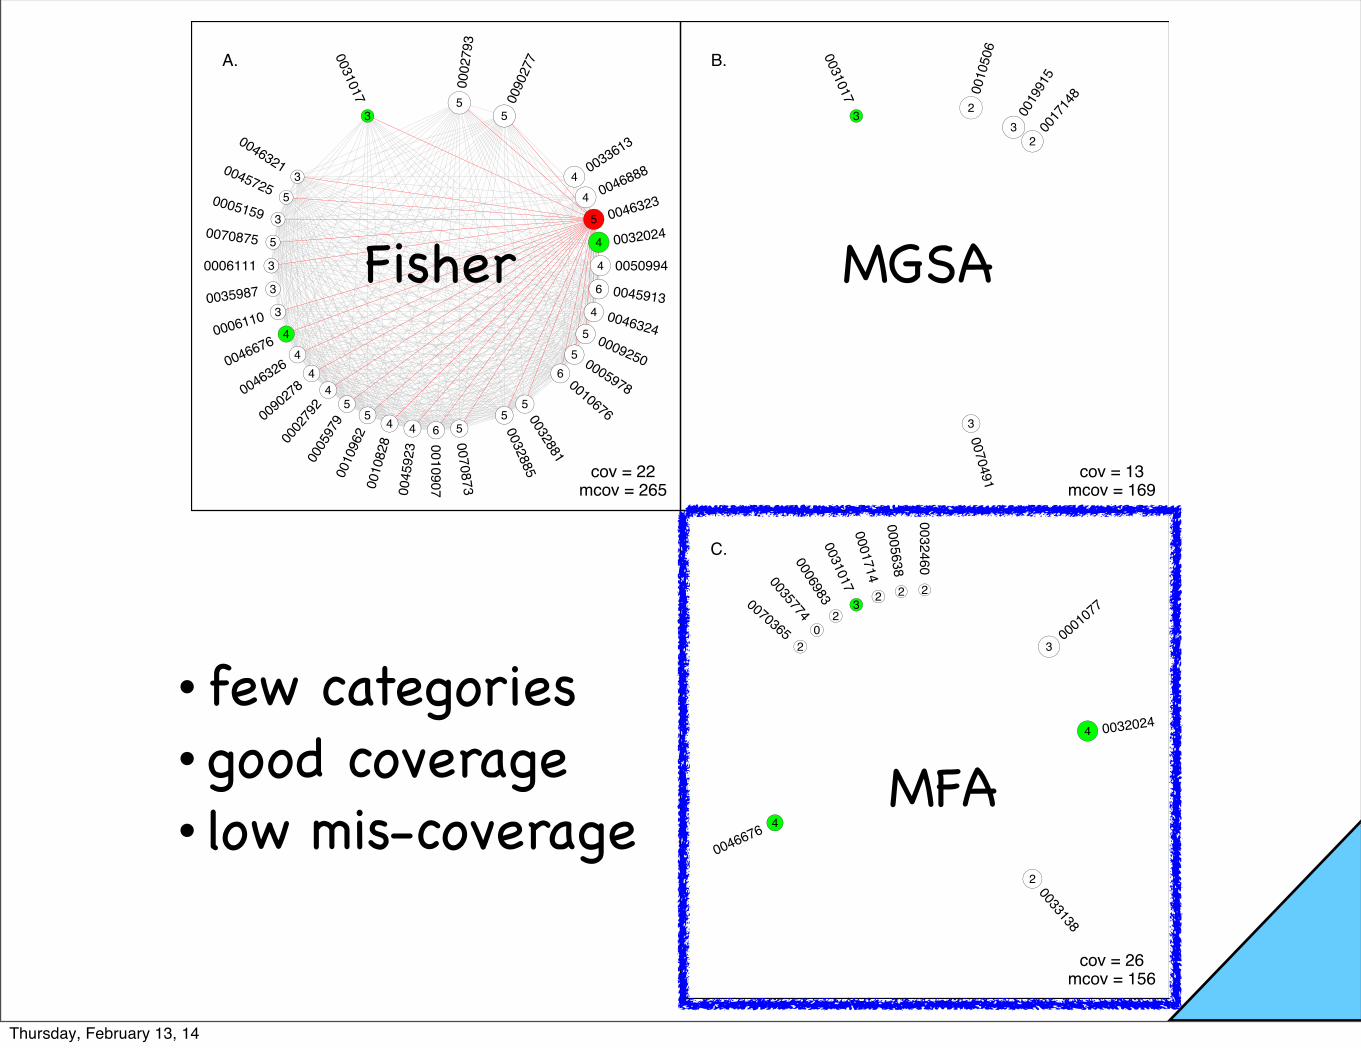
Fisher MGSA
MFA
• few categories • good coverage• low mis-coverage
Thursday, February 13, 14

T2D exampleMulti-functional analyzer:
Z. Wang et al Supplementary Material 5
Table S1: T2D: MFA-ILP results in Type-2 Diabetes example. Essentially the same as Table 3 (mainpaper), but with GO ID’s included; coverage 26
GOID Term (up to 40 characters) Statistics P.MFA P.MGSA FisherQ
GO:0001077 RNA polymerase II core promoter proximal 3/45 0.517 0.028 0.161GO:0032024 positive regulation of insulin secretion 4/41 0.964 0.372 0.016GO:0033138 positive regulation of peptidyl-serine p 2/35 0.537 0.096 0.756GO:0046676 negative regulation of insulin secretion 4/23 0.996 0.201 0.003GO:0006983 ER overload response 2/9 0.398 0.159 0.102GO:0035774 positive regulation of insulin secretion 0/9 0.964 0.002 1GO:0070365 hepatocyte di↵erentiation 2/9 0.316 0.016 0.102GO:0001714 endodermal cell fate specification 2/8 0.596 0.036 0.091GO:0031017 exocrine pancreas development 3/8 0.946 0.6 0.003GO:0032460 negative regulation of protein oligomeri 2/5 0.42 0.101 0.051GO:0005638 lamin filament 2/5 0.79 0.4 0.051
Table S2: T2D: MGSA results in Type-2 Diabetes example. Similar to Table 3 (main paper), but thesix gene sets shown are those inferred to be activated according to MGSA (P.MGSA � .5); coverage13
GOID Term (up to 40 characters) Statistics P.MFA P.MGSA FisherQ
GO:0010506 regulation of autophagy 2/50 0 0.797 0.856GO:0019915 lipid storage 3/49 0 0.708 0.192GO:0017148 negative regulation of translation 2/46 0 0.552 0.856GO:0070491 repressing transcription factor binding 3/30 0.053 0.823 0.074GO:0031017 exocrine pancreas development 3/8 0.946 0.6 0.003
Thursday, February 13, 14

Thursday, February 13, 14

Both MGSA and MFA use the same data structures and the same sampling model....the difference is the prior!
Thursday, February 13, 14

parts wholes{p} {w}
Thursday, February 13, 14

parts wholes{p} {w}
genes gene sets
Thursday, February 13, 14

{Ip,w}
0 1 11 0 00 1 10 1 11 0 1
Given
Thursday, February 13, 14

Data are measured on parts
Inference is required on wholes
Thursday, February 13, 14

set/wholew Zw = 1
activateAp = 1
activates all parts
Thursday, February 13, 14

Sampling model
↵ < �false positive rate true positive rate
Zw = 1 [whole w is active]
Xp = 1 [part p seems interesting]Part (gene) data:
Zw ⇠i.i.d. Bernoulli(⇡)
Xp|{Zw = zw} ⇠ Bernoulli
⇢↵+ (� � ↵) max
w:p2wzw
�Bernoulli
⇢↵ if maxw:p2w Zw = 0
� if maxw:p2w Zw = 1
Zw ⇠i.i.d. Bernoulli(⇡)
Xp|{Zw = zw} ⇠ Bernoulli
⇢↵+ (� � ↵) max
w:p2wzw
�Ap = 0Ap = 1
inactive
active
Thursday, February 13, 14
X
X
X
1
2
3
1
A
A
A
2
3
Z
Z
Z2
3
1
⇡
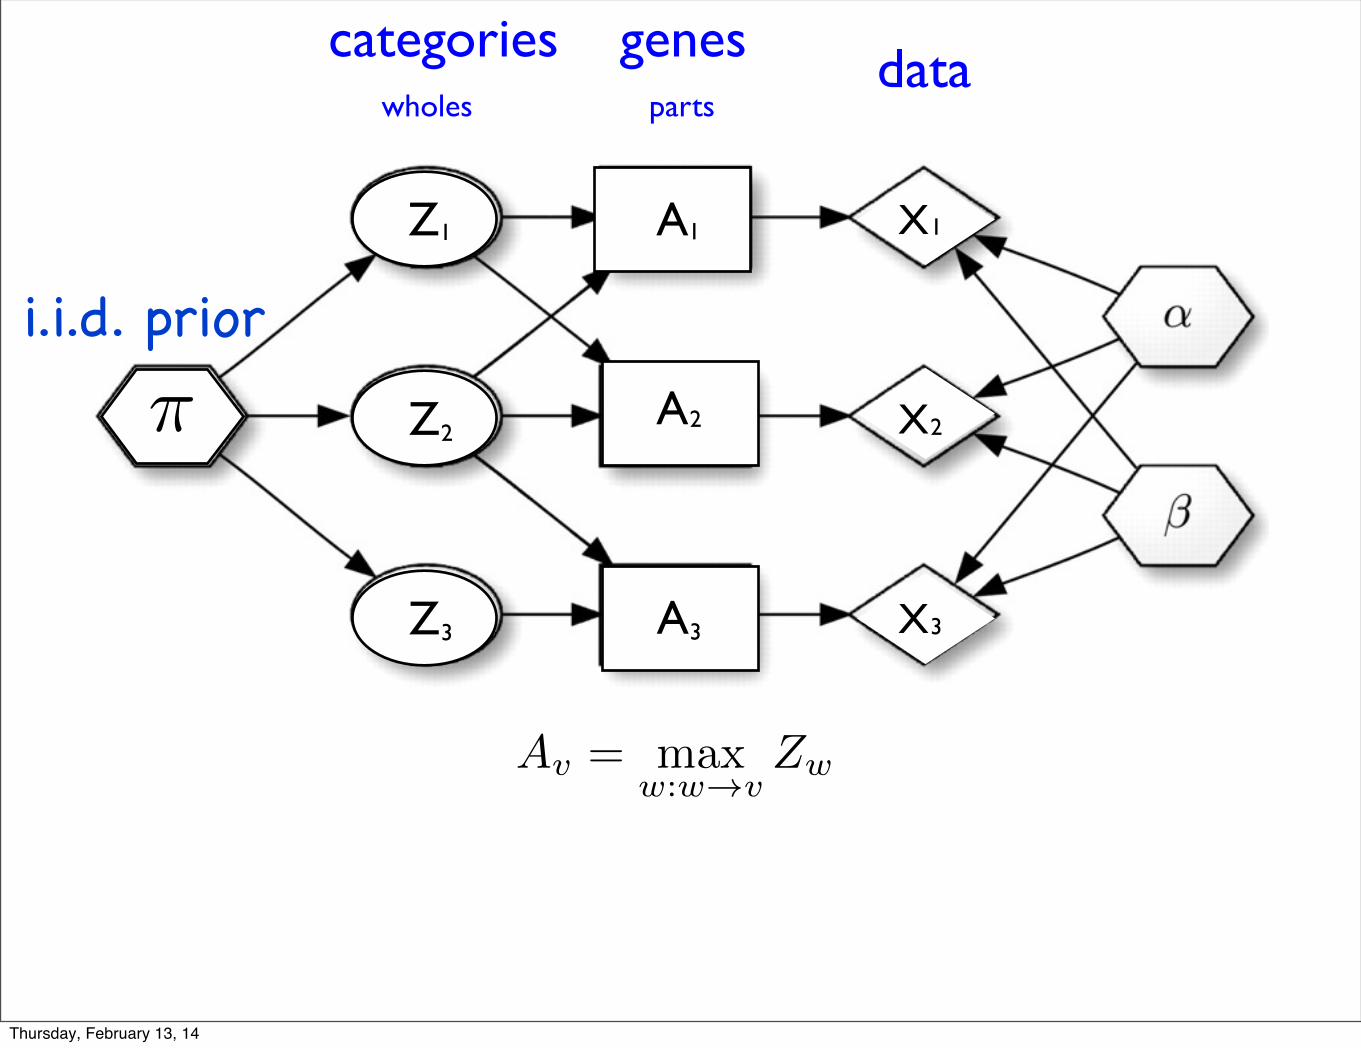
datagenescategoriespartswholes
Av = max
w:w!vZw
i.i.d. prior
Thursday, February 13, 14

X
X
X
1
2
3
1
A
A
A
2
3
Z
Z
Z2
3
1
⇡
datagenescategoriespartswholes
Av = max
w:w!vZw
MGSA: condition on data/ MCMC / P (Zw = 1|data)
i.i.d. prior
Thursday, February 13, 14

X
X
X
1
2
3
1
A
A
A
2
3
Z
Z
Z2
3
1
⇡
datagenescategoriespartswholes
{Zw} ! {Ap}the mapping: is not invertibleFor complicated collections,
Thursday, February 13, 14
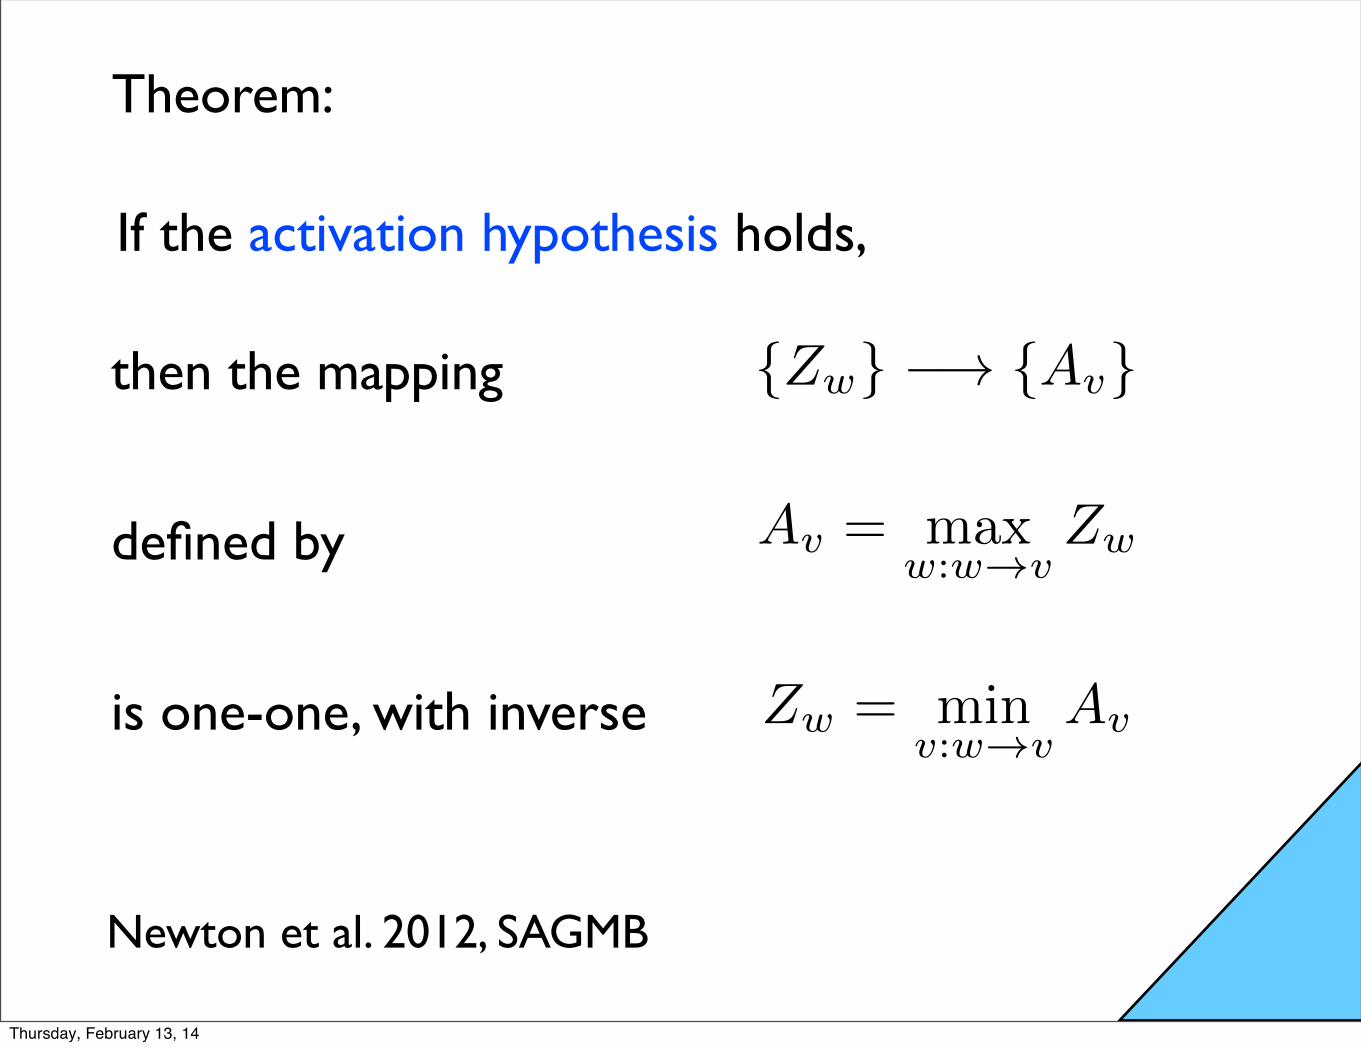
If the activation hypothesis holds,
{Zw} �! {Av}
Av = max
w:w!vZw
is one-one, with inverse Zw = minv:w!v
Av
then the mapping
defined by
Theorem:
Newton et al. 2012, SAGMB
Thursday, February 13, 14

Activation Hypothesis
A set of parts is active if and only if all parts in the set are active
Thursday, February 13, 14

whole wZw = 1
activateAp = 1
activates all parts
whole w⇤
? =) Zw⇤ = 1all parts active
Thursday, February 13, 14

Activation hypothesis imposes constraints on {Zw}
Thursday, February 13, 14

Z1
Z2
Z3
A1
A2
A3
A4
Av = max
w:w!vZw Zw = min
v:w!vAv
Some legal states of joint system: {{Zw}, {Av}}
active
Thursday, February 13, 14

Av = max
w:w!vZw Zw = min
v:w!vAv
{{Zw}, {Av}}
Z1
Z2
Z3
A1
A2
A3
A4
Some illegal states of joint system:
Thursday, February 13, 14

The activation hypothesis is equivalent to a set of linear inequality constraints:
Theorem (Z. Wang)
1. Zw Av 8w ! v
2. Av X
w:w!v
Zw 8v
3.X
v:w!v
(Zw � 2Av + 2) � 1 8w
Thursday, February 13, 14

Problem:
Bauer’s iid Bernoulli prior for doesn’t respect constraints.
{Zw}
Thursday, February 13, 14

●
●
●
Bioconductor version GO[5,20]
E[ #
AH v
iola
tions
], p
i=0.
01
41
42
43
44
Fall 2010 Fall 2011 Fall 2012
Increasing complexity of functional record causes increasing trouble for iid prior
a set violates AH if it is inactive and all its parts are active
Thursday, February 13, 14

Solution:
Change the prior
6 Z. WANG ET AL.
1. Zw Ap for all p, w with p 2 w2. Ap
P
w:p2w Zw for all p3.
P
p:p2w (Zw � 2Ap + 2) � 1 for all w
Evidently, the i.i.d. Bernoulli prior (2.3) does not respect AH in the sensethat vectors Z which violate AH have positive prior probability. In simplesystems such violation may be innocuous. We provide evidence that in thecomplex systems such as GO, this violation creates a substantial loss ofstatistical e�ciency. We note first that alternative prior specifications areavailable that respect AH. A simple one is to condition prior (2.3) on theAH event, namely
P (Z = z) =✓
1
c
◆
⇡P
wzw(1� ⇡)
P
w(1�zw) if z satisfies AH,(2.4)
otherwise P (Z = z) = 0, where c is the probability, in prior (2.3), that Zsatisfies AH, and z is a vector of binaries representing a possible realiza-tion of Z. In other words, with subscript ‘1’ for the i.i.d. prior (2.3) and‘2’ for prior (2.4), we have: P
2
(Z = z) = P1
(Z = z|AH) . Upon condition-ing, the (Zw) are not necessarily either mutually independent or identicallydistributed.
3. Statistical properties. The role of the prior distribution in Bayesiananalysis has surely been the subject of considerable debate. On one hand ithelps by regularizing inference, especially in high dimensions. On the otherhand, data need to work against it to produce inferences that trade o↵empirical characteristics with prior assumptions. A fact of relevance to thepresent problem is that gene-list data must work against either prior (2.3or 2.4) to deliver an inferred list of activated gene sets. For two Bayesiananalysts, one using prior (2.3) and the other using prior (2.4), the true stateis ascribed di↵erent prior mass. The ratio of these masses, ⇢, represents theextra e↵ort needed to be done by the data to overcome prior (2.3) comparedto prior (2.4):
⇢ =P2
(Z = ztrue
)
P1
(Z = ztrue
)=
P1
(Z = ztrue
|AH)
P1
(Z = ztrue
)=
1
P1
(AH)� 1.(3.1)
Here we have used the particular structure of prior (2.4) and also the assump-tion that z
true
satifies AH. If ztrue
did not satisfy AH, the target of inferenceit would be beyond the realm of any gene-level data set to estimate, owingto lack of identifiability. Indeed, it is di�cult to see what meaning could beascribed to z
true
in that case. The observation to be gained from (3.1) is that
This fixes a leak in the prior and improves operating characteristics ...
Thursday, February 13, 14

Posterior Computation
• MCMC in the constrained space (Q. He)• restricted move types
• penalized unconstrained MCMC (B. Larget)• simple move types; off-space penalty!!
• MAP via Integer Linear Programming (Z. Wang)• log posterior is linear in activities• max log posterior subject to linear inequalities• Rglpk (R GNU Linear Programming Kit)
Thursday, February 13, 14

thanks
Thursday, February 13, 14

Thursday, February 13, 14