mexico’s monetary policy and economic outlook...mexico’s monetary policy and economic outlook 2...
TRANSCRIPT

Mexico’s Monetary Policy and Economic Outlook
The United States-Mexico Chamber of Commerce, Northeast ChapterNew York City, September 6th, 2019
Javier Guzmán Calafell, Deputy Governor, Banco de México*
*/ The opinions and views expressed in this document are the sole responsibility of the author and do not necessarily represent the institutional position of the Banco de México or of its Board of Governors.

Mexico’s Monetary Policy and Economic Outlook 2
Global economic activity decelerated further during the first half of 2019, withweakness evident in the case of some of the main economies, both advancedand emerging.
Simultaneously, the pace of growth of global trade has declined sharply.
At the sectoral level, industrial output, and especially manufacturing, havebeen more severely affected by trade tensions.
In this context, forecasts for global growth for both 2019 and 2020 have beenadjusted downwards, and the balance of risks remains biased to the downside.

In the United States, GDP continues to grow above potential under tight labor marketconditions.
Mexico’s Monetary Policy and Economic Outlook 3
s.a. / Actual GDP is seasonally adjusted.Source: U.S. Congressional Budget Office and U.S. Bureau of Economic Analysis.
0.0
0.5
1.0
1.5
2.0
2.5
3.0
3.5
4.0
4.5
5.0
20
11
20
12
20
13
20
14
20
15
20
16
20
17
20
18
20
19
Real Gross Domestic Product
Real Potential Gross Domestic Product
United States: Gross Domestic Product Annual % change, s.a.
United States: Unemployment GapPercentage points
Source: U.S. Congressional Budget Office.
-2
-1
0
1
2
3
4
5
20
08
20
09
20
10
20
11
20
12
20
13
20
14
20
15
20
16
20
17
20
18
20
19
July2Q

A deceleration is anticipated and the perceived possibility of a recession has increased.
Mexico’s Monetary Policy and Economic Outlook 4
*/ Observed.Source: IMF.
0
10
20
30
40
50
60
70
2019 2020 2021
Bottom 10 Average Consensus Top 10 Average
Note: Data summarize the responses to the following question: what might be the probability of arecession in the U.S. starting in 2019, 2020 or 2021, respectively?Source: Blue Chip Financial Forecasts (September 2019).
United States: Gross Domestic Product ForecastsAnnual % change
United States: Probability of Recession%
0.0
0.5
1.0
1.5
2.0
2.5
3.0
2017* 2018* 2019 2020 2021 2022 2023 2024

In this context, and in the absence of generalized inflationary pressures, a relaxationof monetary policy in many advanced and emerging market economies has beenobserved.
Mexico’s Monetary Policy and Economic Outlook 5
United States: Reference Rates andImplicit Trajectories in OIS Curves1/
%
1/ OIS: Fixed-for-floating swap where the fixed interest rate is the reference rate.Source: Banco de México, Bloomberg and Federal Reserve.
Note: For each country, the deviation refers to the difference between the annual inflation observedthe month before the monetary policy announcement and the inflation target. Countries includedsatisfy two criteria: they relaxed monetary policy and have an explicit inflation target. For thosecountries with no point target, but an interval, we use the midpoint.Source: IMF and corresponding central banks’ websites.
-3-2-10123456789
1011
Sou
th K
ore
a
Ind
on
esia
Thai
lan
d
Ph
ilip
pin
es
Au
stra
lia
Bra
zil
Ind
ia
Ch
ile
Un
ited
Sta
tes
New
Ze
lan
d
Sou
th A
fric
a
Per
u
Ru
ssia
Mex
ico
Turk
ey
Headline Inflation Deviation from Target% points

While this should lead to an improvement in global financial conditions, thepotential impact on capital flows to EMEs may be moderate, given difficult economiccircumstances in a number of them and the complex global economic situation, as aresult, among others, of:
o The trade conflict between the United States and China.
o The risk of a sharper deceleration of global economic activity.
o A potential deterioration of economic problems in important advanced oremerging market economies.
o The greater probability of a disorderly exit of the United Kingdom from theEuropean Union.
o Political and geopolitical problems in several countries or regions.
Therefore, the possibility of turbulent market adjustments that restrict EMEs’ accessto external financing remains.
Mexico’s Monetary Policy and Economic Outlook 6

In Mexico, economic activity has decelerated and a stagnation is observed in recentquarters.
Mexico’s Monetary Policy and Economic Outlook 7
Mexico: Gross Domestic ProductQuarterly annualized % change, s.a.
s.a. / Seasonally adjusted series.Source: INEGI.
-4
-2
0
2
4
6
20
13
20
14
20
15
20
16
20
17
20
18
20
19
2Q
Note: The long-term trend of both coincident and leading indicators is represented by the 100 line.Source: INEGI.
Mexico: Cyclical IndicatorsIndexes referenced to 100 points
94
96
98
100
102
104
19
80
19
83
19
86
19
89
19
92
19
95
19
98
20
01
20
04
20
07
20
10
20
13
20
16
20
19
Coincident Leading
JuneJuly

Weakness is generalized among the different components of aggregate demand.However, exports have remained resilient. This has been supported by thecomposition of manufacturing growth in the US…
Mexico’s Monetary Policy and Economic Outlook 8
s.a. / Seasonally adjusted series.Source: Federal Reserve.
United States: Industrial ProductionIndex 2012=100, s.a.
95
100
105
110
115
20
12
20
13
20
14
20
15
20
16
20
17
20
18
20
19
Industrial Production: Manufacturing
Industrial Production Index
July
s.a. / Seasonally adjusted series.Source: Federal Reserve.
United States: Manufacturing ProductionIndex January 2012=100, s.a.
90
100
110
120
130
140
150
160
170
20
12
20
13
20
14
20
15
20
16
20
17
20
18
20
19
Total
Auto
Hi Tech
Manufacturing Exc. Auto and Hi Tech
July

… and by a higher share of Mexican exports in the US market, probably influencedrecently by the trade conflict between this country and China.
Mexico’s Monetary Policy and Economic Outlook 9
Mexico’s Share in US Imports: Total (Non-Oil)%, s.a.
s.a. / Seasonally adjusted series.Source: Banco de México with data from the United States Department of Commerce.
s.a. / Seasonally adjusted series.Source: Banco de México with data from the United States Department of Commerce.
Mexico’s Share in US Imports: Manufacturing%, s.a.
12
13
14
15
16
Jan
-15
Ap
r-1
5
Jul-
15
Oct
-15
Jan
-16
Ap
r-1
6
Jul-
16
Oct
-16
Jan
-17
Ap
r-1
7
Jul-
17
Oct
-17
Jan
-18
Ap
r-1
8
Jul-
18
Oct
-18
Jan
-19
Ap
r-1
9
Jul-
19
July7
8
9
10
11
28
31
34
37
40
Jan
-15
Ap
r-1
5
Jul-
15
Oct
-15
Jan
-16
Ap
r-1
6
Jul-
16
Oct
-16
Jan
-17
Ap
r-1
7
Jul-
17
Oct
-17
Jan
-18
Ap
r-1
8
Jul-
18
Oct
-18
Jan
-19
Ap
r-1
9
Jul-
19
← Auto
Non-Auto →July
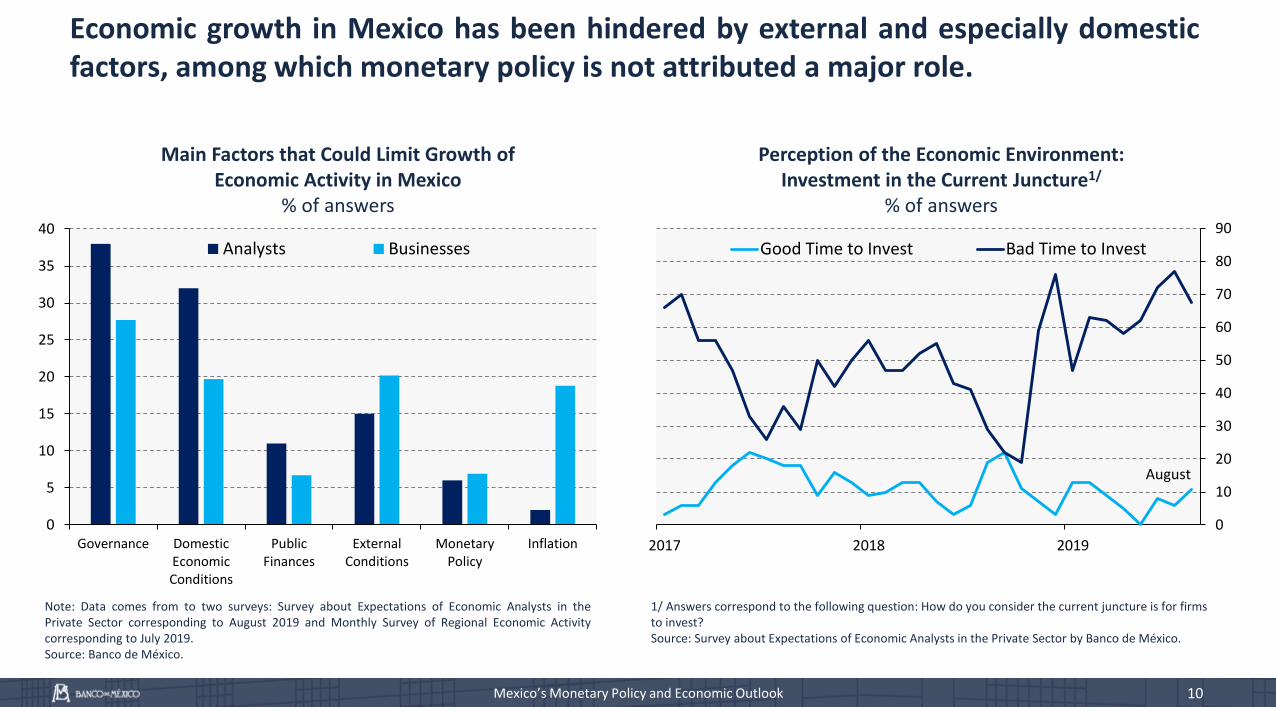
Economic growth in Mexico has been hindered by external and especially domesticfactors, among which monetary policy is not attributed a major role.
Mexico’s Monetary Policy and Economic Outlook 10
Perception of the Economic Environment:Investment in the Current Juncture1/
% of answers
1/ Answers correspond to the following question: How do you consider the current juncture is for firms to invest?Source: Survey about Expectations of Economic Analysts in the Private Sector by Banco de México.
Note: Data comes from to two surveys: Survey about Expectations of Economic Analysts in thePrivate Sector corresponding to August 2019 and Monthly Survey of Regional Economic Activitycorresponding to July 2019.Source: Banco de México.
0
5
10
15
20
25
30
35
40
Governance DomesticEconomicConditions
PublicFinances
ExternalConditions
MonetaryPolicy
Inflation
Analysts Businesses
Main Factors that Could Limit Growth ofEconomic Activity in Mexico
% of answers
0
10
20
30
40
50
60
70
80
90
2017 2018 2019
Good Time to Invest Bad Time to Invest
August

Although employment has weakened, labor costs are increasing faster thanproductivity.
Mexico’s Monetary Policy and Economic Outlook 11
Labor Productivity and Unit Labor Costsfor the Manufacturing Sector3/
Index 2013 = 100, s.a.
90
100
110
120
20
05
20
07
20
09
20
11
20
13
20
15
20
17
20
19
Labor Productivity
Unit Labor Costs
2Q
s.a. / Seasonally adjusted series.1/ Labor productivity based on worked hours. 2/ Preliminary data for 2Q 2019.Source: Banco de México with data from INEGI.
Labor Productivity and Unit Labor Costs for the Economy1/ 2/
Index 2013 = 100, s.a.
s.a. / Seasonally adjusted series.3/ Labor productivity based on worked hours. Source: Banco de México with data from INEGI.
92
94
96
98
100
102
104
106
108
110
112
20
07
20
08
20
09
20
10
20
11
20
12
20
13
20
14
20
15
20
16
20
17
20
18
20
19
Labor Productivity
Unit Labor Costs
June
Projections for economic growth in 2019 and 2020 have been adjusted downwards.The Banco de México estimates rates of growth of 0.2-0.7% and 1.5-2.5% for theseyears, respectively.
As a result, a negative output gap is expected for this period, although this should beadjusted to take into consideration the possible decline in potential growth.
Such a deceleration is taking place in the context of a strong expansion of the USeconomy.
The potential consequences of the expected lower rates of growth in that countryunderline the need to correct the domestic factors that are affecting theperformance of the Mexican economy.
Mexico’s Monetary Policy and Economic Outlook 12

Headline inflation has fallen significantly, from 6.77 percent in December 2017 to3.29 percent as of the first fortnight of August of this year. Nearly 80 percent of thisdecline is explained by non-core inflation.
Mexico’s Monetary Policy and Economic Outlook 13
Consumer Price IndexAnnual % change
*/ Data through the first fortnight of the month.Source: Banco de México and INEGI.
0
1
2
3
4
5
6
7
8
9
10
11
12
13
2015 2016 2017 2018 2019
Headline
Core
Non-Core
Variability Interval
August*

The latter shows very low levels at present, but is usually very volatile.
Mexico’s Monetary Policy and Economic Outlook 14
0
2
4
6
8
10
12
14
20
03
20
05
20
07
20
09
20
11
20
13
20
15
20
17
20
19
August*
CPI: Non-Core InflationAnnual %
*/Data through the first fortnight of August 2019.Source: INEGI.
*/Data through the first fortnight of August 2019.1/ As measured by the standard deviation of annual inflation in 12-month rolling windows.Source: Banco de México with data from INEGI.
0
1
2
3
4
5
20
03
20
04
20
05
20
06
20
07
20
08
20
09
20
10
20
11
20
12
20
13
20
14
20
15
20
16
20
17
20
18
20
19
Core Non-Core
August*
Core and Non-Core Inflation Volatility1/
%

Therefore, a more accurate assessment of inflationary trends requires a simultaneousevaluation of the core component. Cumulative core inflation thus far this year is similarto that observed on average since 2003 and recent projections for its evolution havebeen frequently adjusted upwards.
Mexico’s Monetary Policy and Economic Outlook 15
Source: Banco de México.1/ Through the first fortnight of August of each year.Source: INEGI.
Core Inflation Forecasts by Banco de MéxicoAnnual %
2.0
2.5
3.0
3.5
4.0
I II III IV I II III IV I II III IV I II
2018 2019 2020 2021
Quarterly Report January-March 2018
Quarterly Report April-June 2018
Quarterly Report July-September 2018
Quarterly Report October-December 2018
Quarterly Report January-March 2019
Quarterly Report April-June 2019
Cumulative Inflation1/
Annual %
0
0.5
1
1.5
2
2.5
3
3.5
4
4.5
20
03
20
04
20
05
20
06
20
07
20
08
20
09
20
10
20
11
20
12
20
13
20
14
20
15
20
16
20
17
20
18
20
19
Core Headline
Core Average Headline Average
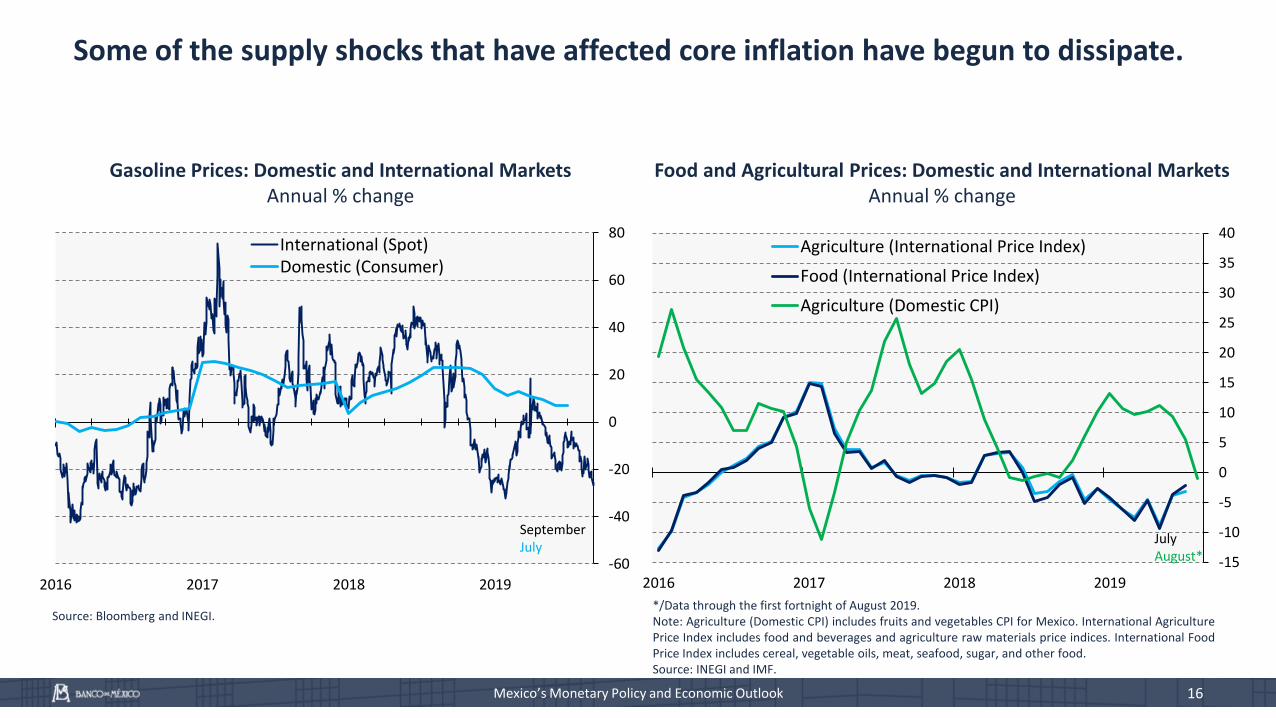
Some of the supply shocks that have affected core inflation have begun to dissipate.
Mexico’s Monetary Policy and Economic Outlook 16
Food and Agricultural Prices: Domestic and International MarketsAnnual % change
*/Data through the first fortnight of August 2019.Note: Agriculture (Domestic CPI) includes fruits and vegetables CPI for Mexico. International AgriculturePrice Index includes food and beverages and agriculture raw materials price indices. International FoodPrice Index includes cereal, vegetable oils, meat, seafood, sugar, and other food.Source: INEGI and IMF.
Gasoline Prices: Domestic and International MarketsAnnual % change
Source: Bloomberg and INEGI.
-15
-10
-5
0
5
10
15
20
25
30
35
40
2016 2017 2018 2019
Agriculture (International Price Index)
Food (International Price Index)
Agriculture (Domestic CPI)
July August*-60
-40
-20
0
20
40
60
80
2016 2017 2018 2019
International (Spot)Domestic (Consumer)
SeptemberJuly

In view of the above, and in the presence of a negative output gap, coreinflation is expected to decline in coming months.
It remains to be seen to what extent possible pressures from wages and theexchange rate obstruct the decline of this indicator.
Overall, achievement of the inflation target in the second half of 2020, in thecontext of a core component under control, is feasible.
However, the evolution of inflation will probably continue to be affected bypressures in opposing directions from its different determinants.
Mexico’s Monetary Policy and Economic Outlook 17

Notwithstanding the recent decline in survey-based expectations for headline inflation in2019-2020, the corresponding readings for the core component show a different behavior.Market-based measures for the medium-to-long term continue to suggest upward risks forinflation, albeit improving in recent months.
Mexico’s Monetary Policy and Economic Outlook 18
Inflation Expectations1/
%
1/ Median of analysts’ expectations.Source: Banco de México.
Source: PiP.
Inflation BreakevensBasis points
220
270
320
370
420
470
520
Jan
-16
May
-16
Sep
-16
Jan
-17
May
-17
Sep
-17
Jan
-18
May
-18
Sep
-18
Jan
-19
May
-19
Sep
-19
3 Years 10 Years 30 Years
2.0
2.2
2.4
2.6
2.8
3.0
3.2
3.4
3.6
3.8
4.0
Jan
-18
Feb
-18
Mar
-18
Ap
r-1
8
May
-18
Jun
-18
Jul-
18
Au
g-1
8
Sep
-18
Oct
-18
No
v-1
8
Dec
-18
Jan
-19
Feb
-19
Mar
-19
Ap
r-1
9
May
-19
Jun
-19
Jul-
19
Au
g-1
9
Headline 2019 Headline 2020
Core 2019 Core 2020
Permanent Target August
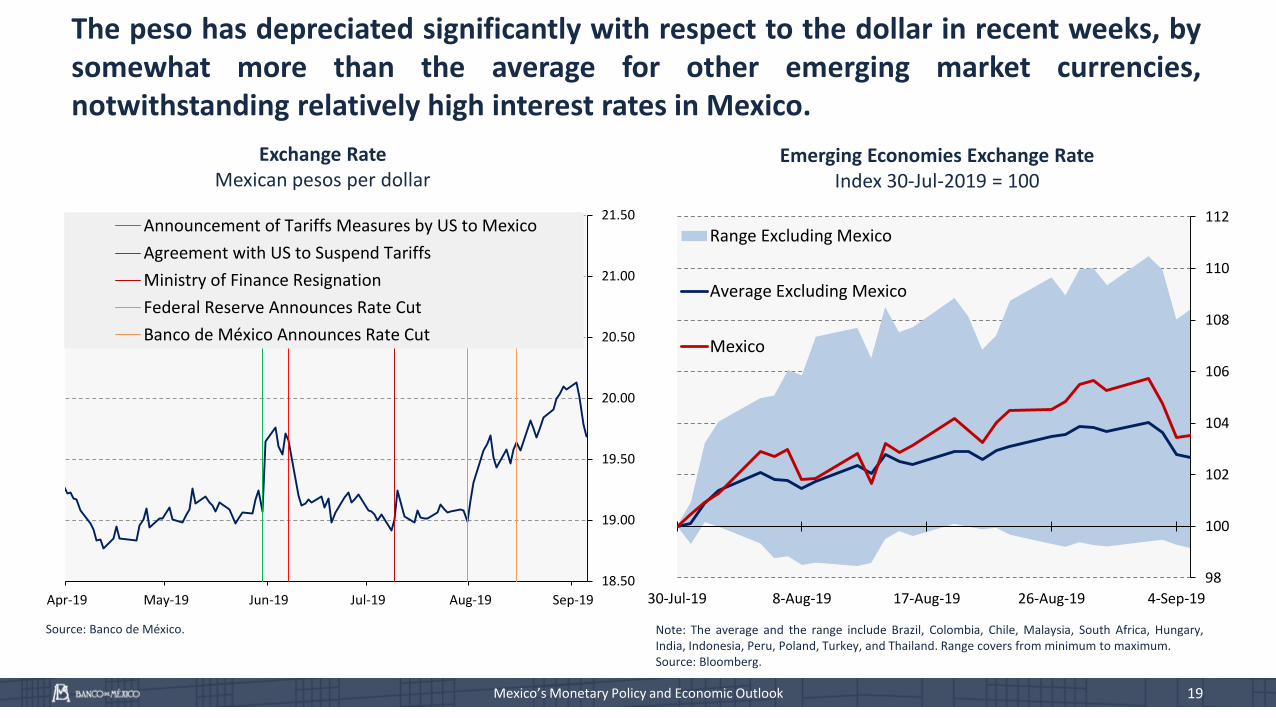
The peso has depreciated significantly with respect to the dollar in recent weeks, bysomewhat more than the average for other emerging market currencies,notwithstanding relatively high interest rates in Mexico.
Mexico’s Monetary Policy and Economic Outlook 19
Exchange RateMexican pesos per dollar
Source: Banco de México.
98
100
102
104
106
108
110
112
30-Jul-19 8-Aug-19 17-Aug-19 26-Aug-19 4-Sep-19
Range Excluding Mexico
Average Excluding Mexico
Mexico
Emerging Economies Exchange RateIndex 30-Jul-2019 = 100
Note: The average and the range include Brazil, Colombia, Chile, Malaysia, South Africa, Hungary,India, Indonesia, Peru, Poland, Turkey, and Thailand. Range covers from minimum to maximum.Source: Bloomberg.
18.50
19.00
19.50
20.00
20.50
21.00
21.50
Apr-19 May-19 Jun-19 Jul-19 Aug-19 Sep-19
Announcement of Tariffs Measures by US to Mexico
Agreement with US to Suspend Tariffs
Ministry of Finance Resignation
Federal Reserve Announces Rate Cut
Banco de México Announces Rate Cut

The perception of country risk has increased, as shown by CDS and theirevolution in recent months...
Mexico’s Monetary Policy and Economic Outlook 20
Note: This refers to the arithmetic mean of the 5-year Credit Default Swaps and to the minimumrating reported among S&P Ratings, Fitch Ratings and Moody's.1/ Colombia, Hungary, India and Russia. 2/ Brazil and Turkey. 3/ Peru and Thailand.Source: Bloomberg.
Emerging Economies Market Indicators ofDomestic Sovereign Credit Risk
Basis points
Note: The average and range includes Brazil, Colombia, Chile, Malaysia, South Africa, Hungary, India,Indonesia, Peru, Poland, Turkey, and Thailand. Range covers from minimum to maximum.1/ This refers to the arithmetic mean of the 5-year Credit Default Swaps.Source: Bloomberg.
Emerging Economies Market Indicators ofDomestic Sovereign Credit Risk1/
Index 1-Oct-2018=100
0
50
100
150
200
250
300
350
400
450
500
May
-13
Oct
-13
Mar
-14
Au
g-1
4
Jan
-15
Jun
-15
No
v-1
5
Ap
r-1
6
Sep
-16
Feb
-17
Jul-
17
Dec
-17
May
-18
Oct
-18
Mar
-19
Au
g-1
9
Mexico Average BBB- 1/
Average BB- 2/ Average (BBB+) 3/
September20
40
60
80
100
120
140
160
Oct
-18
No
v-1
8
Dec
-18
Jan
-19
Feb
-19
Mar
-19
Ap
r-1
9
May
-19
Jun
-19
Jul-
19
Au
g-1
9
Sep
-19
Range Excluding Mexico
Average Excluding Mexico
Mexico

… the fact that Mexico is included among the emerging market economies whosecredit rating and/or outlook was downgraded by at least one rating agency in the lastyear…
Mexico’s Monetary Policy and Economic Outlook 21
Sovereign Credit Rating Changes for Main Emerging Economies (September 4, 2019 vs. September 30, 2018)
BrazilMexicoTurkey
HungaryIndonesia
PolandRussia
ChileChina
Colombia
Note: The classification of countries is based on whether S&P, Moody’s or Fitch changed the sovereign credit rating between September 30, 2018 and September 4, 2019. There were no cases in which credit rating agenciescontradicted one another. If the rating by any of the three credit rating agencies increased (decreased) the country is classified as “better-off” (“worse-off”). Those countries with no credit rating actions are in the middle group.The color of the country name indicates the minimum credit rating outlook among S&P, Moody’s and Fitch as of September 4, 2019 as follows: red stands for negative outlook; green stands for positive outlook, and black meansstable outlook.
MalaysiaPeru
Saudi Arabia
SingaporeThailand
IndiaSouth AfricaSouth Korea

… and the performance of the Mexican Stock Exchange.
Mexico’s Monetary Policy and Economic Outlook 22
1/ Time series in local currency converted to dollars. The sample includes Argentina, Brazil, Chile, Czech Republic, Colombia, Hungary,India, Indonesia, Malaysia, South Africa, Philippines, Peru, Poland, Taiwan and Turkey.Source: Bloomberg.
Emerging Markets: Stock Exchange Index1/
Index 1-Oct-2018=100
40
60
80
100
120
140
160O
ct-1
8
No
v-1
8
Dec
-18
Jan
-19
Feb
-19
Mar
-19
Ap
r-1
9
May
-19
Jun
-19
Jul-
19
Au
g-1
9
Sep
-19
Range Excluding Mexico Mexico Average Excluding Mexico
Go
od
Per
form
ance
Bad
Per
form
ance

Interest rates have declined this year, especially at the long end of the curve. Theslope of the yield curve has flattened, but the low term premium points to the risk ofdecompression.
Mexico’s Monetary Policy and Economic Outlook 23
*/ The slopes are calculated as the difference between the 30-yearand the 3-year rates; and between the 10-year and the 3-year rates,respectively.Source: PiP.
M-Bonds Interest Rates
%
Source: Banco de México with data from Bloomberg and PiP.
-1
0
1
2
3
4
5
6
7
20
04
20
05
20
06
20
07
20
08
20
09
20
10
20
11
20
12
20
13
20
14
20
15
20
16
20
17
20
18
20
19
Range of Estimates Mean Estimate
September
10-year Term Premium
% points
Source: Banco de México with data from Bloomberg and Valmet.
Yield Curve Slope
Basis points
6.0
6.5
7.0
7.5
8.0
8.5
9.0
9.5
1 M
on
th
3 M
on
ths
1 Y
ear
3 Y
ear
s
5 Y
ear
s
10
Yea
rs
20
Yea
rs
30
Yea
rs
2019 Range 14-Aug-19 4-Sep-19
-20
0
20
40
60
80
100
120
Jan
-18
Mar
-18
May
-18
Jul-
18
Sep
-18
No
v-1
8
Jan
-19
Mar
-19
May
-19
Jul-
19
Sep
-19
30 Years - 3 Years
10 Years - 3 Years
September

The situation of PEMEX continues to be a major source of concern.
The business plan recently announced has not dissipated distress about thefirm’s financial perspectives.
In particular, doubts have been expressed about the viability of reaching oiloutput and reserves’ replenishment targets considered in the plan.
Thus, markets seem to continue to discount an additional downgrade ofPEMEX’ ratings.
Also, unease remains about the potential implications for public finances andthe sovereign.
Mexico’s Monetary Policy and Economic Outlook 24
Monetary policy continues to be implemented in a context of high uncertainty.
The difficulties originating from a complex external environment have beenaccentuated by idiosyncratic factors.
As a result, a deceleration of economic activity has combined with a persistently highcore inflation and pressures on the exchange rate, in the context of an increase in theperception of country risk.
Inflationary pressures should decline in coming months.
However, to the extent that uncertainty persists, especially related to domesticfactors, the margins of maneuver for monetary policy are likely to remain constrained.
The level of interest rates is partly a reflection of country risk.
Under current conditions monetary policy must contribute to support confidence,with any future actions depending on incoming data and evolving circumstances.
The implementation of policies in other areas aimed at strengthening confidencewould open margins of maneuver for monetary policy and in general support therecovery of economic activity.
Mexico’s Monetary Policy and Economic Outlook 25

FINAL REMARKS
The Mexican economy continues to face a challenging situation.
The external environment is likely to become more complex, thus enhancing theimportance of domestic actions aimed at strengthening economic fundamentals.
Under these circumstances, monetary policy should prioritize prudence.
Monetary and in general macroeconomic policies face important limitations tostimulate economic activity.
To reach this objective, efforts should concentrate on overcoming the fundamentalcauses of the current weakness.
This implies ensuring sound public finances in the long term, implementing publicpolicies conducive to an increase in productivity, fostering adequate conditions foran increase in private investment, and in general enhancing confidence in theeconomy’s outlook and the institutional framework.
Mexico’s Monetary Policy and Economic Outlook 26
