mexico 2015 -...
TRANSCRIPT

1


MEXICO
2015Compendium of Environment Statistics, Key
Environmental Indicators, Environmental Performance Indicators and Green Growth Indicators
Executive Summary
State of the
EnvironmentReport

COPYRIGHT © 2016, SECRETARÍA DE MEDIO AMBIENTE Y RECURSOS NATURALES
EXECUTIVE SUMMARYMEXICO STATE OF THE ENVIRONMENT REPORT.
COMPENDIUM OF ENVIRONMENT STATISTICS, KEY ENVIRONMENTAL INDICATORS, ENVIRONMENTAL PERFORMANCE INDICATORS AND
GREEN GROWTH INDICATORSVERSION 2015.
Semarnat. Executive Summary. Mexico State of the Environment Report Compendium of Environment Statistics, Key Environmental Indicators, Environmental Performance Indicators and Green Growth Indicators.Version 2015. Semarnat. Mexico. 2016.
http://www.gob.mx/semarnatPrinted in MexicoISBN en trámite
Av. Ejército Nacional No. 223Col. Anáhuac, CP. 11320Delegación Miguel HidalgoCiudad de México, México
Headquarters:
Citation:
Free distribution, not for sale
The United Nations Development Programme (UNDP), through the UNDP-SEMARNAT projects “Espacios públicos de concertación social para procesos de desarrollo sustentable local” and “Construcción de ciudadanía y espacios de participación para el desarrollo sustentable”, provided partial support for this work in order to increase the amount and improve the quality and accessibility of environmental information in Mexico.
This report is part of Mexico’s National System of Environmental and Natural Resources Information (SNIARN, in Spanish) at the Ministry of the Environment and Natural Resources. The Direction General for Environmental Information and Statistics was in charge of the contents and edition of this report.
COMPENDIUM OF ENVIRONMENT STATISTICS
General Coordination: Arturo Flores Martínez César E. Rodríguez Ortega María Alejandra González Gutiérrez Compilation and Edition: Isidro Amhed Cruz Leyva Miguel Chipole Ibáñez Yasmín Esther Juárez Pastrana Design: Esperanza Martínez Vargas Web Development: Rogelio Chávez Pérez Edder Flores Castelan
General Coordination: Georgina Alcantar López Compilation and Edition: Gabriela Carmona Huerta Gerardo Jesús Cervantes Corte Angélica Daza Zepeda Francisco García Gómez Lizzeth Guadalupe Romero de la O José Marcelo Sánchez López


v
Table of contents
POPULATION AND THE ENVIRONMENT
TERRESTRIAL ECOSYSTEMS
SOILS
BIODIVERSITY
ATMOSPHERE
Air Quality
Climate Change
Stratospheric Ozone
WATER RESOURCES
SOLID WASTE AND HAZARDOUS WASTE
SOURCES
Page
1
4
7
10
14
14
18
22
23
29
31


vii
Abbreviations
AMM Monterrey Metropolitan ZoneANP Protected Natural AreasBAU Business as usualBOD5 5-day Biochemical Oxygen DemandCNA National Water CommissionCO Carbon MonoxideCO2 Carbon DioxideCO2e Carbon Dioxide EquivalentCOD Chemical Oxygen DemandCONABIO National Commission for the Knowledge and Use of BiodiversityCONAFOR National Forestry CommissionCONAGUA National Water CommissionCONANP National Commission for Protected Natural AreasCONAPO National Population Council CONEVAL National Council for the Evaluation of Social Development PolicyCP Agricultural Post-graduate SchoolDGEIA Direction General for Environmental Information and StatisticsDGGIMAR Direction General for the Integrated Management of Hazardous Waste and Activities
GDP Gross Domestic ProductGHG Greenhouse GasHW Hazardous WasteINAH National Institute for Anthropology and HistoryiNDC Intended Nationally Determined Contributions IMT Mexican Institute for TransportINECC National Institute for Ecology and Climate ChangeINEGI National Institute for Statistics and GeographyLULUCF Land-use, land-use change and forestryMSW Municipal Solid WasteMt MegatonnesNASA National Aeronautics and Space Administration NO2 Nitrogen DioxideO3 OzonePACE Programme of Action for Species ConservationPECC Special Programme for Climate Change

viii
PGRP National Registry of Hazardous Waste GeneratorsPM10 Particulate matter 10 micrometers or less in diameterPM2.5 Particulate matter 2.5 micrometers or less in diameterProcer Programme for the Conservation of Species at RiskProAire Management Programme to Improve Air QualityPronafor National Forestry ProgrammePSA-CABSA Environmental ServicesProgramme for Carbon Capture, Biodiversity Conservation and Agroforestry SystemsREPDA Public Registry of Water RightsSAO Ozone Depleting SubstancesSARH Ministry of Agriculture and Water ResourcesSCT Ministry of Transport and CommunicationsSEDESOL Ministry of Social DevelopmentSEMARNAP Ministry of the Environment, Natural Resources and FisheriesSEMARNAT Ministry of the Environment and Natural Resources
SINA National System of Water Resources InformationSO2 Sulphur DioxideSST Total Suspended SolidsTCRDED Total Cost of Resource Depletion and Environmental DegradationUACh Autonomous University of ChapingoUMA Wildlife Conservation Management UnitsUNAM Mexico National Autonomous UniversityUNFAO Food and Agriculture Organization of the United Nations UNFCCC United Nations Framework Convention on Climate ChangeWWF World Wildlife Fund ZMG Guadalajara Metropolitan ZoneZML Leon Metropolitan ZoneZMM Monterrey Metropolitan ZoneZMO Oaxaca Metropolitan ZoneZMQ Queretaro Metropolitan ZoneZMSLP San Luis Potosi Metropolitan ZoneZMT Tijuana Metropolitan ZoneZMVM Mexico City Metropolitan ZoneZMVT Toluca Metropolitan Zone

1
Population size has been one the driving forces most frequently mentioned to account for overexploitation of natural resources and environmental degradation. However, it is recognized that population growth per se is not the only factor determining the extent of stress exerted on the environment and natural resources. The society’s economic consumption capacity is also a major driver, as is the technical efficiency with which resources are used in the production of goods. Other variables such as inequality, urbanization level and the regulatory and institutional framework also affect the dynamics of environmental stress drivers.
The Mexican population is still growing, with a trend towards an increasing concentration in urban areas. In 2015 the population reached 119.9 million people. In the same year, the 59 metropolitan areas harbored 68.1 million inhabitants (56.98% of the population at a national level). The country’s population is expected to continue growing up to 150.8 million by 2050.
160
140
120
100
80
60
40
20
0
Popu
latio
n si
ze (
mill
ion
peop
le)
Gro
wth
rate
(%
)
4
3.5
3
2.5
2
1.5
1
0.5
0
-0.5
-1
18
95
19
00
19
10
19
21
19
30
19
40
19
50
19
60
10
70
19
80
19
90
20
00
20
10
20
20
20
30
20
40
20
50
Population size and growth rate in Mexico, 1895 - 20501
Year
Note:1 Dashed lines and light-coloured bars denote projections.
Population size
Growth rate
Population andthe environment

2
A high percentage of the population live in
poverty, especially in rural areas. In 2014 there
were 55.34 million poor people, i.e., 46.2% of
the population of that year; 11.44 million of
them, i.e, 9.5% of the Mexican population, were
living in extreme poverty.
Mexico’s ecological footprint in 2012 was 2.9
global hectares per person, while the country’s
biocapacity was only 1.3 global hectares,
representing a deficit of 1.6 global hectares.
The major component of the Mexican ecological
footprint is the surface area required to absorb
the amount of CO2 emitted from burning fossil
fuels (which accounts for 60.2% of the ecological
footprint).
Population per poverty and vulnerability levels in Mexico, 2010 - 2014
Ecological footprint and per capita biocapacity in Mexico, 1961 - 2012
100
80
60
40
20
0
Popu
latio
n (m
illio
n pe
ople
)
2010 2012 2014
Year
Extreme poverty
Moderate poverty
Income vulnerability
Social needs vulnerability
No poor and no vulnerable
Ecol
ogic
al fo
otpr
int
and
per c
apita
bio
capa
city
(g
loba
l ha)
Year
4
3.5
3
2.5
2
1.5
1
0.5
0
Ecological footprint
Biocapacity
Ecological credit
Ecological deficit
Poverty and vulnerability level
19
61
19
66
19
71
19
76
19
81
19
86
19
91
19
96
20
01
20
06
20
12

3
By 2011, there was no visible
impact of human activities on
53.3% of the country’s area.
By contrast, 11.4% of the
territory showed a substantial
human footprint, particularly
concentrated in parts of the
central and southeastern
states as well as in the
northwest coastal zone facing
the Gulf of California.
Human footprint in Mexico
UnconvertedLowMediumHighVery high
Human footprint
km
0 250 500 1 000
The total costs of resource depletion and
environmental degradation (TCRDED) dropped
from 1 003 billion pesos to 911 billion pesos
between 2012 and 2014, i.e. a 9.2% decrease.
TCRDED amounted to 5.3% of GDP in 2014.
Degradation costs accounted for 83.5% of
TCRDED in 2014 (those derived from air pollution
being the most important ones). The depletion of
hydrocarbons represented 70% of the total costs
of resource depletion, followed by the depletion
of water (20%) and forest (10%) resources.
Total cost of resource depletion and environmental degradation (TCRDED) in Mexico, 2003 - 2014
Cos
t (m
illio
n cu
rren
t pe
sos)
20
03
20
04
20
05
20
06
20
07
20
08
20
09
20
10
20
11
20
12
20
13
20
14
1 200 000
1 000 000
800 000
600 000
400 000
200 000
0
Note: 1 Figures for 2013 and onwards are preliminary .
Year1
Resource depletion
Degradation
53.39.21214
11.4
Country area (%)
4
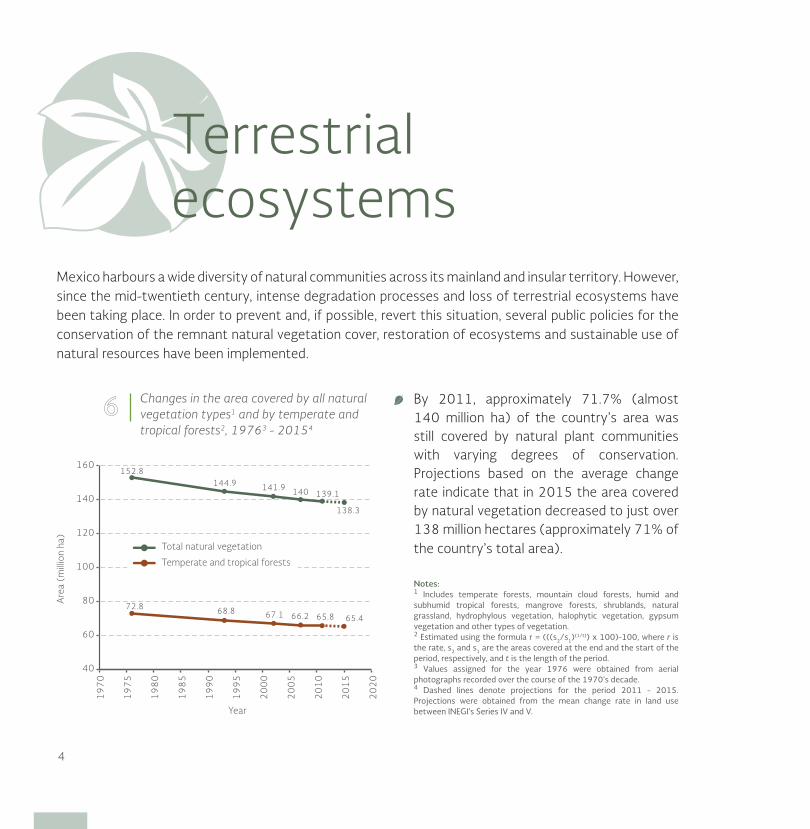
Mexico harbours a wide diversity of natural communities across its mainland and insular territory. However, since the mid-twentieth century, intense degradation processes and loss of terrestrial ecosystems have been taking place. In order to prevent and, if possible, revert this situation, several public policies for the conservation of the remnant natural vegetation cover, restoration of ecosystems and sustainable use of natural resources have been implemented.
By 2011, approximately 71.7% (almost 140 million ha) of the country’s area was still covered by natural plant communities with varying degrees of conservation. Projections based on the average change rate indicate that in 2015 the area covered by natural vegetation decreased to just over 138 million hectares (approximately 71% of the country’s total area).
Changes in the area covered by all natural vegetation types1 and by temperate and tropical forests2, 19763 - 20154
160
140
120
100
80
60
40
Are
a (m
illio
n ha
)
19
70
19
75
19
80
19
85
19
90
19
95
20
00
20
05
20
10
20
15
20
20
Total natural vegetation
Temperate and tropical forests
Year
152.8144.9 141.9 140 139.1
138.3
72.8 68.8 67.1 66.2 65.8 65.4
Notes:1 Includes temperate forests, mountain cloud forests, humid and subhumid tropical forests, mangrove forests, shrublands, natural grassland, hydrophylous vegetation, halophytic vegetation, gypsum vegetation and other types of vegetation.2 Estimated using the formula r = (((s2/s1)(1/t)) x 100)-100, where r is the rate, s2 and s1 are the areas covered at the end and the start of the period, respectively, and t is the length of the period.3 Values assigned for the year 1976 were obtained from aerial photographs recorded over the course of the 1970’s decade.4 Dashed lines denote projections for the period 2011 - 2015. Projections were obtained from the mean change rate in land use between INEGI’s Series IV and V.
Terrestrialecosystems
5
The loss and degradation of natural vegetation still persists, albeit at a slower pace than in the past. Between 2007 and 2011, some 214 thousand hectares of natural vegetation were lost every year, significantly less than the 490 thousand hectares per year recorded between 1976 and 1993. Projections show that between 2011 and 2015, the rate of natural vegetation loss was in the order of 121 thousand hectares per year.
Tropical forests are the ecosystems with the highest conversion rate in Mexico. Between 2007 and 2011 some 97 thousand hectares were converted to other land uses every year on average, and 35 thousand hectares were subjected to degradation processes. Temperate forests lost about 21 thousand hectares over the same period of time, at a rate of about 5 300 hectares annually, and 1 500 hectares were degraded.
The latest estimate of countrywide deforestation reported by Mexico to UNFAO, the net deforestation rate between 2000 and 2010 was 136 thousand hectares per year, whereas 92 thousand hectares per year were reported for the period 2010-2015. This shows a significant reduction in the area that is annually deforested in Mexico.
The areas devoted to agriculture and livestock ranching continue to expand, although at a slower pace. Between 2007 and 2011, the area dedicated to these activities increased by about 124 thousand hectares per year, a significant reduction compared to the 368 thousand hectares per year estimated for the period 1976-1993. The advance of the agricultural frontier has been faster than the conversion to pastureland: 81% of the increase in the area devoted to agriculture and livestock ranching from 2007 to 2011 was due to the change in land use to agriculture.

6
Between 1986 and 2015, the mean annual production of round timber was 7.2 million cubic meters, but it has been steadily declining over the past 15 years. The mean production during 2000-2015 was about 17% lower than the average recorded between 1986 and 1999.
Timber production in Mexico, 1986 - 2015
12
10
8
6
4
2
0
Roun
d tim
ber p
rodu
ctio
n (m
illio
n m
3)
19
86
19
88
19
90
19
92
19
94
19
96
19
98
20
00
20
02
20
04
20
06
20
08
20
10
20
12
20
14
20
15
Year
The federal policy instruments focused on conservation (Protected Natural Areas and others), sustainable use (for example, Environmental Management Units) and restoration (reforestation and others) of terrestrial ecosystems have covered, a total cumulative area of 97 million hectares until 2015 (about 50% of the country’s mainland area).
Area covered by programmes aimed to the conservation, sustainable use or restoration of terrestrial ecosystems, 2000 - 20151
120
100
80
60
40
20
0
Are
a (m
illio
n ha
)
20
00
20
01
20
02
20
03
20
04
20
05
20
06
20
07
20
08
20
09
20
10
20
11
20
12
20
13
20
14
20
15
Year
Sustainable use RestorationConservation
Programmes
63%61.2
7%6.5
30%29.4
Note:1 There exists partial overlap between the programmes; by this fact, the actual total area covered by the three types of programmes could by lower than the total area mentioned in the text.
Percentage of the total area covered by programmes
Surface area in million hectares

7
Soil is a key element that sustains life on Earth. Besides providing physical support and habitat for vegetation, infrastructure and biodiversity, it is an essential component for the functioning of any ecosystem. Soil, like forests, water, and even mineral deposits, is a finite resource that is part of the natural strategic capital of any country. However, despite supporting many agricultural economies in the world, it is under an increasing degradation stress as a result of population growth and unsustainable global production and consumption patterns.
Results from the latest soil degradation assessment for Mexico reveal that in 2002, 44.9% of soils had been degraded to some extent. Chemical degradation was the process that affected the largest area (34 million hectares, 17.8% of the country’s area), followed by hydric erosion (22.7 million hectares, 11.9%), wind erosion (18.1 million hectares, 9.5%), and, finally, physical degradation (10.8 million ha, 5.7%).
Wind erosion9.5%
Physical degradation
5.7%
With no visible degradation
55.1%
Chemical degradation
17.8%
Water erosion11.9%
Relative area affected by soil degradation processes in Mexico, 20022
Notes:1 Percentages do not add to 100% due to rounding errors.2 The country’s total area considered was: 1 909 818.5 km2 and does not include water bodies, human settlements, urban areas, zones without vegetation and islands.
Soils

8
Mexico possesses about 125.3 million hectares of drylands (65% of the country’s area). According to the Land Degradation and Desertification Baseline assessment (2013), about 92.4% of the country’s drylands (125.3 million hectares, 64% of the country’s area) show evidence of some degree of desertification: 9.9% extreme, 40.1% severe, and 42.4% slight or moderate.
Desertification level in Mexican drylands1
Note:1 Delimitation based on the Aridity Index calculated using the Penman’s method.
20.7%25.9
21.7%27.2
7.6%9.6
40.1%50.2
9.9%12.4
About 77.4% of the country’s degraded soils were associated with agriculture and livestock ranching (38.7% each); 16.4%, with deforestation and vegetation removal. The rest of the country’s degraded soils (about 5.3 million ha, 6.1% of the total degraded area) were due to urbanization, overexploitation of vegetation and industrial activities.
Main causes of soil degradation in Mexico, 2002
No degradation
Light
Moderate
Severe
Extreme
Other climates
Desertification level
Causes of soil degradation
Agricultural activities
Overgrazing
Deforestation
Urbanization
Vegetation overexploitation
Industrial activity
With no visible degradation
Percentage of desertification with respect to the total area
of drylandsArea in million hectares

9
The surface area included in the government’s programmes for Environmental Compensation for Land Use Change in Forest Lands and the National Forestry Programme, both implemented by the National Forestry Commission (CONAFOR), was 163 100 hectares in 2014, or 0.2% of the country’s area affected by soil degradation (85.7 million hectares).
Notes:1 Data are not available for all the years reported for all the programmes because each programme’s operation depends on the design and agreement on the allocation of resources. Budgetary resources for the period 2001-2006 were devoted to the “Soil conservation and restoration strategy” under the National Forestry Programme. For the period 2007–2012, the resources were allocated to the “Soil conservation” and “Soil restoration” lines under the ProÁrbol programme. The 2013 resources were allocated to Component III “Conservation and Restoration” of the Pronafor programme. The 2014 funds were devoted to Component III “Productive reconversion and forest restoration” under the Pronafor programme.2 Surface areas reported are not cumulative across years as producers might enter, withdraw or renew their participation in the programme, according to their interest or compliance with the programme’s requirements.3 Surface area that has to be compensated for because of the total or partial removal of vegetation from forested lands to be converted to non-forest activities. 4 Aimed to support actions and projects for the recovery of forest coverage and the conservation or restoration of soils located in watersheds with forested or potentially forested lands with some level of degradation.
Area under institutional soil conservation and restoration programmes , 1996 - 20141,2
Year
140
120
100
80
60
40
20
0
Are
a in
clud
ed (
thou
sand
ha)
19
96
19
97
19
98
19
99
20
00
20
01
20
02
20
03
20
04
20
05
20
06
20
07
20
08
20
09
20
10
20
11
20
12
20
13
20
14
Compensatory restoration for land-use change3
National Programme for Forest Soils4

10
BiodiversityBiodiversity loss of is one of the major environmental challenges that man currently faces. Human activities have radically altered the structure and functioning of ecosystems. In some instances, this has led many species to become endangered of extinction and has compromised several of the environmental services supplied by ecosystems.
For many countries, including Mexico, biodiversity loss is particularly important because they are home to the major centres of biological diversity on Earth: The 15 mega-diverse countries jointly concentrate between 60% and 70% of the global biodiversity.
According to the Mexican standard NOM-059-SEMARNAT-2010, 51.3% (443 species) of the reptile species known in Mexico are facing some risk of extinction, followed by 51.6% (194 species) of amphibians, 51.6% (291) of mammals, and 34.1% (392 species) of birds. The lowest numbers of species at risk are found in fish (7.4%, 204 species) and vascular plants (3.4%, 987 species).
Distribution of species per risk1 category for the major taxa, according to Mexican standard NOM-059-SEMARNAT-2010
100
90
80
70
60
50
40
30
20
10
0
Spec
ies
at ri
sk (
%)
Inve
rteb
rate
s
Fish
Am
phib
ians
Rept
iles
Bird
s
Mam
mal
s
Fung
i
Plan
ts
Note:1 Figures on the bars are the total number of at-risk species in each taxon, as per the standard NOM-059-SEMARNAT-2010.
49 204 194 443 392 291 46 987
Threatened
At risk of extinction
Subject to special protection
Most likely extinct in the wild
Risk category
Taxon
11
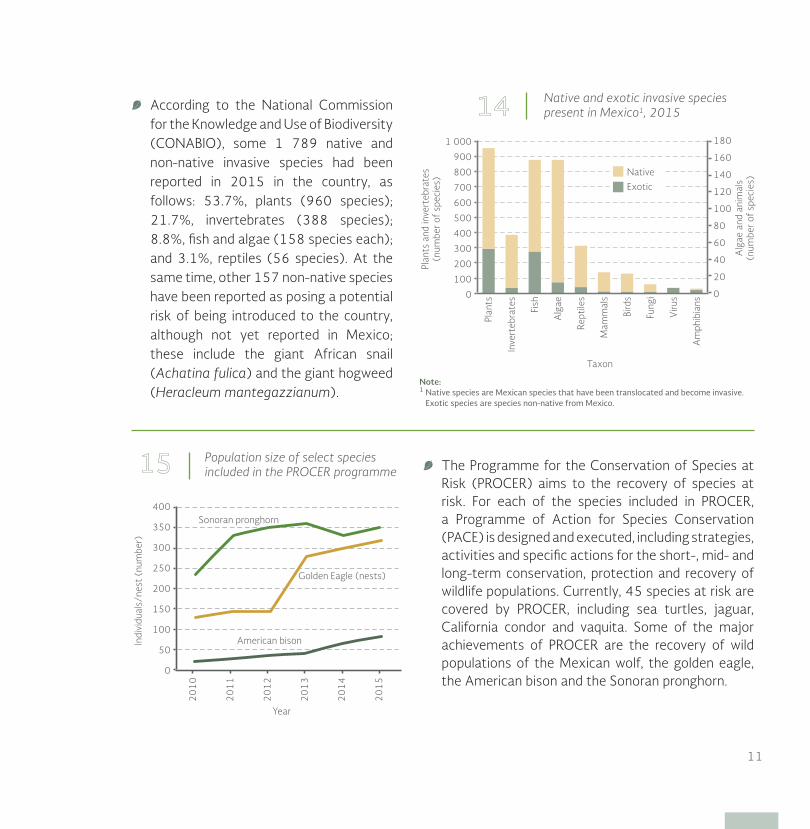
According to the National Commission for the Knowledge and Use of Biodiversity (CONABIO), some 1 789 native and non-native invasive species had been reported in 2015 in the country, as follows: 53.7%, plants (960 species); 21.7%, invertebrates (388 species); 8.8%, fish and algae (158 species each); and 3.1%, reptiles (56 species). At the same time, other 157 non-native species have been reported as posing a potential risk of being introduced to the country, although not yet reported in Mexico; these include the giant African snail (Achatina fulica) and the giant hogweed (Heracleum mantegazzianum).
Native and exotic invasive species present in Mexico1, 2015
1 000
900
800
700
600
500
400
300
200
100
0
Plan
ts a
nd in
vert
ebra
tes
(num
ber o
f sp
ecie
s)
180
160
140
120
100
80
60
40
20
0
Alg
ae a
nd a
nim
als
(num
ber o
f sp
ecie
s)
Plan
ts
Inve
rteb
rate
s
Fish
Alg
ae
Rept
iles
Mam
mal
s
Bird
s
Fung
i
Viru
s
Am
phib
ians
Note:1 Native species are Mexican species that have been translocated and become invasive. Exotic species are species non-native from Mexico.
Taxon
The Programme for the Conservation of Species at Risk (PROCER) aims to the recovery of species at risk. For each of the species included in PROCER, a Programme of Action for Species Conservation (PACE) is designed and executed, including strategies, activities and specific actions for the short-, mid- and long-term conservation, protection and recovery of wildlife populations. Currently, 45 species at risk are covered by PROCER, including sea turtles, jaguar, California condor and vaquita. Some of the major achievements of PROCER are the recovery of wild populations of the Mexican wolf, the golden eagle, the American bison and the Sonoran pronghorn.
Native
Exotic
400
350
300
250
200
150
100
50
0
Indi
vidu
als/
nest
(nu
mbe
r)
20
10
20
11
20
12
20
13
20
14
20
15
Population size of select species included in the PROCER programme
Sonoran pronghorn
Golden Eagle (nests)
American bison
Year
12
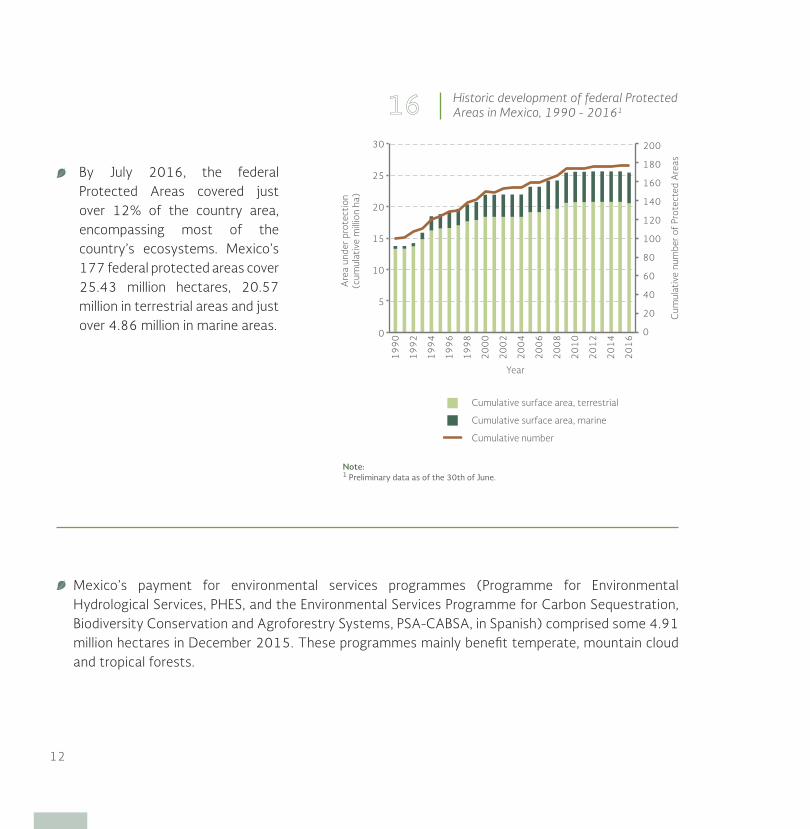
By July 2016, the federal Protected Areas covered just over 12% of the country area, encompassing most of the country’s ecosystems. Mexico’s 177 federal protected areas cover 25.43 million hectares, 20.57 million in terrestrial areas and just over 4.86 million in marine areas.
Historic development of federal Protected Areas in Mexico, 1990 - 20161
Are
a un
der p
rote
ctio
n (c
umul
ativ
e m
illio
n ha
)
30
25
20
15
10
5
0
Year
Cum
ulat
ive
num
ber o
f Pr
otec
ted
Are
as
200
180
160
140
120
100
80
60
40
20
0
Mexico’s payment for environmental services programmes (Programme for Environmental Hydrological Services, PHES, and the Environmental Services Programme for Carbon Sequestration, Biodiversity Conservation and Agroforestry Systems, PSA-CABSA, in Spanish) comprised some 4.91 million hectares in December 2015. These programmes mainly benefit temperate, mountain cloud and tropical forests.
Cumulative surface area, terrestrial
Cumulative surface area, marine
Cumulative number
19
90
19
92
19
94
19
96
19
98
20
00
20
02
20
04
20
06
20
08
20
10
20
12
20
14
20
16
Note:1 Preliminary data as of the 30th of June.

13
By June 2016, 12,649 Wildlife Conservation Management Units (UMAs in Spanish) were in operation, encompassing over 38.01 million hectares (about 19.3% of the country’s area). Among the UMAs in operation, 9 893 were devoted to free-ranging management and 2 756 to intensive management.
Historic development of the Wildlife Conservation Management Units (UMAs) in Mexico, 1999 - 20161
Cum
ulat
ive
num
ber o
f U
MA
s (t
hous
ands
)
14
12
10
8
6
4
2
0
19
99
20
00
20
01
20
02
20
03
20
04
20
05
20
06
20
07
20
08
20
09
20
10
20
11
20
12
20
13
20
14
20
15
20
16
Year
Number
Surface area
40
36
32
28
24
20
16
12
8
4
0
Cum
ulat
ive
surf
ace
area
in U
MA
s (m
illio
n ha
)
Note:1 Preliminary data as of the 30th of June.
Historic growth

14
A huge amount of substances derived from human activities are continuously released to the atmosphere. Although some of those may break down in the atmosphere, are deposited (on land or oceans) or become incorporated into biogeochemical cycles, the increasing emissions of pollutants have caused some of the major environmental problems we face today: depletion of the stratospheric ozone layer, climate change and poor air quality in urban areas.
Atmosphere
AIR QUALITY
According to the latest National Emissions Inventory, some 59 million tonnes of pollutants were emitted in 2008 at a national level. Emissions from natural sources accounted for 21% of the pollutants and those from anthropogenic sources for the remaining 79%. The largest volume of anthropogenic pollutants was emitted by mobile road sources (58%), followed by area sources (13%), stationary sources (7%) and non-road mobile sources (1%).
Natural sources21%
Stationary sources
7%
Area sources
13%
Mobile road sources
58%
Non-road mobile sources
1%
Anthropogenic sources
79%
Countrywide pollutants emissions per type of source

15
Until 2015, equipment for measuring air pollutants had been installed in 29 Mexican states, with a total of 243 monitoring stations.
Aguascalientes AMM Playas de RosaritoEnsenadaMexicaliTecateTijuanaCampecheTuxtla GutiérrezOjinagaChihuahuaJuárezTorreónAcuñaVilla de ÁlvarezLerdoGómez PalacioDurangoLeónSan Miguel de AllendeAbasoloCelayaCortazarDolores HidalgoIrapuatoSalamancaSan Francisco del RincónJuventino Rosas
123456789
10111213141516171819202122232425262728
7 6 53
70 12
1110
1617
13
62
84
83 82
18
9796
81 798059
85
41
53
7874
9
95
15
98
2
2719
2924
20
2521 26
562822
3023
47
41
35394238
100 90
5449
5150
48
88899291
87
40
3437
99
36
46
Metropolitan zone or town
SilaoVillagránAcámbaroMoroleónSan José Iturbide Zapotlán de JuárezPachuca de SotoAtitalaquiaAjacubaTepeji del Río de OcampoTepetitlánTlaxcoapanXochicoatlánTula de AllendeAtotonilco de TulaLolotlaHuichapanTepeapulcoMoreliaCuautlaCuernavacaOcuituco
29303132333435363738394041424344454647484950
Zacatepec de HidalgoTepicOaxaca de JuárezCuautlancingoPueblaQuerétaroCorregidoraEl MarquésSan Luis PotosíCuliacánGuasaveMazatlánAhomeSalvador AlvaradoGuaymasAgua PrietaHermosillo
5152535455565758596061626364656667
44
43
469 66
67
6571
6863 61
60
25
33
52
86
948
3132
93
NavojoaPuerto PeñascoNogalesCajemeSan Luis Río ColoradoBalancánHuimanguilloNacajucaParaísoTeapaCentroAltamiraCiudad MaderoEl ManteMatamorosReynosaNuevo Laredo
68 69707172737475767778798081828384
Note:1 Data as of October 2015.
Metropolitan zones or towns with air quality monitoring equipment in place, 20151
1
64
72
14
45
46
73
7576
77
55
5857
TampicoCiudad VictoriaTlaxcalaApizacoCalpulalpanHuamantlaSanta Cruz QuilehtlaIxtacuixtla de Mariano MatamorosMinatitlánXalapaMéridaGuadalupeZacatecasZMGZMVMZMVT
8586878889909192
93949596979899
100

16
Compliance with air quality standards in metropolitan zones and towns in Mexico, 2014
Metropolitan zone or town with
monitoring equipment in place
Locality with over 500 thousand
inhabitants without monitoring
equipment in place
PM1
0
PM2
.5
O3
SO2
NO
2
CO
EnsenadaMexicaliRosaritoTecateTijuanaChihuahua estatalChihuahua municipalCiudad JuárezZMVMTorreón estatalTorreón municipalColimaDurangoGómez PalacioLerdoZMVTCelayaIrapuatoLeónSalamancaSilaoSan Miguel de AllendeAbasoloVillagránCortazarJuventino RosasAcámbaro
123456789
101112131415161718192021222324252627
MoroleónSan Fco. del RincónAjacubaAtitalaquiaAtotonilcoTepeapulcoHuichapanTepetitlánTepeji del RíoTlaxcoapanTula de AllendePachucaTizayucaXochicoatlánLolotlaZMG MoreliaCuautlaOcuitucoCuernavacaZacatepec
28293031323334353637383940414243 4445464748
AMMOaxacaPueblaCorregidoraEl MarquésQuerétaroNuevo LaredoReynosaMatamorosVictoriaEl ManteTampicoMinatitlánXalapaMérida
495051525354555657585960616263
5 4 2
7
1514
10
55
56 57
13
59
60
50
63
12
43
49
2919
21 22
1823 20
2617
2425
44
41
3935
36
1651
47
4846
45
3730
9
31
40
42
32
1
58
62
2728
61
5453
52
6
11
8
34
3338
3
Baja California
Chihuahua
Cd. México
Coahuila
Colima
Durango
Edo. Mex.
Guanajuato
Guanajuato
Hidalgo
Jalisco
Michoacán
Morelos
Nuevo LeónOaxacaPuebla
Querétaro
Tamaulipas
Veracruz
Yucatán
In compliance
Not in compliance
Not applicable
Monitoring equipment for this pollutant is not available
Invalid data
Compliance with air quality standards
Criterion pollutant
PM1
0
PM2
.5
O3
SO2
NO
2
CO
Criterion pollutant
PM1
0
PM2
.5
O3
SO2
NO
2
CO
Criterion pollutant
Coahuila
GuerreroQuintana Roo
64
65
66
SaltilloAcapulco de JuárezBenito Juárez
646566

17
In 2014, the Mexican cities that failed to meet air quality standards for up to three criteria pollutants (PM10, PM2.5 and O3) were AMM (Nuevo Leon State), ZMG (Jalisco State), ZMVT (State of Mexico), MCMA (Mexico City, State of Mexico and Hidalgo State), Mexicali (Baja California State), Torreón and Lerdo (Coahuila State), Salamanca (Guanajuato State), Tepeapulco and Huichapan (Hidalgo State), Puebla City (Puebla State) and Minatitlán and Xalapa (Veracruz State).
Management Programmes to Improve Air Quality (ProAire) include specific actions to reduce and control emissions, focusing on the major emission sources. In June 2016 fourteen ProAire were in operation and six others under development. The ProAire currently in operation benefit some 66.7 million people.
ProAire programmes in place or under development, 2016
Chihuahua
Colima
Durango
Hidalgo (2014-2023)
Jalisco (2011-2020)
Mexicali (2011-2020)
Michoacán (2015-2024)
1234567
Nogales
Nuevo León
Puebla (2012-2020)
Salamanca-Celaya-Irapuato (2014-2022)
Tlaxcala (2014-2023)
Veracruz
ZML (2013-2022)
89
1011121314
186
514
17
1116
4 12
2010
15
19
2
3
8
1
9
13
7In place
Under development
ProAire programme
Towns or metropolitan zones
ZMO (2014-2023)
ZMQ-San Juan del Río (2014-2023)
ZMSLP-Soledad de Graciano Sánchez
(2013-2021)
ZMT (2012-2020)
ZMVM (2011-2020)
ZMVT (2012-2017)
151617
181920

18
According to the 2013 National Greenhouse Gas Emissions Inventory, total emissions in the country amounted to 665 Mt CO2e. Mobile sources, particularly road transport (26.2%), and power generation (19%) were the sectors that most contributed to total emissions. Second in importance were the industrial (17.3%), oil and gas (12.1%) and agriculture (12%) sectors. As for black carbon, in 2013 a total of 125.1 Gg were generated in the country. Mobile sources were the sector that contributed the most (37.8%), followed by industry (28.3%), mainly from bagasse burning in sugar mills, and the residential and trade (15.2%) sectors.
CLIMATE CHANGE
Countrywide emissions of greenhouse gases per sector, 2013

19
Like other countries, Mexico is already facing the impacts of climate change. The most important changes recently observed in the country include a temperature increase (0.85 °C on average over the last fifty years) and the rise in the sea level (which has reached between 1.79 and 9.16 mm/year in some parts of the Gulf of Mexico, and between 4.23 and 3.28 in the Pacific), as well as several impacts on biodiversity and changes in the patterns of extreme weather events.
1.5
1
0.5
0
-0.5
-1
Ano
mal
ies
with
resp
ect
to t
he
19
71
– 2
00
0 b
ase
perio
d (
0C
)
19
70
19
80
19
90
20
00
20
10
20
15
Note:1 The brown-coloured bar denotes the estimated anomaly for 2015.
Annual temperature anomalies, 1971 - 20151
Year

20
Sea level variations at select Mexican coastal locations
9. Progreso, Yucatán
1.5
1.4
1.3
1.2
1.1
19
52
19
56
19
60
19
64
19
68
19
72
19
76
19
80
19
84
2.45 mm/yr
8. Ciudad del Carmen, Campeche1.81.71.61.51.4
19
56
19
60
19
64
19
68
19
72
19
76
19
80
19
84
19
88
19
90
3.38 mm/yr
1.71.61.51.41.31.21.1
19
52
19
56
19
60
19
64
19
68
19
72
19
76
19
80
19
84
19
88
19
92
1.13 mm/yr
5. Salina Cruz, Oaxaca
1. Ensenada, Baja California
2
1.8
1.6
1.4
19
56
19
60
19
64
19
68
19
72
19
76
19
80
19
84
19
88
19
92
Met
res
2.73 mm/yr
3
2.8
2.6
2.4
2.2
19
52
19
56
19
60
19
64
19
68
19
72
19
76
19
80
19
84
19
88
19
92
2. Guaymas, Sonora
4.23 mm/yr
Met
res
2.4
2.2
2
1.8
1.6
19
54
19
58
19
62
19
66
19
70
19
74
19
78
19
82
19
84
3. Manzanillo, Colima
3.28 mm/yr
Met
res
4. Acapulco, Guerrero1.81.61.41.2
1
19
52
19
56
19
60
19
64
19
68
19
72
19
76
19
80
19
84
19
88
19
92
19
96
20
00
-2.44 mm/yr
Met
res
6. Ciudad Madero, Tamaulipas
2.2
2
1.8
1.6
19
62
19
64
19
66
19
68
19
70
19
72
19
74
19
76
19
78
19
79
9.16 mm/yr
7. Veracruz, Veracruz
1.6
1.4
1.2
19
52
19
58
19
64
19
70
19
76
19
82
19
88
19
94
20
00
20
06
1.89 mm/yr

21
Mexico stands out for its efforts to address global climate change. The passing and adoption of the General Law for Climate Change (2012), the National Climate Change Strategy Vision 10-20-40 and the Special Programme for Climate Change (PECC 2014-2018) are among the main examples.
In March 2015, the Mexican government submitted its Intended Nationally Determined Contribution (iNDC) for the period 2020-2030 to the United Nations Framework Convention on Climate Change. The mitigation goal for 2030 is to achieve a 22% reduction in GHG emissions and a 51% reduction in black carbon. It is anticipated that by 2024, 35% of the country’s energy generation will come from clean sources, and 43% by 2030. With regard to adaptation to climate change, the key goals are to achieve a 50% reduction in the number of vulnerable municipalities (160 municipalities) and a zero deforestation rate by 2030, as well as to install early warning and risk management systems at the three levels of government.
1 100
1 000
900
800
700
600
500
20
13
20
20
20
25
20
30
Year
Cou
ntry
wid
e G
HG
em
issi
ons
(Meg
aton
nes
of C
O2 e
quiv
alen
t)
Countrywide GHG emissions under the BAU scenario and reductions committed in the iNDC, 2013 - 2030
20
26
Mexico signed the Paris1 Agreement, a binding agreement in which all UNFCCC member countries participate and which, under the principle of equity and common but differentiated responsibilities, and according to their respective capabilities and in light of the different national circumstances, mainly seeks to: 1) contain the temperature increase well below 2 °C above pre-industrial levels, continuing the efforts to limit the increase to 1.5 °C; and 2) reach a global peak in greenhouse gas emissions as soon as possible and, thereafter, reduce them rapidly during the second half of this century.
Transport
Electricity
Residential
Oil and gas
Industry
Agriculture and livestock ranching
Solid waste
LULUCF
BAU
iNDC trajectory
Sector
1 Mexican Senate ratified the COP21 agreement on September 2016.

22
The maximum extension reached by the ozone hole in 2015 was 28.2 million square kilometers, or about 1.9 times the surface of Antarctica.
In Mexico, the consumption of ozone-depleting substances (SAO) decreased by around 98% between 1989 and 2015 (from 29 thousand to 610.2 tons).
Note: 1 No data available for the year 1995.
35
30
25
20
15
10
5
0
Max
imum
ext
ent
(mill
ion
km2)
Year1
19
79
19
81
19
83
19
85
19
87
19
89
19
91
19
93
19
96
19
98
20
00
20
02
20
04
20
06
20
08
20
10
20
12
20
14
20
15
Maximum extent of the Ozone hole, 1979 - 20151
STRATOSPHERIC OZONE
19
14
9
4
-1
Wei
ghte
d co
nsum
ptio
n (t
hous
and
wei
ghte
d to
nnes
)
Year
19
89
19
91
19
93
19
95
19
97
19
99
20
01
20
03
20
05
20
07
20
09
20
11
20
13
20
15
Note:1 Consumption is calculated as the sum of production plus imports minus exports.Consumption figures are negative when exports exceed production. Net consumption is weighted by the Ozone depletion potential of each substance.
Weighted1 countrywide consumption of Ozone-depleting substances, 1989 - 2015
CFC
Halons
Carbon Tetrachloride
Methyl Chloroform
CFC-13
HCFC
Methyl Bromide
Ozone-depleting substances

23
Water resources
Human activities are important direct and indirect stressors of the hydrological cycle. In a world characterized by a growing population with increasing economic means that allows greater access to more goods and services, the need to produce more food and energy and to supply larger volumes of water for the population and productive activities has significantly increased its demand and stresses its quality in natural reservoirs. The production and consumption of goods and services has increased not only the demand for water, but also wastewater generation, a significant proportion of which is discharged untreated into surface water bodies.

24
In 2015, 19.2% of Mexico’s renewable water resources were classified as bearing low stress; however 62.5% of the country´s area was under high or very high stress. The per-capita water availability has declined significantly: By 2015 it had decreased to only 20.8% of the availability recorded in 1950.
Water stress per hydrologic1 management region, 20152
I(79.8)
II(81.4)
VI(77.1)
VII(48.4)
VIII(44.8)
III(42.1)
IV(49.8) XI
(1.7)
XII(14.3)
IX(20.4)
X(5.9)
V(5.1)
XIII(138.7)
Hydrologic management regions (RHA): I Península de Baja California, II Noroeste, III Pacífico Norte, IV Balsas, V Pacífico Sur, VI Río Bravo, VII Cuencas Centrales del Norte, VIII Lerma-Santiago-Pacífico, IX Golfo Norte, X Golfo Centro, XI Frontera Sur, XII Península de Yucatán, XIII Aguas del Valle de México.
Notes:1 Water stress is an indicator of the long-term sustainability of the use of water resources. It is calcu-lated as the amount of water resources withdrawn for consumptive uses expressed as a percentage of the mean renewable water resources.2 Figures in parentheses are the water stress values.
No stress (<10%)
Low (10%-20%)
Medium (20%-40%)
High (40%-100%)
Very high (>100%)
Water stress

25
Mexico faces serious and growing aquifer overexploitation issues. Thirty two of the country’s aquifers were overexploited in 1975, but this figure grew to 105 in 2015 (16% of the 653 aquifers recorded in Mexico), most of them located in the central and southwest hydrological regions and the Baja California peninsula.
Condition of Mexican aquifers, 2015
Hydrologic management regions (RHA): I Península de Baja California, II Noroeste, III Pacífico Norte, IV Balsas, V Pacífico Sur, VI Río Bravo, VII Cuencas Centrales del Norte, VIII Lerma-Santiago-Pacífico, IX Golfo Norte, X Golfo Centro, XI Frontera Sur, XII Península de Yucatán, XIII Aguas del Valle de México.
I
II
IV
V
VI
VII
VIII
IX
XXI
XII
XIII
III
Overexploited
Seawater intrusion
Soil salinization and brackish water
Overexploited with soil salinization
Overexploited with seawater intrusion
Overexploited with seawater intrusion, soil salinization and brackish water
Aquifer condition

26
Notes:1 The volume under concession is linked to the location of the concession title rather than to the site where water is used.2 Agricultural uses include agriculture, livestock ranching, aquaculture, multiple use and other uses as per the REPDA classification.3 Public supply includes urban public use and residential use, as per the REPDA classification.4 Industrial uses include industry, agroindustry, services and commercial use as per the REPDA classification, in addition to water used for electricity generation (in thermal power plants, but not in hydro power plants in which the use of water is not consumptive).
70
60
50
40
30
20
10
0Volu
men
de
agua
con
cesi
onad
o (m
iles
de h
m3)
Volume of water under concession1 per sector, 2001 - 2015
20
01
20
02
20
03
20
04
20
05
20
06
20
07
20
08
20
09
20
10
20
11
20
12
20
13
20
14
20
15
Año
A high percentage of the sites where surface water quality is monitored complies with water pollution regulations. In 2015, 92.5%, 67.6% and 93.3% of the sites included in the monitoring network for surface water quality showed values below the maximum limits set in the standards for biochemical oxygen demand (BOD5), chemical oxygen demand (COD) and total suspended solids (TSS), respectively.
Agriculture is the sector that imposes the greatest pressure on Mexico’s water resources, compared to the industrial and household sectors. In 2015, about 76.3% of the water conceded was allocated to agricultural activities, followed by public supply (14.6%), and industrial uses and electric power generation (which jointly accounted for just over 9.1%).
Agriculture2
Public supply3
Industry4
Sector

27
100
90
80
70
60
50
40
30
20
10
0
Drinking water supply and sanitation services have increased significantly their nationwide coverage, but with gaps in rural areas. In 2015 drinking water supply and sanitation services reached 95.3% and 92.8% of the country’s total population, respectively; however, their coverage was 97.79% and 97.39% of the population in urban areas, and 86.9% and 77.5% of the rural population.
Notes:1 Includes all the occupants of inhabited private houses with access to piped water in the house or in the plot, to water from a public faucet or from another house, as a percentage of the total number of occupants of inhabited private houses in rural or non-rural zones.2 Includes discharges to a sewer, septic tank or improved-pit aerated latrine.
Coverage of sanitation services2, 1990 - 2015
Popu
latio
n w
ith a
cces
s to
san
itatio
n se
rvic
es (
%)
Coverage of drinking water supply services, 1990 - 2015
Popu
latio
n w
ith a
cces
s to
drin
king
wat
er (
%)
Year
Urban Rural Total
100
90
80
70
60
50
40
30
20
10
0
1990 1995 20052000 2010 2015
Urban Rural Total

28
Wastewater treatment is still insufficient in Mexico. Although the volume of municipal wastewater that was treated compared to the total volume generated in 2014 was 155% higher than that in 1998, it only accounted for 49% of the wastewater generated that year. Only about 31% of the volume of industrial wastewater generated in 2014 was treated.
Wastewater treatment with respect to the total volume generated, 1998 - 2014
50
45
40
35
30
25
20
15
10
5
0
Volu
me
trea
ted
with
resp
ect
to t
otal
vo
lum
e ge
nera
ted
(%
)
19
98
19
99
20
00
20
01
20
02
20
03
20
04
20
05
20
06
20
07
20
08
20
09
20
10
20
11
20
12
20
13
20
14
Year
Municipal TotalIndustrial
Source

29
The generation and management of solid waste have important consequences for the environment and public health. Integrated waste management seeks to reduce the generation and achieve the proper disposal of solid waste; in addition, it can also contribute to reduce the extraction of resources and the consumption of water and energy needed to produce them, as well as the emission of greenhouse gases. All this is accompanied by major economic, social and environmental benefits.
In 2015, the average estimated generation of Municipal Solid Waste (MSW) in Mexico was 1.2 kg per capita, for a total generation of 53.1 million tons countrywide; this is a 61.2% increase with respect to the generation recorded in 2003. MSW generation in Mexico is strongly correlated with private final consumption expenditure and GDP.
Estimated MSW generation, Gross Domestic Product (GDP) and Household Final Consumption Expenditure, 2003 - 2015
16
14
12
10
8
6
4
2
0
Hou
seho
ld F
inal
Con
sum
ptio
n Ex
pend
iture
and
GD
P (t
rillio
n M
exic
an p
esos
at
20
08
con
stan
t pr
ice) 50
45
40
35
30
25
20
15
10
5
0
MSW
gen
erat
ion
(mill
ion
tonn
es)
20
03
20
04
20
05
20
06
20
07
20
08
20
09
20
10
20
11
20
12
20
13
20
14
20
15
Year
Household Final Consumption Expenditure
GDP
MSW generation
Solid waste and hazardous waste

30
In 2013, 74.5% of the total MSW generated in the country was disposed of in landfills and controlled dumps. This is an 82.7% increase compared to 1997, when only 40.7% of the total MSW were properly disposed of. In 2013, 21% of the MSW generated was disposed of in uncontrolled dumps and the remaining 5% was recycled.
According to the Ministry of the Environment (SEMARNAT), the 93 355 companies registered in its National Registry of Hazardous Waste Generators (PGRP) produced 2.19 million tons of hazardous waste (HW) between 2004 and 2014. The industries that contributed the highest amounts of HW were the chemical (15.7% of the total amount generated), automotive (14.4%), metallurgy (14.1%) and the petroleum and petrochemical (10.3%) industries.
Between 1999 and 2014, the facilities licensed to manage HW in Mexico had an installed capacity of just over 21.07 million tons, 46.4% of which corresponded to treatment, 45% to recycling, 5% to confinement, 2.5% to reuse and 1.1% to incineration.
100
90
80
70
60
50
40
30
20
10
0
MSW
dis
pose
d of
with
resp
ect
to
the
tota
l gen
erat
ed (
%)
19
97
19
98
19
99
20
00
20
01
20
02
20
03
20
04
20
05
20
06
20
07
20
08
20
09
20
10
20
11
20
12
20
13
Year
Final disposal of MSW with respect to the total generated1, 1997 - 2013
Note:1 The percentages do not add up to 100% because a small fraction of MSW is recycled before disposal.
Sanitary landfill
Controlled dumps
Uncontrolled dumps
Sites of final disposal

31
SOURCES
Population and the environment
Conapo. Proyecciones de la población de México 2010-2050 y estimaciones 1990-2009. Conapo. México. 2013.Conapo. Situación demográfica de México 2010. Conapo. México. 2010.
Prepared by the authors with data from:Coneval. Anexo Estadístico de Pobreza en México. Conapo. México. 2015. Available in: www.coneval.gob.mx/. Accessed on: July 2015.
Prepared by the authors with data from: From1961 to 2007: http://storymaps.esri.com/globalfootprint/. Accessed on: April 2015.WWF. Informe Planeta Vivo 2012. Biodiversidad, biocapacidad y propuestas de futuro. WWF, Global Footprint Network y ZSL Living Conservation. 2014.WWF. Informe Planeta Vivo 2014. Especies y espacios, personas y lugares. WWF, Global Footprint Network y ZSL LivingConservation. 2014Global Footprint Network. National Footprint Account Results (2015 Edition). Available in: http://footprintnetwork.org/en/index.php/GFN/page/public_data_package. Accessed on: April 2015.
Prepared by the authors with data from:Dirección General de Estadística e Información Ambiental (DGEIA), Semarnat. México. 2010.Conagua. PTAR (Plantas de Tratamiento de Aguas), Residuos (a cielo abierto, controlados y rellenos sanitarios), Salinas artificiales, Minas y otras ubicaciones geológicas escala 1: 50,000 y 1: 250,000. Conagua. México. 2010.DGPAIRS. Acuicultura, escala 1: 250 000, 2010. Semarnat. México. 2010.INAH. Rasgos Arqueológicos, escala 1: 50,000: (INAH_ARQUE50). INAH. México. 2010.INEGI, SCT e IMT. Red Nacional de Caminos (RED), escala 1: 50,000. INEGI, SCT e IMT. México. 2010.INEGI. Carta de Uso del Suelo y Vegetación Serie V (2011), escala 1: 250 000. INEGI. México. 2013INEGI. Marco Geoestadístico Nacional, 1: 50 000: ITER_2010, TOPO_Urbano, TOPO_Industria, TOPO_Energía. 2010, TOPO_Vías_Férreas. INEGI. México. 2010.
Elaboracion propia con datos de:INEGI. Sistema de Cuentas Nacionales de México. Cuentas Económicas y Ecológicas de México 2014. Preliminar. Año base 2008. INEGI.México.
Terrestrial ecosystems
Prepared by the authors with data from:INEGI. Carta de Uso del Suelo y Vegetación Serie I (1968-1986), escala 1: 250 000. INEGI. México. 2003.INEGI. Carta de Uso del Suelo y Vegetación Serie II (Reestructurada) (1993), escala 1: 250 000. INEGI. México. 2004.INEGI. Carta de Uso del Suelo y Vegetación Serie III (2002), escala 1: 250 000 (Continuo Nacional). INEGI. México. 2005.INEGI. Carta de Uso del Suelo y Vegetación Serie IV (2007), escala 1: 250 000. INEGI. México. 2011.INEGI. Carta de Uso del Suelo y Vegetación Serie V (2011), escala 1: 250 000. INEGI. México. 2013.

32
Dirección General de Gestión Forestal y de Suelos. Delegaciones Federales, Semarnat. México. 2007-2010. Dirección General de Gestión Forestal y de Suelos. Delegaciones Federales, Semarnat. México. 2006-2015. SARH. Compendio Estadístico de la Producción Forestal 1989-1993. SARH. México. 1994.Semarnap. Anuario Estadístico de la Producción Forestal 1995-1998. Semarnap. México. 1996-1999.Semarnat. Anuario Estadístico de la Producción Forestal 1999-2006. Semarnap. México. 2000-2007.Semarnat. Programa Anual de trabajo 2016. Semarnap. México. 2016.Semarnat. Cuarto Informe de Labores 2015-2016. Semarnat. México. 2016.
Prepared by the authors with data from: Conafor, Semarnat. México. 2015Conanp, Semarnat. México. 2015.Dirección General de Vida Silvestre, Semarnat. México. 2015.Semarnat. Programa anual de trabajo 2016. Semarnat. México. 2016.Semarnat. Cuarto Informe de Labores 2015-2016. Semarnat. México. 2016.
Soils
Prepared by the authors with data from: Semarnat y CP. Evaluación de la degradación del suelo causada por el hombre en la República Mexicana, escala 1: 250 000. Memoria Nacional 2001-2002. Semarnat, CP. México. 2003.
Prepared by the authors with data from: Semarnat y CP. Evaluación de la degradación del suelo causada por el hombre en la República Mexicana, escala 1: 250 000. Memoria Nacional 2001-2002. Semarnat y CP. México. 2003.
Prepared by the authors with data from: Conafor, Semarnat y UACh. Línea Base Nacional de Degradación de Tierras y Desertificación. Informe Final y Anexos I y II. Conafor, UACh. 2013.
Prepared by the authors with data from:Dirección General de Gestión Forestal y de Suelos, Subsecretaría de Gestión para la Protección Ambiental, Semarnat. México. Junio de 2015.Gerencia de Suelos, Conafor, Semarnat. México. Junio de 2015.
Biodiversity
Prepared by the authors with data from:DOF. NOM-059-SEMARNAT-2010. Diario Oficial de la Federación. México. 2010 (30 de diciembre).
Conabio. Sistema de información sobre especies invasoras en México. Conabio. México. 2016.
Conanp, Semarnat. Programa de Conservación de Especies en Riesgo (Procer) 2011-2015. Conanp, Semarnat. México. 2015.
Dirección de Evaluación y Seguimiento. Conanp, Semarnat. México. 2015.
Subsecretaría de Gestión y Protección Ambiental, Dirección General de Vida Silvestre, Semarnat. México. 2015.Semarnat. Cuarto Informe de Labores 2015-2016. Semarnat. México. 2016.

33
Atmosphere
Air quality
Semarnat. Inventario Nacional de Emisiones de México 2008. Semarnat. México. 2013.
Dirección de Investigación sobre la Calidad del Aire y los Contaminantes de Vida Corta, INECC, México. Datos a octubre de 2015.
INECC y Semarnat. Informe Nacional de Calidad del Aire 2014, México. INECC, Semarnat. México. 2015.
Semarnat. Cuarto Informe de Labores 2015-2016. Semarnat. México. 2016.Semarnat. Programas de Gestión de la Calidad del Aire. México. 2016. Available in: www.gob.mx/semarnat/acciones-y-programas/programas-de-gestion-para-mejorar-la-calidad-del-aire?idiom=es. Accessed on: September 2016.
Climate change
INECC y Semarnat. Primer Informe Bienal ante la Convención Marco de las Naciones Unidas sobre el Cambio Climático. INECC, Semarnat. México. 2015.
Conagua. Reporte del Clima en México. Reporte Anual 2015. Conagua. México. 2015.
INE, Semarnat y UNAM. Evaluación regional de la vulnerabilidad actual y futura de la zona costera mexicana y los deltas más impactados ante el incremento del nivel del mar debido al calentamiento global y fenómenos hidrometeorológicos extremos. INE, Semarnat. México. 2008.
Semarnat. Compromisos de mitigación y adaptación ante el cambio climático para el periodo 2020-2030. Semarnat. México. 2015.
Stratospheric Ozone
NASA. Ozone Hole Watch. Annual Records. 2015. Available in: http://ozonewatch.gsfc.nasa.gov/meteorology/annual_data.html. Accessed on: May 2016. Semarnat. Subsecretaría de Gestión para la Protección Ambiental. Unidad de Protección a la Capa de Ozono. Semarnat. México. 2016.
Water resources
SINA, Conagua, Semarnat. Agua renovable. Available in: http://201.116.60.25/sina/index_jquery-mobile2.html?tema=aguaRenovable. Accessed on: September 2016.
Conagua, Semarnat. Estadísticas del Agua en México. Edición 2015. Conagua, Semarnat. México. 2015. SINA, Conagua, Semarnat. Condición de los acuíferos. Available in: http://201.116.60.25/sina/Default4.aspx?tab=47. Accessed on: September 2016.
CNA, Semarnat. Estadísticas del Agua en México. Ediciones 2002, 2003, 2004. México. 2002, 2003, 2004.Conagua, Semarnat. Estadísticas del agua en México. Síntesis 2005. Conagua, Semarnat. México. 2005.Conagua, Semarnat. Estadísticas del Agua en México. Ediciones 2006-2008, 2010, 2011, 2013-2015. México, 2006 - 2008, 2010, 2011, 2014 y 2015.SINA, Conagua, Semarnat. Usos del agua. Available in: http://201.116.60.25/sina/Default4.aspx?tab=47. Accessed on: September 2016.
34
Prepared by the authors with data from:Conagua, Semarnat. Estadísticas del Agua en México. Edición 2015. Conagua, Semarnat. México. 2015.Conagua, Semarnat. Situación del Subsector Agua Potable, Drenaje y Saneamiento Edición 2015. Conagua, Semarnat. México. 2015INEGI. Censo de Población y Vivienda 1990, 2000 y 2010. INEGI. México. 1990, 2000 y 2010.INEGI. Conteos de Población y Vivienda 1995 y 2005. INEGI. México. 1995 y 2005.INEGI. Encuesta Intercensal 2015. Tabulados. INEGI. México. 2015.SINA, Conagua, Semarnat. Agua potable y alcantarillado. Available in: http://201.116.60.25/sina/Default4.aspx?tab=47. Accessed on: September 2016.
Prepared by the authors with data from:Conagua, Semarnat. Estadísticas del Agua en México. Edición 2010. México, 2010.Conagua, Semarnat. Situación del Subsector Agua Potable, Alcantarillado y Saneamiento. Ediciones 1998-2013. México. 1998-2013.Conagua, Semarnat. Situación del Subsector de Agua Potable, Drenaje y Saneamiento. Edición 2015. México. 2015.Gerencia de Saneamiento y Calidad del Agua, Conagua, Semarnat. agosto de 2013.Semarnap, INEGI. Estadísticas del Medio Ambiente 1999. México. 2000.SINA, Conagua, Semarnat. Aguas residuales. Available in: http://201.116.60.25/sina/Default4.aspx?tab=47. Accessed on: September 2016.
Solid waste and hazardous waste
Dirección General de Equipamiento e Infraestructura en Zonas Urbano-Marginadas, Sedesol. México. 2013. INEGI. Sistema de Cuentas Nacionales de México. Banco de Información Económica. INEGI. México. 2015. Available in: http://www.inegi.org.mx/est/contenidos/proyectos/cn/. Accessed on: December 2015.Presidencia de la República. Tercer Informe de Gobierno 2014-2015. Anexo Estadístico. Presidencia de la República. México. 2015.
Dirección General de Equipamiento e Infraestructura en Zonas Urbano-Marginadas, Sedesol. México. 2013.INEGI. Anuario estadístico y geográfico de los Estados Unidos Mexicanos 2015. INEGI. México. 2015.

One hundred copies of the Executive Summary.
State of the Environment Report México Edition 2015.
Compendium of Environment Statistics,
Key Environmental Indicators, Environmental Performance
Indicators and Green Growth Indicators
were printed in December 2016
at Lobal Impresores.
Lago Atitlán 36, Col. Pénsil, Miguel Hidalgo
C.P. 11430, Mexico City, Mexico.
Content is responsibility of
the General Direction of Environmental
Information and Statistics of the Ministry of
the Environment and Natural Resources (SEMARNAT, Mexico).
