metsÄ board...metsÄ board annual report 2017 3 continued growth metsä board’s target is...
TRANSCRIPT
METSÄ BOARDANNUAL REPORT 2017
ME
TS
Ä B
OA
RD
AN
NU
AL R
EP
OR
T 2
017

The MetsäBoard Prime FBB Bright folding boxboard used for the cover of this annual report is manufactured at Metsä Board’s Äänekoski mill. The surface layers of the three-layer folding boxboard are made from chemical pulp from Metsä Fibre’s Äänekoski bioproduct mill, and the high-yield pulp of the middle layer is manufactured at Metsä Board’s Joutseno mill. MetsäBoard Prime FBB Bright is made from pure fresh fi bre. It is a fully coated paperboard, suitable for packaging and graphical end uses. The other raw materials come from reliable suppliers who comply with Metsä Group’s Supplier Code of Conduct and Sustainability Principles.
METSÄ BOARD IS A GROWTH COMPANYYear 2017 was Metsä Board’s fi rst full year as a pure-play paperboard company. It was also a year of strong growth – paperboard deliveries grew by 15 per cent from the previous year and amounted to approximately 1.8 million tonnes.
SELF-SUFFICIENCY IN PULP ENABLES THE GROWTH OF THE PAPERBOARD BUSINESS
Metsä Board’s annual pulp surplus is more than 500,000 tonnes.
INCREASING RESPONSIBILITY REQUIREMENTS FAVOUR FRESH FIBRE PAPERBOARD
Packaging is subject to increas-ingly strict requirements in terms of eco-friendliness, recyclability and purity. Fresh fi bre paperboard meets all these requirements.
Read more p. 10

METSÄ BOARD ANNUAL REPORT 2017 1
CONTENTS
Metsä Fibre Annual Review2017
Metsä Group Financial Statements2017
Metsä Group Sustainably from the forest
Metsä Board Annual Report2017
2 CEO’s review4 Highlights of 20176 Strategy8 Operating environment and markets10 Better with Less12 Sustainability16 Personnel18 Financial statements
PUBLISHED BY: Metsä Board Corporation, [email protected]ä Board’s annual report is published in Finnish and English. The publication is available in PDF format at year2017.metsaboard.com
KEY FIGURES2017 2016
Sales, EUR million 1,848.6 1,720.3
EBITDA, comparable, EUR million 289.1 231.1
- % of sales 15.6 13.4
Operating result, comparable, EUR million 193.5 137.5
- % of sales 10.5 8.0
Result before taxes, comparable, EUR million 157.2 106.8
- % of sales 8.5 6.2
Result for the financial year, comparable, EUR million 137.5 93.6
Earnings per share, comparable, EUR 0.39 0.26
Shareholders’ equity per share, EUR 3.28 2.96
Dividend per share, EUR 0.211) 0.19
Gross investments, EUR million 65.4 162.4
Net cash flow from operations, EUR million 236.3 77.0
Interest-bearing net liabilities at the end of the period, EUR million 358.4 463.8
Interest-bearing net liabilities / EBITDA, comparable 1.2 2.0
Return on capital employed, comparable, % 11.2 8.1
Return on equity, comparable, % 12.4 9.0
Equity ratio at the end of the period, % 52.6 48.2
Net gearing ratio at the end of the period, % 31 44
Market capitalisation of shares on 31 Dec, EUR million 2,540 2,416
Personnel at the end of the period 2,351 2,466
Paperboard deliveries, 1,000 t 1,803 1,607
Market pulp deliveries, 1,000 t 515 500
1) The Board’s proposal to the Annual General Meeting.
VARYING CONSUMPTION PATTERNS ARE INCREASING THE DEMAND FOR FOOD AND FOOD SERVICE PACKAGING
Fresh fibre paperboard, which is made from a renewable raw material, enjoys a strong position, particularly in the growing food packaging market.
ANNUAL GROWTH OF THE GLOBAL FOOD AND FOOD SERVICE PACKAGING MARKET APPROXIMATELY
3–5%
Read more p. 10
STRONG POSITION IN A GROWING MARKET
Metsä Board focuses on paperboard grades with the strongest growth. Metsä Board is Europe’s largest producer of folding boxboard and white kraftliner.
IN 2016–2017, METSÄ BOARD’S PAPERBOARD DELIVERIES GREW BY
15% Read more p. 8
The MetsäBoard Prime FBB Bright folding boxboard used for the cover of this annual report is manufactured at Metsä Board’s Äänekoski mill. The surface layers of the three-layer folding boxboard are made from chemical pulp from Metsä Fibre’s Äänekoski bioproduct mill, and the high-yield pulp of the middle layer is manufactured at Metsä Board’s Joutseno mill. MetsäBoard Prime FBB Bright is made from pure fresh fi bre. It is a fully coated paperboard, suitable for packaging and graphical end uses. The other raw materials come from reliable suppliers who comply with Metsä Group’s Supplier Code of Conduct and Sustainability Principles.
METSÄ BOARD IS A GROWTH COMPANYYear 2017 was Metsä Board’s fi rst full year as a pure-play paperboard company. It was also a year of strong growth – paperboard deliveries grew by 15 per cent from the previous year and amounted to approximately 1.8 million tonnes.
SELF-SUFFICIENCY IN PULP ENABLES THE GROWTH OF THE PAPERBOARD BUSINESS
Metsä Board’s annual pulp surplus is more than 500,000 tonnes.
INCREASING RESPONSIBILITY REQUIREMENTS FAVOUR FRESH FIBRE PAPERBOARD
Packaging is subject to increas-ingly strict requirements in terms of eco-friendliness, recyclability and purity. Fresh fi bre paperboard meets all these requirements.
Read more p. 10
METSÄ GROUPFINANCIAL STATEMENTS 2017
ME
TSÄ
GR
OU
P FIN
AN
CIA
L STAT
EMEN
TS 2
017
METSÄ GROUPSUSTAINABLY FROM THE FOREST
METSÄ GROUPSUSTAINABILITY REPORT 2017
ME
TS
Ä G
RO
UP
SU
STA
INA
BILIT
Y R
EP
OR
T 2
017
METSÄ FIBREANNUAL REVIEW 2017
METSÄ BOARDANNUAL REPORT 2017
ME
TS
Ä B
OA
RD
AN
NU
AL R
EP
OR
T 2
017
Metsä Group Sustainability Report2017
YEAR 2017
REPORT OF THE BOARD OF DIRECTORS
GROUP ACCOUNTS
SHARES AND SHAREHOLDERS
PARENT COMPANY ACCOUNTS
AUDITOR’S REPORT
GOVERNANCE KEY FIGURES
INVESTOR INFORMATION
CEO’S REVIEW | HIGHLIGHTS OF 2017 | STRATEGY | OPERATING ENVIRONMENT AND MARKETS | BETTER WITH LESS | SUSTAINABILITY | PERSONNEL

2 METSÄ BOARD ANNUAL REPORT 2017
CEO’S REVIEW
DEAR READER,After completing the restructuring, 2017 was Metsä Board’s first full year as a pure-play paperboard com-pany. In line with our strategy, we are focusing on the production of premium lightweight fresh fibre paper-boards. Through Husum mill’s new folding boxboard capacity, we are well positioned to meet the growing global demand for fresh fibre paperboards. In 2017, our total paperboard deliveries grew from the previ-ous year, and our profitability improved markedly.
MEGATRENDS SUPPORT GROWING DEMAND FOR FRESH FIBRE PAPERBOARDDemand for packaging materials made from fresh fibre paperboard is supported by strong megatrends, such as population growth and urbanisation, as well as the increasing requirements for recyclable, resource-efficient and safe packaging materials. More and more, fresh fibre paperboard is being used to replace plastic and recycled paperboard, particularly in food and food service packaging.
Demand for fresh fibre paperboards grew glob-ally in 2017, and price levels in local currencies increased. Metsä Board also announced paperboard price increases in 2017.
WE ARE WELL POSITIONED TO MEET THE GROWING GLOBAL DEMAND FOR FRESH FIBRE PAPERBOARDS.
TARGET IS TO CONTINUE PROFITABLE GROWTH
YEAR 2017
REPORT OF THE BOARD OF DIRECTORS
GROUP ACCOUNTS
SHARES AND SHAREHOLDERS
PARENT COMPANY ACCOUNTS
AUDITOR’S REPORT
GOVERNANCE KEY FIGURES
INVESTOR INFORMATION
CEO’S REVIEW | HIGHLIGHTS OF 2017 | STRATEGY | OPERATING ENVIRONMENT AND MARKETS | BETTER WITH LESS | SUSTAINABILITY | PERSONNEL

METSÄ BOARD ANNUAL REPORT 2017 3
CONTINUED GROWTH Metsä Board’s target is profitable growth exceeding the average market growth. In 2017, our paperboard deliveries grew by 15 per cent from the previous year. As expected, Husum’s folding boxboard was the most significant growth factor, but our white kraftliner deliveries were also on a higher level than last year.
Five out of our eight mills, Tako, Husum, Simpele, Kaskinen and Joutseno, set new annual production records. The average price of fold-ing boxboard was burdened by the geographical sales mix of folding boxboard from Husum especially in the first half of the year. However, the situation improved towards the end of the year, and paperboard deliveries to the Americas grew. The strong pulp market and higher-than-expected pulp prices supported our profitability throughout the year.
In April, we started a new extrusion coating line at the Husum mill in Sweden. The line produces PE-coated paperboards suitable for food and food service packaging. We are now well positioned to serve the global food service packaging market through better product availabil-ity and competitive quality.
The new bioproduct mill of Metsä Fibre, our associated company, started up in August according to plan, in an excellent market situation. At the end of the year, its production was at a higher level than expected, and its customer deliveries were off to a good start.
Our cash flows from operations grew substantially in 2017, and we have a strong balance sheet. In the autumn, we issued a ten-year bond. The bond was oversubscribed, which reflects the loan market’s strong confidence in Metsä Board’s future.
RESPONSIBILITY AND SUSTAINABILITY AT THE CORE OF OUR OPERATIONS Sustainability and responsible business operations are integral parts of our operations. Sustainability and responsibility must begin with senior management, to ensure commitment throughout the organisation. In 2017, we again received wide recognition for our sustainability prac-tices, from CDP and EcoVadis, among other parties. Ensuring well-being and safety at work is particularly important for us, and our invest-ment in these aspects has produced visible and tangible results. We have
a low employee turnover rate and our accident frequency rate has decreased year on year.
As part of operational development we renewed our key marketing messages and harmonised our product and service portfolio. This strengthens our market position as a company focusing on premium, lightweight paperboards. With our ‘Better with Less’ concept, we aim to promote packaging solutions that create better consumer experiences with less environmental impact. The increasing environmental and product safety requirements and the growing emphasis on the appear-ance of packaging are driving demand for premium, lightweight, sus-tainably produced packaging materials. Metsä Board’s paperboards bring all these qualities together. Our products are complemented by three service areas: packaging analysis and design, availability services and technical expertise and R&D. The aim is to jointly with customers develop lighter and more efficient packaging solutions.
A CLEAR DIRECTION FOR THE FUTUREOur vision is to be the preferred supplier of premium paperboards creat-ing value for customers globally. This gives us a clear future direction. We want to continue to develop our products and services in line with our customers’ needs, and we want to respond profitably to the growing market demand. Our highly competent employees, clear strategy and strong financial position make me confident in Metsä Board’s future development.
I would like to extend my thanks to our customers, employees, shareholders and other stakeholders for the past year.
Mika JoukioCEO
YEAR 2017
REPORT OF THE BOARD OF DIRECTORS
GROUP ACCOUNTS
SHARES AND SHAREHOLDERS
PARENT COMPANY ACCOUNTS
AUDITOR’S REPORT
GOVERNANCE KEY FIGURES
INVESTOR INFORMATION
CEO’S REVIEW | HIGHLIGHTS OF 2017 | STRATEGY | OPERATING ENVIRONMENT AND MARKETS | BETTER WITH LESS | SUSTAINABILITY | PERSONNEL
4 METSÄ BOARD ANNUAL REPORT 2017
AMONG THE BEST OF THE BEST Metsä Board was once again
recognised by CDP for its
responsible water use and
measures aiming to curb
climate change. Metsä Board
made it again to CDP’s Cli-
mate A list and Water A list.
Metsä Board also achieved
Leadership status in CDP’s
Forest programme.
CDP is a non-profit, global environmental
disclosure platform.
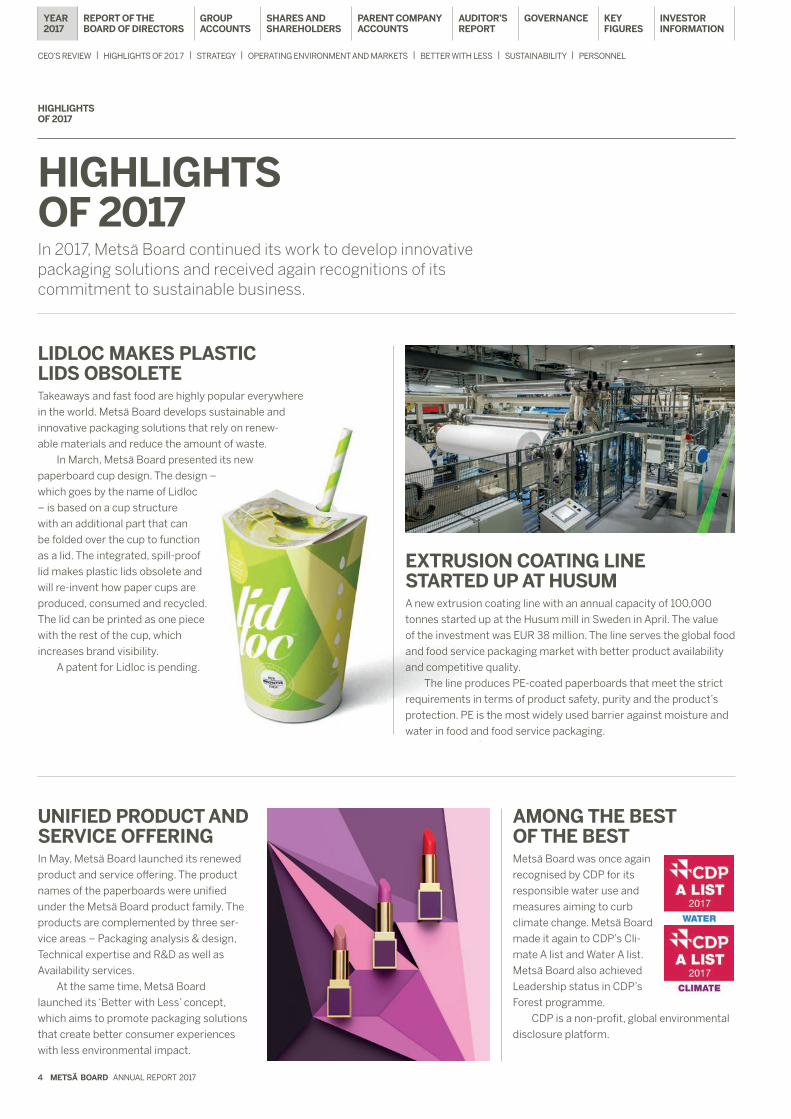
LIDLOC MAKES PLASTIC LIDS OBSOLETETakeaways and fast food are highly popular everywhere
in the world. Metsä Board develops sustainable and
innovative packaging solutions that rely on renew-
able materials and reduce the amount of waste.
In March, Metsä Board presented its new
paperboard cup design. The design –
which goes by the name of Lidloc
– is based on a cup structure
with an additional part that can
be folded over the cup to function
as a lid. The integrated, spill-proof
lid makes plastic lids obsolete and
will re-invent how paper cups are
produced, consumed and recycled.
The lid can be printed as one piece
with the rest of the cup, which
increases brand visibility.
A patent for Lidloc is pending.
UNIFIED PRODUCT AND SERVICE OFFERING In May, Metsä Board launched its renewed
product and service offering. The product
names of the paperboards were unified
under the Metsä Board product family. The
products are complemented by three ser-
vice areas – Packaging analysis & design,
Technical expertise and R&D as well as
Availability services.
At the same time, Metsä Board
launched its ‘Better with Less’ concept,
which aims to promote packaging solutions
that create better consumer experiences
with less environmental impact.
EXTRUSION COATING LINE STARTED UP AT HUSUMA new extrusion coating line with an annual capacity of 100,000
tonnes started up at the Husum mill in Sweden in April. The value
of the investment was EUR 38 million. The line serves the global food
and food service packaging market with better product availability
and competitive quality.
The line produces PE-coated paperboards that meet the strict
requirements in terms of product safety, purity and the product’s
protection. PE is the most widely used barrier against moisture and
water in food and food service packaging.
HIGHLIGHTS OF 2017
HIGHLIGHTS OF 2017In 2017, Metsä Board continued its work to develop innovative packaging solutions and received again recognitions of its commitment to sustainable business.
YEAR 2017
REPORT OF THE BOARD OF DIRECTORS
GROUP ACCOUNTS
SHARES AND SHAREHOLDERS
PARENT COMPANY ACCOUNTS
AUDITOR’S REPORT
GOVERNANCE KEY FIGURES
INVESTOR INFORMATION
CEO’S REVIEW | HIGHLIGHTS OF 2017 | STRATEGY | OPERATING ENVIRONMENT AND MARKETS | BETTER WITH LESS | SUSTAINABILITY | PERSONNEL

METSÄ BOARD ANNUAL REPORT 2017 5
GOLD-LEVEL RATINGIn May, Metsä Board achieved EcoVadis Gold
rating for its sustainability practices. Metsä
Board was rated among the top 1 per cent in
all categories covered by EcoVadis’s supplier
evaluation.
EcoVadis operates a reporting platform
allowing companies globally to assess the
environmental and social performance of its
suppliers.
There are four assessment criteria: the
environment, labour practices, sustainable
purchasing and fair business practices.
#BETTERWITHLESS In November, Metsä Board launched a pack-
aging design competition that challenges
designers to create more environmentally
friendly solutions. The Better with Less –
Design Challenge invites designers and
students to develop smarter, lighter and
better packaging solutions while reducing
their environmental impact.
The competition runs from 6 November
2017 to 31 March 2018 at www.betterwithless.
org. New packaging solutions are being
sought for the most common consumer
packages, such as takeaway meals,
e-commerce, wellness, cosmetics and dry
food packages. The jury is composed of an
international group of branding and
packaging design experts.
The competition can be followed on
social media with the hashtag
#betterwithless.
AWARDS GALOREPackages made from Metsä Board’s paperboards were, once again,
successful in a number of packaging contests. Awards and recognition
were achieved at, amongst others, the iF Design Award and European
Carton Excellence Awards 2017. The tea packages designed by Metsä
Board won the Dieline award in the Limited Edition category, while its gift
package of skincare products won the Shanghai Luxe Pack in Green
award as the most eco-friendly packaging solution. A redesigned version
of the gift package was named the Champion of Packaging Printing, Paper
Packaging category in the 29th Hong Kong Print Awards, and it also
received Merit awards in the Best Creative Printing and Best Crafted Book
categories.
ÄÄNEKOSKI BIOPRODUCT MILL STARTED UPThe bioproduct mill of Metsä Board’s associ-
ated company Metsä Fibre started up in
August in Äänekoski, Finland. Pulp deliveries
to customers began in September. The mill’s
annual pulp production capacity is 1.3 mil-
lion tonnes, and the total investment was
EUR 1.2 billion.
Metsä Board invested EUR 24.9 million
in the bioproduct mill. The investment will
increase Metsä Board’s annual pulp capacity
by approximately 200,000 tonnes starting
from 2018 and allow for future increases in
paperboard capacity.
The bioproduct mill uses no fossil fuels
at all and will continue to reduce the carbon
footprint of Metsä Board’s paperboards.
The mill produces 2.4 times more electricity
than it needs and increases the proportion
of renewable energy in Finland by more than
two percentage points.
Metsä Board owns 24.9 per cent of
Metsä Fibre.
YEAR 2017
REPORT OF THE BOARD OF DIRECTORS
GROUP ACCOUNTS
SHARES AND SHAREHOLDERS
PARENT COMPANY ACCOUNTS
AUDITOR’S REPORT
GOVERNANCE KEY FIGURES
INVESTOR INFORMATION
CEO’S REVIEW | HIGHLIGHTS OF 2017 | STRATEGY | OPERATING ENVIRONMENT AND MARKETS | BETTER WITH LESS | SUSTAINABILITY | PERSONNEL

6 METSÄ BOARD ANNUAL REPORT 2017
HIGH-QUALITY FRESH FIBRE PAPERBOARDSMetsä Board produces high-quality packaging boards made from fresh fibre. Our main products include folding boxboards, food service boards and white kraftliners. Our lightweight paperboards are developed to provide better, safer and more sustainable solutions for consumer goods as well as retail-ready and food service applications. Metsä Board’s global sales network supports customers worldwide, including brand owners, converters and merchants.
STRATEGY
FOCUSWe focus on premium fresh fibre paper-
boards for consumer goods, retail-ready and
food service packaging.
GROWTHWe grow profitably together with brand
owner, converter and merchant customers
globally in businesses that benefit from our
safe and sustainable paperboards.
PROFITABILITYOur profitability is based on superior cost
efficiency and healthy sales prices driven by
high-quality pulps and unique technical
know-how.
STRATEGIC CORNERSTONES
VISIONMetsä Board’s vision is to be the preferred supplier of premium paperboards, creating value
for customers globally.
• Unified paperboard company
• Proactive sales
• Innovative products and services
CRITICAL SUCCESS FACTORS• Safe and cost efficient production
and supply chain
• Fair leadership for growth
YEAR 2017
REPORT OF THE BOARD OF DIRECTORS
GROUP ACCOUNTS
SHARES AND SHAREHOLDERS
PARENT COMPANY ACCOUNTS
AUDITOR’S REPORT
GOVERNANCE KEY FIGURES
INVESTOR INFORMATION
CEO’S REVIEW | HIGHLIGHTS OF 2017 | STRATEGY | OPERATING ENVIRONMENT AND MARKETS | BETTER WITH LESS | SUSTAINABILITY | PERSONNEL

13 14 15 16 1713 14 15 16 17 13 14 15 16 17
14
12
10
8
6
4
2
0
15
12
9
6
3
0
METSÄ BOARD ANNUAL REPORT 2017 7
Target at least 12% Target less than 2.5x
4.0
3.0
2.0
1.0
0
RELIABILITYOur success is based on long-
term cooperation with our stake-
holders. We appreciate the work
and competence of each other
and strengthen the confidence
of our various stakeholders
by acting in a consistent and
predictable way.
COOPERATIONWe develop our operations in
cooperation with our customers
and share information and best
practices with each other. We
operate as one group of compa-
nies, utilising mutual synergies
and relying on common benefits.
RESPONSIBLE PROFITABILITYWe bear responsibility for the
environment, our partners and
each other to ensure successful
business activities and forestry.
Profitability is an absolute
prerequisite for the continuous
development of operations.
RENEWALWe are aware of future chal-
lenges and have the courage to
question old practices in order
to provide better products and
services to our customers in
support of their business
operations.
VALUES
MEGATRENDSPOPULATION GROWTH URBANISATION SUSTAINABILITY
COMPARABLE ROCE%
ANNUAL GROWTH IN TOTAL PAPERBOARD DELIVERIES %
NET DEBT / COMPARABLE EBITDA
In June 2017, Metsä Board updated
its long-term financial targets and
decided on a new dividend policy.
Metsä Board aims to distribute at least
50 per cent of the result for the finan-
cial period as dividend every year.
FINANCIAL TARGETS
Metsä Board’s target is to grow over the average 3–4 per cent market growth.
YEAR 2017
REPORT OF THE BOARD OF DIRECTORS
GROUP ACCOUNTS
SHARES AND SHAREHOLDERS
PARENT COMPANY ACCOUNTS
AUDITOR’S REPORT
GOVERNANCE KEY FIGURES
INVESTOR INFORMATION
CEO’S REVIEW | HIGHLIGHTS OF 2017 | STRATEGY | OPERATING ENVIRONMENT AND MARKETS | BETTER WITH LESS | SUSTAINABILITY | PERSONNEL

8 METSÄ BOARD ANNUAL REPORT 2017
AMERICAS
SHARE OF PAPERBOARD DELIVERIES IN 2017 23%GROWTH CONTINUES IN THE AMERICAS• Growth will be driven by the limited local
availability of premium lightweight folding
boxboard and by rapid growth in the
demand for food service packaging made
from fresh fibre paperboard.
• The growth of discount store chains and
online commerce will increase demand for
premium white kraftliner.
OPERATING ENVIRONMENT AND MARKETS
METSÄ BOARD OPERATES IN GROWING MARKETSMetsä Board focuses on paperboard grades with the strongest growth. The prevailing megatrends – population growth, urbanisation and sustainability – support demand for safe, lightweight and ecological fresh fibre paperboards. Fresh fibre paperboard has a strong position, particularly in the growing food packaging market. General economic fluctuations do not have a significant effect on the demand for Metsä Board’s products, as the demand for many of its end products – such as food, pharmaceutical and cosmetic packaging – is stable in nature.
MEGATRENDS
POPULATION GROWTH
URBANISATION
SUSTAINABILITY
3−4%
ANNUAL GROWTH IN GLOBAL DEMAND FOR FOLDING BOX-BOARD AND WHITE KRAFTLINERS
YEAR 2017
REPORT OF THE BOARD OF DIRECTORS
GROUP ACCOUNTS
SHARES AND SHAREHOLDERS
PARENT COMPANY ACCOUNTS
AUDITOR’S REPORT
GOVERNANCE KEY FIGURES
INVESTOR INFORMATION
CEO’S REVIEW | HIGHLIGHTS OF 2017 | STRATEGY | OPERATING ENVIRONMENT AND MARKETS | BETTER WITH LESS | SUSTAINABILITY | PERSONNEL

METSÄ BOARD ANNUAL REPORT 2017 9
EMEA
SHARE OF PAPERBOARD DELIVERIES IN 2017 70%RETENTION OF A STRONG MARKET POSITION IN EUROPE• The goal is to maintain the position as
market leader in folding boxboard and
white kraftliner in Europe.
• Metsä Board’s strengths are based on
long-standing customer accounts and a
broad customer base.
• Steady growth exceeding market growth is
sought through a diverse selection of pro-
ducts and services focused on customer
needs.
• Stricter safety requirements support
demand for fresh fibre paperboards,
particularly for food packaging.
APAC
SHARE OF PAPERBOARD DELIVERIES IN 2017 7%FOCUS ON PREMIUM SEGMENTS IN THE ASIA–PACIFIC REGION• Aiming for moderate growth, primarily in
cooperation with brand owners
• The competitive edge of Metsä Board’s
premium paperboard is based on consis-
tent quality, traceable raw materials and
responsible production.
FOLDING BOXBOARD IN EUROPETOTAL CAPACITY 3.8 million t/year
WHITE KRAFTLINER IN EUROPETOTAL CAPACITY 2.2 million t/year
Metsä Board ............. 33% Competitor 1 Competitor 2 Competitor 3 Competitor 4 Other
Metsä Board ............. 35% Competitor 1 Competitor 2 Competitor 3 Competitor 4 Other
METSÄ BOARD FOCUSES ON PAPERBOARD GRADES WITH THE STRONGEST GROWTH
PAPERBOARD 5-YEAR GROWTH FORECAST EMEA Americas APAC
Folding boxboard (FBB)
Food service board (FSB)
Coated white kraftliner (WKL)
Uncoated white kraftliner (WKL)
Other fresh fibre paperboards (e.g. SBS, CUK)
Recycled paperboards (e.g. WLC)
Source: Metsä Board’s research
Metsä Board’s focus area
+2%/a or more
+1% to +2%/a
-1% to +1%/a
-1% to -2%/a
-2%/a or more
YEAR 2017
REPORT OF THE BOARD OF DIRECTORS
GROUP ACCOUNTS
SHARES AND SHAREHOLDERS
PARENT COMPANY ACCOUNTS
AUDITOR’S REPORT
GOVERNANCE KEY FIGURES
INVESTOR INFORMATION
CEO’S REVIEW | HIGHLIGHTS OF 2017 | STRATEGY | OPERATING ENVIRONMENT AND MARKETS | BETTER WITH LESS | SUSTAINABILITY | PERSONNEL

10 METSÄ BOARD ANNUAL REPORT 2017
BETTER WITH LESSGlobal megatrends such as population growth and urbanisation are increasing the need for packaging. At the same time, the requirements for packaging are increasing: the recyclability of packages, product safety and purity, particularly in food packaging, are becoming increasingly important.
More info online www.metsaboard.com
Follow the theme on social media with the hashtag #betterwithless
Population growth and urbanisation are increasing trade and simultaneously, the use of packages. Online trade is further increasing the need for packaging. Products are also being consumed on the go which is growing the need for food service packaging and different sizes of packaging.
The plastic waste accumulating in the oceans has increased environmental awareness among consumers, and companies are taking action too. Brand owners are reviewing their packaging solutions to make packages lighter, safer and more environmentally friendly. The origin, the recyclability of materials, and eco-logical qualities are increasingly important considerations for products, brands and the user experience. We must achieve better with less, and work along the lines of circular economy.
Fresh fibre paperboards successfully meet market trends and needs. Replacing packages that contain fossil-based raw materials with paperboard made from a renewable raw mate-rial is an opportunity for companies producing consumer goods to improve the responsibility
of their business. Growing concerns related to the transfer of mineral oils from packages made of recycled fibre to foodstuffs are leading to increased demand for pure and safe fresh fibre.
The fresh fibre paperboards produced by Metsä Board are light, pure, safe and easily recyclable with 100 per cent of the fibres used in them traceable to sustainably managed northern forests. The world’s leading brand owners trust Metsä Board’s paperboards. This success relies on continuous innovation, high-quality wood raw material, strong fibre know-how and the use of cutting-edge production technologies.
Metsä Board’s product range is comple-mented by a range of expert services. Metsä Board possesses first-class competence in pack-aging analysis and design, technical expertise as well as in research and product development. In cooperation with its customers, Metsä Board develops innovative, ecological and user-friendly packaging solutions that meet the needs of consumers of the future.
BETTER WITH LESS CONCEPT
YEAR 2017
REPORT OF THE BOARD OF DIRECTORS
GROUP ACCOUNTS
SHARES AND SHAREHOLDERS
PARENT COMPANY ACCOUNTS
AUDITOR’S REPORT
GOVERNANCE KEY FIGURES
INVESTOR INFORMATION
CEO’S REVIEW | HIGHLIGHTS OF 2017 | STRATEGY | OPERATING ENVIRONMENT AND MARKETS | BETTER WITH LESS | SUSTAINABILITY | PERSONNEL
METSÄ BOARD ANNUAL REPORT 2017 11
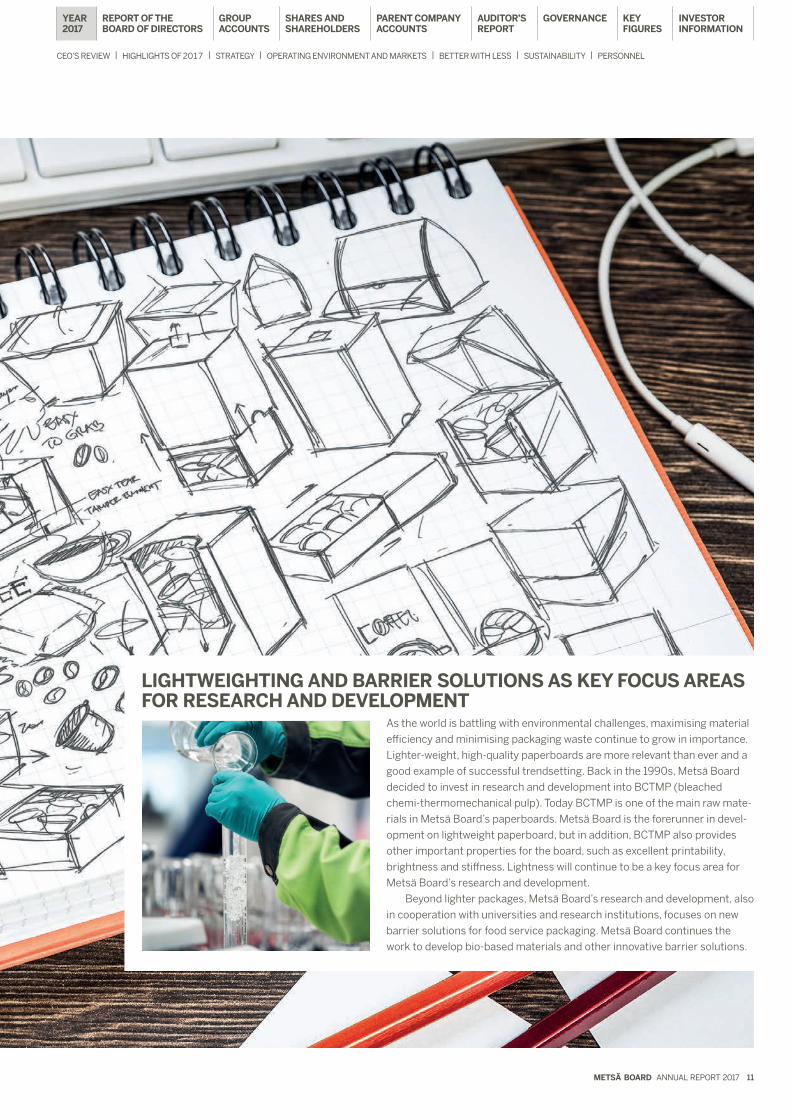
LIGHTWEIGHTING AND BARRIER SOLUTIONS AS KEY FOCUS AREAS FOR RESEARCH AND DEVELOPMENT
As the world is battling with environmental challenges, maximising material
efficiency and minimising packaging waste continue to grow in importance.
Lighter-weight, high-quality paperboards are more relevant than ever and a
good example of successful trendsetting. Back in the 1990s, Metsä Board
decided to invest in research and development into BCTMP (bleached
chemi-thermomechanical pulp). Today BCTMP is one of the main raw mate-
rials in Metsä Board’s paperboards. Metsä Board is the forerunner in devel-
opment on lightweight paperboard, but in addition, BCTMP also provides
other important properties for the board, such as excellent printability,
brightness and stiffness. Lightness will continue to be a key focus area for
Metsä Board’s research and development.
Beyond lighter packages, Metsä Board’s research and development, also
in cooperation with universities and research institutions, focuses on new
barrier solutions for food service packaging. Metsä Board continues the
work to develop bio-based materials and other innovative barrier solutions.
YEAR 2017
REPORT OF THE BOARD OF DIRECTORS
GROUP ACCOUNTS
SHARES AND SHAREHOLDERS
PARENT COMPANY ACCOUNTS
AUDITOR’S REPORT
GOVERNANCE KEY FIGURES
INVESTOR INFORMATION
CEO’S REVIEW | HIGHLIGHTS OF 2017 | STRATEGY | OPERATING ENVIRONMENT AND MARKETS | BETTER WITH LESS | SUSTAINABILITY | PERSONNEL
12 METSÄ BOARD ANNUAL REPORT 2017
SUSTAINABILITY
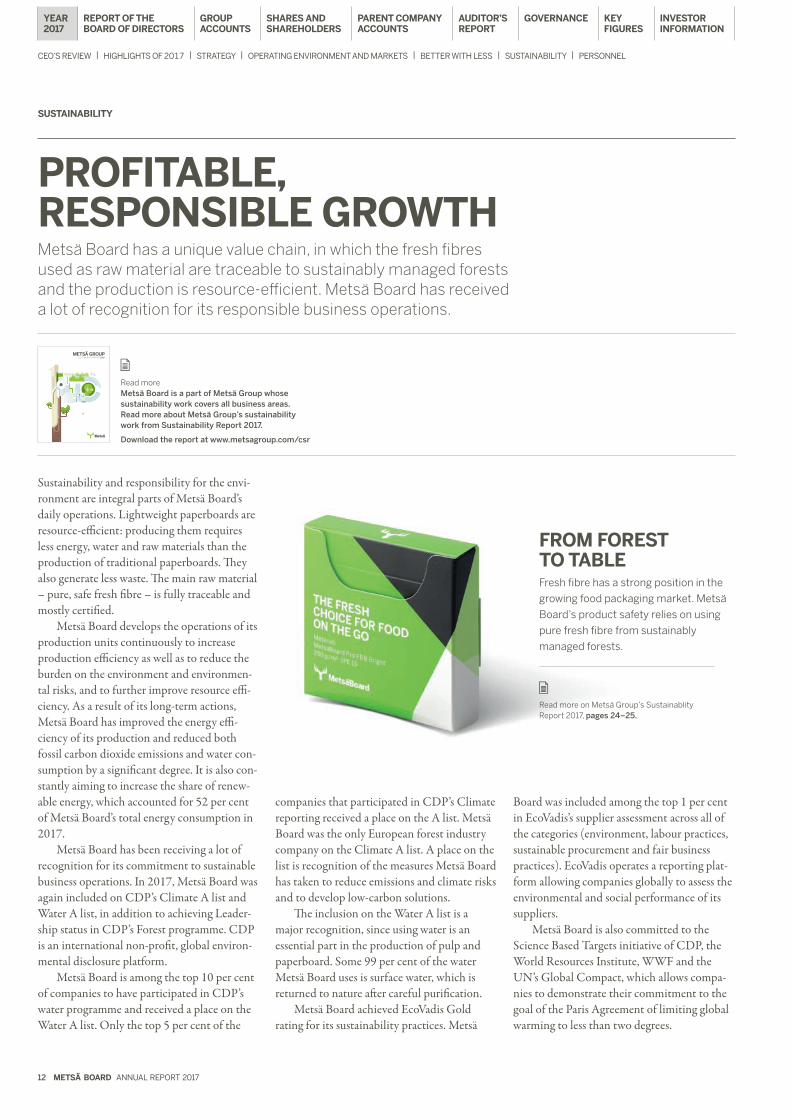
PROFITABLE, RESPONSIBLE GROWTHMetsä Board has a unique value chain, in which the fresh fibres used as raw material are traceable to sustainably managed forests and the production is resource-efficient. Metsä Board has received a lot of recognition for its responsible business operations.
METSÄ GROUPSUSTAINABILITY REPORT 2017
ME
TS
Ä G
RO
UP
SU
STA
INA
BILIT
Y R
EP
OR
T 2
017
Read more Metsä Board is a part of Metsä Group whose sustainability work covers all business areas. Read more about Metsä Group’s sustainability work from Sustainability Report 2017.
Download the report at www.metsagroup.com/csr
Sustainability and responsibility for the envi-ronment are integral parts of Metsä Board’s daily operations. Lightweight paperboards are resource-efficient: producing them requires less energy, water and raw materials than the production of traditional paperboards. They also generate less waste. The main raw material – pure, safe fresh fibre – is fully traceable and mostly certified.
Metsä Board develops the operations of its production units continuously to increase production efficiency as well as to reduce the burden on the environment and environmen-tal risks, and to further improve resource effi-ciency. As a result of its long-term actions, Metsä Board has improved the energy effi-ciency of its production and reduced both fossil carbon dioxide emissions and water con-sumption by a significant degree. It is also con-stantly aiming to increase the share of renew-able energy, which accounted for 52 per cent of Metsä Board’s total energy consumption in 2017.
Metsä Board has been receiving a lot of recognition for its commitment to sustainable business operations. In 2017, Metsä Board was again included on CDP’s Climate A list and Water A list, in addition to achieving Leader-ship status in CDP’s Forest programme. CDP is an international non-profit, global environ-mental disclosure platform.
Metsä Board is among the top 10 per cent of companies to have participated in CDP’s water programme and received a place on the Water A list. Only the top 5 per cent of the
FROM FOREST TO TABLE Fresh fibre has a strong position in the
growing food packaging market. Metsä
Board’s product safety relies on using
pure fresh fibre from sustainably
managed forests.
Read more on Metsä Group’s Sustainablity Report 2017, pages 24–25.
companies that participated in CDP’s Climate reporting received a place on the A list. Metsä Board was the only European forest industry company on the Climate A list. A place on the list is recognition of the measures Metsä Board has taken to reduce emissions and climate risks and to develop low-carbon solutions.
The inclusion on the Water A list is a major recognition, since using water is an essential part in the production of pulp and paperboard. Some 99 per cent of the water Metsä Board uses is surface water, which is returned to nature after careful purification.
Metsä Board achieved EcoVadis Gold rating for its sustainability practices. Metsä
Board was included among the top 1 per cent in EcoVadis’s supplier assessment across all of the categories (environment, labour practices, sustainable procurement and fair business practices). EcoVadis operates a reporting plat-form allowing companies globally to assess the environmental and social performance of its suppliers.
Metsä Board is also committed to the Science Based Targets initiative of CDP, the World Resources Institute, WWF and the UN’s Global Compact, which allows compa-nies to demonstrate their commitment to the goal of the Paris Agreement of limiting global warming to less than two degrees.
YEAR 2017
REPORT OF THE BOARD OF DIRECTORS
GROUP ACCOUNTS
SHARES AND SHAREHOLDERS
PARENT COMPANY ACCOUNTS
AUDITOR’S REPORT
GOVERNANCE KEY FIGURES
INVESTOR INFORMATION
CEO’S REVIEW | HIGHLIGHTS OF 2017 | STRATEGY | OPERATING ENVIRONMENT AND MARKETS | BETTER WITH LESS | SUSTAINABILITY | PERSONNEL

METSÄ BOARD ANNUAL REPORT 2017 13
EFFICIENT WATER AND ENERGY USAGE Metsä Board’s paperboard mill at Äänekoski is located in the immediate vicinity of Metsä
Fibre’s new bioproduct mill, which allows for synergy benefits in energy and water con-
sumption, among other things.
In 2017, Metsä Board’s paperboard mill began to recover solid content from the
production’s process water. The solid content is reused in paperboard production. The
water that is purified from the solid content is led to Metsä Fibre’s bioproduct mill’s
debarking department. As a result, Metsä Fibre’s mill can reduce its consumption of fresh
water by up to 1.4 million cubic metres a year. At the same time, the excess heat of the
paperboard mill benefits the debarking process of the bioproduct mill thanks to the warm
water from the board machine.
YEAR 2017
REPORT OF THE BOARD OF DIRECTORS
GROUP ACCOUNTS
SHARES AND SHAREHOLDERS
PARENT COMPANY ACCOUNTS
AUDITOR’S REPORT
GOVERNANCE KEY FIGURES
INVESTOR INFORMATION
CEO’S REVIEW | HIGHLIGHTS OF 2017 | STRATEGY | OPERATING ENVIRONMENT AND MARKETS | BETTER WITH LESS | SUSTAINABILITY | PERSONNEL

14 METSÄ BOARD ANNUAL REPORT 2017
OUR SUSTAINABILITY TARGETSSustainability is a part of everything we do. The foundation of our sustainability work consists of four themes covering all our operations and eight concrete targets that guide our everyday work. Our sustainability work supports reaching the global Sustainable Development Goals (SDGs) set by the United Nations.
WE CREATE WELL-BEINGSTAKEHOLDERS AND SOCIAL IMPACTS
• Ethical business practices• Responsible employer• Safety at work• Partnerships and industrial ecosystems• Value creation in society
WE OFFER SUSTAINABLE CHOICESPRODUCTS AND SERVICES
• Sustainable, safe and recyclable products from renewable wood
• Customer-focused services and solutions
• Innovations and renewal
ETHICAL BUSINESSCoverage of Code of Conduct training:
79% PERFORMANCE 2017
100% TARGET
SAFETY AT WORKLost-time accidents frequency annually (LTA1: 6.4):
-28.4% PERFORMANCE 2017
-10% TARGET
WELL-BEINGSickness absenteeism:
3.9% PERFORMANCE 2017
<3% TARGET
Read more The targets represented in this graphic are common for Metsä Group, with the exception of energy efficiency for which Metsä Board has set its own target. Performance figures are for Metsä Board. Read more about Metsä Group’s targets: Sustainability Report 2017
YEAR 2017
REPORT OF THE BOARD OF DIRECTORS
GROUP ACCOUNTS
SHARES AND SHAREHOLDERS
PARENT COMPANY ACCOUNTS
AUDITOR’S REPORT
GOVERNANCE KEY FIGURES
INVESTOR INFORMATION
CEO’S REVIEW | HIGHLIGHTS OF 2017 | STRATEGY | OPERATING ENVIRONMENT AND MARKETS | BETTER WITH LESS | SUSTAINABILITY | PERSONNEL
METSÄ BOARD ANNUAL REPORT 2017 15
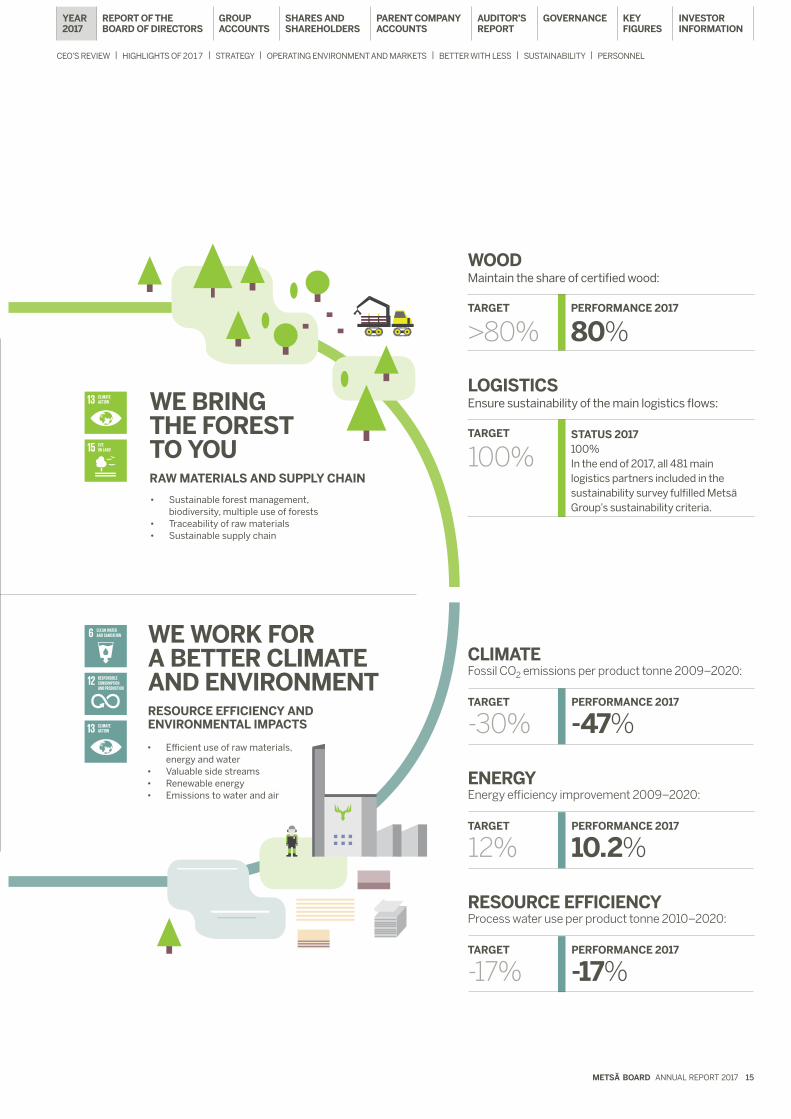
WE BRING THE FOREST TO YOURAW MATERIALS AND SUPPLY CHAIN
• Sustainable forest management, biodiversity, multiple use of forests
• Traceability of raw materials• Sustainable supply chain
• Efficient use of raw materials, energy and water
• Valuable side streams• Renewable energy• Emissions to water and air
WE WORK FOR A BETTER CLIMATE AND ENVIRONMENTRESOURCE EFFICIENCY AND ENVIRONMENTAL IMPACTS
WOODMaintain the share of certified wood:
TARGET
>80%PERFORMANCE 2017
80%
LOGISTICSEnsure sustainability of the main logistics flows:
TARGET
100%STATUS 2017100% In the end of 2017, all 481 main logistics partners included in the sustainability survey fulfilled Metsä Group’s sustainability criteria.
WE CREATE WELL-BEINGSTAKEHOLDERS AND SOCIAL IMPACTS
CLIMATEFossil CO2 emissions per product tonne 2009–2020:
-47% PERFORMANCE 2017
-30% TARGET
ENERGYEnergy efficiency improvement 2009–2020:
10.2% PERFORMANCE 2017
12% TARGET
RESOURCE EFFICIENCYProcess water use per product tonne 2010–2020:
-17% PERFORMANCE 2017
-17% TARGET
YEAR 2017
REPORT OF THE BOARD OF DIRECTORS
GROUP ACCOUNTS
SHARES AND SHAREHOLDERS
PARENT COMPANY ACCOUNTS
AUDITOR’S REPORT
GOVERNANCE KEY FIGURES
INVESTOR INFORMATION
CEO’S REVIEW | HIGHLIGHTS OF 2017 | STRATEGY | OPERATING ENVIRONMENT AND MARKETS | BETTER WITH LESS | SUSTAINABILITY | PERSONNEL

16 METSÄ BOARD ANNUAL REPORT 2017
PERSONNEL
GROWTH STARTS WITH PEOPLEThere is no growth without personnel. This is why Metsä Board invests in developing the competence of its personnel as well as in fair leadership that supports growth.
Read more Report of the Board of Directors p. 20
Achieving growth targets requires continuous development of an organisation and its person-nel’s skills. Quality leadership and manage-ment culture play a central role in this. Metsä Board is in the process of standardising its operating methods and continuously develops its leadership and management culture.
Future resource needs at Metsä Board are anticipated through assessing the skills required for the future, preparing successor plans and developing personnel through voca-tional training and job rotation. Metsä Board’s annual organisation functionality survey is an important tool for finding out how the work-
place and management support day-to-day work.
The personnel’s well-being at work and working capacity is managed in a systematic way, and the approach to risk is proactive. The early support model is part of the common way of working. Metsä Board’s employees’ working capacity is supported at all stages of their career.
Safety at work is improved continuously by influencing attitudes and pursuing proactive actions. The goal is also to harmonise safety-at-work practices between units and to keep pay-ing attention to reporting safety incidents and observations concerning hazardous situations.
One example of this is the sharing of accident reports on the mill info screens, which help people to anticipate dangers. Metsä Board aims to improve safety in the work environ-ment, ultimately continuing towards an acci-dent-free workplace. Metsä Board’s long-term objective with regard to lost-time accidents is zero.
Metsä Board is introducing the 5S system in its mills to improve productivity, safety and well-being at work. The system was taken into use at the Simpele mill in 2017. The goal with regard to other mills is to adopt the 5S system during 2018.
MADE TOGETHEREarly on in the year, Metsä Board renewed the key
messages of its marketing and unified its product
and service offering. The project addressed the
issues of a new way of working and the goal of pro-
viding customers with better consumer experi-
ences with less environmental impact on a larger
scale.
Its launch in May, and the start of customer
communication, was preceded by extensive
internal preparation in units and at the mills. Over
the spring, nearly 750 employees participated in
joint workshops to discuss how the new key
messages were visible in practical work and how
they would be presented to customers.
“A project like this one could not succeed
without the support and enthusiasm of the entire
personnel. This is why it was so important for
everyone to grasp what will change, what we’ll be
doing differently in the future, and how we present
Metsä Board to the outside world. Our success is
based on doing things together,” states Sari Pajari,
SVP, Sales and Marketing.
YEAR 2017
REPORT OF THE BOARD OF DIRECTORS
GROUP ACCOUNTS
SHARES AND SHAREHOLDERS
PARENT COMPANY ACCOUNTS
AUDITOR’S REPORT
GOVERNANCE KEY FIGURES
INVESTOR INFORMATION
CEO’S REVIEW | HIGHLIGHTS OF 2017 | STRATEGY | OPERATING ENVIRONMENT AND MARKETS | BETTER WITH LESS | SUSTAINABILITY | PERSONNEL
5
4
3
2
1
0
14
12
10
8
6
4
2
013 14 15 16 17 13 14 15 16 17 13 14 15 16 17
METSÄ BOARD ANNUAL REPORT 2017 17
0.3
0.2
0.1
0
SICKNESS ABSENCES1)
%
ABSENCES DUE TO OCCUPATIONAL ACCIDENTS%
LOST-TIME ACCIDENT FREQUENCY2)
PER MILLION HOURS WORKED
2) Including mills and the harbour operator
1) Percentage of theoretical work time
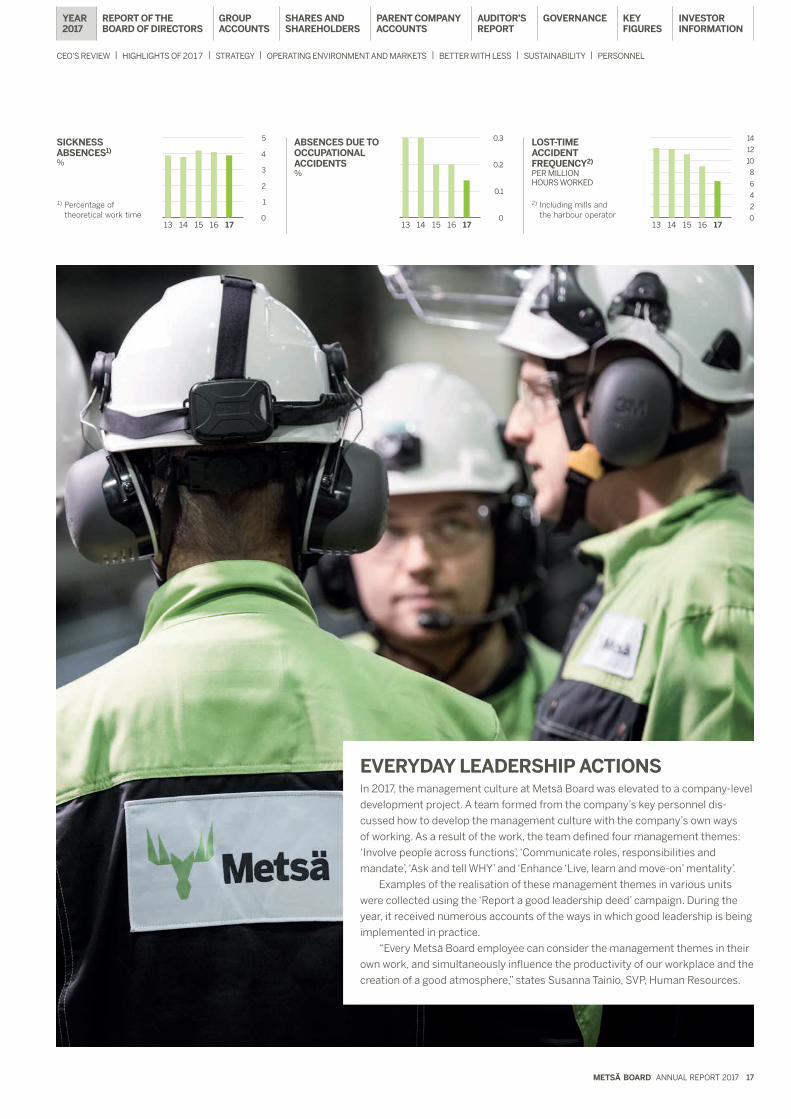
EVERYDAY LEADERSHIP ACTIONSIn 2017, the management culture at Metsä Board was elevated to a company-level
development project. A team formed from the company’s key personnel dis-
cussed how to develop the management culture with the company’s own ways
of working. As a result of the work, the team defined four management themes:
‘Involve people across functions’, ‘Communicate roles, responsibilities and
mandate’, ‘Ask and tell WHY’ and ‘Enhance ‘Live, learn and move-on’ mentality’.
Examples of the realisation of these management themes in various units
were collected using the ‘Report a good leadership deed’ campaign. During the
year, it received numerous accounts of the ways in which good leadership is being
implemented in practice.
“Every Metsä Board employee can consider the management themes in their
own work, and simultaneously influence the productivity of our workplace and the
creation of a good atmosphere,” states Susanna Tainio, SVP, Human Resources.
YEAR 2017
REPORT OF THE BOARD OF DIRECTORS
GROUP ACCOUNTS
SHARES AND SHAREHOLDERS
PARENT COMPANY ACCOUNTS
AUDITOR’S REPORT
GOVERNANCE KEY FIGURES
INVESTOR INFORMATION
CEO’S REVIEW | HIGHLIGHTS OF 2017 | STRATEGY | OPERATING ENVIRONMENT AND MARKETS | BETTER WITH LESS | SUSTAINABILITY | PERSONNEL

18 METSÄ BOARD ANNUAL REPORT 2017
FINANCIAL STATEMENTS 2017In 2017, Metsä Board’s paperboard deliveries grew by 15 per cent from the previous year. Comparable operating result improved by 41 per cent from the previous year due to the increased delivery volumes of paperboards and market pulp, and the discontinued paper operations. The result also improved due to the strong pulp market and the successful start-up of the new bioproduct mill of Metsä Board’s associated company Metsä Fibre in the second half of the year.
More info online www.metsaboard.com/investors
FINANCIAL STATEMENTS 2017
YEAR 2017
REPORT OF THE BOARD OF DIRECTORS
GROUP ACCOUNTS
SHARES AND SHAREHOLDERS
PARENT COMPANY ACCOUNTS
AUDITOR’S REPORT
GOVERNANCE KEY FIGURES
INVESTOR INFORMATION
CEO’S REVIEW | HIGHLIGHTS OF 2017 | STRATEGY | OPERATING ENVIRONMENT AND MARKETS | BETTER WITH LESS | SUSTAINABILITY | PERSONNEL

180
150
120
90
60
30
0
600
500
400
300
200
100
0
13 14 15 16 17
13 14 15 16 1713 14 15 16 17
80
60
40
20
0
60
50
40
30
20
10
0
200
150
100
50
0
250
200
150
100
50
0
13 14 15 16 17
13 14 15 16 17
13 14 15 16 17
13 14 15 16 17
200 12
150 9
100 6
50 3
0 013 14 15 16 17
13 14 15 16 17
METSÄ BOARD ANNUAL REPORT 2017 19
CONTENTS
2,500
2,000
1, 500
1,000
500
0
4,000
3,000
2,000
1,000
0
GROUP20 Report of the Board of Directors 2017
29 Consolidated statement
of comprehensive income
30 Consolidated balance sheet
31 Statement of changes
in shareholders’ equity
32 Consolidated cash flow statement
33 Notes to the consolidated
financial statements
83 Shares and shareholders
87 Calculation of key ratios
PARENT COMPANY88 Parent company accounts
– Income statement
89 Parent company accounts
– Balance sheet
90 Parent company accounts
– Cash flow statement
91 Parent company accounting policies
92 Notes to the parent company
financial statements
98 The Board’s proposal for the
distribution of profits
99 Auditor’s report
GOVERNANCE102 Corporate governance statement
109 Salary and remuneration report
112 Metsä Board Corporation’s
Board of Directors
114 Metsä Board Corporation’s
Corporate Management Team
116 Quarterly data
117 Production capacities
118 Ten years in figures
119 Investor relations and investor
information
OPERATING RESULT, COMPARABLE EUR MILLION AND % OF SALES
RESULT BEFORE TAXES, COMPARABLE EUR MILLION
CASH FLOW FROM OPERATIONS EUR MILLION
PERSONNEL AT THE END OF PERIOD
SALESEUR MILLION
SALES SPLIT%
EQUITY RATIO %
SALES BY MARKET AREA%
NET GEARING RATIO%
INVESTMENTS EUR MILLION
INTEREST-BEARING NET DEBT EUR MILLION
EMEA ............................72 Americas ...................... 19 APAC ...............................9
Folding boxboard .........53 Kraftliner ......................27 Market pulp .................. 18 Others .............................3
KEY FIGURES
NET DEBT / COMPARABLE EBITDA
3.0
2.5
2.0
1.5
1.0
0.5
013 14 15 16 17
YEAR 2017
REPORT OF THE BOARD OF DIRECTORS
GROUP ACCOUNTS
SHARES AND SHAREHOLDERS
PARENT COMPANY ACCOUNTS
AUDITOR’S REPORT
GOVERNANCE KEY FIGURES
INVESTOR INFORMATION
CEO’S REVIEW | HIGHLIGHTS OF 2017 | STRATEGY | OPERATING ENVIRONMENT AND MARKETS | BETTER WITH LESS | SUSTAINABILITY | PERSONNEL

20 FINANCIAL STATEMENTS 2017 – REPORT OF THE BOARD OF DIRECTORS 2017
OPERATING ENVIRONMENT IN 2017
Demand for packaging materials made from fresh fibre paperboard is supported by strong megatrends, such as population growth and urbanisation, as well as the increasing requirements for recyclable, resource-efficient and safe packaging materials. Metsä Board expects total global demand for folding boxboard and white kraftliner to grow by 3–4 per cent a year. Metsä Board’s total paperboard deliveries in 2017 grew by 15 per cent.
Metsä Board is Europe’s leading producer and supplier of folding boxboard and white kraftliner. The company’s estimated share of the total capacity of European producers of folding boxboard is 35 per cent, while its corresponding share of white kraftliner is 33 per cent. Metsä Board aims to retain a strong market position in Europe in the future, too. In 2017, the company’s deliveries of folding boxboard and white kraftliner to the EMEA region grew by 15 per cent.
Metsä Board continues to grow in the Americas. Demand for Metsä Board’s folding boxboard is supported by its lightness compared to other paperboards, for example, as well the rapid growth in demand for ecological packaging materials. Metsä Board has a strong market posi-tion in coated white kraftliner in the Americas. In 2017, the company’s deliveries of folding boxboard and white kraftliner to the Americas grew by 23 per cent.
In Asia, Metsä Board is focusing on customers demanding high-quality, and is aiming for moderate growth especially with international brand owners. In 2017, the company’s deliveries of folding boxboard and white kraftliner to the APAC region grew by 11 per cent.
The market prices of white kraftliners rose in 2017. Metsä Board twice announced price increases for white kraftliner in Europe during 2017, both increases being EUR 50 per tonne. Towards the end of the year, Metsä Board also announced to increase the price of folding boxboard in Europe by EUR 90 per tonne.
The strong demand for fresh fibre paperboards was visible in the order books of Metsä Board’s paperboard mills in Finland, which were at a clearly higher level than before, particularly at the end of the year. The increased capacity of European folding boxboard producers has not had a negative effect on the market situation or the price develop-ment of paperboards.
The pulp market in 2017 was strong, and the rise in pulp prices was stronger than expected. Prices rose particularly in China, where demand was supported by the rapid growth in the demand for tissue paper and paperboard, the import restrictions imposed on recycled fibre, and breaks in supply from some pulp suppliers in the second half of the year.
The balance between the supply and demand for market pulp in 2017 was 91 per cent (2016: 91%). In Europe, the euro-denominated market price of long-fibre pulp increased by 8 per cent (-6%), while its dollar-denominated market price increased by 10 per cent (-6%) compared to the previous year. Correspondingly, the euro- and dollar-denominated market prices of short-fibre pulp increased by 16 per cent (-11%) and 18 per cent (-11%), respectively. (Source: Foex Indexes Ltd.)
In 2017, the average exchange rate of the euro in relation to the US dollar strengthened by 2 per cent compared to the previous year.
Correspondingly, in relation to the British pound and the Swedish krona, the average exchange rate of the euro strengthened by 7 per cent and 2 per cent, respectively.
PERFORMANCE IN FINANCIAL PERIOD 2017 (2016)
Metsä Board’s sales amounted to EUR 1,848.6 million (1,720.3). Sales increased due to the increased delivery volumes of paperboards and market pulp as well as higher pulp prices. The operating result was EUR 207.1 million (132.3), and the comparable operating result was EUR 193.5 million (137.5). Items affecting comparability during the financial period consisted mainly of the reversal of a previously recog-nised impairment loss on the closed and sold paper machine at Kyro mill, and the recognition of translation differences accumulated by the subsidiaries dissolved in the United Kingdom.
The comparable operating result improved due to the increased delivery volumes of paperboards and market pulp, and the discontinued paper operations. The result also improved due to the strong pulp market and the successful start-up of the new bioproduct mill of the associated company Metsä Fibre in the second half of the year. The positive momentum in the linerboard market globally increased the price of white kraftliners in local currencies. Exchange rate fluctuations including hedges had a positive effect of approximately EUR 13 million on the operating result for the financial period.
The average price of Metsä Board’s folding boxboard fell due to the sales mix of Husum, particularly during the first half of the year. The company aims to continue to improve the average price and increase sales, particularly in North America.
The prices of latex were high in the first half of the year, but returned to a normal level during the third quarter. In other respects, there were no significant changes in the total production costs of paper-boards. The production costs per tonne of folding boxboard produced at Husum continued to be higher than the production costs at other mills. This was due to the lower capacity utilisation rate.
Financial income and expenses totalled EUR -36.3 million (-30.7), including foreign exchange rate differences from trade receivables, trade payables, financial items and the valuation of currency hedging instru-ments, totalling EUR -1.1 million (-4.9). Financial expenses include EUR -11.2 million of costs related to the early repurchase of the bond maturing in 2019.
The result before taxes for the financial period was EUR 170.8 million (101.6). The comparable result before taxes was EUR 157.2 million (106.8). Income taxes amounted to EUR -20.3 million (-11.3).
Earnings per share were EUR 0.42 (0.25). Comparable earnings per share were EUR 0.39 (0.26). The return on equity was 13.6 per cent (8.7), and the comparable return on equity was 12.4 per cent (9.0). The return on capital employed was 11.9 per cent (7.8), and the comparable return on capital employed was 11.2 per cent (8.1).
REPORT OF THE BOARD OF DIRECTORS 2017
YEAR 2017
REPORT OF THE BOARD OF DIRECTORS
GROUP ACCOUNTS
SHARES AND SHAREHOLDERS
PARENT COMPANY ACCOUNTS
AUDITOR’S REPORT
GOVERNANCE KEY FIGURES
INVESTOR INFORMATION

100
80
60
40
20
01 5 1 6 1 7
REPORT OF THE BOARD OF DIRECTORS 2017 – FINANCIAL STATEMENTS 2017 21
KEY FIGURES
2017 2016 2015
Sales, EUR million 1,848.6 1,720.3 2,007.5
EBITDA, EUR million 298.7 234.6 302.5
comparable, EUR million 289.1 231.1 283.3
EBITDA, % of sales 16.2 13.6 15.1
comparable, % of sales 15.6 13.4 14.1
Operating result, EUR million 207.1 132.3 199.0
comparable, EUR million 193.5 137.5 179.9
Operating result, % of sales 11.2 7.7 9.9
comparable, % of sales 10.5 8.0 9.0
Result before taxes, EUR million 170.8 101.6 167.1
comparable, EUR million 157.2 106.8 150.2
Result for the period, EUR million 150.5 90.4 137.3
comparable, EUR million 137.5 93.6 120.2
Earnings per share, EUR 0.42 0.25 0.39
comparable, EUR 0.39 0.26 0.34
Return on equity, % 13.6 8.7 14.7
comparable, % 12.4 9.0 12.9
Return on capital employed, % 11.9 7.8 12.5
comparable, % 11.2 8.1 11.3
Equity ratio at the end of the period, % 53 48 46
Net gearing ratio at the end of the period, % 31 44 32
Interest-bearing net liabilities / EBITDA 1) 1.2 2.0 1.2
Shareholders’ equity per share at the end of the period, EUR 3.28 2.96 2.89
Interest-bearing net liabilities at the end of the period, EUR million 358.4 463.8 333.4
Gross investments, EUR million 65.4 162.4 177.8
Net cash flow from operations, EUR million 236.3 77.0 246.7
Average number of personnel in the period 2,456 2,588 2,851
Salaries and remuneration, EUR million 125.7 132.3 154.6
1) The ratio of the interest-bearing net liabilities to the comparable EBITDA of the previous 12 months at the end of the period.
DELIVERY AND PRODUCTION VOLUMES
1,000 t 2017 2016 2015
Delivery volumes
Paperboards 1) 1,803 1,607 1,449
Papers 0 35 478
Market pulp 515 500 549
Production volumes
Paperboards 1) 1,817 1,708 1,481
Papers 0 23 430
Metsä Fibre’s pulp 2) 619 577 586
Metsä Board’s pulp 1,330 1,236 1,206
1) Includes wallpaper base.2) Equal to Metsä Board’s 24.9 per cent holding in Metsä Fibre.
1 5 1 6 1 7
100
80
60
40
20
0
Folding boxboard Kraftliner Market pulp Others
SALES SPLIT%
1 5 1 6 1 7
EMEA Americas APAC
SALES BY REGION%
2,500
2,000
1, 500
1,000
500
0
SALESEUR MILLION
YEAR 2017
REPORT OF THE BOARD OF DIRECTORS
GROUP ACCOUNTS
SHARES AND SHAREHOLDERS
PARENT COMPANY ACCOUNTS
AUDITOR’S REPORT
GOVERNANCE KEY FIGURES
INVESTOR INFORMATION
22 FINANCIAL STATEMENTS 2017 – REPORT OF THE BOARD OF DIRECTORS 2017
CASH FLOW
Net cash flow from operations in 2017 was EUR 236.3 million (1–12/2016: 77.0). Cash flow increased due to the improved operating result and changes in working capital. Working capital decreased by EUR 34.1 million in the financial period (2016: increased by 74.5). In 2016, working capital increased due to the investment programme at Husum.
INVESTMENTS
Gross investments in 2017 totalled EUR 65.4 million (2016: 162.4) consisting mainly of maintenance investments and the extrusion coat-ing line at the Husum mill. In 2016, investments totalled EUR 162.4 million, the most significant investments being the investment pro-gramme at Husum and the extrusion coating line, as well as the equity investment in Metsä Fibre’s new bioproduct mill.
BALANCE SHEET AND FINANCING
Metsä Board’s equity ratio at the end of the year was 53 per cent (31 December 2016: 48) and its net gearing ratio was 31 per cent (44). The ratio of interest-bearing net debt to comparable EBITDA in the last 12 months was 1.2 at the end of the financial period (31 December 2016: 2.0).
At the end of the year, interest-bearing liabilities totalled EUR 577.0 million (31 December 2016: 688.0). Foreign currency-denominated loans accounted for 1.1 per cent of loans and floating-rate loans for 18.5 per cent, with the rest being fixed-rate loans. At the end of the year, the average interest rate on loans was 3.3 per cent (31 December 2016: 3.3), and the average maturity of long-term loans was 5.4 years (31 December 2016: 2.2). The interest rate maturity of loans at the end of the year was 67.9 months (31 December 2016: 14.9).
At the end of the year, net interest-bearing liabilities totalled EUR 358.4 million (31 December 2016: 463.8).
In September, Metsä Board issued an unsecured bond of EUR 250 million. The bond matures in 2027 and carries a fixed coupon rate of 2.75 per cent. The bond has a Standard & Poor’s credit rating of BB+. In addition, Metsä Board has a bond maturing in 2019, with an original amount of EUR 225 million, of which there remains outstanding a nominal amount of EUR 60.4 million, following the repurchases made in 2017.
Metsä Board’s liquidity has remained strong. At the end of the review period, the available liquidity was EUR 449.2 million (31 December 2016: 422.6), consisting of the following items: liquid assets and investments of EUR 215.1 million, a syndicated credit facility of EUR 100.0 million, and undrawn pension premium (TyEL) funds of EUR 134.1 million. Of the liquid assets, EUR 207.0 million consisted of short-term deposits with Metsä Group Treasury, and EUR
8.1 million were cash funds and investments. Other interest-bearing receivables amounted to EUR 3.5 million. In addition, Metsä Board’s liquidity reserve is complemented by Metsä Group’s internal undrawn short-term credit facility of EUR 150.0 million.
The fair value of investments available for sale was EUR 240.3 mil-lion at the end of the review period (31 December 2016: 195.9). The change in fair value from the beginning of the review period, EUR 44.4 million, related to the increase in the fair value of the shares in Pohjolan Voima Oyj.
At the end of the review period, an average of 8.0 months of the net foreign currency exposure was hedged, including the hedging of the balance sheet position of trade receivables and trade payables (31 December 2016: 6.4). The degree of hedging during the period varied between six and eight months, on average. In addition to the balance sheet position, half of the projected annual net foreign currency expo-sure is hedged. The amount of hedging may deviate from the norm by 40 per cent in either direction. When hedging is at the norm level, the aim is to allocate the hedges primarily to the following two quarters.
In August, Moody’s Investors Service upgraded Metsä Board Corporation’s credit rating from Ba2 to Ba1. The outlook of the rating is stable.
PERSONNEL
In 2017, Metsä Board employed an average of 2,456 people (2,588), of whom 59 per cent worked in Finland, 30 per cent in Sweden, 8 per cent elsewhere in the EMEA region, and 3 per cent in the Americas and the APAC region. Of the personnel, 1,507 (1,589) were blue-collar employees of whom 9 per cent (9) were women and 91 per cent (91) men. Correspondingly, 844 (877) members of the personnel were white-collar employees, of whom 43 per cent (42) were women and 57 per cent (58) men. The average age of Metsä Board’s blue-collar employees is 47.0 years, and the average age of its white-collar employ-ees is 45.5 years. Personnel expenses in 2017 totalled EUR 198 million (211), of which salaries and remuneration amounted to EUR 126 million (132).
Future retirements are prepared for with retirement forecasts and resource plans drawn up on their basis. The company has initiated apprenticeship training in Finland, aiming to recruit future personnel, and the mill units are investing in on-the-job learning and knowledge sharing by way of peer mentoring, for example.
The section Report on non-financial key figures in this report contains further information about personnel development and safety at work.
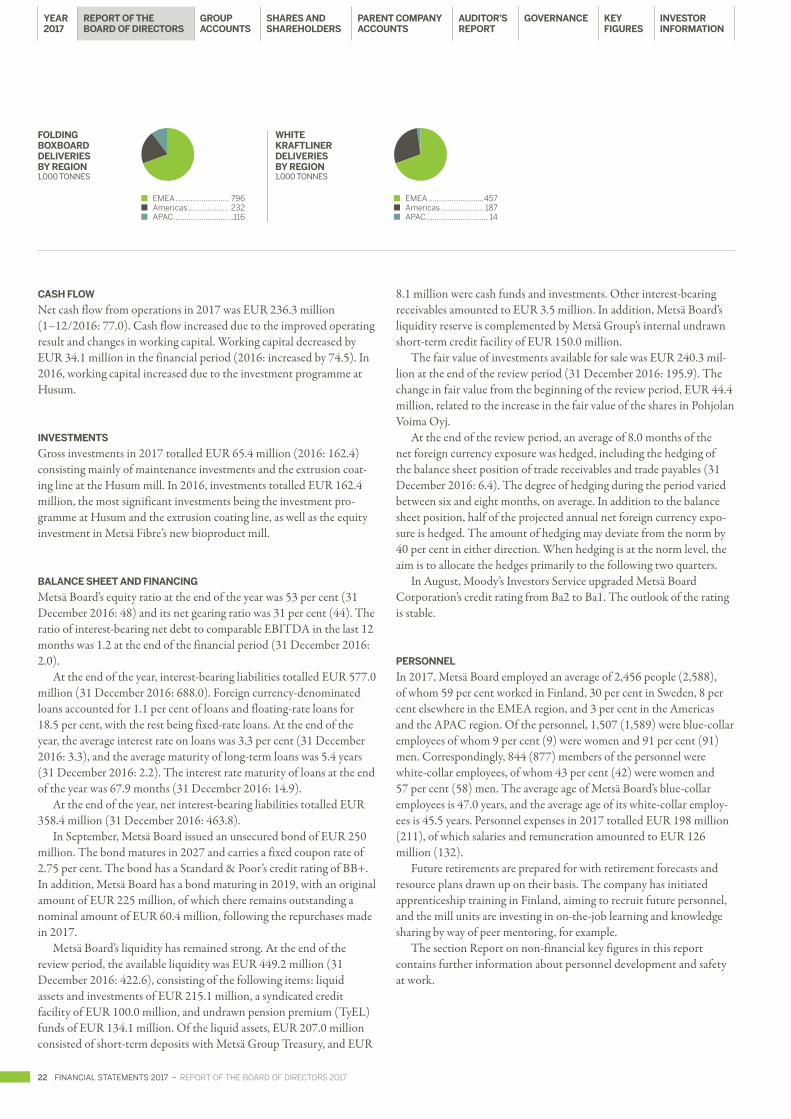
WHITE KRAFTLINER DELIVERIES BY REGION 1,000 TONNES
FOLDING BOXBOARD DELIVERIES BY REGION 1,000 TONNES
EMEA ......................... 796 Americas ................... 232 APAC ............................116
EMEA ..........................457 Americas .................... 187 APAC ............................. 14
YEAR 2017
REPORT OF THE BOARD OF DIRECTORS
GROUP ACCOUNTS
SHARES AND SHAREHOLDERS
PARENT COMPANY ACCOUNTS
AUDITOR’S REPORT
GOVERNANCE KEY FIGURES
INVESTOR INFORMATION

REPORT OF THE BOARD OF DIRECTORS 2017 – FINANCIAL STATEMENTS 2017 23
BUSINESS DEVELOPMENT
Demand for Metsä Board’s lightweight, ecological and recyclable fresh fibre paperboards remained at a good level in 2017. By exploiting Husum’s folding boxboard capacity, Metsä Board is increasingly well positioned to meet the growing global demand for premium fresh fibre paperboards.
The good global demand for fresh fibre paperboards was visible in the average order books of Metsä Board’s paperboard mills, which were at a higher level than normal during the second half of the year. Five Metsä Board production units – Tako, Simpele, Husum, Kaskinen and Joutseno – set new annual production records in 2017.
The capacity utilisation rate for folding boxboard at the Husum mill was 71 per cent in 2017. In the first half of the year, the average price of folding boxboard was weakened by the geographical sales mix, as part of Husum’s paperboard deliveries were targeted to the Middle East. Towards the end of the year, the share of sales to North America grew, and the average price of folding boxboard in local currencies improved. The annual maintenance shutdown at the Husum integrated mill, which took place in the fourth quarter, lasted longer than expected and resulted in lost production and sales, particularly in terms of pulp.
Deliveries of Metsä Board’s own PE-coated paperboards from the Husum mill began during the second quarter of the year. The company is continuing to develop other barrier solutions, and is investigating the exploitation of dispersion coating and biobased coating solutions as well as their commercial potential. After the review period, Metsä Board launched an innovative biobased, biodegradable paperboard with a special barrier treatment, mainly for use in food service packaging.
Metsä Board has estimated the results improvement potential of the Husum integrated mill to be approximately EUR 100 million between 2016 and 2019. The most significant part of this improvement will be achieved if the capacity utilisation rate of folding boxboard is at least 95 per cent and if the sales price is at a normal level. The rest of the improved result is due to an increase in the delivery volumes of pulp and cost savings.
In May, Metsä Board launched its renewed product and service port-folio. The product names of all paperboards were brought under the MetsäBoard product family. The Better with Less concept promotes packaging solutions that create better consumer experiences with less environmental impact.
Metsä Board was again successful in a number of international competitions organised by the packaging industry during the year. Metsä Board’s packaging solutions and the high-quality materials used in them received recognition for their environmental friendliness, innovativeness and functionality. The company was also recognised for its responsibility by CDP and EcoVadis, among others.
The new bioproduct mill of Metsä Board’s associated company Metsä Fibre started up in August 2017, and the pulp deliveries to customers began in September. The mill’s start-up phase has progressed better than expected. The new bioproduct mill will increase Metsä Board’s annual pulp capacity by approximately 200,000 tonnes as of 2018.
STRATEGY AND FINANCIAL TARGETS
Metsä Board is a leading European producer of fresh fibre paperboards. The company focuses on light-weight, premium fresh fibre paperboards
used in consumer goods, retail-ready and food service packaging. Metsä Board’s strategic objective is to grow profitably and faster than average market growth. Global demand for high-quality paperboard made from fresh fibre is expected to grow by approximately 3–4 per cent a year. Metsä Board’s profitability is based on superior cost-effectiveness and healthy sales prices, combined with high-quality fibre raw materials and unique technical know-how.
Metsä Board’s Board of Directors updated the company’s long-term financial targets and decided on a new dividend policy, effective as of 1 June 2017.• A comparable return on capital employed (ROCE) of, at minimum,
12 per cent (Actual in 2017: 11.2%)• A ratio of interest-bearing net liabilities to comparable EBITDA of,
at maximum, 2.5 (Actual in 2017: 1.2)• Growth in paperboard deliveries exceeding average market growth
(In 2017, paperboard deliveries grew by 15 per cent)
In addition, Metsä Board aims to distribute at least 50 per cent of the result for the financial period in dividends every year. The Board of Directors’ proposal to the Annual General Meeting concerning the dividend to be paid for the 2017 financial year corresponds to 50 per cent of the result for the financial period.
LEGAL PROCEEDINGS
In May 2014, Metsä Board petitioned the District Court of Helsinki to revoke the judgment issued by the Arbitral Tribunal on 11 February 2014 that orders Metsä Board to pay EUR 19.7 million in damages to UPM Kymmene Corporation. In a judgment issued in June 2015, the District Court rejected Metsä Board’s petition. Metsä Board appealed the decision of the District Court to the Court of Appeal. The Court of Appeal dismissed Metsä Board’s appeal on 21 October 2016. Metsä Board has applied for leave to appeal the matter to the Supreme Court.
In the autumn of 2015, the Finnish Tax Administration gave an opinion against the deductibility of certain losses in Metsä Board’s 2014 taxation. Metsä Board has appealed against the decision issued by the Tax Administration, as the company believes the losses are deductible.
SHARES
At the end of the financial period, the price for Metsä Board’s B share on the Nasdaq Helsinki was EUR 7.15. The share’s highest and low-est prices in 2017 were EUR 7.36 and EUR 5.34, respectively. At the end of the financial period, the price for Metsä Board’s A share on the Nasdaq Helsinki was EUR 7.13. The share’s highest and lowest prices in 2017 were EUR 7.28 and EUR 5.43, respectively. In 2017, the aver-age daily trading volumes of the B and A shares on the Nasdaq Helsinki were 688,995 shares and 5,944 shares, respectively. The total trading volumes of the B and A shares were EUR 1,101.6 million and EUR 9.5 million, respectively.
In addition to the Nasdaq Helsinki, Metsä Board’s shares are traded on other marketplaces, such as Chi-X and BATS. The Nasdaq Helsinki’s share of total trading during the financial period was 73 per cent.
At the end of the financial period, there were 35,886,682 A shares and 319,626,064 B shares.
YEAR 2017
REPORT OF THE BOARD OF DIRECTORS
GROUP ACCOUNTS
SHARES AND SHAREHOLDERS
PARENT COMPANY ACCOUNTS
AUDITOR’S REPORT
GOVERNANCE KEY FIGURES
INVESTOR INFORMATION

24 FINANCIAL STATEMENTS 2017 – REPORT OF THE BOARD OF DIRECTORS 2017
At the end of the financial period, the market value of all Metsä Board’s shares was EUR 2,539.6 million, of which the market value of the B shares was EUR 2,283.7 million, and that of the A shares was EUR 255.9 million. At the end of the year, Metsäliitto Cooperative owned 42 per cent of the shares, and the voting rights conferred by these shares amounted to 61 per cent. At the end of the year, inter-national and nominee-registered investors held 20 per cent of all the shares (31 December 2016: 15%).
In 2017, a total of 8,969 of Metsä Board Corporation’s A shares were converted to B shares. At the end of the year, the total number of Metsä Board shares was 355,512,746, of which 35,886,682 were A shares and 319,626,064 were B shares.
The company does not hold any treasury shares.
CHANGES IN THE CORPORATE MANAGEMENT TEAM
Ms Sari Pajari, M.Sc. (Eng.), was appointed Metsä Board’s SVP, Sales and Marketing, on 6 June 2017. Her previous area of responsibility in the Corporate Management Team was business development. Mr Seppo Puotinen, the Corporate Management Team member previously in charge of marketing and sales, left the company.
Mr Harri Pihlajaniemi, M.Sc. (Eng.), took up his position as Metsä Board’s SVP, Production, and a member of the Corporate Management Team on 6 September 2017.
As of 6 September 2017, the area of responsibility of Mr Ari Kiviranta, D.Sc. (Tech.), previously in charge of production and tech-nology, has included research, product development and technology, as well as business development.
Pajari, Pihlajaniemi and Kiviranta report to Mr Mika Joukio, CEO of Metsä Board.
RESEARCH AND DEVELOPMENT
The main objectives of Metsä Board’s research and development activi-ties are the production of increasingly lightweight folding boxboards and linerboards, as well as the development of new products for the food service packaging segment. The company’s Better with Less concept, launched in 2017, aims to promote packaging solutions that create better consumer experiences with less environmental impact. Metsä Board works in close cooperation with international brand own-ers to ensure that all essential factors are taken into account in product development.
Metsä Board’s own extrusion coating line for PE-coated products started up at Husum in 2017. The company is continuing to develop other barrier solutions, and is investigating the exploitation of disper-sion coating and biobased coating solutions as well as their commercial potential.
After the review period, Metsä Board launched an innovative biobased, biodegradable paperboard with a special barrier treatment, mainly for use in food service packaging. On top of the sustainability benefits of this new product also offers efficiencies in printing and converting.
Metsä Board is meeting the increasingly strict international require-ments for product safety by developing its operations and training its personnel on a continuous basis. The raw material purchasing system taken into use in 2017 improves the processing of product safety information in the supply chain, all the way up to the customer. As
Europe’s leading producer of fresh fibre paperboard, Metsä Board wants to ensure that the paperboards and pulps it produces keep on meeting even the strictest purity and product safety requirements in the future. All of Metsä Board’s mills are certified according to the ISO 22000 or FSSC 22000 food safety management system standards. The systems serve to ensure product safety in demanding uses, such as direct contact with foodstuffs.
Metsä Board’s own experts actively develop innovative packaging solutions, which allow for the increasingly better use of paperboard packaging based on the unique properties of fresh fibre. Among other things, the solutions aim to replace the use of plastic as a packaging material. Metsä Board’s packaging materials and solutions have gained wide international recognition, and the company has applied for pat-ents and industrial design rights for many of its solutions.
Metsä Board’s research and development costs in 2017 were approxi-mately EUR 5.5 million (6.3), or approximately 0.3 per cent (0.4) of net sales.
REPORT ON NON-FINANCIAL KEY FIGURES
BUSINESS MODEL
Metsä Board produces high-quality, lightweight and safe fresh fibre paperboards. The company’s main products are folding boxboard and food service paperboard, as well as white kraftliner. Metsä Board’s mills are located in Finland and Sweden, where the most important raw material – wood – is close. The annual capacity for folding boxboard and food service paperboard is 1,330,000 tonnes, and the annual capac-ity for white kraftliner is 690,000 tonnes. Metsä Board’s customers in the folding boxboard business include international brand owners, con-verters and merchants. White kraftliner is sold primarily to producers of corrugated packaging. The company sells its products to more than a hundred countries. In 2017, some 72 per cent of Metsä Board’s net sales originated from the EMEA region, 19 per cent from the Americas and 9 per cent from the APAC region.
Metsä Board is part of Metsä Group, the parent company of which is Metsäliitto Cooperative. Metsäliitto Cooperative holds 41.5 per cent of Metsä Board’s shares and 61.4 per cent of the voting rights conferred by shares. Metsä Board, on the other hand, owns 24.9 per cent of its associated company, Metsä Fibre. In addition to pulp production, the holding in Metsä Fibre secures Metsä Board’s self-sufficiency in pulp and guarantees that the pulp is of the right quality. The excess market pulp is sold primarily to Europe and Asia. Metsä Board’s wood supply is managed centrally through Metsäliitto Cooperative (Metsä Forest) from Finland, Sweden, the Baltic countries and Russia. The majority of wood used in Finland comes from forests owned by Metsäliitto Cooperative’s owner-members. Metsä Board employs approximately 2,350 people in 17 countries.
SUSTAINABILITY PRINCIPLES
Sustainability and responsibility for the environment are integral parts of Metsä Board’s day-to-day operations and management. Sustainability goals have been divided into three categories: (i) Wood and Supply Chain, (ii) Energy, Climate and Resource Efficiency, and (iii) Ethical Business Operations and Personnel Well-being. The indicators for the
YEAR 2017
REPORT OF THE BOARD OF DIRECTORS
GROUP ACCOUNTS
SHARES AND SHAREHOLDERS
PARENT COMPANY ACCOUNTS
AUDITOR’S REPORT
GOVERNANCE KEY FIGURES
INVESTOR INFORMATION
REPORT OF THE BOARD OF DIRECTORS 2017 – FINANCIAL STATEMENTS 2017 25
personnel’s well-being are yearly, and the targets related to emissions, for instance, are set for 2020.
In addition to promoting sustainability, Metsä Board is committed to the mitigation of climate change, the continuous improvement of its activities, and responsible business operations. In addition to its own operations, Metsä Board is committed to promoting sustainability throughout the supply chain. Further information on Metsä Board’s responsibility is available in Metsä Group’s Sustainability Report at www.metsagroup.com/en/sustainability.
THE ENVIRONMENT
Megatrends such as population growth and urbanisation are increasing trade and, simultaneously, the use of packaging. At the same time, the requirements for packaging are increasing: product safety and purity, particularly in food packaging, and the recyclability of packaging are becoming increasingly important. The company’s Better with Less con-cept aims to promote packaging solutions that create better consumer experiences with less environmental impact. Lightweight paperboards are resource-efficient: producing them requires less energy, water and raw materials than the production of traditional paperboards. They also generate less waste.
The wood raw material used by Metsä Board is 100 per cent tracea-ble and always originates from either certified or controlled, responsibly managed forests (PEFC Chain of Custody/FSC Chain of Custody). In 2017, the company used a total of 8.2 million cubic metres (7.9) of wood, of which 80 per cent (81) came from certified forests.
Metsä Board is continuously looking for ways to reduce emissions into the air and water, improve energy efficiency, and make more effi-cient use of water in its processes. The improvement measures include optimising equipment, processes and operating methods, as well as making investments.
In 2009–2017, Metsä Board’s energy efficiency has improved by 10.2 per cent. At the same time, the amount of fossil-based CO2 emis-sions per tonne produced has reduced by 47 per cent. In 2017, 52 per cent of the energy used by Metsä Board was renewable (51). Metsä Board’s water consumption in 2017 was 68.6 million cubic metres (70.3), of which surface water made up more than 99 per cent. The use of process water per tonne produced has reduced by 17 per cent in 2010–2017.
In 2017, CDP, the non-profit global, environmental disclosure platform, selected Metsä Board on its Climate A list for the company’s transparency in reporting its environmental impact and for its activities resulting in the reduction of fossil CO2 emissions. For the third time, CDP also included Metsä Board on its global Water A list as recogni-tion for its responsible use of water. Metsä Board was also awarded Leadership status in the materials sector of CDP’s forest programme.
EcoVadis, which operates a reporting platform allowing companies to assess the environmental and social performance of its suppliers on a global basis, gave Metsä Board’s sustainability practices Gold rating in 2017. Metsä Board was included among the top 1 per cent in EcoVadis’s supplier assessment across all of the categories – environment, labour practices, sustainable procurement and fair business practices.
All of Metsä Board’s mills employ the management and monitoring systems required for food safety, in addition to quality, environmental and energy-efficiency management systems.
No significant deviations resulting in significant environmental impact occurred in Metsä Board’s production units during the year under review. Some short-term deviations from permit limits were nevertheless recorded.
Metsä Board has environmental liabilities related to former opera-tions at sites that have since been closed, sold or leased, as well as at decommissioned landfill sites. Financial provisions for the cost of land rehabilitation work have been made in cases where it has been possible to measure the company’s liability for land contamination.
Metsä Board’s environmental liabilities in 2017 totalled EUR 5.6 million (6.2), and its environmental expenses amounted to EUR 15.9 million (16.4). The environmental expenses consist mainly of expenses related to the use and maintenance of environmental protection equip-ment, expenses related to waste management and environmental insur-ance, and depreciation of capitalised environmental expenses.
SOCIAL RESPONSIBILITY
Fair leadership that supports growth is an essential aspect of Metsä Board’s strategy. Taking care of the personnel’s well-being and working capacity plays a key role at Metsä Board; the aim is to anticipate pos-sible risks through early support discussions between supervisors and employees, for example. Metsä Board pays special attention to ensuring the availability and retention of competent personnel by means of vari-ous personnel development programmes and successor plans, and by investing in its employer image.
A new extrusion coating line that produces PE-coated paperboards started up at the Husum mill in 2017. In relation to this, the personnel were provided with extensive training related to extrusion coating and PE products. The training was carried out both face-to-face and with the help of e-learning. In the spring of 2017, Metsä Board renewed the key messages in marketing and unified its product and service portfolio. The launch was preceded by extensive internal preparations, in the course of which nearly 750 employees thought about the realisation of the renewed key messages in their daily work and about how they are communicated to customers. The workshops preceding the launch were held at mills and sales units around the world.
Metsä Board’s personnel are committed to their employer: in 2017, the voluntary employee turnover rate was 2.1 per cent (1.7). Metsä Board complies with Metsä Group’s equality policy, the rules of which apply to recruitment, career opportunities, training and rewards, among other things.
Safety at work is very important at Metsä Board, and the measure-ment of safety at work is developed continuously. Over the past few years, special attention has been paid to safety cooperation and the flow of information between mills. In 2017, the lost-time accident frequency (LTA1) per million hours worked was 6.4 (9.0). The most typical reasons for accidents included slips, stumbles and falls.
In 2017, Metsä Board’s mills began deploying the 5S quality system to increase productivity, safety and well-being at work. The first mill to take the system into use was the Simpele mill, while the goal of the other mills is to shift to the 5S system during 2018. Metsä Board’s long-term objective with regard to lost-time accidents is zero. Metsä Board invests in the maintenance of working capacity, which emphasises anticipating possible working capacity risks by directing guidance and support towards risk groups, for instance. In 2017, the rate of absences due to illness was 3.9 per cent (4.1). Every year, Metsä Board conducts
YEAR 2017
REPORT OF THE BOARD OF DIRECTORS
GROUP ACCOUNTS
SHARES AND SHAREHOLDERS
PARENT COMPANY ACCOUNTS
AUDITOR’S REPORT
GOVERNANCE KEY FIGURES
INVESTOR INFORMATION

26 FINANCIAL STATEMENTS 2017 – REPORT OF THE BOARD OF DIRECTORS 2017
its Organisation Functionality Survey, the result of which was 8.09 in 2017. The survey follows a scale of 4–10. The survey gives units a basis for determining their development targets and the related actions.
HUMAN RIGHTS, CORRUPTION AND ANTI-BRIBERY MEASURES
Metsä Board is committed to anti-corruption and anti-bribery work and respecting human rights, both in its own operations and in respect of its partners. Metsä Group has a common, Group-wide process that aims to ensure that the company’s customers and those operating in its supply chain comply with corresponding principles. Metsä Board’s suppliers must also commit to the company’s ethical instructions and sustainability principles. This aims to minimise risks related to corrup-tion, for example, the use of child labour and human rights violations. Suppliers committed to Metsä Board’s ethical instructions covered 89 per cent (87) of the company’s total purchasing in 2017. Thirty-two (42) supplier audits were conducted during the year. In 2017, Metsä Board also concluded an extensive development project for ensuring the responsibility of its partners in the main logistics flows.
Metsä Board’s Code of Conduct and the various policies approved by its Board of Directors aim to ensure that common responsible and ethical ways of working are complied with everywhere in the company. The Code of Conduct is based on values applicable to the entire Metsä Group: responsible profitability, reliability, cooperation and renewal. In 2017, 79 per cent (81) of Metsä Board’s personnel had completed the training related to the Conduct of Conduct.
The company has a notification channel through which employees and third parties can also report any shortcomings they become aware of anonymously, when necessary. All significant reports concerning possible breaches are processed in a special compliance committee. In 2017, the company did not receive any reports or allegations concern-ing discrimination, the use of child labour, bribery or corruption.
THE MOST SIGNIFICANT RISKS AND UNCERTAINTIES
Metsä Board assesses its strategic, operational, financial and liability risks as part of its continuing operations. The risks are reported to the Board of Directors at least twice a year and, if needed, in interim reports and the financial statements bulletin published by the company. In addition, the company carries out risk assessments as part of the annual planning and strategy process. The risk assessment carried out in the annual planning process focuses on identifying sales and cost risks, and the risk assessment in the strategy process reviews risks related to the implementation of the company’s business strategy. Metsä Board’s Corporate Management Team and the Audit Committee of its Board of Directors review the company’s most significant risks regularly as part of their work. The risk assessments carried out in 2017 identified the following risks and uncertainties that have a possible impact on Metsä Board’s financial performance and ability to operate.
UNCERTAINTY IN THE DEVELOPMENT OF THE ECONOMY
Considerable uncertainties still exist in the global economy. If realised, they may result in weakened demand and reduced prices for end products. Central uncertainties include the unpredictability of United States economic and foreign policy, international sanctions concerning Russia, import restrictions imposed by Russia, and the ongoing uncer-
tainty in Europe attributable to the incomplete Brexit negotiations. An end to the long-term growth period in the Chinese economy could also have an effect on demand for Metsä Board’s products and on the growth outlooks for the markets.
CHANGES IN THE OPERATING ENVIRONMENT
Metsä Board operates in an industry where the balance between supply and demand has a significant impact on the demand for and prices of end products. New operators’ entering the market, alternative products or changes in consumer behaviour may have a negative impact on demand for Metsä Board’s paperboards. An increase in competitors’ capacities or the expansion of product ranges may lower the price levels of end products and have a negative effect on Metsä Board’s profit-ability. On the other hand, potential capacity closures in the industry or consolidation of the industry may result in increased prices.
Possible changes in the industrial and trade policies of leading industrialised countries may lead to increased trade restrictions, subdue growth in the world economy, and even reduce global trade flows. Increased protectionism and negative developments in international free trade would, if realised, have a weakening impact on Metsä Board’s result.
Changes in regulations, such as the EU’s climate and environmental policy and increasing new requirements to limit carbon dioxide, sul-phur or other emissions, may increase production costs and weaken the profitability of business.
GEOPOLITICAL RISKS
There are several geopolitical risks and crises in the world, the develop-ment of which have far-reaching consequences on people’s living condi-tions and regional security situations. These include climate change and regional conflicts, the repercussions of which are visible in the world in the migration of people and in terrorism based on extremism. The predictability of these risks is poor, and their effects may also emerge either very rapidly or over a long period of time. There have been, and will continue to be, international sanctions related to the management of these international crises, which may also have a direct or indirect impact on the demand for Metsä Board’s products and, therefore, on its results.
CENTRALISATION OF OPERATIONS IN A LIMITED GEOGRAPHICAL AREA
Seven of Metsä Board’s eight production units are located in Finland, and one of them is located in Sweden. Finland has a history of labour disputes in both the forest industry and the distribution chain of forest industry products. Such labour disputes may have a negative effect on production volumes and customer deliveries. This may impair the company’s competitiveness and profitability. Labour disputes in Sweden may also negatively affect Metsä Board’s production and cus-tomer deliveries and have a negative impact on the company’s business operations.
BUSINESS CONTINUITY RISKS
Large losses, major accidents, natural disasters, environmental damage, serious malfunctions in key information systems, labour disputes and
YEAR 2017
REPORT OF THE BOARD OF DIRECTORS
GROUP ACCOUNTS
SHARES AND SHAREHOLDERS
PARENT COMPANY ACCOUNTS
AUDITOR’S REPORT
GOVERNANCE KEY FIGURES
INVESTOR INFORMATION

REPORT OF THE BOARD OF DIRECTORS 2017 – FINANCIAL STATEMENTS 2017 27
delivery problems of the most important raw materials may interrupt Metsä Board’s business operations and, if prolonged, even cause the loss of customers. The mills have drawn up continuity and recovery plans in preparation for the realisation of such risks. The property and interrup-tion risks of the production units are assessed regularly, and these risks are mainly covered by insurance contracts.
Long-term problems in production, the production chain or in the quality of products may jeopardise the continuity of customer relationships. Should interruptions in production or the production chain continue for a long period of time, the resulting financial losses may be very substantial and result in the permanent loss of customer relationships. The company has prepared continuity and recovery plans in preparation for the realisation of these risks. The property and busi-ness interruption risks of production units are mainly covered through insurance policies.
BUSINESS DEVELOPMENT
The development and growth of Metsä Board’s business requires strategic choices that involve risks. These uncertainties are related to investment decisions, the product range and the selection of customer segments, for example.
Metsä Board’s paperboard capacity has grown significantly over the past few years. Growing the paperboard business and introducing new production to the market are dependent on the successful growth of sales in Europe, and particularly in the Americas. Increasing sales at the global level also involves cost and exchange rate risks.
In 2017, the company took into use its own extrusion coating line, which allows it to expand its paperboard selection for food service packaging. The commercialisation of new products involves uncertain-ties that, should they be realised, could have a negative impact on the demand for Metsä Board’s products and the company’s profitability.
PRICE RISKS OF PRODUCTION AND LOGISTICS COSTS
An unforeseen rise in the price of production inputs important for Metsä Board’s operations (such as wood, energy and chemicals) or availability problems may reduce profitability and threaten the continu-ity of operations. Changes in exchange rates may also have an effect on the costs of some production inputs. Metsä Board works to hedge against this risk by entering into long-term delivery agreements and goods-related derivative contracts. In addition, a steep increase in trans-portation and other logistics costs may have a negative effect on Metsä Board’s profitability. Moreover, any amendments to legislation, regula-tions or taxation related to the most important production inputs may result in significantly increased costs.
LIABILITY RISKS
Metsä Board’s business operations involve various types of liability risks arising from damage to third parties, such as general operational liabil-ity risks, contract risks, environmental risks and product liability risks. These risks are mitigated by way of efficient business processes, agree-ment training, management practices, quality control and transparent operations. Some of the operational liability risks have been hedged with insurance policies.
PERSONNEL AVAILABILITY AND RETENTION
Metsä Board has paid special attention to ensuring the availability and retention of competent personnel by means of various personnel development programmes and successor plans, and by investing in its employer image. Metsä Board also prepares for retirements and other personnel risks through the promotion of multiple skills and working capacity as well as through job rotation.
FINANCIAL AND EXCHANGE RATE RISKS
As a result of increasing regulation in the financial market, the opera-tions of credit and bond markets may become more difficult, which may impact the company’s ability to acquire long-term debt financing at a competitive price. The financial risks are managed in accordance with the treasury policy approved by Metsä Board’s Board of Directors. The purpose is to hedge against considerable financial risks, balance cash flow and give the business units enough time to adjust their opera-tions to the changing conditions.
Metsä Board sells its products in several countries and is therefore susceptible to fluctuations in exchange rates. The US dollar strengthen-ing by 10 per cent against the euro would have a positive impact of approximately EUR 65 million on Metsä Board’s annual operating result. Correspondingly, the Swedish krona strengthening by 10 per cent would have a negative impact of approximately EUR 39 million. The British pound strengthening by 10 per cent would have a positive impact of approximately EUR 7 million. The impact of weakened exchange rates would be the opposite. The sensitivities do not include the impact of hedging.
Metsä Board’s financial risks and their management are described in more detail on pages 63–71 of the 2017 Annual Report.
CREDIT RISKS
The management of credit risks related to commercial operations is the responsibility of Metsä Board’s executive management and Metsä Group’s centralised credit control. Metsä Board’s management deter-mines the limits on credit extended to customers and the applicable terms of payment in cooperation with the centralised credit control. Nearly all credit risks are transferred by means of credit insurance contracts. Metsä Board’s customer credit risk was at a normal level in 2017. The main principles of credit control are defined in the credit guidelines of the risk management policy approved by the company’s Board of Directors.
PREPARING FOR RISKS
The identified risks are monitored, continuously assessed and prepared for in the manner most appropriate for the company. With regard to damage risks, Metsä Board works actively with insurance companies in risk management, for example by regularly executing risk assessments in different areas of the business operations, such as at mills and in the export chain. Production units prepare for interruptions in operations by drawing up continuity and recovery plans. The company’s crisis management plan directs crisis management in the production and operating units.
Some of the risks are borne by the company itself, whereas some of them are selectively transferred by means of, for example, insurance contracts, derivative contracts, and other contract terms and conditions,
YEAR 2017
REPORT OF THE BOARD OF DIRECTORS
GROUP ACCOUNTS
SHARES AND SHAREHOLDERS
PARENT COMPANY ACCOUNTS
AUDITOR’S REPORT
GOVERNANCE KEY FIGURES
INVESTOR INFORMATION

28 FINANCIAL STATEMENTS 2017 – REPORT OF THE BOARD OF DIRECTORS 2017
to be borne by insurance companies, banks and other counterparties. The most common damage risks are mainly covered by the following comprehensive global insurance contracts:– property and business interruption insurance– general third-party and product liability insurance– liability insurance for directors and officers– credit insurance– carriage loss insurance.
Metsä Board’s risks and risk management are described in more detail in the prospectus concerning the bond issued in 2017 and in the 2017 Corporate Governance Statement.
GOVERNANCE
Metsä Board’s statutory administrative bodies are the Annual General Meeting, the Board of Directors and the CEO. The Board of Directors has general authority and, accounting for the scope and quality of the company’s operations, it is responsible for matters that are strategic, far-reaching and unusual in nature, and therefore not part of the company’s day-to-day business operations. The CEO, supported by the Corporate Management Team, the members of which are not members of the Board of Directors, is responsible for management of the company’s operations. The tasks and responsibilities of the different administra-tive bodies are determined in accordance with the Finnish Limited Liability Companies Act.
Metsä Board’s Board of Directors has nine members, two of whom are women. A majority of Board members (six of nine) are independent of both the company and its biggest shareholders. Three members of the Board of Directors are not independent of Metsäliitto Cooperative. During the 2017 financial period, the Board of Directors held a total of 15 meetings, at which the attendance of Board members was 100 per cent (98 per cent in 2016). Metsä Board’s Board of Directors has determined the principles applicable to the diversity of the Board. The realisation of the principles is reported on yearly, in the company’s Corporate Governance Statement. The Corporate Governance Statement has been given as a separate report, issued and published simultaneously with the financial statements and this Report of the Board of Directors.
DECISIONS MADE AT THE 2017 ANNUAL GENERAL MEETING
Metsä Board’s Annual General Meeting held on 23 March 2017 adopted the company’s financial statements for the financial year 2016 and decided to distribute a dividend of EUR 0.19 per share.
The Annual General Meeting decided to raise the Board of Directors’ annual remuneration by 8 per cent in such a way that the Chair of the Board of Directors is paid annual remuneration of EUR 95,000, the Deputy Chair is paid EUR 80,000 and each member of the Board is paid EUR 62,500, and that a meeting fee of EUR 700 will be paid for each meeting of the Board and a committee of the Board that a member attends. The Annual General Meeting decided to pay roughly half of the remuneration in the form of the company’s B shares acquired through public trading. Furthermore, the Annual General Meeting
decided to pay the Chair of the Audit Committee monthly remunera-tion of EUR 800.
The Annual General Meeting confirmed the number of members of the Board of Directors as nine (9) and elected the following individuals to the Board of Directors: Martti Asunta, Kari Jordan, Kirsi Komi, Kai Korhonen, Liisa Leino, Jussi Linnaranta, Juha Niemelä, Veli Sundbäck and Erkki Varis. At its constitutive meeting, the Board of Directors elected Kari Jordan as Chair and Martti Asunta as Deputy Chair.
Authorised Public Accountants KPMG Oy Ab was elected as Metsä Board’s auditor, with APA Raija-Leena Hankonen as the principal auditor. The term of office of the auditor expires at the end of the next Annual General Meeting.
Metsä Board published a stock exchange release on the decisions made by the Annual General Meeting and the constitution of the Board of Directors on 23 March 2017. More detailed information on the deci-sions of the Annual General Meeting and introductions of the Board members is available on Metsä Board’s website at: www.metsaboard.com/Investors/General-Meeting.
NEAR-TERM OUTLOOK
Growth in the demand for high-quality consumer packaging paper-board made from fresh fibre is expected to continue in market areas important for Metsä Board. The market prices of folding boxboard and white kraftliners in local currencies are expected to rise as a result of the price increases announced in 2017. Metsä Board aims to further improve the average price of Husum’s folding boxboard and increase sales in North America.
The weakening of the US dollar against the euro, including the impact of hedges, will have a negative effect on the operating result in at least the first half of the year.
The rainy and mild weather in last autumn and early winter has made the situation in the wood supply tougher. For now, the weaker availability of wood has not led to production curtailments at Metsä Board.
Production costs in 2018 are expected to rise from the previous year. Wood prices are expected to increase, particularly in Sweden and the Baltic countries. In addition, the general cost inflation has accelerated slightly.
BOARD OF DIRECTORS’ PROPOSAL FOR DISTRIBUTION OF PROFIT
The distributable funds of the parent company on 31 December 2017 were EUR 529.0 million, of which the retained earnings for the finan-cial year are EUR 144.1 million.
The Board of Directors proposes to the Annual General Meeting to be held on 27 March 2018 that a dividend of EUR 0.21 per share, or a total of EUR 74.7 million, be paid for the 2017 financial period.
The dividend will be paid to shareholders who are registered in the company’s shareholders register held by Euroclear Finland Oy on the dividend payment record date of 29 March 2018.
The Board of Directors proposes 10 April 2018 as the dividend payment date.
YEAR 2017
REPORT OF THE BOARD OF DIRECTORS
GROUP ACCOUNTS
SHARES AND SHAREHOLDERS
PARENT COMPANY ACCOUNTS
AUDITOR’S REPORT
GOVERNANCE KEY FIGURES
INVESTOR INFORMATION

CONSOLIDATED STATEMENT OF COMPREHENSIVE INCOME – FINANCIAL STATEMENTS 2017 29
EUR million Note 1 JAN–31 DEC 2017 1 JAN–31 DEC 2016
SALES 2, 30 1,848.6 1,720.3
Change in stocks of finished goods and work in progress 5 -3.5 38.5
Other operating income 4, 30 29.3 40.2
Materials and services 5, 30 -1,290.1 -1,249.5
Employee costs 5 -198.0 -211,0
Share of result from associated company 12, 30 58.9 45,0
Depreciation, amortisation and impairment charges 6 -91.6 -102.3
Other operating expenses 5, 30 -146.4 -148.9
OPERATING RESULT 207.1 132.3
Share of result from associated companies and joint ventures 12 0.0 0.1
Net exchange gains/losses 7 -1.1 -4.9
Other financial income 7, 30 1.0 0.8
Interest and other financial expenses 7, 30 -36.2 -26.6
RESULT BEFORE TAX 170.8 101.6
Income taxes 8 -20.3 -11.3
RESULT FOR THE PERIOD 150.5 90.4
OTHER COMPREHENSIVE INCOME
ITEMS THAT WILL NOT BE RECLASSIFIED TO PROFIT OR LOSS 19
Actuarial gains/losses on defined pension plans 4.2 1.3
Income tax relating to items that will not be reclassified -0.7 0.3
Total 3.4 1.6
ITEMS THAT MAY BE RECLASSIFIED TO PROFIT OR LOSS 19
Cash flow hedges 10.6 27,0
Available for sale investments 44.4 -14.2
Translation differences -20.3 -12.3
Share of result from other comprehensive income of associated companies and joint ventures 5.0 -5.6
Income tax relating to components of other comprehensive income -11.0 -2.8
Total 28.6 -7.9
Other comprehensive income, net of tax 32.0 -6.4
TOTAL COMPREHENSIVE INCOME FOR THE PERIOD 182.5 84,0
RESULT FOR THE PERIOD ATTRIBUTABLE TO:
Shareholders of parent company 150.5 90.4
Non-controlling interest - 0,0
150.5 90.4
TOTAL COMPREHENSIVE INCOME FOR THE PERIOD ATTRIBUTABLE TO:
Shareholders of parent company 182.5 84,0
Non-controlling interests - 0,0
182.5 84,0
BASIC AND DILUTED EARNINGS PER SHARE FOR RESULT ATTRIBUTABLE TO SHAREHOLDERS OF PARENT COMPANY, EUR 9 0.42 0.25
CONSOLIDATED STATEMENT OF COMPREHENSIVE INCOME
The notes are an integral part of the financial statements.
YEAR 2017
REPORT OF THE BOARD OF DIRECTORS
GROUP ACCOUNTS
SHARES AND SHAREHOLDERS
PARENT COMPANY ACCOUNTS
AUDITOR’S REPORT
GOVERNANCE KEY FIGURES
INVESTOR INFORMATION
CONSOLIDATED STATEMENT OF COMPREHENSIVE INCOME | BALANCE SHEET | STATEMENT OF CHANGES IN SHAREHOLDERS’ EQUITY | CASH FLOW STATEMENT | NOTES

30 FINANCIAL STATEMENTS 2017 – CONSOLIDATED BALANCE SHEET
31 DEC 2016EUR million Note 31 DEC 2017
ASSETS
NON-CURRENT ASSETS
Goodwill 10 12.4 12.4
Other intangible assets 10 14.2 14.7
Tangible assets 11, 31 788.6 829.8
Investments in associated companies and joint ventures 12 324.4 291.6
Available for sale investments 12, 13, 26 240.3 195.9
Other non-current financial assets 14, 26 18.4 16.3
Derivative financial instruments 25, 26 5.0 2.6
Deferred tax receivables 15 4.3 4.3
1,407.5 1,367.7
CURRENT ASSETS
Inventories 16 322.9 332.5
Accounts receivables and other receivables 17, 22, 26, 30 273.1 265.3
Current income tax receivables 0.2 5.2
Derivative financial instruments 25, 26 7.3 2.9
Cash and cash equivalent 18, 22, 26, 30 215.1 220.6
818.6 826.5
TOTAL ASSETS 2,226.1 2,194.2
SHAREHOLDERS’ EQUITY AND LIABILITIES
EQUITY ATTRIBUTABLE TO SHAREHOLDERS OF PARENT COMPANY 19
Share capital 557.9 557.9
Translation differences -17.8 3.2
Fair value and other reserves 164.3 114.7
Reserve for invested unrestricted equity 383.1 383.1
Retained earnings 79.9 -6.4
1,167.4 1,052.5
NON-CONTROLLING INTERESTS 0.0 0.0
TOTAL SHAREHOLDERS’ EQUITY 1,167.3 1,052.5
NON-CURRENT LIABILITIES
Deferred tax liabilities 15 86.1 74.7
Post employment benefit obligations 20 14.5 15.1
Provisions 21, 31 6.1 6.9
Borrowings 22, 25, 26 534.5 469.0
Other liabilities 23, 25, 26 0.2 0.1
Derivative financial instruments 25, 26 0.5 1.7
641.9 567.5
CURRENT LIABILITIES
Provisions 21, 31 1.3 3.0
Current borrowings 22, 25, 26, 30 42.5 219.1
Accounts payable and other liabilities 24, 25, 26, 30 363.0 333.2
Current income tax liabilities 9.7 5.9
Derivative financial instruments 25, 26 0.3 13.0
416.9 574.2
TOTAL LIABILITIES 1,058.7 1,141.7
TOTAL SHAREHOLDERS’ EQUITY AND LIABILITIES 2,226.1 2,194.2
CONSOLIDATED BALANCE SHEET
The notes are an integral part of the financial statements.
YEAR 2017
REPORT OF THE BOARD OF DIRECTORS
GROUP ACCOUNTS
SHARES AND SHAREHOLDERS
PARENT COMPANY ACCOUNTS
AUDITOR’S REPORT
GOVERNANCE KEY FIGURES
INVESTOR INFORMATION
CONSOLIDATED STATEMENT OF COMPREHENSIVE INCOME | BALANCE SHEET | STATEMENT OF CHANGES IN SHAREHOLDERS’ EQUITY | CASH FLOW STATEMENT | NOTES

STATEMENT OF CHANGES IN SHAREHOLDERS’ EQUITY – FINANCIAL STATEMENTS 2017 31
Equity attributable to shareholders of parent company
EUR million NoteShare
capitalTranslationdifferences
Fair value and other
reserves
Reserve for invested
unrestricted equity
Retainedearnings Total
Non- controlling
interest Total
Shareholders' equity, 1 Jan 2016 557.9 14.2 111.7 383.1 -38.0 1,028.9 0.0 1,028.9
Result for the period 90.4 90.4 0.0 90.4
Other comprehensive income net of tax 19 -10.9 3.0 1.6 -6.4 -6.4
COMPREHENSIVE INCOME TOTAL -10.9 3.0 91.9 84.0 0.0 84.0
Share based payments 0.0 0.0 0.0
Related party transactions
Dividend distribution -60.4 -60.4 -60.4
SHAREHOLDERS' EQUITY, 31 DEC 2016 557.9 3.2 114.7 383.1 -6.4 1,052.5 0.0 1,052.5
Shareholders' equity, 1 Jan 2017 557.9 3.2 114.7 383.1 -6.4 1,052.5 0.0 1,052.5
Result for the period 150.5 150.5 150.5
Other comprehensive income net of tax 19 -21.0 49.6 3.4 32.0 32.0
COMPREHENSIVE INCOME TOTAL -21.0 49.6 153.9 182.5 0.0 182.5
Share based payments -0.1 -0.1 -0.1
Related party transactions
Dividend distribution -67.5 -67.5 -67.5
SHAREHOLDERS' EQUITY, 31 DEC 2017 557.9 -17.8 164.3 383.1 79.9 1,167.4 0.0 1,167.3
STATEMENT OF CHANGES IN SHAREHOLDERS’ EQUITY
The notes are an integral part of the financial statements.
YEAR 2017
REPORT OF THE BOARD OF DIRECTORS
GROUP ACCOUNTS
SHARES AND SHAREHOLDERS
PARENT COMPANY ACCOUNTS
AUDITOR’S REPORT
GOVERNANCE KEY FIGURES
INVESTOR INFORMATION
CONSOLIDATED STATEMENT OF COMPREHENSIVE INCOME | BALANCE SHEET | STATEMENT OF CHANGES IN SHAREHOLDERS’ EQUITY | CASH FLOW STATEMENT | NOTES

32 FINANCIAL STATEMENTS 2017 – CONSOLIDATED CASH FLOW STATEMENT
1 JAN–31 DEC 2016EUR million Note 1 JAN–31 DEC 2017
CASH FLOW FROM OPERATING ACTIVITIES
Profit for the period 150.5 90.4
Adjustments to the result, total 27 74.6 73.4
Interest received 0.1 0.2
Interest paid -35.7 -22.3
Dividends received 7, 12 31.6 33.0
Other financial items, net -9.3 2.7
Income taxes paid -9.7 -25.8
Change in working capital 27 34.1 -74.5
NET CASH FLOW FROM OPERATING ACTIVITIES 236.3 77.0
CASH FLOW FROM INVESTING ACTIVITIES
Acquisition of associate company shares - -24.9
Acquisition of other shares -1.2 -
Capital expenditure -64.7 -133.5
Proceeds from disposal of shares in subsidiary, net of cash 3, 27 - 1.6
Proceeds from disposal of other shares 0.0 0.1
Proceeds from sale of tangible and intangible assets 5.8 14.4
Increase in non-current receivables -0.3 -0.8
NET CASH FLOW FROM INVESTING ACTIVITIES -60.5 -143.2
CASH FLOW FROM FINANCING ACTIVITIES
Proceeds from non-current interest bearing liabilities 22 269.0 5.9
Payment of non-current interest bearing liabilities 22 -319.4 -44.1
Proceeds from current liabilities, net 22 -62.3 63.0
Change in current interest bearing receivables, net 22 0.0 0.0
Change in non-current non-interest bearing liabilities, net 0.0 -0.1
Dividends paid -67.5 -60.4
NET CASH FLOW FROM FINANCING ACTIVITIES -180.3 -35.7
CHANGE IN CASH AND CASH EQUIVALENTS -4.5 -101.9
Cash and cash equivalents at beginning of period 220.6 321.8
Translation adjustments -1.1 0.7
Changes in cash and cash equivalents -4.5 -101.9
CASH AND CASH EQUIVALENTS AT END OF PERIOD 18 215.1 220.6
CONSOLIDATED CASH FLOW STATEMENT
The notes are an integral part of the financial statements.
YEAR 2017
REPORT OF THE BOARD OF DIRECTORS
GROUP ACCOUNTS
SHARES AND SHAREHOLDERS
PARENT COMPANY ACCOUNTS
AUDITOR’S REPORT
GOVERNANCE KEY FIGURES
INVESTOR INFORMATION
CONSOLIDATED STATEMENT OF COMPREHENSIVE INCOME | BALANCE SHEET | STATEMENT OF CHANGES IN SHAREHOLDERS’ EQUITY | CASH FLOW STATEMENT | NOTES

NOTE TO THE ACCOUNTS 1 – FINANCIAL STATEMENTS 2017 33
NOTES TO THE CONSOLIDATED FINANCIAL STATEMENTS
1. ACCOUNTING PRINCIPLES
The presentation of the Group’s accounting principles and key esti-mates and judgements has been made more informative by moving them to be presented in conjunction with each note. Financial state-ment presentation format will be further developed in 2018.
MAIN OPERATIONS
Metsä Board Corporation and its subsidiaries comprise a forest indus-try group. After Metsä Board’s uncoated paper production ended in July 2016, the remaining business operations of the Group consist solely of folding boxboard, kraftliner and market pulp businesses previously reported under Paperboard segment and complemented by the wallpaper base production at Kyro mill, which was discontinued in September 2016. As the paper business previously reported under Non-core operations segment has been fully discontinued, Metsä Board reports on its financial performance starting from third quarter of 2016 using only one reporting segment.
Metsä Board Corporation is Group’s parent company, which is domiciled in Helsinki. The registered address of the company is Revontulenpuisto 2, 02100 Espoo Finland. The parent company is listed on Nasdaq Helsinki Ltd. At the end of 2017 Metsäliitto Cooperative owned 41.5 per cent of the shares, and the voting rights conferred by these shares were 61.4 per cent.
The copy of the annual report can be obtained from Metsä Board’s website www.metsaboard.com or parent company’s head office at Revontulenpuisto 2, 02100 Espoo Finland.
The Group consolidated financial statements were authorised for issue by the Board of Directors on 8 February 2018. According to Finnish Companies Act shareholders can accept or reject the financial statements in General Meeting of shareholders after date of publica-tion. General Meeting of shareholders also have possibility to decide to change financial statements.
ACCOUNTING POLICIES AND MEASUREMENT PRINCIPLE
Metsä Board Corporation’s consolidated financial statements have been prepared in accordance with the International Financial Reporting Standards (IFRS), applying the IAS and IFRS standards and SIC and IFRIC interpretations that were effective and approved by the EU at the date of the financial statements 31 December 2017. International Financial Reporting Standards refer to the standards and their interpre-tations approved for use in the EU by the Finnish Accounting Act and the regulations set out pursuant to it in accordance with the procedure defined in the EU regulation (EC) no. 1606/2002. The notes to the consolidated financial statements also comply with the requirements of Finnish accounting and company legislation supplementing the IFRS regulations.
The consolidated financial statements are presented in millions of euros, unless otherwise noted.
These financial statements have been prepared based on original acquisition costs, excluding available-for-sale financial assets, financial assets to be recognised at fair value through profit and loss, hedged
items in fair value hedging and share-based business operations settled by means of cash, which have been recognised at fair value.
GOING CONCERN
According to assessment by the management, the Group has sufficient resources to continue as a going concern in the foreseeable future. Consequently, the group has prepared the financial statements on a going concern basis.
NEW AND AMENDED STANDARDS APPLIED IN THE 2017 FINANCIAL YEAR
Amendments to IAS 7 STATEMENT OF CASH FLOWS: DISCLOSURE INI-
TIATIVE. The purpose of the amendment is to enable users of financial statements to evaluate changes in liabilities arising from financing activities, including both changes arising from cash flows and non-cash changes. The amendment to the standard will have an effect on the notes to the financial statements.
Other amended standards will not have a significant effect on the consolidated financial statements.
NEW AND AMENDED STANDARDS AND INTERPRETATIONS TO BE
APPLIED IN FUTURE FINANCIAL PERIODS
Metsä Board has not yet applied the following new or amended stand-ards or interpretations issued by the IASB.
*= The standard had not been adopted by the EU by 31 December 2017.
IFRS 15 REVENUE FROM CONTRACTS WITH CUSTOMERS (effective for financial periods beginning on or after 1 January 2018): The new standard will replace the current IAS 18 and IAS 11 standards and the related interpretations. IFRS 15 includes five-step guidelines on recog-nising revenue in terms of amount and timing. Revenue is recognised as control is transferred, either over time or at a point in time. The standard also increases the amount of information to be presented in the notes to the financial statements.
During 2016, the Group assessed the effects of IFRS 15 Revenue from Contracts with Customers on the amount and timing of revenue recognition. The assessment concerned key product and customer groups in terms of the Group’s sales of products and services. The key principles of the standard and their effects on the Group are described below.
Identifying performance obligation: The standard requires the performance obligations included in a sales contract to be identified, and contractual transaction prices to be allocated to these obligations. Performance obligations arising from the Group’s sales contracts are mainly order-driven customer deliveries related to the sale of goods. Services mostly have an ancillary role in the Group’s business opera-tions, or they complement deliveries of goods. The changes to the identification of performance obligations provided in the standard do not have an effect on the current accounting policies applied to the identification of performance obligations by the Group.
Determining and allocating the transaction price: According to the standard, the transaction price is the amount that the Group expects
NOTE TO THE ACCOUNTS 1YEAR 2017
REPORT OF THE BOARD OF DIRECTORS
GROUP ACCOUNTS
SHARES AND SHAREHOLDERS
PARENT COMPANY ACCOUNTS
AUDITOR’S REPORT
GOVERNANCE KEY FIGURES
INVESTOR INFORMATION
CONSOLIDATED STATEMENT OF COMPREHENSIVE INCOME | BALANCE SHEET | STATEMENT OF CHANGES IN SHAREHOLDERS’ EQUITY | CASH FLOW STATEMENT | NOTES

34 FINANCIAL STATEMENTS 2017 – NOTE TO THE ACCOUNTS 1
to receive in exchange for a fulfilled performance obligation. From this amount, the Group deducts the applicable value added taxes and sales taxes. The prices received by the Group are divided into a fixed part and a variable part, and they do not include a financing component. The variable part consists of various discounts based on, among other things, payment terms and purchased quantities, and is allocated by the Group as deductions from sales revenue in line with estimates of the extent of the discount the customer is deemed to be entitled to. During a financial year, the presentation of the effect of a variable price compo-nent can be based on the management’s judgement of discount drivers; for example, the sales quantity reached with a given customer during the year. The Group’s sales contracts mostly include obligations solely related to deliveries of goods, to which the allocation of the transaction price is uncomplicated. IFRS 15 does not change the principles applied by the Group to the determination or allocation of the transaction price.
Revenue recognition: According to the standard, revenue is recog-nised in the period during which the customer assumes control of the delivered goods. Of the criteria for transfer of control provided in the standard, the transfer of risks and rewards related to the goods sold best applies to the Group’s business operations focusing on the sale of goods. Consequently, the delivery terms applied by the Group in its sales contracts determine the point of time at which the contractual goods are deemed to have been transferred to the customer.
The revenue recognition principles and delivery terms applied by the Group are described in more detail under “Revenue recognition”, and IFRS 15 does not lead to any changes to them.
IFRS 9 FINANCIAL INSTRUMENTS (effective for financial periods beginning on or after 1 January 2018): The new standard replaces IAS 39 Financial Instruments: Recognition and Measurement. IFRS 9 includes revised guidance on the recognition and measurement of financial instruments and new guidelines on hedge accounting. It also includes a new expected credit loss model for calculating impairment of financial assets.
The Group’s recognition and measurement of financial assets will change only slightly, and the change will not have a material effect on the consolidated financial statements. In accordance with IFRS 9, the Group measures at fair value its Pohjolan Voima shares, which it has included in available-for-sale financial assets in accordance with IAS 39, to be recognised in financial assets under other items of comprehensive income, and it measures its other available-for-sale equity financial assets at fair value to be recognised as financial assets through profit and loss. Bringing hedge accounting principles closer to the Group’s risk management practices is seen as a positive development, and IFRS 9 will make it possible to apply hedge accounting to new hedging items and instruments. The change in hedge accounting will not have a mate-rial effect in conjunction with the adoption of IFRS 9.
As of 1 January 2018, the Group will apply a model based on expected credit losses to the determination of impairment of financial assets. Impairment of sales receivables, cash and cash equivalents and investments will be recognised in accordance with this model and the requirements of IFRS 9. The Group believes that the value of the adjustments to equity, sales receivables and other financial assets will be low.
Amendments to IFRS 2 SHARE-BASED PAYMENT - CLARIFICATION
AND MEASUREMENT OF SHAREBASED PAYMENT TRANSACTIONS *
(effective for financial periods beginning on or after 1 January 2018). The amendments clarify the accounting of certain types of business transactions that involve share-based payments. With the amendments,
Metsä Board’s share-based compensation arrangements will be pro-cessed as arrangements settled in shares.
The amendments will be applied non-retrospectively. On the date of transition, the carrying amount of liabilities arising from share-based payments will be transferred to equity.
The amendments will not have a material effect on the consolidated financial statements.
IFRS 16 LEASES* (effective for financial periods beginning on or after 1 January 2019). The new standard replaces IAS 17 and the related interpretations. IFRS 16 requires lessees to recognise lease agreements on the balance sheet as a lease obligation and an asset related to the lease obligation. The nature of expenses related to lease agreements will also change, as IFRS 16 replaces rental expenses with depreciation of assets and interest expenses arising from lease contract liabilities. With the amendment, Metsä Board will recognise its cur-rently valid lease agreements on the balance sheet, with the exception of the contracts qualifying for the exemptions provided in the standard that concern short-term lease agreements and assets of insignificant value. Current rental payments related to non-cancellable other lease agreements are presented as off-balance sheet commitments at nominal value in Note 28 (Commitments and contingencies). At the end of the 2017 financial year, these lease liabilities stood at EUR 11.6 million.
Metsä Board will apply the definition of new leases in accordance with IFRS 16 to new and amended agreements signed during or after the transition period. The company will apply a simplified approach to the adoption of the standard, meaning that the accumulated effect of the adoption will be recognised as an adjustment to retained earnings. The comparison information will not be adjusted.
The new rules will have an effect on the Group’s balance sheet and key figures, and on classifications concerning the income statement and cash flow. The Group will continue the project it started in 2016 concentrating on the implementation of the standard.
Other new or amended standards and interpretations do not have an effect on the consolidated financial statements.
CONSOLIDATION PRINCIPLES
SUBSIDIARIES
In addition to the parent company, Metsäliitto Cooperative, the finan-cial statements include all of the companies controlled by the Group. Intra-Group shareholding is eliminated using the acquisition method. Intra-Group business transactions, receivables, liabilities and unrealised gains, as well as internal distribution of profits, are eliminated on consolidation. Unrealised losses arising from impairment are not elimi-nated. When necessary, the accounting principles applied by subsidiar-ies have been adjusted to comply with the Group’s principles.
The parent company’s owners’ and non-controlling interests’ shares of the result for the period and comprehensive income are presented in the comprehensive income statement. The non-controlling interests’ share of members’ funds is presented as a separate item under equity on the balance sheet.
STRUCTURED ENTITY
Alrec Boiler Oy, a company established for the combustion of Metsä Board’s Kaskinen BCTMP mill’s own concentrate in 2009, has been consolidated as a subsidiary until 27 June 2016. The project was a fixed-term (seven years) product development project. Metsä Board Corporation acquired direct ownership of the combustion facility at Kaskinen and sold its shares in Alrec Boiler Oy to its partner company
NOTE TO THE ACCOUNTS 1YEAR 2017
REPORT OF THE BOARD OF DIRECTORS
GROUP ACCOUNTS
SHARES AND SHAREHOLDERS
PARENT COMPANY ACCOUNTS
AUDITOR’S REPORT
GOVERNANCE KEY FIGURES
INVESTOR INFORMATION
CONSOLIDATED STATEMENT OF COMPREHENSIVE INCOME | BALANCE SHEET | STATEMENT OF CHANGES IN SHAREHOLDERS’ EQUITY | CASH FLOW STATEMENT | NOTES
NOTE TO THE ACCOUNTS 1 – FINANCIAL STATEMENTS 2017 35
in accordance with the shareholder agreement between the parties on 27 June 2016.
JOINT OPERATIONS
A joint operation is a joint arrangement in which parties who have joint control in the arrangement have rights concerning the assets related to the arrangement and obligations concerning liabilities. The Group consolidates its proportion of the assets, liabilities, income and expenses of the joint operation in its financial statements.
ASSOCIATE COMPANIES AND JOINT VENTURES
Associated companies include all companies over which the Group has considerable influence but no control. Significant influence is usually based on a shareholding conferring 20–50 per cent of the voting rights. A joint venture is a joint arrangement in which the parties that have joint control of the arrangement have rights to its net assets. recognised at cost. The Group’s shares in associated companies and joint ventures also include the goodwill measured at the time of acquisition, less any impairment. The Group’s share of the profits or losses of associated companies and joint ventures is recognised in the income statement.
The Group’s share of the profits or losses of associated companies and joint ventures is recognised in the income statement as a separate line item above the operating result in case of associate company Metsä Fibre and below the operating result in case of other associate companies. Correspondingly, the Group’s share of other comprehensive income in associated companies and joint ventures is recognised in its items of other comprehensive income.
A proportion corresponding to the Group’s shareholding is elimi-nated from unrealised profits between the Group and its assciate com-panies and joint ventures. Unrealised losses arising from impairment are not eliminated. When necessary, the accounting principles applied by associated companies and joint ventures have been adjusted to comply with the Group’s principles.
REVENUE RECOGNITION
Sales include income from the sale of goods and services, as well as raw materials and supplies, adjusted for indirect taxes, discounts and other sales adjustment items. Sales of goods are recognised as income when the risks and rewards associated with the ownership of the goods are transferred to the buyer and the Group no longer has rights of pos-session or control over the goods. This usually means the moment at which the goods are delivered to the customer in accordance with the agreed terms of delivery.
The Group’s most frequently used terms of delivery and the related timing of revenue recognition are based on Incoterms 2010:D terms: Delivery of goods to buyer at the agreed destination and at
the agreed time C terms: Handing over the goods to be transported to the agreed
destination by a carrier arranged for by the sellerF terms: Handing over the goods to a carrier arranged for by the buyer
Revenue from the sale of services is recognized when the services have been rendered.
TRANSLATIONS IN FOREIGN CURRENCY
The items included in the financial statements of Group companies are presented in the currency that is used in each company’s primary oper-
ating environment. The consolidated financial statements are presented in euros, which is the parent company’s functional and presentation currency.
Business transactions denominated in foreign currencies are recognised in the operating currency using the exchange rate on the transaction date. At the end of the financial period, open receivables and liabilities denominated in foreign currencies are translated into the functional currency using the exchange rate on the balance sheet date. Any gains or losses resulting from transactions in foreign currencies and from the translation of monetary items are recognised in financial income and expenses.
More information about currency hedging is provided in Note 25 (Management of financial risks).
The income statements of Group companies whose functional currency is not the euro are translated into euros using the average exchange rates of the financial period, and their balance sheets are translated using the exchange rates on the balance sheet date. Changes in translation differences arising from the translation of Group compa-nies’ income statements and balance sheets and from the translation of net investments in foreign entities are recognised in the consolidated comprehensive income statement. In conjunction with divestments of Group companies, either by selling or by dissolving, translation differ-ences accumulated by the time of the divestment are recognised in the income statement as part of the gain or loss from the divestment.
OTHER ACCOUNTING PRINCIPLES
Other accounting principles are presented as part of the relevant Notes.
KEY ESTIMATES AND JUDGEMENTS
The preparation of financial statements requires the use of the manage-ment’s estimates, assumptions and judgement-based decisions that affect the amount of assets and liabilities, the presentation of contin-gent assets and liabilities in the financial statements, and the amount of income and expenses. Even though such estimates and assumptions are based on the management’s best knowledge at the time they were made, it is possible that the actual values differ from those used in the financial statements. In terms of the financial statements, the key areas that involve the management’s estimates and judgement-based decisions are presented in the following notes:
KEY ESTIMATES AND JUDGEMENTS NOTE
Impairment of intangible and tangibles assets
6 Depreciation and impairment
Income taxes 8 Income taxes 15 Deferred taxes
Financial instruments measured at fair value
13 Available-for-sale financial assets
Valuation of inventories 16 Inventories
Valuation of accounts receivables 17 Accounts receivables and other receivables
Pension obligations 20 Pension obligations
Provisions 21 Provisions
Contingent liabilities from legal disputes and claims
28 Commitments and contingencies
YEAR 2017
REPORT OF THE BOARD OF DIRECTORS
GROUP ACCOUNTS
SHARES AND SHAREHOLDERS
PARENT COMPANY ACCOUNTS
AUDITOR’S REPORT
GOVERNANCE KEY FIGURES
INVESTOR INFORMATION
CONSOLIDATED STATEMENT OF COMPREHENSIVE INCOME | BALANCE SHEET | STATEMENT OF CHANGES IN SHAREHOLDERS’ EQUITY | CASH FLOW STATEMENT | NOTES

36 FINANCIAL STATEMENTS 2017 – NOTE TO THE ACCOUNTS 2
2. SEGMENT INFORMATION
ACCOUNTING PRINCIPLES
The Corporate Management Team is the chief operational decision-maker monitoring business operations performance based on the operat-ing segments.
After Metsä Board’s uncoated paper production ended in July 2016, the remaining business operations of the Group consist solely of fold-ing boxboard, kraftliner and market pulp businesses previously reported under Paperboard segment and complemented by the discontinued wallpaper base production at Kyro mill. As the paper business previously reported under Non-core operations segment has been fully discon-tinued, Metsä Board will report on its financial performance using only one reporting segment starting from third quarter of 2016.
In the following tables are presented information of sales, assets and capital expenditure by geographical areas. Geographical sales are reported based on the location of the customer and assets and capital expenditure based on the location of the assets.
GEOGRAPHICAL AREAS
External sales by location of customer
Total non-current assets by country
Capital expenditure by country
EUR million 2017 2016 2017 2016 2017 2016
Germany 162.4 164.5 3.3 3.3 0.0 0.0
Italy 135.7 119.2 0.0 0.0 0.0 -
Finland 127.7 116.1 984.8 923.7 33.6 54.2
Turkey 102.7 67.8 - - - -
United Kingdom 87.7 103.2 11.6 9.3 - -
Russia 81.3 95.3 0.0 0.1 0.0 0.0
Spain 81.1 66.1 0.0 0.0 - -
Sweden 80.5 92.2 397.5 422.9 31.8 107.5
France 71.6 65.6 0.0 0.0 - -
Poland 62.6 60.4 0.0 0.0 0.0 -
The Netherlands 39.6 42.9 - - - -
Norway 34.9 38.2 - - - -
Belgium 19.1 22.9 0.5 0.6 0.1 0.6
Other Europe and Middle East 228.1 227.1 0.0 0.0 - -
USA 279.6 222.3 0.3 0.4 0.0 0.1
Canada 24.4 30.0 - - - -
Asia 134.0 117.4 0.3 0.4 0.0 0.0
Other countries 95.5 69.1 - - - -
Total 1,848.6 1,720.3 1,398.2 1,360.7 65.4 162.4
Non-current assets include all non-current assets with the exception of derivative financial instruments and deferred tax assets.
PERSONNEL AT YEAR END BY COUNTRY
2017 2016
Finland 1,344 1,442
Sweden 719 738
Belgium 62 58
Germany 54 56
USA 51 43
China 35 33
Other countries 86 96
Total 2,351 2,466
AVERAGE PERSONNEL BY COUNTRY
2017 2016
Finland 1,441 1,552
Sweden 732 753
Belgium 60 53
Germany 55 55
USA 48 40
China 34 31
Other countries 86 104
Total 2,456 2,588
There were no customers with revenue exceeding 10 per cent of total Group revenue in 2017 and 2016.
NOTE TO THE ACCOUNTS 2YEAR 2017
REPORT OF THE BOARD OF DIRECTORS
GROUP ACCOUNTS
SHARES AND SHAREHOLDERS
PARENT COMPANY ACCOUNTS
AUDITOR’S REPORT
GOVERNANCE KEY FIGURES
INVESTOR INFORMATION
CONSOLIDATED STATEMENT OF COMPREHENSIVE INCOME | BALANCE SHEET | STATEMENT OF CHANGES IN SHAREHOLDERS’ EQUITY | CASH FLOW STATEMENT | NOTES

NOTES TO THE ACCOUNTS 3–4 – FINANCIAL STATEMENTS 2017 37
3. DISPOSED AND DISCONTINUED OPERATIONS AND NON-CURRENT ASSETS HELD FOR SALE
ACCOUNTING PRINCIPLES
Acquired business operations are consolidated from the time when control is transferred to the Group, and divested opera-tions are consolidated until the time when control is transferred away from the Group.
The consideration paid, including the contingent sales price and the identifiable assets and liabilities of the acquired business operations, are measured at fair value at the time of acquisi-tion. Expenses related to acquisitions are recognised as costs. Depending on the acquisition, the non-controlling interests’ share in the object of the acquisition is recognised at fair value or at the amount that corresponds to the non-controlling interests’ proportion of the net assets of the object of the acquisition.
The amount by which the sum of the consideration paid, the fair value of the non-controlling interests’ share and the fair value of the assets previously owned in the object of the acquisition exceed the fair value of the identifiable net assets is recognised as goodwill.
There were no acquisitions and no assets were classified as held for sale in 2017 or 2016.
Metsä Board sold its share (25.0 per cent) in a structured entity Alrec Boiler Oy consolidated as a subsidiary to group accounts in June 2016 to its partner company Rinheat Oy at a price determined in accordance with the shareholder and option agreements in force between the parties. Cash balance of the sold company at the time of the sale was EUR 7.6 million. The disposal had a total cash flow effect of EUR -5.5 million, of which EUR -2.7 million was presented in net cash flow from financing activities. A disposal loss affecting comparabil-ity of EUR -1.1 million was recognized for the divestment.
In September 2011, Metsä Board divested the 100.0 per cent hold-ing in its Austrian subsidiary M-real Hallein GmbH. The company was paid a EUR 4.4 million earn-out for the sale of subsidiary receivables in connection with the divestment in November 2016. The received earn-out was presented as proceeds from sale of subsidiaries in the consoli-dated statement of cash flows. The earn-out resulted in the reporting of a EUR 4.4 million partial reversal of previously recognized divestment loss as an item affecting comparability.
ALREC BOILER OY, DISPOSED ASSETS
EUR million 2016
Accounts receivables and other receivables, non-interest bearing 0.0
Cash and cash equivalents 7.6
Total assets 7.6
Non-current borrowings 2.7
Accounts payable and other liabilities 1.7
Total liabilities 4.4
Net assets 3.2
Total 3.2
Divestment proceeds received 2.1
Disposal loss before tax -1.1
Income taxes -
Disposal loss after tax -1.1
Disposal loss -1.1
Divestment proceeds received 2.1
Cash and cash equivalents of disposed subsidiary -7.6
Repayment of non-current financial liabilities -2.7
Proceeds from disposal of shares in subsidiary, net of cash -2.8
4. OTHER OPERATING INCOME
EUR million 2017 2016
Gains on disposal 11.5 16.3
Rental income 1.3 1.0
Service revenue 6.0 7.0
Government grants and allowances 0.8 0.3
Scrap and waste sale 0.3 0.1
Other operating income 9.3 15.5
Total 29.3 40.2
Gains on disposal for 2017 consisted mostly of the release to income statement of cumulative translation difference arising from liquida-tion of non-operational English subsidiaries in accordance with IFRS accounting rules and amounting to EUR 10.2 million. The remaining gains comprised EUR 0.6 million gain on sale of electricity certificates by Metsä Board Sverige, EUR 0.3 million gain from sale of emission rights and the total gains of EUR 0.4 million arising from other non-current asset disposals.
Of the disposal gains in 2016, EUR 7.7 million arose from gains on asset sales and EUR 2.6 million from sale of emission rights. The remaining disposal gains comprise EUR 1.6 million income from Metsä Board Sverige’s electricity certificates and EUR 4.4 million earn-out received for sale of subsidiary receivables from M-real Hallein GmbH.
NOTES TO THE ACCOUNTS 3–4YEAR 2017
REPORT OF THE BOARD OF DIRECTORS
GROUP ACCOUNTS
SHARES AND SHAREHOLDERS
PARENT COMPANY ACCOUNTS
AUDITOR’S REPORT
GOVERNANCE KEY FIGURES
INVESTOR INFORMATION
CONSOLIDATED STATEMENT OF COMPREHENSIVE INCOME | BALANCE SHEET | STATEMENT OF CHANGES IN SHAREHOLDERS’ EQUITY | CASH FLOW STATEMENT | NOTES
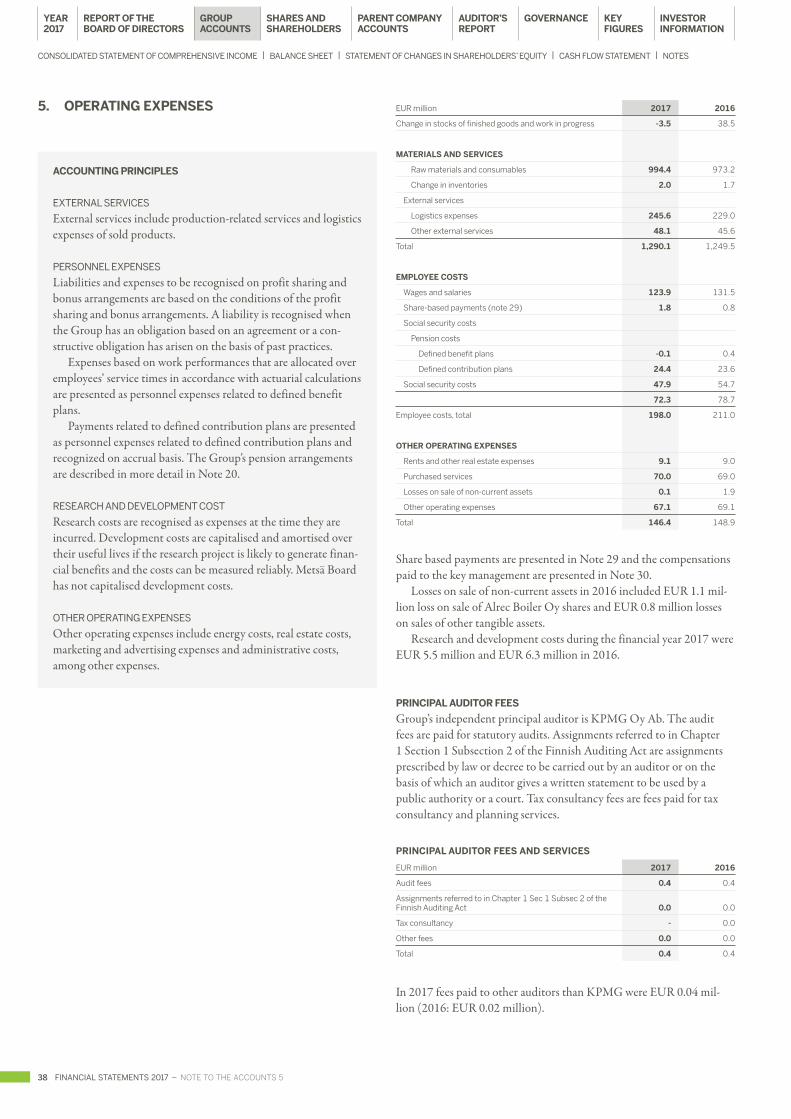
38 FINANCIAL STATEMENTS 2017 – NOTE TO THE ACCOUNTS 5
5. OPERATING EXPENSES
ACCOUNTING PRINCIPLES
EXTERNAL SERVICES
External services include production-related services and logistics expenses of sold products.
PERSONNEL EXPENSES
Liabilities and expenses to be recognised on profit sharing and bonus arrangements are based on the conditions of the profit sharing and bonus arrangements. A liability is recognised when the Group has an obligation based on an agreement or a con-structive obligation has arisen on the basis of past practices.
Expenses based on work performances that are allocated over employees’ service times in accordance with actuarial calculations are presented as personnel expenses related to defined benefit plans.
Payments related to defined contribution plans are presented as personnel expenses related to defined contribution plans and recognized on accrual basis. The Group’s pension arrangements are described in more detail in Note 20.
RESEARCH AND DEVELOPMENT COST
Research costs are recognised as expenses at the time they are incurred. Development costs are capitalised and amortised over their useful lives if the research project is likely to generate finan-cial benefits and the costs can be measured reliably. Metsä Board has not capitalised development costs.
OTHER OPERATING EXPENSES
Other operating expenses include energy costs, real estate costs, marketing and advertising expenses and administrative costs, among other expenses.
EUR million 2017 2016
Change in stocks of finished goods and work in progress -3.5 38.5
MATERIALS AND SERVICES
Raw materials and consumables 994.4 973.2
Change in inventories 2.0 1.7
External services
Logistics expenses 245.6 229.0
Other external services 48.1 45.6
Total 1,290.1 1,249.5
EMPLOYEE COSTS
Wages and salaries 123.9 131.5
Share-based payments (note 29) 1.8 0.8
Social security costs
Pension costs
Defined benefit plans -0.1 0.4
Defined contribution plans 24.4 23.6
Social security costs 47.9 54.7
72.3 78.7
Employee costs, total 198.0 211.0
OTHER OPERATING EXPENSES
Rents and other real estate expenses 9.1 9.0
Purchased services 70.0 69.0
Losses on sale of non-current assets 0.1 1.9
Other operating expenses 67.1 69.1
Total 146.4 148.9
Share based payments are presented in Note 29 and the compensations paid to the key management are presented in Note 30.
Losses on sale of non-current assets in 2016 included EUR 1.1 mil-lion loss on sale of Alrec Boiler Oy shares and EUR 0.8 million losses on sales of other tangible assets.
Research and development costs during the financial year 2017 were EUR 5.5 million and EUR 6.3 million in 2016.
PRINCIPAL AUDITOR FEES
Group’s independent principal auditor is KPMG Oy Ab. The audit fees are paid for statutory audits. Assignments referred to in Chapter 1 Section 1 Subsection 2 of the Finnish Auditing Act are assignments prescribed by law or decree to be carried out by an auditor or on the basis of which an auditor gives a written statement to be used by a public authority or a court. Tax consultancy fees are fees paid for tax consultancy and planning services.
PRINCIPAL AUDITOR FEES AND SERVICES
EUR million 2017 2016
Audit fees 0.4 0.4
Assignments referred to in Chapter 1 Sec 1 Subsec 2 of the Finnish Auditing Act 0.0 0.0
Tax consultancy - 0.0
Other fees 0.0 0.0
Total 0.4 0.4
In 2017 fees paid to other auditors than KPMG were EUR 0.04 mil-lion (2016: EUR 0.02 million).
NOTE TO THE ACCOUNTS 5YEAR 2017
REPORT OF THE BOARD OF DIRECTORS
GROUP ACCOUNTS
SHARES AND SHAREHOLDERS
PARENT COMPANY ACCOUNTS
AUDITOR’S REPORT
GOVERNANCE KEY FIGURES
INVESTOR INFORMATION
CONSOLIDATED STATEMENT OF COMPREHENSIVE INCOME | BALANCE SHEET | STATEMENT OF CHANGES IN SHAREHOLDERS’ EQUITY | CASH FLOW STATEMENT | NOTES

NOTE TO THE ACCOUNTS 6 – FINANCIAL STATEMENTS 2017 39
6. DEPRECIATION, AMORTISATION AND IMPAIRMENT CHARGES
EUR million 2017 2016
DEPRECIATION AND AMORTISATION
Other intangible assets 3.1 3.2
Buildings 6.9 6.8
Machinery and equipment 84.4 84.8
Other tangible assets 1.0 1.0
Total 95.5 95.8
IMPAIRMENT CHARGES AND REVERSED IMPAIRMENT CHARGES
Buildings - 2.1
Machinery and equipment -3.9 4.5
Total -3.9 6.6
Depreciation, amortisation and impairment charges, total 91.6 102.3
A EUR 3.9 million reversal of previously recognized impairment loss on sale of a closed paper machine by Kyro mill was reported during the financial period.
Impairment charges for the financial year 2016 included EUR 8.5 million impairments of tangible assets used in discontinued wallpaper base production at Kyro mill and a EUR 2.0 million reversal of previ-ously recognized impairment on a paper machine sold by Husum mill.
IMPAIRMENT OF ASSETS
ACCOUNTING PRINCIPLES
Depreciation is not recognised for assets with indefinite useful lives. Instead, such assets are tested for impairment annually. Assets that are subject to depreciation are always tested for impairment when events or changes in conditions indicate that it is possible that the monetary amount corresponding to the book value of the assets might not be recoverable.
Cash-generating units are reporting segments or smaller units for which a utility value can be defined.
The recoverable amount is the higher of the fair value of an asset less the cost of sale, and its value in use. Value in use is the estimated future net cash flows, discounted to their present value, expected to be derived from said asset or cash-generating unit.
An impairment loss is recognised if the carrying amount of the asset is higher than its recoverable amount. If the impair-ment loss concerns a cash-generating unit, it is first allocated to decrease the goodwill of the cash-generating unit, and thereafter to decrease the other assets of the unit on pro-rata basis. In con-nection with the recognition of the impairment loss, the useful life of the depreciated asset is re-evaluated. An impairment loss recognised for an asset other than goodwill is reversed if a change has taken place in the estimates used to determine the recoverable amount of the asset.
However, the maximum reversal of an impairment loss amounts to no more than the carrying amount of the asset if no
impairment loss had been recognised. An impairment loss recog-nised on goodwill is not reversed under any circumstances.
KEY ESTIMATES AND JUDGEMENTS
FUTURE CASH FLOWS
The recoverable amounts of cash-generating units are based on calculations of value in use. The management’s key estimates in the calculations concern the product price developments, deliv-ery volumes, currency exchange rates, capacity utilisation rates, and the development of costs related to key raw material costs and other costs, as well as the discount rate.
DISCOUNT RATE
The discount rate used is the weighted average cost of capital (WACC). When calculating the WACC, the cost of debt takes into account the market-based view of the credit risk premium. Both future cash flows and the discount rate are calculated after tax, which means that the established discounted cash flows and values in use are before tax, as set out in IAS 36.
TESTING PRINCIPLES
Metsä Board carries out impairment testing at least once a year, dur-ing the fourth quarter and based on the situation as of 30 September. Additionally, a sensitivity analysis is performed quarterly. Full impair-ment test is initiated if sensitivity analysis indicates possible impair-ment. Audit Committee reviews the results of sensitivity analyses and impairment testing quarterly.
In 2017, the Group did not recognize impairments based on impair-ment testing.
The carrying values of asset items or cash generating units are evaluated for possible impairment. Cash-generating units are operating segments or smaller units for which a recoverable amount can be deter-mined. In 2017 testing, the cash-generating units are Folding boxboard, Liner, and Market Pulp. The cash generating units are the same as in 2016 testing.
If there are indications of impairment of an asset item or cash-generating unit, or if the unit’s carrying amount includes or it has been allocated goodwill, the recoverable amount of the asset or cash-generating unit is measured. The recoverable amount of the asset or cash-generating unit is the value in use based on future cash flows, or fair value less cost to sell. In 2017 testing, all recoverable amounts are based on the value in use of cash-generating units.
The recoverable cash flows for the cash-generating units under test-ing are based on five-year forecasts with subsequent cash flows expected to grow at a constant rate.
The key testing assumptions are Metsä Board management’s esti-mates and projections as well as third party forecasts. The key factors affecting the projections are development of average paper and board prices, delivery volumes, foreign exchange rates, and capacity utilisation rates, cost development of key raw materials such as wood, pulp, chemi-cals and energy, the development of personnel costs and other fixed costs as well as the discount rate. The key factors affecting estimates are similar to those used in 2016 testing.
NOTE TO THE ACCOUNTS 6YEAR 2017
REPORT OF THE BOARD OF DIRECTORS
GROUP ACCOUNTS
SHARES AND SHAREHOLDERS
PARENT COMPANY ACCOUNTS
AUDITOR’S REPORT
GOVERNANCE KEY FIGURES
INVESTOR INFORMATION
CONSOLIDATED STATEMENT OF COMPREHENSIVE INCOME | BALANCE SHEET | STATEMENT OF CHANGES IN SHAREHOLDERS’ EQUITY | CASH FLOW STATEMENT | NOTES
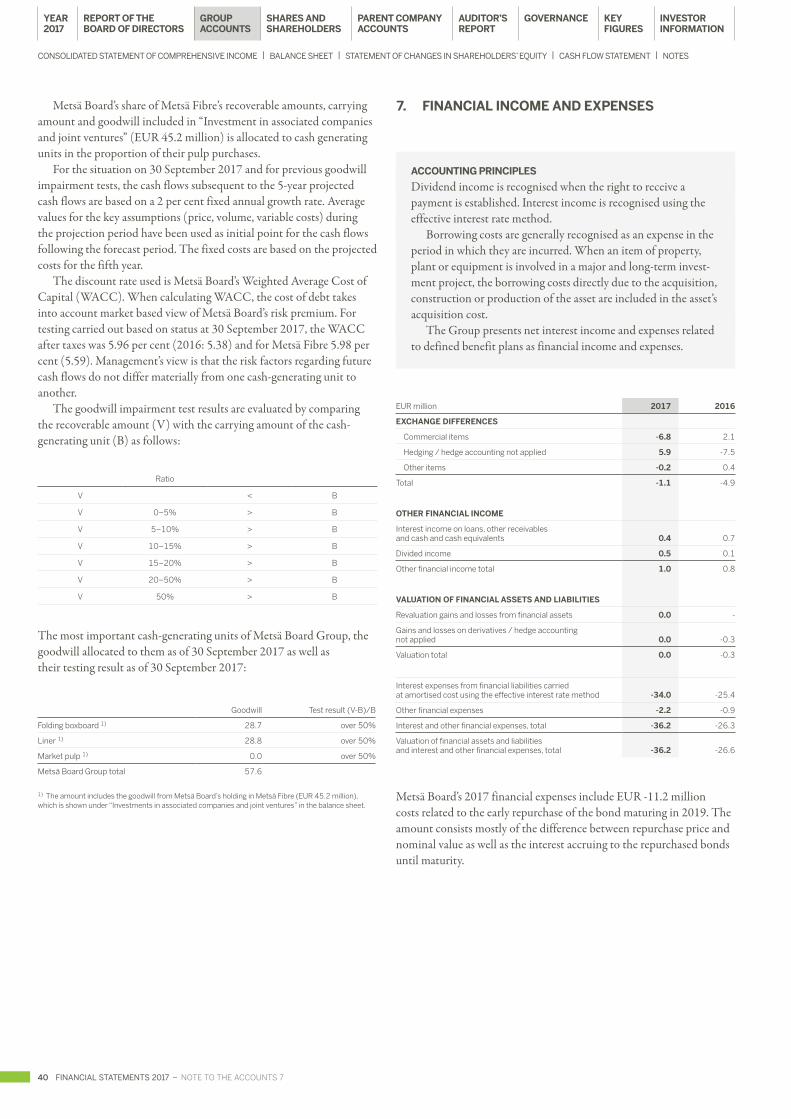
40 FINANCIAL STATEMENTS 2017 – NOTE TO THE ACCOUNTS 7
7. FINANCIAL INCOME AND EXPENSES
ACCOUNTING PRINCIPLES
Dividend income is recognised when the right to receive a payment is established. Interest income is recognised using the effective interest rate method.
Borrowing costs are generally recognised as an expense in the period in which they are incurred. When an item of property, plant or equipment is involved in a major and long-term invest-ment project, the borrowing costs directly due to the acquisition, construction or production of the asset are included in the asset’s acquisition cost.
The Group presents net interest income and expenses related to defined benefit plans as financial income and expenses.
EUR million 2017 2016
EXCHANGE DIFFERENCES
Commercial items -6.8 2.1
Hedging / hedge accounting not applied 5.9 -7.5
Other items -0.2 0.4
Total -1.1 -4.9
OTHER FINANCIAL INCOME
Interest income on loans, other receivables and cash and cash equivalents 0.4 0.7
Divided income 0.5 0.1
Other financial income total 1.0 0.8
VALUATION OF FINANCIAL ASSETS AND LIABILITIES
Revaluation gains and losses from financial assets 0.0 -
Gains and losses on derivatives / hedge accounting not applied 0.0 -0.3
Valuation total 0.0 -0.3
Interest expenses from financial liabilities carried at amortised cost using the effective interest rate method -34.0 -25.4
Other financial expenses -2.2 -0.9
Interest and other financial expenses, total -36.2 -26.3
Valuation of financial assets and liabilities and interest and other financial expenses, total -36.2 -26.6
Metsä Board’s 2017 financial expenses include EUR -11.2 million costs related to the early repurchase of the bond maturing in 2019. The amount consists mostly of the difference between repurchase price and nominal value as well as the interest accruing to the repurchased bonds until maturity.
Metsä Board’s share of Metsä Fibre’s recoverable amounts, carrying amount and goodwill included in “Investment in associated companies and joint ventures” (EUR 45.2 million) is allocated to cash generating units in the proportion of their pulp purchases.
For the situation on 30 September 2017 and for previous goodwill impairment tests, the cash flows subsequent to the 5-year projected cash flows are based on a 2 per cent fixed annual growth rate. Average values for the key assumptions (price, volume, variable costs) during the projection period have been used as initial point for the cash flows following the forecast period. The fixed costs are based on the projected costs for the fifth year.
The discount rate used is Metsä Board’s Weighted Average Cost of Capital (WACC). When calculating WACC, the cost of debt takes into account market based view of Metsä Board’s risk premium. For testing carried out based on status at 30 September 2017, the WACC after taxes was 5.96 per cent (2016: 5.38) and for Metsä Fibre 5.98 per cent (5.59). Management’s view is that the risk factors regarding future cash flows do not differ materially from one cash-generating unit to another.
The goodwill impairment test results are evaluated by comparing the recoverable amount (V) with the carrying amount of the cash-generating unit (B) as follows:
Ratio
V < B
V 0–5% > B
V 5–10% > B
V 10–15% > B
V 15–20% > B
V 20–50% > B
V 50% > B
The most important cash-generating units of Metsä Board Group, the goodwill allocated to them as of 30 September 2017 as well astheir testing result as of 30 September 2017:
Goodwill Test result (V-B)/B
Folding boxboard 1) 28.7 over 50%
Liner 1) 28.8 over 50%
Market pulp 1) 0.0 over 50%
Metsä Board Group total 57.6
1) The amount includes the goodwill from Metsä Board’s holding in Metsä Fibre (EUR 45.2 million), which is shown under “Investments in associated companies and joint ventures” in the balance sheet.
NOTE TO THE ACCOUNTS 7YEAR 2017
REPORT OF THE BOARD OF DIRECTORS
GROUP ACCOUNTS
SHARES AND SHAREHOLDERS
PARENT COMPANY ACCOUNTS
AUDITOR’S REPORT
GOVERNANCE KEY FIGURES
INVESTOR INFORMATION
CONSOLIDATED STATEMENT OF COMPREHENSIVE INCOME | BALANCE SHEET | STATEMENT OF CHANGES IN SHAREHOLDERS’ EQUITY | CASH FLOW STATEMENT | NOTES

NOTE TO THE ACCOUNTS 8 – FINANCIAL STATEMENTS 2017 41
8. INCOME TAXES
ACCOUNTING PRINCIPLES
Tax expenses in the income statement consist of taxes based on the taxable income for the period, taxes for previous periods, and items of deferred tax. The tax effect related to the items recorded in the comprehensive income statement is recognised in the comprehensive income statement. Taxes based on the taxable income for the period are calculated based on taxable income in accordance with the tax rate as it stands in each country at that time. Deferred tax assets and liabilities are calculated on the temporary differences between the carrying amount and the tax base in accordance with the tax rates enacted as at the balance sheet date.
KEY ESTIMATES AND JUDGEMENTS
The management’s judgement is required for determining the taxes based on the result for the period, deferred tax assets and liabilities, and the extent to which deferred tax assets are recorded.
The Group is subject to income taxation in several countries, and the final amount of tax is uncertain for several business oper-ations and calculations. The Group anticipates future tax audits and recognises liabilities based on estimates of whether further taxes will need to be paid. If the associated final tax differs from the originally recorded amounts, the difference has an effect on both the taxes based on the taxable income for the period, and on deferred tax receivables and liabilities.
EUR million 2017 2016
Income taxes for the financial period 18.5 17.0
Income taxes from previous periods 0.1 -0.6
Change in deferred taxes 1.8 -5.1
Other taxes 0.0 0.0
Total 20.3 11.3
INCOME TAX RECONCILIATION
EUR million 2017 2016
Result before taxes 170.8 101.6
Calculated tax at Finnish statutory rate of 20.0% 34.2 20.3
Effect of difference between Finnish and non-Finnish tax rates -0.3 -0.5
Tax exempt income -2.2 -0.9
Non-deductible expenses 0.4 0.3
Previous years tax losses on which no deferred tax asset has been recognized used during period - 0.0
Adjustments to previously recognised deferred taxes - 1.7
Losses from subsidiaries, on which no deferred tax asset has been recognised 0.1 0.1
Share of result from associated companies and joint ventures -11.8 -9.0
Income taxes from previous periods 0.1 -0.6
Other -0.1 0.0
Income tax expense 20.3 11.3
Effective tax rate, % 11.9 11.1
In the autumn of 2015, the Finnish Tax Administration took a stand against the deductibility of certain losses in Metsä Board’s 2014 taxa-tion. Metsä Board has appealed against the decision issued by the Tax Administration, as the company believes the losses are deductible. Metsä Board has not recognized a deferred tax asset on the contested losses.
THE INCOME TAX RELATED TO COMPONENTS OF OTHER COMPREHENSIVE INCOME 2017
EUR million Before taxes Taxes After taxes
Items that will not be reclassified to profit or loss
Actuarial gains/losses on defined pension plans 4.2 -0.7 3.4
Items that may be reclassified to profit or loss
Cash flow hedges 10.6 -2.2 8.4
Available for sale investments 44.4 -8.9 35.5
Share of other comprehensive income of associated companies 5.7 - 5.7
Translation differences -20.3 - -20.3
Share of other comprehensive income of associated companies, translation differences -0.6 - -0.6
Total 39.6 -11.0 28.6
Other comprehensive income, net of tax 43.8 -11.8 32.0
THE INCOME TAX RELATED TO COMPONENTS OF OTHER COMPREHENSIVE INCOME 2016
EUR million Before taxes Taxes After taxes
Items that will not be reclassified to profit or loss
Actuarial gains/losses on defined pension plans 1.3 0.3 1.6
Items that may be reclassified to profit or loss
Cash flow hedges 27.0 -5.7 21.3
Available for sale investments -14.2 2.8 -11.4
Share of other comprehensive income of associated companies -6.9 - -6.9
Translation differences -12.3 - -12.3
Share of other comprehensive income of associated companies, translation differences 1.3 - 1.3
Total -5.1 -2.8 -7.9
Other comprehensive income, net of tax -3.8 -2.5 -6.4
NOTE TO THE ACCOUNTS 8YEAR 2017
REPORT OF THE BOARD OF DIRECTORS
GROUP ACCOUNTS
SHARES AND SHAREHOLDERS
PARENT COMPANY ACCOUNTS
AUDITOR’S REPORT
GOVERNANCE KEY FIGURES
INVESTOR INFORMATION
CONSOLIDATED STATEMENT OF COMPREHENSIVE INCOME | BALANCE SHEET | STATEMENT OF CHANGES IN SHAREHOLDERS’ EQUITY | CASH FLOW STATEMENT | NOTES

42 FINANCIAL STATEMENTS 2017 – NOTE TO THE ACCOUNTS 9
NOTE TO THE ACCOUNTS 9
9. EARNINGS PER SHARE
ACCOUNTING PRINCIPLES
Undiluted earnings per share are calculated using the weighted average number of shares during the reporting period. In calculat-ing earnings per share adjusted for the effect of dilution, the average number of shares is adjusted for the dilution effect of any equity instruments that have been issued. In calculating earnings per share, earnings are taken to be the reported earnings attribut-able to the parent company’s shareholders.
2017 2016
RESULT FOR THE PERIOD ATTRIBUTABLE TO SHARE-HOLDERS OF PARENT COMPANY, EUR MILLION 150.5 90.4
Adjusted number of shares (average) in thousands 355,513 355,513
Basic and diluted earnings per share, EUR 0.42 0.25
YEAR 2017
REPORT OF THE BOARD OF DIRECTORS
GROUP ACCOUNTS
SHARES AND SHAREHOLDERS
PARENT COMPANY ACCOUNTS
AUDITOR’S REPORT
GOVERNANCE KEY FIGURES
INVESTOR INFORMATION
CONSOLIDATED STATEMENT OF COMPREHENSIVE INCOME | BALANCE SHEET | STATEMENT OF CHANGES IN SHAREHOLDERS’ EQUITY | CASH FLOW STATEMENT | NOTES

NOTE TO THE ACCOUNTS 10 – FINANCIAL STATEMENTS 2017 43
NOTE TO THE ACCOUNTS 10
10. INTANGIBLE ASSETS
ACCOUNTING PRINCIPLES
GOODWILL
Goodwill arising from the merging of business operations is recog-nised as the amount by which the sum of the consideration paid, the non-controlling interests’ share in the object of the acquisition and the previous holding exceed the fair value of the acquired net assets.
Goodwill is not amortised. Instead, it is tested for impairment annually and always when there is an indication of a decrease in value. Goodwill is therefore allocated to cash-generating units for impairment testing. Goodwill is recognised at original acquisition cost less accumulated impairment losses.
OTHER INTANGIBLE ASSETS
Intangible assets are initially recognised at their original acquisition cost on the balance sheet if the acquisition cost can be determined reliably and it is probable that the expected financial benefit from the asset will be to the benefit of the Group.
Intangible assets with limited useful lives are recognised as expenses over their known or estimated useful lives, using the straight-line depreciation method.
The residual value of an asset, the useful life and depreciation method are reviewed at least annually, at the end of each financial period, and adjustments are made when necessary to reflect changes in the expected financial benefit of the asset.
COMPUTER SOFTWARE
Costs related to developing and building significant new computer software are recognised as intangible assets on the balance sheet and depreciated on a straight-line basis over its estimated useful life, which is not to exceed seven years. Maintenance and operating costs related to computer software are recorded as expenses in the reporting period during which they have been incurred.
OTHER
The cost of patents, licences and trademarks with finite useful lives are capitalised on the balance sheet under intangible assets and depreciated on a straight-line basis over their useful lives of 5–10 years.
EUR million GoodwillOther intangible
assetsConstruction in
progress Total
Acquisition costs, 1 Jan 2017 12.4 135.9 0.2 148.4
Translation differences - -0.3 - -0.3
Increases - 2.5 0.6 3.1
Decreases - 0.0 - 0.0
Transfers between asset categories - -0.3 0.0 -0.3
Acquisition costs, 31 Dec 2017 12.4 137.8 0.8 151.0
Accumulated depreciation, amortisation and impairment charges, 1 Jan 2017 - -121.4 -121.4
Translation differences - 0.1 0.1
Accumulated amortisation on deductions and transfers - 0.0 0.0
Amortisation for the period - -3.1 -3.1
Impairments for the period - - -
Accumulated depreciation, 31 Dec 2017 - -124.4 -124.4
Book value, 1 Jan 2017 12.4 14.5 0.2 27.0
Book value, 31 Dec 2017 12.4 13.3 0.8 26.6
YEAR 2017
REPORT OF THE BOARD OF DIRECTORS
GROUP ACCOUNTS
SHARES AND SHAREHOLDERS
PARENT COMPANY ACCOUNTS
AUDITOR’S REPORT
GOVERNANCE KEY FIGURES
INVESTOR INFORMATION
CONSOLIDATED STATEMENT OF COMPREHENSIVE INCOME | BALANCE SHEET | STATEMENT OF CHANGES IN SHAREHOLDERS’ EQUITY | CASH FLOW STATEMENT | NOTES

44 FINANCIAL STATEMENTS 2017 – NOTE TO THE ACCOUNTS 11
11. TANGIBLE ASSETS
ACCOUNTING PRINCIPLES
Property, plant and equipment are measured at acquisition cost less accumulated depreciation and impairment losses.
The acquisition cost includes costs that are directly incurred in the acquisition of an item of property, plant or equipment. Qualifying external borrowing costs resulting directly from the acquisition, construction or manufacture of an item of property, plant or equipment are capitalised as part of the acquisition cost of property, plant and equipment.
If a piece of property, plant or equipment consists of several components with differing useful lives, each component is handled as a separate item. In that case, the expenses related to replacing the component are capitalised, and any book value remaining at the time of replacement is derecognised on the balance sheet.
Spare parts, spare equipment and maintenance supplies are rec-ognised in property, plant and equipment when they fulfill the cri-teria for recognition of property, plant and equipment. Otherwise, such commodities are classified as inventories.
Significant investments in refurbishments and improvements are capitalised on the balance sheet and depreciated over the remaining useful life of the main asset related to such investments. Repair and maintenance costs are recognised as expenses when they are incurred.
Property, plant and equipment is depreciated on a straight-line basis over the estimated useful lives. Depreciation is not recognised for land and water areas.
Estimated useful livesBuildings and constructions 20–40 years Machinery and equipmentHeavy power plant machinery 20–40 years
Other heavy machinery 15–20 yearsLightweight machinery and equipment 5–15 years Other tangible assets 5–20 years
The residual value of an asset, the financial useful life and deprecia-tion method are reviewed at least annually, at the end of each finan-cial period, and adjustments are made when necessary to reflect changes in the expected financial benefit of the asset.
Gains and losses arising from the sale and decommissioning of items of property, plant and equipment are recognised in other operating income and expenses. Sales gains or losses are calculated as the difference between the sales price and the remaining acquisi-tion cost.
Government grants related to the acquisition of assets are pre-sented as adjustments of the acquisition cost on the balance sheet and recognised as income in the form of lower depreciation during the useful life of the asset.
Leases on property, plant and equipment for which the Group substantially assumes all the risks and rewards characteristic of ownership of the asset are classified as finance lease agreements. Finance lease agreements are recognised as assets and liabilities on the balance sheet at the inception of the lease at an amount equal to the fair value of the leased property or, if lower, at the present value of the minimum lease payments. An asset obtained on a finance lease is depreciated over its useful life or, if shorter, the lease term.
Lease payments are split between financial expenses and reduc-tions in the lease liabilities during the lease term in the manner con-sistent with providing a constant interest rate over the lease term.
NOTE TO THE ACCOUNTS 11
EUR million GoodwillOther intangible
assetsConstruction in
progress Total
Acquisition costs, 1 Jan 2016 12.7 154.0 - 166.8
Translation differences - -0.4 - -0.4
Increases - 4.0 0.2 4.2
Decreases -0.4 -21.7 - -22.1
Transfers between asset categories - - - -
Acquisition costs, 31 Dec 2016 12.4 135.9 0.2 148.4
Accumulated depreciation, amortisation and impairment charges, 1 Jan 2016 -0.4 -140.4 -140.7
Translation differences - 0.4 0.4
Accumulated amortisation on deductions and transfers 0.4 21.7 22.1
Amortisation for the period - -3.2 -3.2
Impairments for the period - - -
Accumulated depreciation, 31 Dec 2016 - -121.4 -121.4
Book value, 1 Jan 2016 12.4 13.7 - 26.0
Book value, 31 Dec 2016 12.4 14.5 0.2 27.0
No impairments were recorded for intangible assets during the current or previous financial year. Other intangible assets include among other things computer software, patents and licenses. Metsä Board has not capitalised development expenditure.
YEAR 2017
REPORT OF THE BOARD OF DIRECTORS
GROUP ACCOUNTS
SHARES AND SHAREHOLDERS
PARENT COMPANY ACCOUNTS
AUDITOR’S REPORT
GOVERNANCE KEY FIGURES
INVESTOR INFORMATION
CONSOLIDATED STATEMENT OF COMPREHENSIVE INCOME | BALANCE SHEET | STATEMENT OF CHANGES IN SHAREHOLDERS’ EQUITY | CASH FLOW STATEMENT | NOTES

NOTE TO THE ACCOUNTS 11 – FINANCIAL STATEMENTS 2017 45
NOTE TO THE ACCOUNTS 11
EUR millionLand and
waterBuildings and constructions
Machinery and equipment
Other tangible assets
Construction in progress Total
Acquisition costs, 1 Jan 2017 12.4 431.3 2,643.8 37.9 39.8 3,165.2
Translation differences 0.0 -3.9 -38.2 -0.8 -0.4 -43.3
Increases 0.2 0.9 39.9 0.3 21.8 63.1
Decreases 0.0 -15.5 -131.7 -0.9 0.0 -148.2
Transfers between asset categories - 0.7 36.8 0.3 -37.6 0.3
Acquisition costs, 31 Dec 2017 12.5 413.6 2,550.6 36.7 23.7 3,037.1
Accumulated depreciation, 1 Jan 2017 -0.5 -292.2 -2,011.8 -30.9 -2,335.4
Translation differences 0.0 2.9 27.7 0.7 31.3
Accumulated depreciation on deductions and transfers - 15.3 127.8 0.9 144.0
Depreciation for the period - -6.9 -84.4 -1.0 -92.4
Impairment charges and reversed impairment charges - - 3.9 - 3.9
Accumulated depreciation and impairment charges, 31 Dec 2017 -0.5 -280.9 -1,936.9 -30.3 -2,248.6
Book value, 1 Jan 2017 11.8 139.1 632.0 7.0 39.8 829.8
Book value, 31 Dec 2017 12.0 132.7 613.7 6.4 23.7 788.6
EUR millionLand and
waterBuildings and constructions
Machinery and equipment
Other tangible assets
Construction in progress Total
Acquisition costs, 1 Jan 2016 13.5 422.9 2,456.3 38.8 158.6 3,090.1
Translation differences 0.0 -4.7 -43.1 -1.1 -4.6 -53.5
Increases 0.0 2.7 119.4 0.2 11.9 134.2
Decreases -1.1 -0.4 -4.0 0.0 0.0 -5.5
Transfers between asset categories - 10.9 115.3 - -126.2 0.0
Acquisition costs, 31 Dec 2016 12.4 431.3 2,643.8 37.9 39.8 3,165.2
Accumulated depreciation, 1 Jan 2016 -0.5 -287.5 -1,959.0 -30.8 -2,277.8
Translation differences 0.0 3.8 34.4 0.9 39.1
Accumulated depreciation on deductions and transfers - 0.4 2.0 0.0 2.4
Depreciation for the period - -6.8 -84.8 -1.0 -92.6
Impairment charges and reversed impairment charges - -2.1 -4.5 - -6.6
Accumulated depreciation and impairment charges, 31 Dec 2016 -0.5 -292.2 -2,011.8 -30.9 -2,335.4
Book value, 1 Jan 2016 13.0 135.4 497.3 8.0 158.6 812.3
Book value, 31 Dec 2016 11.8 139.1 632.0 7.0 39.8 829.8
A EUR 3.9 million reversal of previously recognized impairment loss on sale of a closed paper machine by Kyro mill was reported during the financial period.
Impairment charges for the previous year 2016 included EUR 8.5 million impairments of property, plant and equipment used in discon-tinued wallpaper base production at Kyro mill and a EUR 2.0 million reversal of previously recognized impairment on a paper machine sold by Husum mill.
Real estate mortgages for loans from financial institutions, pension loans and other liabilities amounted to EUR 232.8 million (232.8). Commitments are presented in more detail in Note 30.
Borrowing costs amounting to EUR 0.0 million were capitalised in property, plant and equipment during 2017 (EUR 0.6 million during 2016). The capitalisation rate used to determine the amount of borrow-ing costs qualifying for capitalisation was 3.30 per cent (3,57 per cent).
Property, plant and equipment increases include assets of EUR 1.5 million (2016: 4,8) acquired under finance lease agreements.
Property, plant and equipment includes tangible assets acquired under finance lease agreements as follows:
2017 2016
EUR million BuildingsMachinery and
equipment Total BuildingsMachinery and
equipment Total
Acquisition costs 0.7 17.6 18.3 0,8 48,7 49,5
Accumulated depreciation -0.3 -9.4 -9.7 -0,2 -35,6 -35,8
Book value, 1 Jan 0.6 13.1 13.7 0,7 10,4 11,1
Book value, 31 Dec 0.4 8.2 8.6 0,6 13,1 13,7
YEAR 2017
REPORT OF THE BOARD OF DIRECTORS
GROUP ACCOUNTS
SHARES AND SHAREHOLDERS
PARENT COMPANY ACCOUNTS
AUDITOR’S REPORT
GOVERNANCE KEY FIGURES
INVESTOR INFORMATION
CONSOLIDATED STATEMENT OF COMPREHENSIVE INCOME | BALANCE SHEET | STATEMENT OF CHANGES IN SHAREHOLDERS’ EQUITY | CASH FLOW STATEMENT | NOTES

46 FINANCIAL STATEMENTS 2017 – NOTE TO THE ACCOUNTS 12
12. GROUP STRUCTURE
SUBSIDIARIES AND JOINT OPERATIONS 31 DECEMBER 2017Country Group’s holding, % Number of shares
SHARES AND HOLDINGS IN THE GROUP
Metsäliitto Cooperative Finland 179,171
SHARES IN SUBSIDIARIES
IN FINLAND
Oy Hangö Stevedoring Ab Finland 100.00 150
Kiinteistö Oy Tampereen Kirkkokatu 7 Finland 100.00 280
Metsä Board Kemi Oy Finland 100.00 2,000,000
Metsä Board International Oy Finland 100.00 10,000
IN OTHER COUNTRIES
Metsä Board Deutsche Holding GmbH Germany 100.00 1
Metsä Board Netherlands B.V. The Netherlands 100.00 1,000
M-real Hellas Ltd.1) Greece 1.00 6
Metsa Board Ibéria S.A. 2) Spain 1.00 100
Metsä Board IBP Deals Americas Ltd USA 100.00 50
Metsä Board NL Holding B.V. The Netherlands 100.00 15,350
Metsä Board Sverige Ab Sweden 100.00 10,000,000
M-real UK Holdings Ltd United Kingdom 100.00 1
M-real UK Services Ltd United Kingdom 100.00 1
1) Total Group’s holding 51.0%2) Total Group’s holding 100.0%
Country Group’s holding, % Number of shares
SUBGROUPS IN FINLAND
METSÄ BOARD INTERNATIONAL OY
Metsä Board Benelux n.v./s.a Belgium 100.00 2,921
OOO Metsä Board Rus Russia 100.00 1
Metsä Board Deutschland GmbH Germany 100.00 1
Metsä Board France SAS France 100.00 8,211
M-real Hellas Ltd.1) Greece 50.00 300
Metsa Board Hong Kong Ltd Hong Kong 100.00 100
Metsa Board Shanghai Ltd China 100.00
Metsa Board Ibéria S.A. 2) Spain 99.00 147,771
Metsa Board Italia S.r.l. Italy 100.00 100,000
Metsä Board Hungary Kft Hungary 100.00 30
Metsa Board (Middle East & Africa) Ltd Cyprus 100.00 742,105
Metsä Board Polska Sp. Z o.o. Poland 100.00 232
Metsä Board Nordic AB Sweden 100.00 1,000
Metsa Board Singapore Pte Ltd Singapore 100.00 10,000
Metsä Board Schweiz AG Switzerland 100.00 100
Metsa Board UK Ltd United Kingdom 100.00 2,400
Metsa Board Americas Corporation USA 100.00 180
Metsa Board Australia and New Zealand Pty Ltd Australia 100.00 1
Metsa Board Middle East & Africa DMCC United Arab Emirates 100.00 50
NOTE TO THE ACCOUNTS 12YEAR 2017
REPORT OF THE BOARD OF DIRECTORS
GROUP ACCOUNTS
SHARES AND SHAREHOLDERS
PARENT COMPANY ACCOUNTS
AUDITOR’S REPORT
GOVERNANCE KEY FIGURES
INVESTOR INFORMATION
CONSOLIDATED STATEMENT OF COMPREHENSIVE INCOME | BALANCE SHEET | STATEMENT OF CHANGES IN SHAREHOLDERS’ EQUITY | CASH FLOW STATEMENT | NOTES
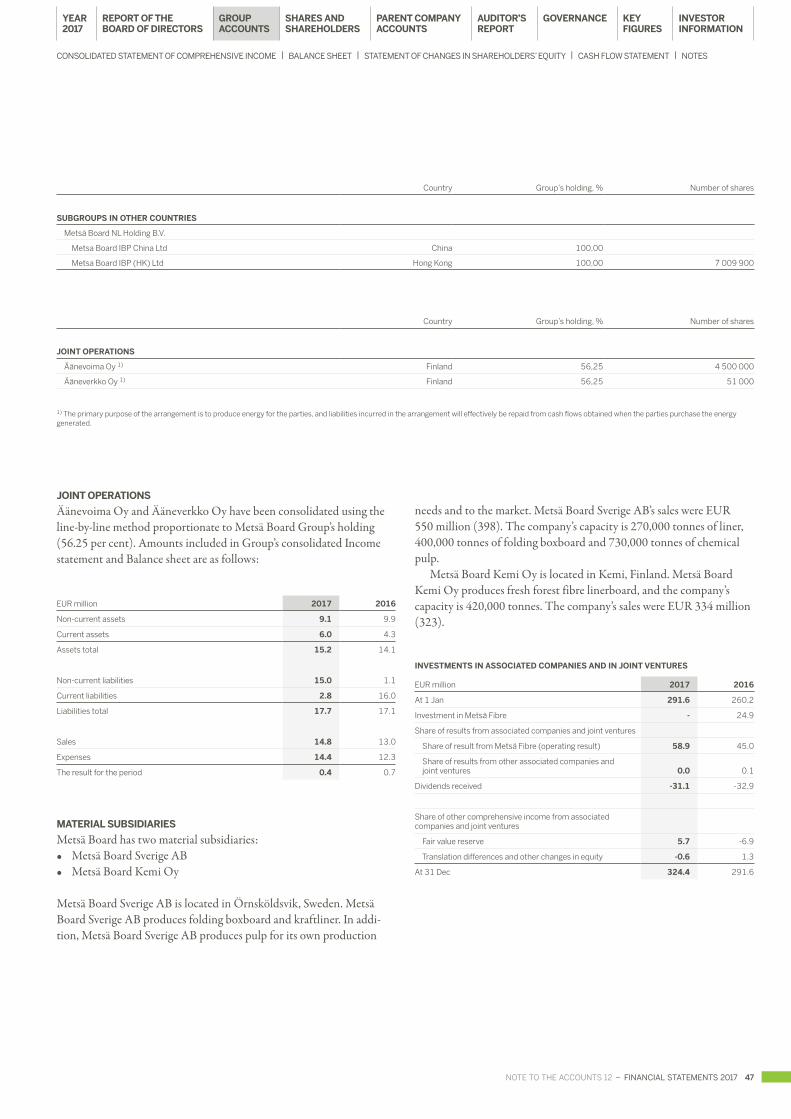
NOTE TO THE ACCOUNTS 12 – FINANCIAL STATEMENTS 2017 47
Country Group’s holding, % Number of shares
SUBGROUPS IN OTHER COUNTRIES
Metsä Board NL Holding B.V.
Metsa Board IBP China Ltd China 100,00
Metsa Board IBP (HK) Ltd Hong Kong 100,00 7 009 900
Country Group’s holding, % Number of shares
JOINT OPERATIONS
Äänevoima Oy 1) Finland 56,25 4 500 000
Ääneverkko Oy 1) Finland 56,25 51 000
1) The primary purpose of the arrangement is to produce energy for the parties, and liabilities incurred in the arrangement will effectively be repaid from cash flows obtained when the parties purchase the energy generated.
JOINT OPERATIONS
Äänevoima Oy and Ääneverkko Oy have been consolidated using the line-by-line method proportionate to Metsä Board Group’s holding (56.25 per cent). Amounts included in Group’s consolidated Income statement and Balance sheet are as follows:
EUR million 2017 2016
Non-current assets 9.1 9.9
Current assets 6.0 4.3
Assets total 15.2 14.1
Non-current liabilities 15.0 1.1
Current liabilities 2.8 16.0
Liabilities total 17.7 17.1
Sales 14.8 13.0
Expenses 14.4 12.3
The result for the period 0.4 0.7
MATERIAL SUBSIDIARIES
Metsä Board has two material subsidiaries:• Metsä Board Sverige AB• Metsä Board Kemi Oy
Metsä Board Sverige AB is located in Örnsköldsvik, Sweden. Metsä Board Sverige AB produces folding boxboard and kraftliner. In addi-tion, Metsä Board Sverige AB produces pulp for its own production
needs and to the market. Metsä Board Sverige AB’s sales were EUR 550 million (398). The company’s capacity is 270,000 tonnes of liner, 400,000 tonnes of folding boxboard and 730,000 tonnes of chemical pulp.
Metsä Board Kemi Oy is located in Kemi, Finland. Metsä Board Kemi Oy produces fresh forest fibre linerboard, and the company’s capacity is 420,000 tonnes. The company’s sales were EUR 334 million (323).
INVESTMENTS IN ASSOCIATED COMPANIES AND IN JOINT VENTURES
EUR million 2017 2016
At 1 Jan 291.6 260.2
Investment in Metsä Fibre - 24.9
Share of results from associated companies and joint ventures
Share of result from Metsä Fibre (operating result) 58.9 45.0
Share of results from other associated companies and joint ventures 0.0 0.1
Dividends received -31.1 -32.9
Share of other comprehensive income from associated companies and joint ventures
Fair value reserve 5.7 -6.9
Translation differences and other changes in equity -0.6 1.3
At 31 Dec 324.4 291.6
YEAR 2017
REPORT OF THE BOARD OF DIRECTORS
GROUP ACCOUNTS
SHARES AND SHAREHOLDERS
PARENT COMPANY ACCOUNTS
AUDITOR’S REPORT
GOVERNANCE KEY FIGURES
INVESTOR INFORMATION
CONSOLIDATED STATEMENT OF COMPREHENSIVE INCOME | BALANCE SHEET | STATEMENT OF CHANGES IN SHAREHOLDERS’ EQUITY | CASH FLOW STATEMENT | NOTES
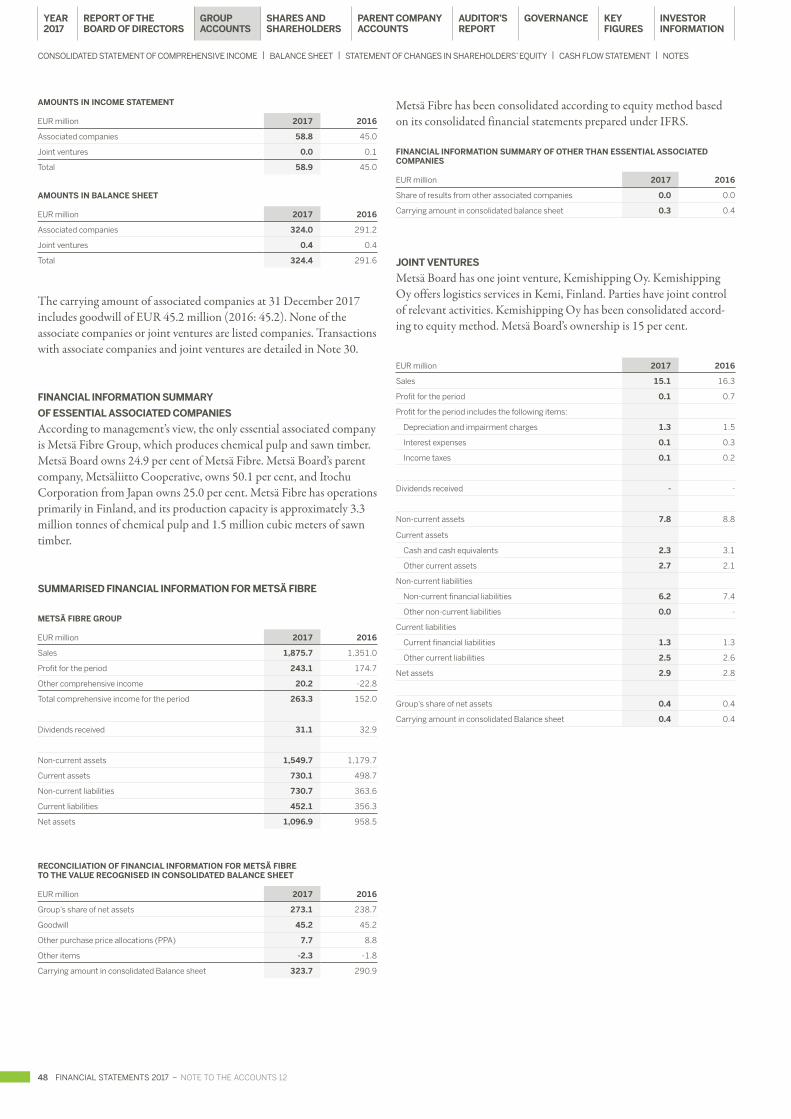
48 FINANCIAL STATEMENTS 2017 – NOTE TO THE ACCOUNTS 12
AMOUNTS IN INCOME STATEMENT
EUR million 2017 2016
Associated companies 58.8 45.0
Joint ventures 0.0 0.1
Total 58.9 45.0
AMOUNTS IN BALANCE SHEET
EUR million 2017 2016
Associated companies 324.0 291.2
Joint ventures 0.4 0.4
Total 324.4 291.6
The carrying amount of associated companies at 31 December 2017 includes goodwill of EUR 45.2 million (2016: 45.2). None of the associate companies or joint ventures are listed companies. Transactions with associate companies and joint ventures are detailed in Note 30.
FINANCIAL INFORMATION SUMMARY
OF ESSENTIAL ASSOCIATED COMPANIES
According to management’s view, the only essential associated company is Metsä Fibre Group, which produces chemical pulp and sawn timber. Metsä Board owns 24.9 per cent of Metsä Fibre. Metsä Board’s parent company, Metsäliitto Cooperative, owns 50.1 per cent, and Itochu Corporation from Japan owns 25.0 per cent. Metsä Fibre has operations primarily in Finland, and its production capacity is approximately 3.3 million tonnes of chemical pulp and 1.5 million cubic meters of sawn timber.
SUMMARISED FINANCIAL INFORMATION FOR METSÄ FIBRE
METSÄ FIBRE GROUP
EUR million 2017 2016
Sales 1,875.7 1,351.0
Profit for the period 243.1 174.7
Other comprehensive income 20.2 -22.8
Total comprehensive income for the period 263.3 152.0
Dividends received 31.1 32.9
Non-current assets 1,549.7 1,179.7
Current assets 730.1 498.7
Non-current liabilities 730.7 363.6
Current liabilities 452.1 356.3
Net assets 1,096.9 958.5
RECONCILIATION OF FINANCIAL INFORMATION FOR METSÄ FIBRE TO THE VALUE RECOGNISED IN CONSOLIDATED BALANCE SHEET
EUR million 2017 2016
Group’s share of net assets 273.1 238.7
Goodwill 45.2 45.2
Other purchase price allocations (PPA) 7.7 8.8
Other items -2.3 -1.8
Carrying amount in consolidated Balance sheet 323.7 290.9
Metsä Fibre has been consolidated according to equity method based on its consolidated financial statements prepared under IFRS.
FINANCIAL INFORMATION SUMMARY OF OTHER THAN ESSENTIAL ASSOCIATED COMPANIES
EUR million 2017 2016
Share of results from other associated companies 0.0 0.0
Carrying amount in consolidated balance sheet 0.3 0.4
JOINT VENTURES
Metsä Board has one joint venture, Kemishipping Oy. Kemishipping Oy offers logistics services in Kemi, Finland. Parties have joint control of relevant activities. Kemishipping Oy has been consolidated accord-ing to equity method. Metsä Board’s ownership is 15 per cent.
EUR million 2017 2016
Sales 15.1 16.3
Profit for the period 0.1 0.7
Profit for the period includes the following items:
Depreciation and impairment charges 1.3 1.5
Interest expenses 0.1 0.3
Income taxes 0.1 0.2
Dividends received - -
Non-current assets 7.8 8.8
Current assets
Cash and cash equivalents 2.3 3.1
Other current assets 2.7 2.1
Non-current liabilities
Non-current financial liabilities 6.2 7.4
Other non-current liabilities 0.0 -
Current liabilities
Current financial liabilities 1.3 1.3
Other current liabilities 2.5 2.6
Net assets 2.9 2.8
Group’s share of net assets 0.4 0.4
Carrying amount in consolidated Balance sheet 0.4 0.4
NOTE TO THE ACCOUNTS 12YEAR 2017
REPORT OF THE BOARD OF DIRECTORS
GROUP ACCOUNTS
SHARES AND SHAREHOLDERS
PARENT COMPANY ACCOUNTS
AUDITOR’S REPORT
GOVERNANCE KEY FIGURES
INVESTOR INFORMATION
CONSOLIDATED STATEMENT OF COMPREHENSIVE INCOME | BALANCE SHEET | STATEMENT OF CHANGES IN SHAREHOLDERS’ EQUITY | CASH FLOW STATEMENT | NOTES

NOTE TO THE ACCOUNTS 13 – FINANCIAL STATEMENTS 2017 49
13. AVAILABLE FOR SALE INVESTMENTS
ACCOUNTING PRINCIPLES
Available-for-sale financial assets consist of listed and unlisted equity investments. They are measured at fair value, or at acquisi-tion cost less impairment if their fair value cannot be determined reliably. Changes in fair value are recognised under other com-prehensive income and presented in the fair value reserve, taking the tax effect into account.
Accumulated changes in fair value are transferred from equity to profit and loss as a correction of classification when the invest-ment is divested or its value is impaired so that an impairment loss is to be recognised for the investment.
The fair values of publicly quoted shares are based on the share price on the balance sheet date. The fair values of shares other than publicly quoted shares are determined using various valuation models, such as the price levels of recent transactions and valuation methods based on the present value of discounted cash flows. As far as possible, the valuation methods are founded on market-based valuation factors.
KEY ESTIMATES AND JUDGEMENTS
FAIR VALUE MEASUREMENT
The application of valuation models to measuring fair value requires judgement concerning the selection of the method to be applied, as well as valuation factors required by the chosen method that are based on the price and interest levels prevailing in the market on the end date of each reporting period. The most significant investment that has been measured as an available-for-sale financial asset is the Group’s investment in the shares of Pohjolan Voima Oyj. The price of these shares is determined based on completed transactions and the current value of dis-counted cash flows. Key factors affecting cash flows include the price of electricity, inflation expectations and the discount rate. The carrying amount of the Group’s shares in Pohjolan Voima was EUR 236.2 million on the balance sheet on 31 December 2017. The carrying amount of these shares is estimated to change by EUR 3.3 million if the rate used for discounting the cash flows changes by 10 per cent from the rate estimated by the manage-ment. The carrying amount of the shares is estimated to change by EUR 31.8 million if the energy prices applied in the fair value calculation differ by 10 per cent from the rate estimated by the management.
IMPAIRMENT OF AVAILABLE-FOR-SALE FINANCIAL ASSET
Estimates of the prerequisites for impairment require the man-agement’s judgement in terms of for how long and to what extent the fair value of the investment has been lower than the acquisi-tion cost, for example. In addition, it is necessary to estimate the financial position of the investee, the near-term outlook and the profitability of the business operations to determine whether there is objective proof of impairment.
NOTE TO THE ACCOUNTS 13
EUR million 2017 2016
Shares in other companies
Listed companies 0.0 0.0
Other companies 240.3 195.9
Total 240.3 195.9
The most important non-quoted shareholding consists of a 3.2 per cent stake in Finnish energy company Pohjolan Voima Oyj, which produces electricity and heat for its shareholders in Finland. Pohjolan Voima trades with its shareholders at prices based on production costs, which generally are lower than market prices. The Group is entitled to about 5.2 per cent of the electrity produced by Olkiluoto nuclear power plant (OL1 and OL2) through Pohjolan Voima’s B-shares as well as to about 6.4 per cent of electricity produced by Meripori coal-fired power plant (through C2 shares). The Group is also entitled to 84 per cent of the energy produced by Hämeenkyron Voima Oy (through Pohjolan Voima’s G10 shares). In addition, the Group also has, through Pohjolan Voima’s B2 shares, a share of about 1.5 per cent in Olkiluoto 3, the new nuclear power plant under construction.
The ownership is measured quarterly at fair value on share series basis by using the average of discounted cash flow method and valua-tion based on earlier transactions. The weighted average cost of capital used was 2.34 (2015: 2.06) per cent and 4.34 per cent (4.06) for the Olkiluoto 3 under construction. 12-month rolling averages have been used for energy price estimates, which evens out the effect of fluctua-tions in short-term energy price estimates. The changes in fair value less deferred tax calculated at Finnish tax rate are recorded in other compre-hensive income and presented under fair value reserve in equity.
The acquisition cost of shares in Pohjolan Voima Oy is EUR 39.1million (39.1) and the fair value EUR 236.2 million (191.8), which can be allocated to different shares as follows: The fair value of nuclear power shares totals EUR 228.0 million (185.0), coal power plant shares (C2 shares) have a fair value of EUR -3.9 million (-5.2) and G10 shares EUR 12.0 million (12.0).
Shareholder agreement restricts sale of shares to buyers that are not existing shareholders.
Other shares in unquoted companies, for which fair value cannot be measured reliably, are carried at cost less any impairment losses.
YEAR 2017
REPORT OF THE BOARD OF DIRECTORS
GROUP ACCOUNTS
SHARES AND SHAREHOLDERS
PARENT COMPANY ACCOUNTS
AUDITOR’S REPORT
GOVERNANCE KEY FIGURES
INVESTOR INFORMATION
CONSOLIDATED STATEMENT OF COMPREHENSIVE INCOME | BALANCE SHEET | STATEMENT OF CHANGES IN SHAREHOLDERS’ EQUITY | CASH FLOW STATEMENT | NOTES

50 FINANCIAL STATEMENTS 2017 – NOTE TO THE ACCOUNTS 14
14. OTHER NON-CURRENT FINANCIAL ASSETS
ACCOUNTING PRINCIPLES
Financial assets are classified in accordance with IAS 39 as follows:
• Financial assets at fair value through profit and loss, (Note 17)• Investments held to maturity, (Note 17)• Loans and other receivables (Note 14, 17 ja 18) and• Available-for-sale financial assets (Note 13).
The categorisation depends on the purpose for which the assets were acquired, and financial assets are initially recognised at fair value.
Financial assets at fair value through profit and loss include publicly quoted bonds and money market investments that are not included in liquid assets due to their maturity. They are measured at fair value based on price quotations in the market.
Metsä Board does not currently have any held to maturity investments.
Loans and other receivables are recognised at amortised cost. The fair value of derivatives is presented in other non-interest-bearing receivables or liabilities.
Financial assets are derecognised on the balance sheet when the Group has lost the contractual right to receive cash flows or it has substantially transferred the risks and rewards of ownership to outside the Group. The Group assesses whether there is objec-tive evidence of impairment on a financial asset on each balance sheet date.
EUR million 2017 2016
INTEREST-BEARING LOAN RECEIVABLES
Loans to associated companies and joint ventures 0.3 0.3
Other loan receivables 3.2 3.3
3.5 3.6
NON-INTEREST BEARING RECEIVABLES
Other loan receivables 0.4 0.5
Defined benefit pension plans (note 21) 14.5 12.2
14.9 12.7
Other non-current financial assets total 18.4 16.3
Derivative receivables are from Metsä Group Treasury Oy, a wholly owned subsidiary of Metsäliitto Cooperative.
NOTE TO THE ACCOUNTS 14YEAR 2017
REPORT OF THE BOARD OF DIRECTORS
GROUP ACCOUNTS
SHARES AND SHAREHOLDERS
PARENT COMPANY ACCOUNTS
AUDITOR’S REPORT
GOVERNANCE KEY FIGURES
INVESTOR INFORMATION
CONSOLIDATED STATEMENT OF COMPREHENSIVE INCOME | BALANCE SHEET | STATEMENT OF CHANGES IN SHAREHOLDERS’ EQUITY | CASH FLOW STATEMENT | NOTES

NOTE TO THE ACCOUNTS 15 – FINANCIAL STATEMENTS 2017 51
15. DEFERRED TAXES
ACCOUNTING PRINCIPLES
Deferred tax assets and liabilities are calculated on the temporary differences between the carrying amount and the tax base using tax rates issued by the balance sheet date. No deferred taxes are recognised for non-deductible goodwill, and no deferred taxes are recognised for subsidiaries’ undistributed profits to the extent that the difference will not likely be realised in the foreseeable future. Deferred tax assets are recognised to the extent that it is probable that taxable profit will be available against which a deductible temporary difference can be utilised.
Deferred income tax assets and liabilities can be offset when there is a legally enforceable right to offset current tax assets against current tax liabilities and when the deferred taxes are related to the same taxation authority.
The most significant temporary differences arise from depre-ciation of property, plant and equipment; the measurement of available-for-sale financial assets and derivative contracts at fair value; defined benefit plans; unused tax losses; and measurement at fair value in conjunction with acquisitions of business operations.
KEY ESTIMATES AND JUDGEMENTS
The management’s judgement is required to determine deferred tax assets and liabilities and the extent to which deferred tax assets are recorded.
RECONCILIATION OF DEFERRED TAX ASSETS AND LIABILITIES TO 2017 BALANCE SHEET
EUR millionAs at
1 Jan 2017Charged to
income statement
Charged to other comprehensive
incomeTranslation differences
As at 31 Dec 2017
Deferred tax assets
Pension obligations and other provisions 4.7 -0.5 0.1 0.0 4.3
Intercompany margins 0.7 0.0 - 0.0 0.7
Unused operating loss carry-forwards 8.2 9.7 - -0.4 17.5
Financial instruments 4.0 -2.7 -1.3 - 0.0
Other temporary differences 2.6 1.4 - -0.1 3.9
Deferred tax assets, total 20.2 7.9 -1.2 -0.5 26.4
Netting against liabilities -15.9 -7.9 1.2 0.5 -22.1
Deferred tax assets in Balance sheet 4.3 0.0 0.0 0.0 4.3
Deferred tax liabilities
Pension obligations 2.1 -0.5 0.8 -0.1 2.3
Appropriations 56.6 8.3 - -1.2 63.8
Available for sale financial assets recognised at fair value 30.5 - 8.9 - 39.4
Financial instruments 0.9 0.3 0.9 0.0 2.0
Net investments in foreign operations - 1.5 - -1.5 -
Other temporary differences 0.6 0.1 - 0.0 0.6
Deferred tax liabilities, total 90.6 9.6 10.6 -2.7 108.1
Netting against assets -15.9 -7.9 1.2 0.5 -22.1
Deferred tax liabilities in Balance sheet 74.7 1.8 11.8 -2.2 86.1
NOTE TO THE ACCOUNTS 15YEAR 2017
REPORT OF THE BOARD OF DIRECTORS
GROUP ACCOUNTS
SHARES AND SHAREHOLDERS
PARENT COMPANY ACCOUNTS
AUDITOR’S REPORT
GOVERNANCE KEY FIGURES
INVESTOR INFORMATION
CONSOLIDATED STATEMENT OF COMPREHENSIVE INCOME | BALANCE SHEET | STATEMENT OF CHANGES IN SHAREHOLDERS’ EQUITY | CASH FLOW STATEMENT | NOTES

52 FINANCIAL STATEMENTS 2017 – NOTE TO THE ACCOUNTS 15
RECONCILIATION OF DEFERRED TAX ASSETS AND LIABILITIES TO 2016 BALANCE SHEET
EUR millionAs at
31 Jan 2016Charged to
income statement
Charged to other comprehensive
incomeTranslation differences
As at 31 Dec 2016
Deferred tax assets
Pension obligations and other provisions 5.7 -1.3 0.2 0.0 4.7
Intercompany margins 0.6 0.2 - - 0.7
Unused operating loss carry-forwards 0.1 8.2 - -0.1 8.2
Financial instruments 9.3 -0.5 -4.8 - 4.0
Other temporary differences 0.6 2.0 - 0.0 2.6
Deferred tax assets, total 16.3 8.6 -4.6 -0.1 20.2
Netting against liabilities -11.8 -9.0 4.8 0.1 -15.9
Deferred tax assets in Balance sheet 4.5 -0.4 0.2 0.0 4.3
Deferred tax liabilities
Pension obligations 2.4 -0.1 -0.1 -0.2 2.1
Appropriations 53.5 4.5 - -1.4 56.6
Available for sale financial assets recognised at fair value 33.4 - -2.8 - 30.5
Financial instruments 1.5 -1.6 0.9 - 0.9
Net investments in foreign operations - 1.3 - -1.3 -
Other temporary differences 1.2 -0.6 - - 0.6
Deferred tax liabilities, total 92.0 3.5 -2.1 -2.9 90.6
Netting against assets -11.8 -9.0 4.8 0.1 -15.9
Deferred tax liabilities in Balance sheet 80.2 -5.5 2.8 -2.7 74.7
The Group has recognised deferred tax assets related to operating loss carry-forwards for EUR 17.5 million in Sweden. Management assesses that taxable profit will be available against which loss carry-forward can be utilised.
The taxable loss carry-forwards of business operations, for which deferred tax assets have not been recognised due to uncertainty of
amount or utilisation possibilities, amounted approximately to EUR 507 million (507), mainly in Finland. The unrecognised deferred tax assets for these loss carry forwards is about EUR 111 million (113). About EUR 331 million of the loss carry-forwards will expire between 2018–2022 and another EUR 79 million between 2023–2027. The remaining loss carry-forwards of about EUR 98 million do not expire.
NOTE TO THE ACCOUNTS 15YEAR 2017
REPORT OF THE BOARD OF DIRECTORS
GROUP ACCOUNTS
SHARES AND SHAREHOLDERS
PARENT COMPANY ACCOUNTS
AUDITOR’S REPORT
GOVERNANCE KEY FIGURES
INVESTOR INFORMATION
CONSOLIDATED STATEMENT OF COMPREHENSIVE INCOME | BALANCE SHEET | STATEMENT OF CHANGES IN SHAREHOLDERS’ EQUITY | CASH FLOW STATEMENT | NOTES
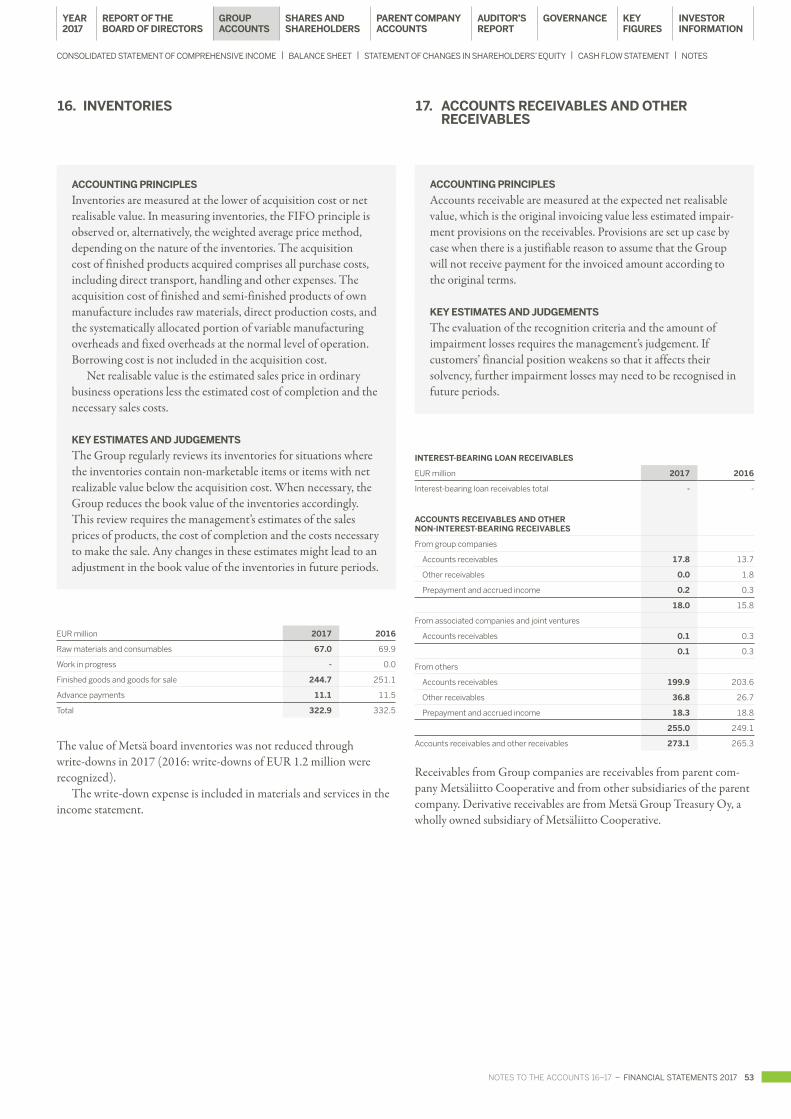
NOTES TO THE ACCOUNTS 16–17 – FINANCIAL STATEMENTS 2017 53
16. INVENTORIES
ACCOUNTING PRINCIPLES
Inventories are measured at the lower of acquisition cost or net realisable value. In measuring inventories, the FIFO principle is observed or, alternatively, the weighted average price method, depending on the nature of the inventories. The acquisition cost of finished products acquired comprises all purchase costs, including direct transport, handling and other expenses. The acquisition cost of finished and semi-finished products of own manufacture includes raw materials, direct production costs, and the systematically allocated portion of variable manufacturing overheads and fixed overheads at the normal level of operation. Borrowing cost is not included in the acquisition cost.
Net realisable value is the estimated sales price in ordinary business operations less the estimated cost of completion and the necessary sales costs.
KEY ESTIMATES AND JUDGEMENTS
The Group regularly reviews its inventories for situations where the inventories contain non-marketable items or items with net realizable value below the acquisition cost. When necessary, the Group reduces the book value of the inventories accordingly. This review requires the management’s estimates of the sales prices of products, the cost of completion and the costs necessary to make the sale. Any changes in these estimates might lead to an adjustment in the book value of the inventories in future periods.
EUR million 2017 2016
Raw materials and consumables 67.0 69.9
Work in progress - 0.0
Finished goods and goods for sale 244.7 251.1
Advance payments 11.1 11.5
Total 322.9 332.5
The value of Metsä board inventories was not reduced through write-downs in 2017 (2016: write-downs of EUR 1.2 million were recognized).
The write-down expense is included in materials and services in the income statement.
17. ACCOUNTS RECEIVABLES AND OTHER RECEIVABLES
ACCOUNTING PRINCIPLES
Accounts receivable are measured at the expected net realisable value, which is the original invoicing value less estimated impair-ment provisions on the receivables. Provisions are set up case by case when there is a justifiable reason to assume that the Group will not receive payment for the invoiced amount according to the original terms.
KEY ESTIMATES AND JUDGEMENTS
The evaluation of the recognition criteria and the amount of impairment losses requires the management’s judgement. If customers’ financial position weakens so that it affects their solvency, further impairment losses may need to be recognised in future periods.
INTEREST-BEARING LOAN RECEIVABLES
EUR million 2017 2016
Interest-bearing loan receivables total - -
ACCOUNTS RECEIVABLES AND OTHER NON-INTEREST-BEARING RECEIVABLES
From group companies
Accounts receivables 17.8 13.7
Other receivables 0.0 1.8
Prepayment and accrued income 0.2 0.3
18.0 15.8
From associated companies and joint ventures
Accounts receivables 0.1 0.3
0.1 0.3
From others
Accounts receivables 199.9 203.6
Other receivables 36.8 26.7
Prepayment and accrued income 18.3 18.8
255.0 249.1
Accounts receivables and other receivables 273.1 265.3
Receivables from Group companies are receivables from parent com-pany Metsäliitto Cooperative and from other subsidiaries of the parent company. Derivative receivables are from Metsä Group Treasury Oy, a wholly owned subsidiary of Metsäliitto Cooperative.
NOTES TO THE ACCOUNTS 16–17YEAR 2017
REPORT OF THE BOARD OF DIRECTORS
GROUP ACCOUNTS
SHARES AND SHAREHOLDERS
PARENT COMPANY ACCOUNTS
AUDITOR’S REPORT
GOVERNANCE KEY FIGURES
INVESTOR INFORMATION
CONSOLIDATED STATEMENT OF COMPREHENSIVE INCOME | BALANCE SHEET | STATEMENT OF CHANGES IN SHAREHOLDERS’ EQUITY | CASH FLOW STATEMENT | NOTES

54 FINANCIAL STATEMENTS 2017 – NOTE TO THE ACCOUNTS 18
DOUBTFUL ACCOUNTS RECEIVABLES
Accounts receivables are recognised net of the following items of impairment:
EUR million 2017 2016
At 1 Jan 1.1 2.7
Increases 0.4 0.6
Decreases -0.6 -2.2
At 31 Dec 0.9 1.1
EUR 0.1 million of credit loss was recognised during 2017 (EUR 0.4 million in 2016).
AGEING ANALYSIS OF ACCOUNTS RECEIVABLES, EXTERNAL
No overdue 187.5 184.0
Overdue
Less than 30 days 11.9 16.6
Between 31 and 60 days 0.1 2.2
Between 61 and 90 days 0.1 0.0
Between 91 and 180 days 0.1 0.3
More than 180 days 0.3 0.4
Total 199.9 203.6
NOTE TO THE ACCOUNTS 18
18. CASH AND CASH EQUIVALENTS
ACCOUNTING PRINCIPLES
Cash and cash equivalents consist of cash and other short-term, highly liquid investments that can be easily converted into an amount of cash known in advance and that carry a minimal risk of value changes. Metsä Board has classified as cash and cash equivalents the short-term money market investments made in accordance with its treasury policy and interest-bearing receiva-bles comparable to cash funds and available immediately from Metsä Group’s internal bank Metsä Group Treasury Oy.
EUR million 2017 2016
Current investments 0.0 0.5
Cash at hand and in bank, deposits to Metsä Group Treasury Oy 215.1 220.1
Total 215.1 220.6
YEAR 2017
REPORT OF THE BOARD OF DIRECTORS
GROUP ACCOUNTS
SHARES AND SHAREHOLDERS
PARENT COMPANY ACCOUNTS
AUDITOR’S REPORT
GOVERNANCE KEY FIGURES
INVESTOR INFORMATION
CONSOLIDATED STATEMENT OF COMPREHENSIVE INCOME | BALANCE SHEET | STATEMENT OF CHANGES IN SHAREHOLDERS’ EQUITY | CASH FLOW STATEMENT | NOTES
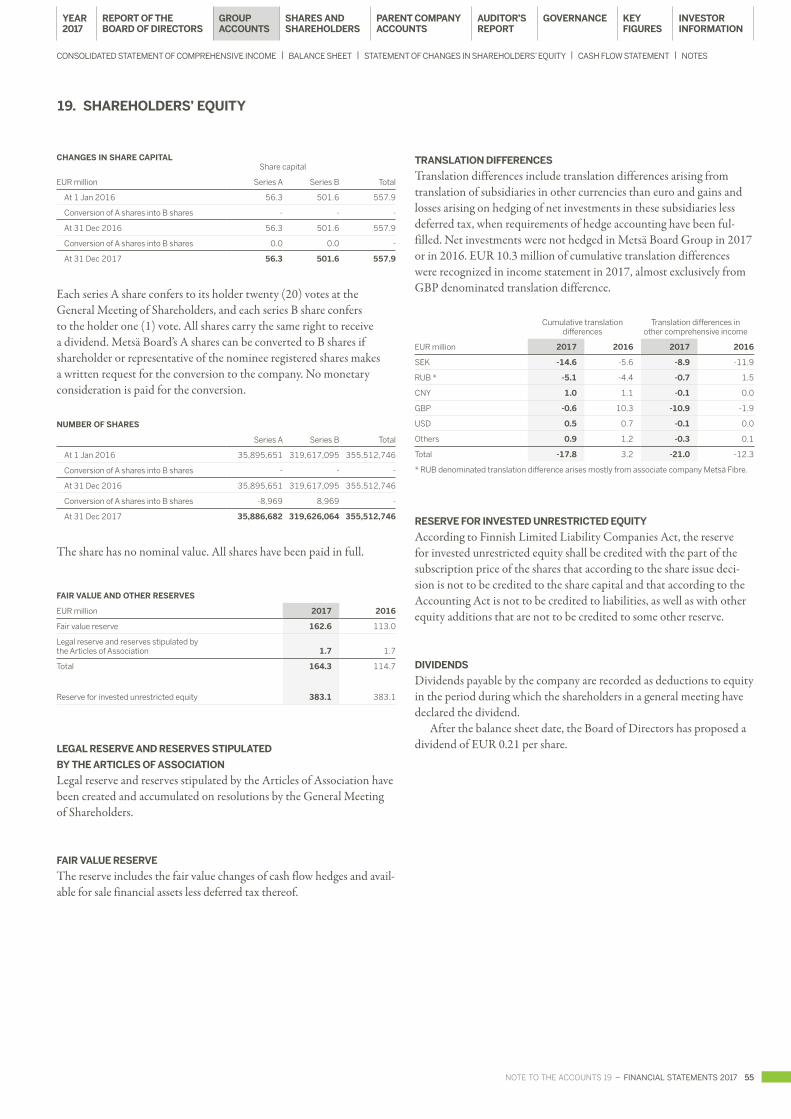
NOTE TO THE ACCOUNTS 19 – FINANCIAL STATEMENTS 2017 55
19. SHAREHOLDERS’ EQUITY
CHANGES IN SHARE CAPITAL Share capital
EUR million Series A Series B Total
At 1 Jan 2016 56.3 501.6 557.9
Conversion of A shares into B shares - - -
At 31 Dec 2016 56.3 501.6 557.9
Conversion of A shares into B shares 0.0 0.0 -
At 31 Dec 2017 56.3 501.6 557.9
Each series A share confers to its holder twenty (20) votes at the General Meeting of Shareholders, and each series B share confers to the holder one (1) vote. All shares carry the same right to receive a dividend. Metsä Board’s A shares can be converted to B shares if shareholder or representative of the nominee registered shares makes a written request for the conversion to the company. No monetary consideration is paid for the conversion.
NUMBER OF SHARES
Series A Series B Total
At 1 Jan 2016 35,895,651 319,617,095 355,512,746
Conversion of A shares into B shares - - -
At 31 Dec 2016 35,895,651 319,617,095 355,512,746
Conversion of A shares into B shares -8,969 8,969 -
At 31 Dec 2017 35,886,682 319,626,064 355,512,746
The share has no nominal value. All shares have been paid in full.
FAIR VALUE AND OTHER RESERVES
EUR million 2017 2016
Fair value reserve 162.6 113.0
Legal reserve and reserves stipulated by the Articles of Association 1.7 1.7
Total 164.3 114.7
Reserve for invested unrestricted equity 383.1 383.1
LEGAL RESERVE AND RESERVES STIPULATED
BY THE ARTICLES OF ASSOCIATION
Legal reserve and reserves stipulated by the Articles of Association have been created and accumulated on resolutions by the General Meeting of Shareholders.
FAIR VALUE RESERVE
The reserve includes the fair value changes of cash flow hedges and avail-able for sale financial assets less deferred tax thereof.
NOTE TO THE ACCOUNTS 19
TRANSLATION DIFFERENCES
Translation differences include translation differences arising from translation of subsidiaries in other currencies than euro and gains and losses arising on hedging of net investments in these subsidiaries less deferred tax, when requirements of hedge accounting have been ful-filled. Net investments were not hedged in Metsä Board Group in 2017 or in 2016. EUR 10.3 million of cumulative translation differences were recognized in income statement in 2017, almost exclusively from GBP denominated translation difference.
Cumulative translation differences
Translation differences in other comprehensive income
EUR million 2017 2016 2017 2016
SEK -14.6 -5.6 -8.9 -11.9
RUB * -5.1 -4.4 -0.7 1.5
CNY 1.0 1.1 -0.1 0.0
GBP -0.6 10.3 -10.9 -1.9
USD 0.5 0.7 -0.1 0.0
Others 0.9 1.2 -0.3 0.1
Total -17.8 3.2 -21.0 -12.3
* RUB denominated translation difference arises mostly from associate company Metsä Fibre.
RESERVE FOR INVESTED UNRESTRICTED EQUITY
According to Finnish Limited Liability Companies Act, the reserve for invested unrestricted equity shall be credited with the part of the subscription price of the shares that according to the share issue deci-sion is not to be credited to the share capital and that according to the Accounting Act is not to be credited to liabilities, as well as with other equity additions that are not to be credited to some other reserve.
DIVIDENDS
Dividends payable by the company are recorded as deductions to equity in the period during which the shareholders in a general meeting have declared the dividend.
After the balance sheet date, the Board of Directors has proposed a dividend of EUR 0.21 per share.
YEAR 2017
REPORT OF THE BOARD OF DIRECTORS
GROUP ACCOUNTS
SHARES AND SHAREHOLDERS
PARENT COMPANY ACCOUNTS
AUDITOR’S REPORT
GOVERNANCE KEY FIGURES
INVESTOR INFORMATION
CONSOLIDATED STATEMENT OF COMPREHENSIVE INCOME | BALANCE SHEET | STATEMENT OF CHANGES IN SHAREHOLDERS’ EQUITY | CASH FLOW STATEMENT | NOTES

56 FINANCIAL STATEMENTS 2017 – NOTE TO THE ACCOUNTS 19
OTHER COMPREHENSIVE INCOME AFTER TAXES 2017
EUR millionTranslation
differencesFair value and
other reservesRetained earnings Total equity
Actuarial gains/losses on defined pension plans 4.2 4.2
Income tax relating to items that will not be reclassified -0.7 -0.7
Cash flow hedges
Currency flow hedges
Gains and losses recorded in equity 29.3 29.3
Transferred to adjust sales -21.3 -21.3
Interest flow hedges
Gains and losses recorded in equity 0.8 0.8
Commodity hedges
Gains and losses recorded in equity 4.8 4.8
Transferred to adjust purchases -3.0 -3.0
Share of other comprehensive income of associated companies 3.7 3.7
Cash flow hedges, total 14.3 14.3
Available for sale financial assets
Gains and losses recorded in other comprehensive income 44.4 44.4
Transferred to other operating income - -
Share of other comprehensive income of associated companies 2.0 2.0
Available for sale financial assets, total 46.3 46.3
Translation differences -20.3 -20.3
Gains and losses on hedges of net investments in foreign operations -
Share of other comprehensive income of associated companies -0.6 -0.6
Translation differences, total -21.0 -21.0
Income tax relating to items that may be reclassified -11.0 -11.0
Other comprehensive income after taxes -21.0 49.6 3.4 32.0
OTHER COMPREHENSIVE INCOME AFTER TAXES 2016
EUR millionTranslation
differencesFair value and
other reservesRetained earnings Total equity
Actuarial gains/losses on defined pension plans 1.3 1.3
Income tax relating to items that will not be reclassified 0.3 0.3
Cash flow hedges
Currency flow hedges
Gains and losses recorded in equity -5.7 -5.7
Transferred to adjust sales 0.7 0.7
Interest flow hedges
Gains and losses recorded in equity 2.3 2.3
Commodity hedges
Gains and losses recorded in equity 22.1 22.1
Transferred to adjust purchases 7.6 7.6
Share of other comprehensive income of associated companies -4.4 -4.4
Cash flow hedges, total 22.6 22.6
Available for sale financial assets
Gains and losses recorded in other comprehensive income -14.2 -14.2
Transferred to other operating income -0.1 -0.1
Share of other comprehensive income of associated companies -2.5 -2.5
Available for sale financial assets, total -16.7 -16.8
Translation differences -12.3 -12.3
Gains and losses on hedges of net investments in foreign operations -
Share of other comprehensive income of associated companies 1.3 1.3
Translation differences, total -11.0 -11.0
Income tax relating to items that may be reclassified -2.8 -2.8
Other comprehensive income after taxes -11.0 3.1 1.6 -6.4
YEAR 2017
REPORT OF THE BOARD OF DIRECTORS
GROUP ACCOUNTS
SHARES AND SHAREHOLDERS
PARENT COMPANY ACCOUNTS
AUDITOR’S REPORT
GOVERNANCE KEY FIGURES
INVESTOR INFORMATION
CONSOLIDATED STATEMENT OF COMPREHENSIVE INCOME | BALANCE SHEET | STATEMENT OF CHANGES IN SHAREHOLDERS’ EQUITY | CASH FLOW STATEMENT | NOTES
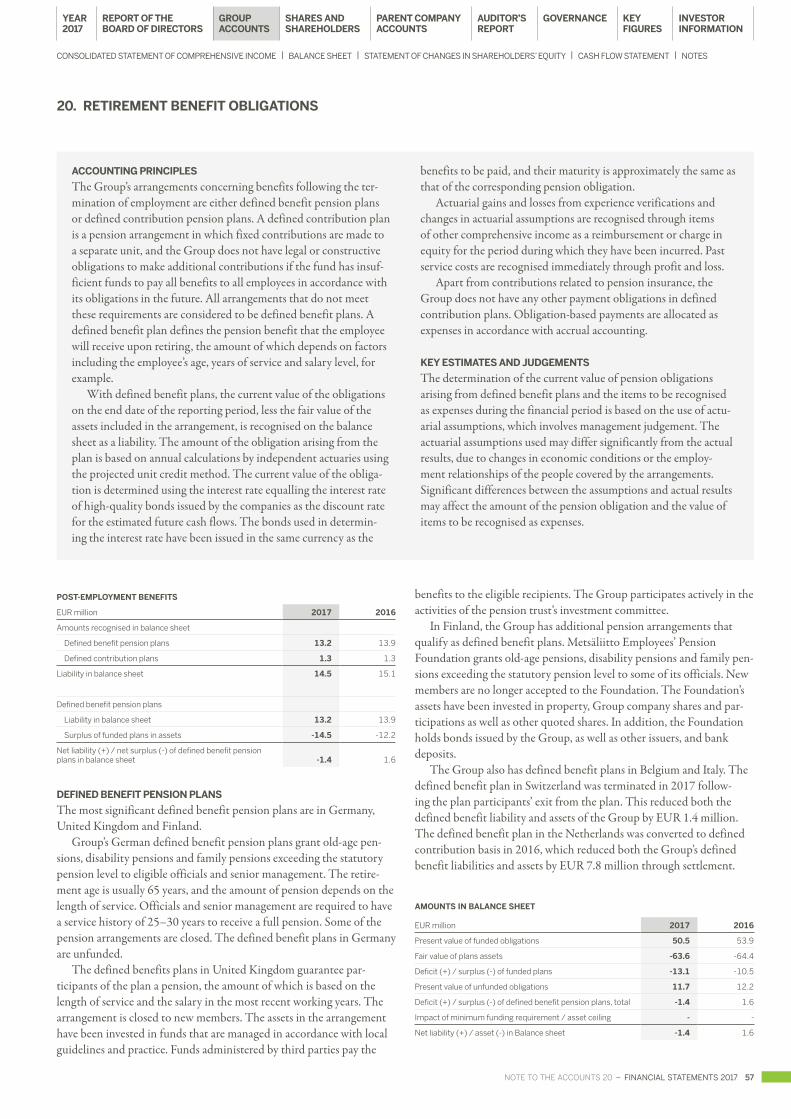
NOTE TO THE ACCOUNTS 20 – FINANCIAL STATEMENTS 2017 57
20. RETIREMENT BENEFIT OBLIGATIONS
ACCOUNTING PRINCIPLES
The Group’s arrangements concerning benefits following the ter-mination of employment are either defined benefit pension plans or defined contribution pension plans. A defined contribution plan is a pension arrangement in which fixed contributions are made to a separate unit, and the Group does not have legal or constructive obligations to make additional contributions if the fund has insuf-ficient funds to pay all benefits to all employees in accordance with its obligations in the future. All arrangements that do not meet these requirements are considered to be defined benefit plans. A defined benefit plan defines the pension benefit that the employee will receive upon retiring, the amount of which depends on factors including the employee’s age, years of service and salary level, for example.
With defined benefit plans, the current value of the obligations on the end date of the reporting period, less the fair value of the assets included in the arrangement, is recognised on the balance sheet as a liability. The amount of the obligation arising from the plan is based on annual calculations by independent actuaries using the projected unit credit method. The current value of the obliga-tion is determined using the interest rate equalling the interest rate of high-quality bonds issued by the companies as the discount rate for the estimated future cash flows. The bonds used in determin-ing the interest rate have been issued in the same currency as the
benefits to be paid, and their maturity is approximately the same as that of the corresponding pension obligation.
Actuarial gains and losses from experience verifications and changes in actuarial assumptions are recognised through items of other comprehensive income as a reimbursement or charge in equity for the period during which they have been incurred. Past service costs are recognised immediately through profit and loss.
Apart from contributions related to pension insurance, the Group does not have any other payment obligations in defined contribution plans. Obligation-based payments are allocated as expenses in accordance with accrual accounting.
KEY ESTIMATES AND JUDGEMENTS
The determination of the current value of pension obligations arising from defined benefit plans and the items to be recognised as expenses during the financial period is based on the use of actu-arial assumptions, which involves management judgement. The actuarial assumptions used may differ significantly from the actual results, due to changes in economic conditions or the employ-ment relationships of the people covered by the arrangements. Significant differences between the assumptions and actual results may affect the amount of the pension obligation and the value of items to be recognised as expenses.
NOTE TO THE ACCOUNTS 20
POST-EMPLOYMENT BENEFITS
EUR million 2017 2016
Amounts recognised in balance sheet
Defined benefit pension plans 13.2 13.9
Defined contribution plans 1.3 1.3
Liability in balance sheet 14.5 15.1
Defined benefit pension plans
Liability in balance sheet 13.2 13.9
Surplus of funded plans in assets -14.5 -12.2
Net liability (+) / net surplus (-) of defined benefit pension plans in balance sheet -1.4 1.6
DEFINED BENEFIT PENSION PLANS
The most significant defined benefit pension plans are in Germany, United Kingdom and Finland.
Group’s German defined benefit pension plans grant old-age pen-sions, disability pensions and family pensions exceeding the statutory pension level to eligible officials and senior management. The retire-ment age is usually 65 years, and the amount of pension depends on the length of service. Officials and senior management are required to have a service history of 25–30 years to receive a full pension. Some of the pension arrangements are closed. The defined benefit plans in Germany are unfunded.
The defined benefits plans in United Kingdom guarantee par-ticipants of the plan a pension, the amount of which is based on the length of service and the salary in the most recent working years. The arrangement is closed to new members. The assets in the arrangement have been invested in funds that are managed in accordance with local guidelines and practice. Funds administered by third parties pay the
benefits to the eligible recipients. The Group participates actively in the activities of the pension trust’s investment committee.
In Finland, the Group has additional pension arrangements that qualify as defined benefit plans. Metsäliitto Employees’ Pension Foundation grants old-age pensions, disability pensions and family pen-sions exceeding the statutory pension level to some of its officials. New members are no longer accepted to the Foundation. The Foundation’s assets have been invested in property, Group company shares and par-ticipations as well as other quoted shares. In addition, the Foundation holds bonds issued by the Group, as well as other issuers, and bank deposits.
The Group also has defined benefit plans in Belgium and Italy. The defined benefit plan in Switzerland was terminated in 2017 follow-ing the plan participants’ exit from the plan. This reduced both the defined benefit liability and assets of the Group by EUR 1.4 million. The defined benefit plan in the Netherlands was converted to defined contribution basis in 2016, which reduced both the Group’s defined benefit liabilities and assets by EUR 7.8 million through settlement.
AMOUNTS IN BALANCE SHEET
EUR million 2017 2016
Present value of funded obligations 50.5 53.9
Fair value of plans assets -63.6 -64.4
Deficit (+) / surplus (-) of funded plans -13.1 -10.5
Present value of unfunded obligations 11.7 12.2
Deficit (+) / surplus (-) of defined benefit pension plans, total -1.4 1.6
Impact of minimum funding requirement / asset ceiling - -
Net liability (+) / asset (-) in Balance sheet -1.4 1.6
YEAR 2017
REPORT OF THE BOARD OF DIRECTORS
GROUP ACCOUNTS
SHARES AND SHAREHOLDERS
PARENT COMPANY ACCOUNTS
AUDITOR’S REPORT
GOVERNANCE KEY FIGURES
INVESTOR INFORMATION
CONSOLIDATED STATEMENT OF COMPREHENSIVE INCOME | BALANCE SHEET | STATEMENT OF CHANGES IN SHAREHOLDERS’ EQUITY | CASH FLOW STATEMENT | NOTES

58 FINANCIAL STATEMENTS 2017 – NOTE TO THE ACCOUNTS 20
DEFINED BENEFIT PENSION OBLIGATIONS AND PLAN ASSETS BY COUNTRY IN 2017
EUR million Germany United Kingdom Finland Other countries Total
Present value of obligations 10.4 35.4 13.4 3.0 62.3
Fair value of plan assets - -47.0 -15.2 -1.4 -63.6
Total 10.4 -11.6 -1.8 1.6 -1.4
DEFINED BENEFIT PENSION OBLIGATIONS AND PLAN ASSETS BY COUNTRY IN 2016
EUR million Germany United Kingdom Finland Other countries Total
Present value of obligations 10.7 36.4 14.2 4.8 66.1
Fair value of plan assets - -45.7 -15.9 -2.8 -64.4
Total 10.7 -9.3 -1.7 2.0 1.6
CHANGE OF DEFINED BENEFIT PENSION OBLIGATIONS IN 2017
EUR millionPresent value
of obligationFair value of plan assets Total
1 Jan 2017 66.1 -64.4 1.6
Current service cost 0.3 - 0.3
Administrative costs - 0.0 0.0
Interest expense (+) or interest income (-) 1.3 -1.4 -0.1
Past service cost -0.3 - -0.3
Total amount recognised in profit and loss 1.3 -1.4 -0.2
Remeasurements in other comprehensive income
The return on plan assets, excl. amounts included in interest - -5.0 -5.0
Gains (-) and losses (+) from change in demographic assumptions -0.2 - -0.2
Gains (-) and losses (+) from change in financial assumptions 0.5 - 0.5
Experience gains and losses 0.5 - 0.5
Total remeasuments in other comprehensive income 0.8 -5.0 -4.2
Translation differences -1.4 1.7 0.3
Contribution
Employers - 1.7 1.7
Plan participants 0.0 0.0 0.0
Payments from plans
Benefit payments -4.5 3.8 -0.7
Settlements 0.0 - 0.0
31 Dec 2017 62.3 -63.6 -1.4
CHANGE OF DEFINED BENEFIT PENSION OBLIGATIONS IN 2016
EUR millionPresent value
of obligationFair value of plan assets Total
1 Jan 2016 72.9 -69.7 3.2
Current service cost 0.4 - 0.4
Administrative costs - 0.0 0.0
Interest expense (+) or interest income (-) 2.0 -2.2 -0.2
Past service cost 0.0 - 0.0
Total amount recognised in profit and loss 2.4 -2.2 0.2
Remeasurements in other comprehensive income
The return on plan assets, excl. amounts included in interest - -10.9 -10.9
Gains (-) and losses (+) from change in demographic assumptions -0.6 - -0.6
Gains (-) and losses (+) from change in financial assumptions 9.9 - 9.9
Experience gains and losses 0.1 - 0.1
Total remeasuments in other comprehensive income 9.4 -10.9 -1.5
Translation differences -5.1 6.3 1.3
Contribution
Employers - -0.8 -0.8
Plan participants 0.0 -0.1 -0.1
Payments from plans
Benefit payments -5.7 5.1 -0.6
Settlements -7.8 7.8 0.0
31 Dec 2016 66.1 -64.4 1.6
NOTE TO THE ACCOUNTS 20YEAR 2017
REPORT OF THE BOARD OF DIRECTORS
GROUP ACCOUNTS
SHARES AND SHAREHOLDERS
PARENT COMPANY ACCOUNTS
AUDITOR’S REPORT
GOVERNANCE KEY FIGURES
INVESTOR INFORMATION
CONSOLIDATED STATEMENT OF COMPREHENSIVE INCOME | BALANCE SHEET | STATEMENT OF CHANGES IN SHAREHOLDERS’ EQUITY | CASH FLOW STATEMENT | NOTES
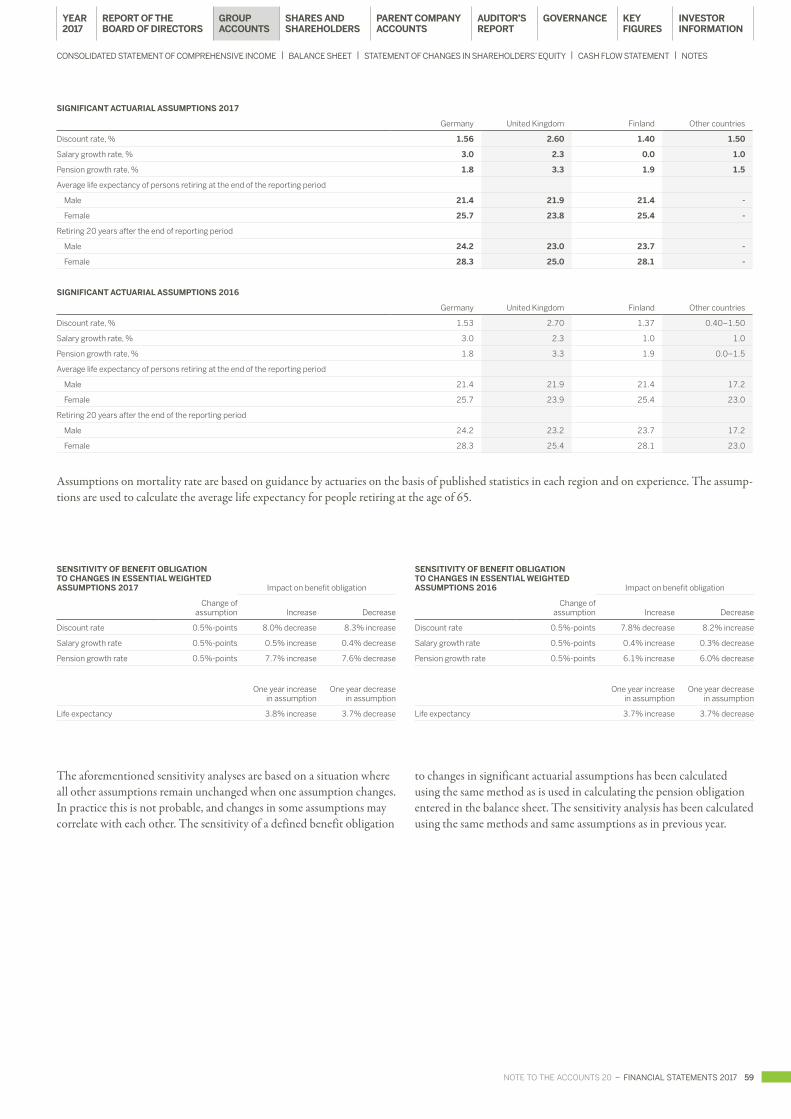
NOTE TO THE ACCOUNTS 20 – FINANCIAL STATEMENTS 2017 59
SENSITIVITY OF BENEFIT OBLIGATION TO CHANGES IN ESSENTIAL WEIGHTED ASSUMPTIONS 2017 Impact on benefit obligation
Change of assumption Increase Decrease
Discount rate 0.5%-points 8.0% decrease 8.3% increase
Salary growth rate 0.5%-points 0.5% increase 0.4% decrease
Pension growth rate 0.5%-points 7.7% increase 7.6% decrease
One year increase in assumption
One year decrease in assumption
Life expectancy 3.8% increase 3.7% decrease
SENSITIVITY OF BENEFIT OBLIGATION TO CHANGES IN ESSENTIAL WEIGHTED ASSUMPTIONS 2016 Impact on benefit obligation
Change of assumption Increase Decrease
Discount rate 0.5%-points 7.8% decrease 8.2% increase
Salary growth rate 0.5%-points 0.4% increase 0.3% decrease
Pension growth rate 0.5%-points 6.1% increase 6.0% decrease
One year increase in assumption
One year decrease in assumption
Life expectancy 3.7% increase 3.7% decrease
The aforementioned sensitivity analyses are based on a situation where all other assumptions remain unchanged when one assumption changes. In practice this is not probable, and changes in some assumptions may correlate with each other. The sensitivity of a defined benefit obligation
to changes in significant actuarial assumptions has been calculated using the same method as is used in calculating the pension obligation entered in the balance sheet. The sensitivity analysis has been calculated using the same methods and same assumptions as in previous year.
SIGNIFICANT ACTUARIAL ASSUMPTIONS 2017
Germany United Kingdom Finland Other countries
Discount rate, % 1.56 2.60 1.40 1.50
Salary growth rate, % 3.0 2.3 0.0 1.0
Pension growth rate, % 1.8 3.3 1.9 1.5
Average life expectancy of persons retiring at the end of the reporting period
Male 21.4 21.9 21.4 -
Female 25.7 23.8 25.4 -
Retiring 20 years after the end of reporting period
Male 24.2 23.0 23.7 -
Female 28.3 25.0 28.1 -
SIGNIFICANT ACTUARIAL ASSUMPTIONS 2016
Germany United Kingdom Finland Other countries
Discount rate, % 1.53 2.70 1.37 0.40–1.50
Salary growth rate, % 3.0 2.3 1.0 1.0
Pension growth rate, % 1.8 3.3 1.9 0.0–1.5
Average life expectancy of persons retiring at the end of the reporting period
Male 21.4 21.9 21.4 17.2
Female 25.7 23.9 25.4 23.0
Retiring 20 years after the end of the reporting period
Male 24.2 23.2 23.7 17.2
Female 28.3 25.4 28.1 23.0
Assumptions on mortality rate are based on guidance by actuaries on the basis of published statistics in each region and on experience. The assump-tions are used to calculate the average life expectancy for people retiring at the age of 65.
YEAR 2017
REPORT OF THE BOARD OF DIRECTORS
GROUP ACCOUNTS
SHARES AND SHAREHOLDERS
PARENT COMPANY ACCOUNTS
AUDITOR’S REPORT
GOVERNANCE KEY FIGURES
INVESTOR INFORMATION
CONSOLIDATED STATEMENT OF COMPREHENSIVE INCOME | BALANCE SHEET | STATEMENT OF CHANGES IN SHAREHOLDERS’ EQUITY | CASH FLOW STATEMENT | NOTES
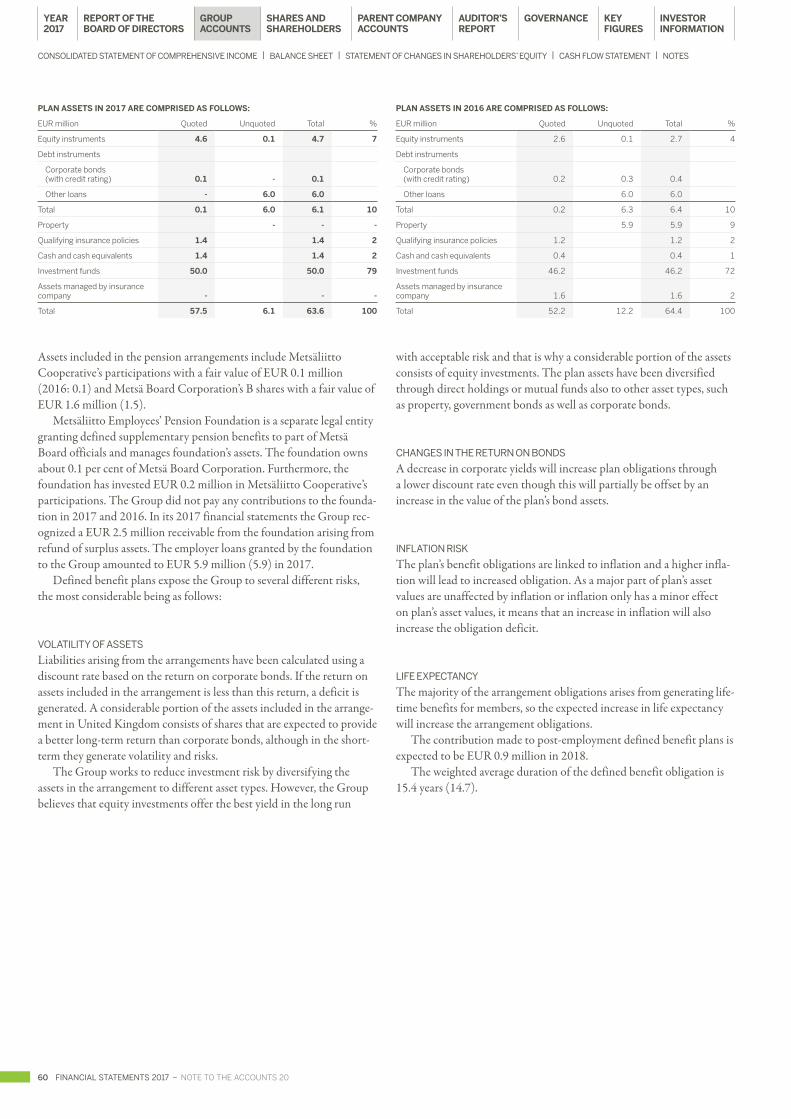
60 FINANCIAL STATEMENTS 2017 – NOTE TO THE ACCOUNTS 20
PLAN ASSETS IN 2017 ARE COMPRISED AS FOLLOWS:
EUR million Quoted Unquoted Total %
Equity instruments 4.6 0.1 4.7 7
Debt instruments
Corporate bonds (with credit rating) 0.1 - 0.1
Other loans - 6.0 6.0
Total 0.1 6.0 6.1 10
Property - - -
Qualifying insurance policies 1.4 1.4 2
Cash and cash equivalents 1.4 1.4 2
Investment funds 50.0 50.0 79
Assets managed by insurance company - - -
Total 57.5 6.1 63.6 100
PLAN ASSETS IN 2016 ARE COMPRISED AS FOLLOWS:
EUR million Quoted Unquoted Total %
Equity instruments 2.6 0.1 2.7 4
Debt instruments
Corporate bonds (with credit rating) 0.2 0.3 0.4
Other loans 6.0 6.0
Total 0.2 6.3 6.4 10
Property 5.9 5.9 9
Qualifying insurance policies 1.2 1.2 2
Cash and cash equivalents 0.4 0.4 1
Investment funds 46.2 46.2 72
Assets managed by insurance company 1.6 1.6 2
Total 52.2 12.2 64.4 100
Assets included in the pension arrangements include Metsäliitto Cooperative’s participations with a fair value of EUR 0.1 million (2016: 0.1) and Metsä Board Corporation’s B shares with a fair value of EUR 1.6 million (1.5).
Metsäliitto Employees’ Pension Foundation is a separate legal entity granting defined supplementary pension benefits to part of Metsä Board officials and manages foundation’s assets. The foundation owns about 0.1 per cent of Metsä Board Corporation. Furthermore, the foundation has invested EUR 0.2 million in Metsäliitto Cooperative’s participations. The Group did not pay any contributions to the founda-tion in 2017 and 2016. In its 2017 financial statements the Group rec-ognized a EUR 2.5 million receivable from the foundation arising from refund of surplus assets. The employer loans granted by the foundation to the Group amounted to EUR 5.9 million (5.9) in 2017.
Defined benefit plans expose the Group to several different risks, the most considerable being as follows:
VOLATILITY OF ASSETS
Liabilities arising from the arrangements have been calculated using a discount rate based on the return on corporate bonds. If the return on assets included in the arrangement is less than this return, a deficit is generated. A considerable portion of the assets included in the arrange-ment in United Kingdom consists of shares that are expected to provide a better long-term return than corporate bonds, although in the short-term they generate volatility and risks.
The Group works to reduce investment risk by diversifying the assets in the arrangement to different asset types. However, the Group believes that equity investments offer the best yield in the long run
with acceptable risk and that is why a considerable portion of the assets consists of equity investments. The plan assets have been diversified through direct holdings or mutual funds also to other asset types, such as property, government bonds as well as corporate bonds.
CHANGES IN THE RETURN ON BONDS
A decrease in corporate yields will increase plan obligations through a lower discount rate even though this will partially be offset by an increase in the value of the plan’s bond assets.
INFLATION RISK
The plan’s benefit obligations are linked to inflation and a higher infla-tion will lead to increased obligation. As a major part of plan’s asset values are unaffected by inflation or inflation only has a minor effect on plan’s asset values, it means that an increase in inflation will also increase the obligation deficit.
LIFE EXPECTANCY
The majority of the arrangement obligations arises from generating life-time benefits for members, so the expected increase in life expectancy will increase the arrangement obligations.
The contribution made to post-employment defined benefit plans is expected to be EUR 0.9 million in 2018.
The weighted average duration of the defined benefit obligation is 15.4 years (14.7).
YEAR 2017
REPORT OF THE BOARD OF DIRECTORS
GROUP ACCOUNTS
SHARES AND SHAREHOLDERS
PARENT COMPANY ACCOUNTS
AUDITOR’S REPORT
GOVERNANCE KEY FIGURES
INVESTOR INFORMATION
CONSOLIDATED STATEMENT OF COMPREHENSIVE INCOME | BALANCE SHEET | STATEMENT OF CHANGES IN SHAREHOLDERS’ EQUITY | CASH FLOW STATEMENT | NOTES
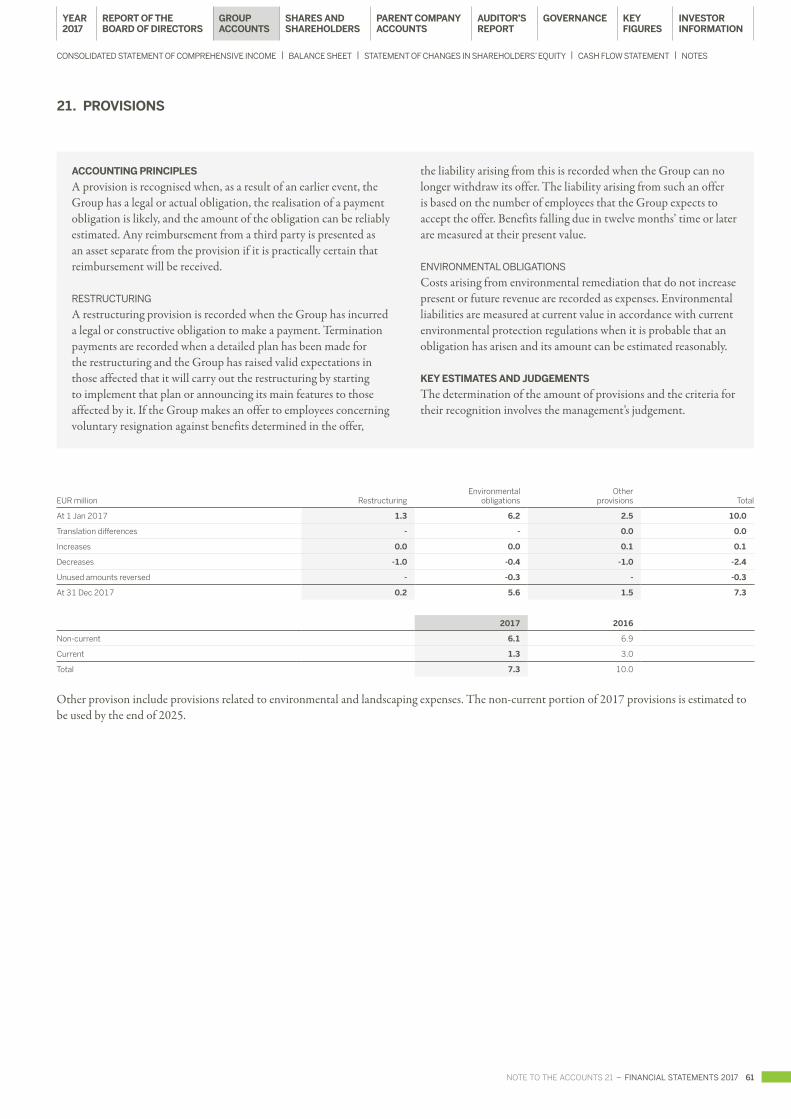
NOTE TO THE ACCOUNTS 21 – FINANCIAL STATEMENTS 2017 61
21. PROVISIONS
ACCOUNTING PRINCIPLES
A provision is recognised when, as a result of an earlier event, the Group has a legal or actual obligation, the realisation of a payment obligation is likely, and the amount of the obligation can be reliably estimated. Any reimbursement from a third party is presented as an asset separate from the provision if it is practically certain that reimbursement will be received.
RESTRUCTURING
A restructuring provision is recorded when the Group has incurred a legal or constructive obligation to make a payment. Termination payments are recorded when a detailed plan has been made for the restructuring and the Group has raised valid expectations in those affected that it will carry out the restructuring by starting to implement that plan or announcing its main features to those affected by it. If the Group makes an offer to employees concerning voluntary resignation against benefits determined in the offer,
the liability arising from this is recorded when the Group can no longer withdraw its offer. The liability arising from such an offer is based on the number of employees that the Group expects to accept the offer. Benefits falling due in twelve months’ time or later are measured at their present value.
ENVIRONMENTAL OBLIGATIONS
Costs arising from environmental remediation that do not increase present or future revenue are recorded as expenses. Environmental liabilities are measured at current value in accordance with current environmental protection regulations when it is probable that an obligation has arisen and its amount can be estimated reasonably.
KEY ESTIMATES AND JUDGEMENTS
The determination of the amount of provisions and the criteria for their recognition involves the management’s judgement.
EUR million RestructuringEnvironmental
obligationsOther
provisions Total
At 1 Jan 2017 1.3 6.2 2.5 10.0
Translation differences - - 0.0 0.0
Increases 0.0 0.0 0.1 0.1
Decreases -1.0 -0.4 -1.0 -2.4
Unused amounts reversed - -0.3 - -0.3
At 31 Dec 2017 0.2 5.6 1.5 7.3
2017 2016
Non-current 6.1 6.9
Current 1.3 3.0
Total 7.3 10.0
Other provison include provisions related to environmental and landscaping expenses. The non-current portion of 2017 provisions is estimated to be used by the end of 2025.
NOTE TO THE ACCOUNTS 21YEAR 2017
REPORT OF THE BOARD OF DIRECTORS
GROUP ACCOUNTS
SHARES AND SHAREHOLDERS
PARENT COMPANY ACCOUNTS
AUDITOR’S REPORT
GOVERNANCE KEY FIGURES
INVESTOR INFORMATION
CONSOLIDATED STATEMENT OF COMPREHENSIVE INCOME | BALANCE SHEET | STATEMENT OF CHANGES IN SHAREHOLDERS’ EQUITY | CASH FLOW STATEMENT | NOTES

62 FINANCIAL STATEMENTS 2017 – NOTE TO THE ACCOUNTS 22
NOTE TO THE ACCOUNTS 22
22. BORROWINGS
ACCOUNTING PRINCIPLES
Financial liabilities are categorised in accordance with IAS 39 and initially recognised at fair value. The Group has classified all financial liabilities under “Other liabilities”. Transaction costs are included in the original book value of financial liabilities measured at amortised cost.
Subsequently, all financial liabilities are measured at amortised cost using the effective interest method.
EUR million 2017 2016
NON-CURRENT INTEREST-BEARING FINANCIAL LIABILITIES
Bonds 308.0 222.7
Loans from financial institutions 163.2 149.0
Pension loans 56.6 89.2
Finance lease liabilities 5.5 7.0
Other liabilities 1.1 1.1
Non-current interest-bearing financial liabilities, total 534.5 469.0
CURRENT INTEREST-BEARING FINANCIAL LIABILITIES
Current portion of non-current debt 41.1 154.7
Interest bearing current liabilities to Group companies 1.4 64.3
Current interest-bearing financial liabilities, total 42.5 219.1
Interest-bearing financial liabilities, total 577.0 688.0
EUR million 2017 2016
NON-CURRENT INTEREST-BEARING FINANCIALASSETS
Loan receivables 3.5 3.6
Non-current interest-bearing financial assets, total 3.5 3.6
CURRENT
Loans receivables and other receivables 0.1 0.0
Current investments at amortised cost 0.0 0.5
Cash at hand and in bank, deposits to Metsä Group Treasury Oy 215.1 220.1
Current interest-bearing financial assets, total 215.2 220.7
Interest-bearing financial assets, total 218.6 224.3
Interest-bearing net liabilities, total 358.4 463.8
Metsä Board has classified interest-bearing receivables comparable to cash funds and available immediately from Metsä Group’s internal bank Metsä Group Treasury Oy as Cash and cash equivalents.
CASH AND NON-CASH CHANGES IN FINANCIAL LIABILITIES
Non-cash changes
EUR million 1 JAN 2017 Cash flowsChanges in foreign
exchange rates New leases Other changes 31 DEC 2017
Non-current interest-bearing liabilities incl. current portion
Bonds 222.7 84.5 - - 0.8 308.0
Loans from financial institutions 199.0 -36.1 - - 0.5 163.4
Pension loans 127.6 -32.5 - - - 95.1
Finance lease liabilities 23.4 -16.4 -0.2 1.2 - 7.9
Other liabilities 51.0 -49.9 - - - 1.1
Total 623.7 -50.5 -0.2 1.2 1.3 575.6
Current interest-bearing liabilities 64.3 -62.3 -0.6 - - 1.4
Current interest-bearing receivables 0.0 0.0 - - - 0.0
Non-current non-interest bearing liabilities 0.1 0.0 0.0 - 0.1 0.2
Total 688.2 -112.7 -0.8 1.2 1.3 577.2
Other changes consist mostly of accrual of effective interest during the financial year on financial liabilities valued at amortised cost.
YEAR 2017
REPORT OF THE BOARD OF DIRECTORS
GROUP ACCOUNTS
SHARES AND SHAREHOLDERS
PARENT COMPANY ACCOUNTS
AUDITOR’S REPORT
GOVERNANCE KEY FIGURES
INVESTOR INFORMATION
CONSOLIDATED STATEMENT OF COMPREHENSIVE INCOME | BALANCE SHEET | STATEMENT OF CHANGES IN SHAREHOLDERS’ EQUITY | CASH FLOW STATEMENT | NOTES

NOTES TO THE ACCOUNTS 23–25 – FINANCIAL STATEMENTS 2017 63
NOTES TO THE ACCOUNTS 23–25
BONDS
EUR million Interest % 2017 2016
2014–2019 4.00 59.9 222.7
2017–2027 2.75 248.1 -
Total 308.0 222.7
Metsä Board Corporation has a bond with original value of EUR 225 million issued in March 2014, of which the outstanding nominal value is EUR 60.4 million after the repurchases made in 2017. The bond car-ries a fixed coupon rate of 4.0 per cent, and maturity date is 13 March 2019. The bond ranks senior and is unsecured.
Metsä Board Corporation issued in September 2017 a bond of EUR 250 million. The bond carries a fixed coupon rate of 2.75 per cent, and the maturity date is 29 September 2027. The bond ranks senior and is unsecured.
As of 31 December 2017, Metsä Group Treasury Oy did not hold bonds issued by Metsä Board Corporation (31.12.2016 held EUR 9.2 million).
MATURITY OF FINANCE LEASE LIABILITIES
Minimum lease paymentsPresent value of
minimum lease payments
EUR million 2017 2016 2017 2016
Not later than 1 year 2.6 16.6 2.4 16.4
1–2 years 1.9 2.4 1.7 2.2
2–3 years 1.6 1.8 1.5 1.7
3–4 years 0.9 1.3 0.9 1.3
4–5 years 0.7 0.9 0.7 0.8
Later than 5 years 0.7 1.1 0.7 1.0
Total 8.4 24.0 7.9 23.4
Future finance charges 0.4 0.7
The present value of minimum lease payments 7.9 23.4
Finance lease liabilities decreased materially during the financial year following the purchase of previously leased power plant assets by Äänevoima Oy in December 2017. The remaining finance lease contracts cover various smaller items of production machinery and equipment.
23. OTHER NON-CURRENT LIABILITIES
EUR million 2017 2016
Non-interest bearing non-current liabilities to Group companies - -
Non-interest bearing non-current liabilities to others
Accruals and deferred income 0.2 0.1
Other liabilities 0.0 0.0
Total non-interest bearing non-current liabilities 0.2 0.1
Liabilities to Group companies are liabilities to parent company Metsäliitto Corporative and other subsidiaries of the parent company. Derivative liabilities are to Metsä Group Treasury Oy, a wholly owned subsidiary of Metsäliitto Cooperative.
24. ACCOUNTS PAYABLE AND OTHER LIABILITIES
EUR million 2017 2016
Non-interest bearing current liabilities to Group companies
Accounts payable 49.1 40.8
Other liabilities 0.2 2.3
Non-interest bearing current liabilities to associated companies and joint ventures
Accounts payable 1.3 1.2
Non-interest bearing current liabilities to others
Advance payments 6.1 9.4
Accounts payable 248.3 209.8
Other liabilities 8.5 8.1
Accruals and deferred income 49.6 61.6
Total 363.0 333.2
Liabilities to Group companies are liabilities to parent company Metsäliitto Corporative and other subsidiaries of the parent company. Derivative liabilities are to Metsä Group Treasury Oy, a wholly owned subsidiary of Metsäliitto Cooperative.
25. MANAGEMENT OF FINANCIAL RISKS
The financial risks associated with business operations are managed in accordance with the financial policy endorsed by the Board of Directors and the senior management of the company. The policy defines focal instructions on the management of foreign currency, inter-est rate, liquidity and counterparty risks, and for the use of derivative financial instruments. Correspondingly, commodity risks are managed according to the company’s commodity risk policy. The purpose is to protect the company against major financial and commodity risks, to balance the cash flow and to allow the business units time to adjust their operations to changing conditions.
Metsä Group Treasury Oy is specialized in finance and functions as the Group’s internal bank. Metsäliitto Cooperative´s holding is 100 per cent of the company. Financial operations have been centralised to Metsä Group Treasury, which is in charge of managing the Group companies’ financial positions according to the strategy and financial policy, providing necessary financial services and acting as an advisor in financial matters.
FOREIGN CURRENCY RISK
The Group’s foreign currency exposure consists of the risks associated with foreign currency flows, translation risk of net investments in foreign entities and economic currency exposure. Most of the Group’s costs are incurred in the euro zone and to some extent in Sweden, but a significant part of the sales is in other currencies. Sales may therefore vary because of changes in exchange rates, while production costs remain unchanged. Product prices are also often quoted in currencies other than the home currency. The foreign currency transaction expo-sure is consisting of foreign currency denominated sales and costs. The
YEAR 2017
REPORT OF THE BOARD OF DIRECTORS
GROUP ACCOUNTS
SHARES AND SHAREHOLDERS
PARENT COMPANY ACCOUNTS
AUDITOR’S REPORT
GOVERNANCE KEY FIGURES
INVESTOR INFORMATION
CONSOLIDATED STATEMENT OF COMPREHENSIVE INCOME | BALANCE SHEET | STATEMENT OF CHANGES IN SHAREHOLDERS’ EQUITY | CASH FLOW STATEMENT | NOTES
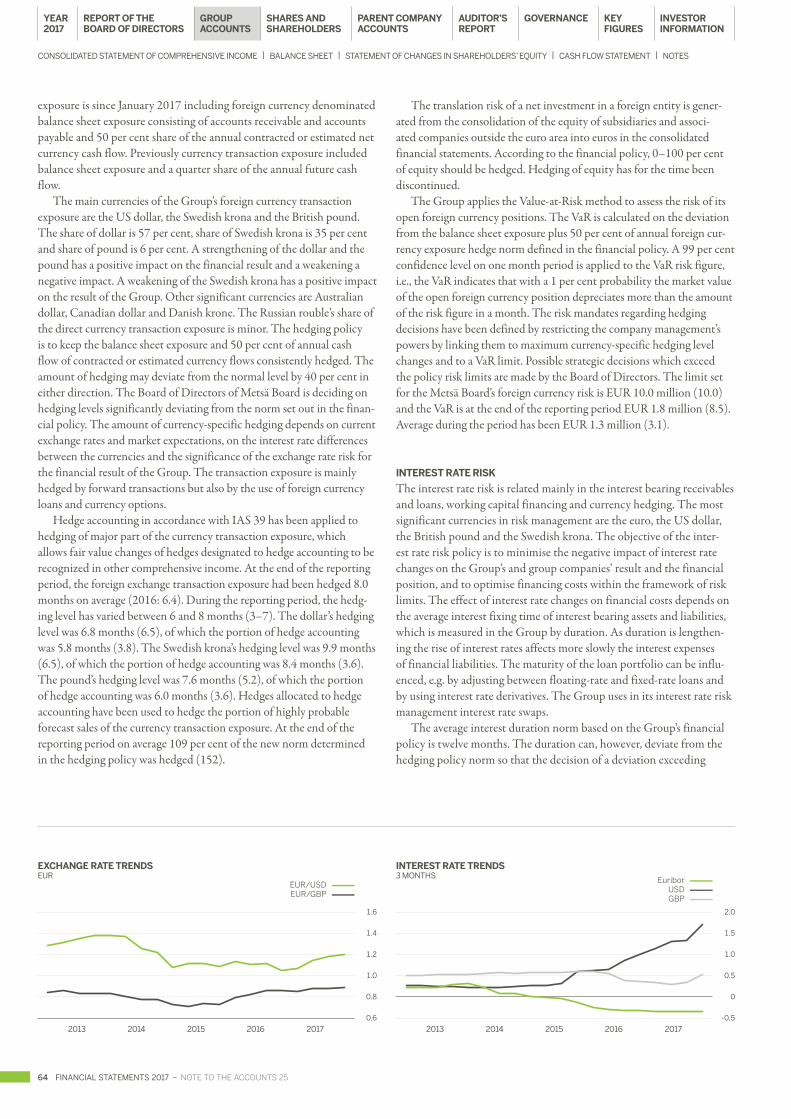
64 FINANCIAL STATEMENTS 2017 – NOTE TO THE ACCOUNTS 25
exposure is since January 2017 including foreign currency denominated balance sheet exposure consisting of accounts receivable and accounts payable and 50 per cent share of the annual contracted or estimated net currency cash flow. Previously currency transaction exposure included balance sheet exposure and a quarter share of the annual future cash flow.
The main currencies of the Group’s foreign currency transaction exposure are the US dollar, the Swedish krona and the British pound. The share of dollar is 57 per cent, share of Swedish krona is 35 per cent and share of pound is 6 per cent. A strengthening of the dollar and the pound has a positive impact on the financial result and a weakening a negative impact. A weakening of the Swedish krona has a positive impact on the result of the Group. Other significant currencies are Australian dollar, Canadian dollar and Danish krone. The Russian rouble’s share of the direct currency transaction exposure is minor. The hedging policy is to keep the balance sheet exposure and 50 per cent of annual cash flow of contracted or estimated currency flows consistently hedged. The amount of hedging may deviate from the normal level by 40 per cent in either direction. The Board of Directors of Metsä Board is deciding on hedging levels significantly deviating from the norm set out in the finan-cial policy. The amount of currency-specific hedging depends on current exchange rates and market expectations, on the interest rate differences between the currencies and the significance of the exchange rate risk for the financial result of the Group. The transaction exposure is mainly hedged by forward transactions but also by the use of foreign currency loans and currency options.
Hedge accounting in accordance with IAS 39 has been applied to hedging of major part of the currency transaction exposure, which allows fair value changes of hedges designated to hedge accounting to be recognized in other comprehensive income. At the end of the reporting period, the foreign exchange transaction exposure had been hedged 8.0 months on average (2016: 6.4). During the reporting period, the hedg-ing level has varied between 6 and 8 months (3–7). The dollar’s hedging level was 6.8 months (6.5), of which the portion of hedge accounting was 5.8 months (3.8). The Swedish krona’s hedging level was 9.9 months (6.5), of which the portion of hedge accounting was 8.4 months (3.6). The pound’s hedging level was 7.6 months (5.2), of which the portion of hedge accounting was 6.0 months (3.6). Hedges allocated to hedge accounting have been used to hedge the portion of highly probable forecast sales of the currency transaction exposure. At the end of the reporting period on average 109 per cent of the new norm determined in the hedging policy was hedged (152).
The translation risk of a net investment in a foreign entity is gener-ated from the consolidation of the equity of subsidiaries and associ-ated companies outside the euro area into euros in the consolidated financial statements. According to the financial policy, 0–100 per cent of equity should be hedged. Hedging of equity has for the time been discontinued.
The Group applies the Value-at-Risk method to assess the risk of its open foreign currency positions. The VaR is calculated on the deviation from the balance sheet exposure plus 50 per cent of annual foreign cur-rency exposure hedge norm defined in the financial policy. A 99 per cent confidence level on one month period is applied to the VaR risk figure, i.e., the VaR indicates that with a 1 per cent probability the market value of the open foreign currency position depreciates more than the amount of the risk figure in a month. The risk mandates regarding hedging decisions have been defined by restricting the company management’s powers by linking them to maximum currency-specific hedging level changes and to a VaR limit. Possible strategic decisions which exceed the policy risk limits are made by the Board of Directors. The limit set for the Metsä Board’s foreign currency risk is EUR 10.0 million (10.0) and the VaR is at the end of the reporting period EUR 1.8 million (8.5). Average during the period has been EUR 1.3 million (3.1).
INTEREST RATE RISK
The interest rate risk is related mainly in the interest bearing receivables and loans, working capital financing and currency hedging. The most significant currencies in risk management are the euro, the US dollar, the British pound and the Swedish krona. The objective of the inter-est rate risk policy is to minimise the negative impact of interest rate changes on the Group’s and group companies’ result and the financial position, and to optimise financing costs within the framework of risk limits. The effect of interest rate changes on financial costs depends on the average interest fixing time of interest bearing assets and liabilities, which is measured in the Group by duration. As duration is lengthen-ing the rise of interest rates affects more slowly the interest expenses of financial liabilities. The maturity of the loan portfolio can be influ-enced, e.g. by adjusting between floating-rate and fixed-rate loans and by using interest rate derivatives. The Group uses in its interest rate risk management interest rate swaps.
The average interest duration norm based on the Group’s financial policy is twelve months. The duration can, however, deviate from the hedging policy norm so that the decision of a deviation exceeding
NOTE TO THE ACCOUNTS 25
1.6
1.4
1.2
1.0
0.8
0.6
2013 2014 2015 2016 20172013 2014 2015 2016 2017
2.0
1.5
1.0
0.5
0
-0.5
EXCHANGE RATE TRENDSEUR
EUR/USD EUR/GBP
INTEREST RATE TRENDS3 MONTHS Euribor
USD GBP
YEAR 2017
REPORT OF THE BOARD OF DIRECTORS
GROUP ACCOUNTS
SHARES AND SHAREHOLDERS
PARENT COMPANY ACCOUNTS
AUDITOR’S REPORT
GOVERNANCE KEY FIGURES
INVESTOR INFORMATION
CONSOLIDATED STATEMENT OF COMPREHENSIVE INCOME | BALANCE SHEET | STATEMENT OF CHANGES IN SHAREHOLDERS’ EQUITY | CASH FLOW STATEMENT | NOTES

NOTE TO THE ACCOUNTS 25 – FINANCIAL STATEMENTS 2017 65
four months has to be made by the Board of Directors. The average duration of loans was 67.9 months at the end of the year (14.9). During the reporting period duration has varied between 12 and 68 months (14–21). Duration was lengthened in September by the issued 10-year bond of EUR 250 million. Of interest-bearing liabilities, 19 per cent (39) is subjected to variable rates and the rest to fixed rates. The average interest rate of interest-bearing financial liabilities at the end of 2017 was 3.3 per cent (3.3). At the end of 2017, an increase of one per cent in interest rates would decrease net interest costs of the next 12 months by EUR 1.5 million (increase of -0.3).
The Group is exposed to a risk of change in the value of derivatives due to a change in market prices when using interest rate derivatives, since according to IAS 39 derivatives must be valued to their fair value in the balance sheet. However, the applying of hedge accounting will balance the effect of changes in the market value of derivatives on the financial result of the Group. The Group has applied cash flow hedge accounting in accordance with IAS 39 to interest rate swaps by which floating-rate financing has been converted to fixed-rate financing. The gross nominal volume of interest rate derivatives at the time of financial statements is EUR 300.0 million (100.0), of which EUR 250.0 million (100.0) has been allocated to hedge accounting. The maturity of inter-est rate swap contracts varies between 1–9 years (1–2).
COMMODITY RISK
In the hedging of commodity risks the Group applies risk management policies defined separately for each selected commodity. According to the policy, the management of commodity risks with regard to financial hedges is accomplished centrally by Metsä Group Treasury based on the strategy approved by Board of Directors of Metsä Board. The commodity hedging policy has been applied to the management of the price risks of electricity, natural gas, propane, gas oil and pulp, and also transactions related to Emission allowances have been managed by Metsä Group Treasury. Hedge accounting in accordance with IAS 39 has been applied to all commodity hedging.
Metsä Board’s target in managing the electricity price risk is to balance the effect of changes in the price of electricity on the Group’s result and financial position. The main principle is to hedge the elec-tricity purchase exposure, which consists of the difference of factory-specific electricity consumption estimates and power plant production shares in the possession of the Group. With regard to the Finnish and Swedish electricity procurement, the hedge strategy is implemented in cooperation with Metsä Group Energy service unit centrally through Metsä Group Treasury. Metsä Board hedges the electricity price risk actively by setting the hedging norm at 80, 40, 20, 10 and 10 per cent share of the estimated net position during the first, second, third, fourth and fifth successive 12-month periods respectively. Electricity hedging have been carried out by using financial hedges.
Approximately a quarter of Metsä Board’s mills’ purchase of fuel is based on natural gas. The hedging of natural gas price risks has so far been done with physical, fixed-price contracts. Since 2016, the prices of natural gas in Finland have been bound to crude oil prices (Brent), coal price applied in Europe (API2) and the energy price index. Metsä Board is also hedging the price risk of propane purchases by using financial hedges. The hedging strategy of natural gas and propane is based on a risk policy according to which Metsä Group Energy makes the hedging decisions with the support of Metsä Group Treasury, and the Group Board of Directors makes significant strategic decisions.
Metsä Board is hedging also the gas oil price risk hedging related to logistics costs (sea freights) based on risk policy by using financial hedges.
According to the pulp price risk hedging policy, a Group company may selectively hedge its price risk either by financial hedges through Metsä Group Treasury or fixed-price physical contracts. Metsä Board has no valid pulp price risk hedges at the end of the year.
LIQUIDITY RISK
Liquidity risk is defined as the risk that funds and available funding become insufficient to meet business needs, or costs that are incurred in arranging the necessary financing are unreasonable high. Liquidity risk is monitored by estimating the need for liquidity 12–24 months ahead and ensuring that the total liquidity available will cover a main part of this need. According to the finance policy, the liquidity reserve must at all times cover 100 per cent of the Group’s liquidity requirement for the first 12 months and 50–100 per cent of the following 12–24 months liquidity requirement. The objective is that at the most 20 per cent of the Group’s loans, including committed credit facilities, are allowed to mature within the next 12 months, and at least 25 per cent of the total debt must have a maturity in excess of four years. When the financial markets are functioning normally from the company’s point of view, the target is to avoid keeping extra liquidity as liquid funds and instead maintain a liquidity reserve as committed credit facilities outside the balance sheet.
The cornerstone of liquidity risk management is to manage the Group’s operative decisions in such a way that targets concerning indebtedness and sufficient liquidity reserve can be secured in all economic conditions. Liquidity risk is also managed by diversifying the use of capital and money markets to decrease dependency on any single financing source. The optimisation of the maturity structure of loans is also emphasized in financial decisions. Metsä Board is using short-term working capital financing related to accounts receivables and accounts payables.
In September, Metsä Board issued an unsecured bond of EUR 250 million. The bond matures in 2027 and carries a fixed coupon rate of 2.75 per cent. The bond has a Standard & Poor’s credit rating of BB+. In addition, Metsä Board has a bond with original value of EUR 225 million maturing in 2019, of which the outstanding nominal value is EUR 60.4 million after the repurchases made in 2017.
Metsä Board’s liquidity has remained strong. At the end of the review period, available liquidity was EUR 449.2 million (422.6), of which EUR 100.0 million (100.0) consisted of a revolving credit facil-ity, EUR 134.1 million (102.0) consisted of undrawn pension premium (TyEL) funds and EUR 215.1 million (220.6) of liquid assets and investments. Of the liquid funds, EUR 8.1 million consisted of cash and cash equivalents and investments and EUR 207.0 million were cash comparable, interest-bearing immediately drawable receivables from Metsä Group’s internal bank Metsä Group Treasury Oy. In addition the Group had other interest-bearing receivables EUR 3.5 million (3.7). Metsä Board liquidity reserve is supplemented by Metsä Group internal EUR 150.0 million unused short-term funding limit.
At the end of 2017, the liquidity reserve covers fully the forecasted financing need of 2018–2019. 5 per cent (19) of long-term loans and committed facilities fall due in a 12 month period and 49 per cent (13) have a maturity of over four years. The average maturity of long-term loans is 5.4 years (2.2). The share of short-term financing of the Group’s interest bearing liabilities is 0.2 per cent (9.3).
YEAR 2017
REPORT OF THE BOARD OF DIRECTORS
GROUP ACCOUNTS
SHARES AND SHAREHOLDERS
PARENT COMPANY ACCOUNTS
AUDITOR’S REPORT
GOVERNANCE KEY FIGURES
INVESTOR INFORMATION
CONSOLIDATED STATEMENT OF COMPREHENSIVE INCOME | BALANCE SHEET | STATEMENT OF CHANGES IN SHAREHOLDERS’ EQUITY | CASH FLOW STATEMENT | NOTES

66 FINANCIAL STATEMENTS 2017 – NOTE TO THE ACCOUNTS 25
COUNTERPARTY RISK
Financial instruments carry the risk that the Group may incur losses should the counterparty be unable to meet its commitments. The Group is managing this risk by entering into financial transactions only with most creditworthy counterparties and within pre-determined limits. During the reporting period, credit risks of financial instruments did not result in any losses. Cash and cash equivalents, and other invest-ments have been spread to several banks, commercial papers of several institutions and money market funds. Counterparty limits have been revised during the year by taking into account the needs of the company and the view on the financial position of the used counterparties. Derivatives trading is regulated by the standardised ISDA contracts made with the counterparties. Main part of financial credit risks were in 2013 transferred directly out of Metsä Board balance sheet followed by the change of Metsä Group Treasury ownership.
The Group’s accounts receivable carry a counterparty risk that the Group may incur losses should the counterparty be unable to meet its commitments. Credit risk attached to accounts receivable is managed on the basis of the credit risk management policies approved by opera-tive management. Accounts receivable performance is followed weekly by Group Credit Risk Management Team and reported monthly to Corporate Credit Committee and operative management. Credit qual-ity of customers is assessed at regular intervals based on the customers’ financial statements, payment behaviour, credit agencies and credit ratings agencies. Individual credit limits are reviewed at least annually. Letters of Credits, bank and parent company guarantees and Credit insurance are used to mitigate credit risk according to management decisions. Credit limits are approved according to credit risk manage-ment policy with approval limits of varying values across the Group. The Corporate Credit Committee reviews and sets all major credit lim-its which are not supported by credit insurance and/ or other security.
Metsä Board implements regular impairment tests for customer accounts receivables. Credit loss impairment is booked when a cus-tomer enters legal bankruptcy, or becomes past due for more than 6 months (180 days) without a valid payment plan or other acceptable reasons. New credit loss provisions for the year were EUR 0.09 million (2016: 0.35). The portion of overdue client receivables of all accounts receivable is at the time of financial statements 5.7 per cent (9.6), of which 0.0 per cent (0.1) is overdue between 90–180 days and 0.1 per cent (0.2) over 180 days. The specification of doubtful receivables is in the Notes.
The geographical structure of the accounts receivable is diversified and is reflecting the external sales structure presented in the Segment information. The top ten largest sources of credit risk exist in Italy, USA, United Kingdom, Turkey, Germany, Poland, Sweden, Finland, Russia, and Spain (around 63 per cent of total external receivables (59)). The share of largest individual customer (individual companies or groups of companies under common ownership) credit risk exposure of Metsä Board at the end of 2017 represented 5 per cent (6) of total external accounts receivable. 31 per cent (28) of accounts receivable was owed by ten largest customer groups (individual companies or groups of companies under common ownership). At the end of 2017, there was around 3.5 per cent (0.0) shortfall of credit insurance limits beyond usually policy deductibles and exclusions.
MANAGING THE CAPITAL
Terms capital and capital structure are used to describe investments made in the company by its owners and retained earnings (together equity) and debt capital (liabilities) as well as the relation between them. In managing its capital structure, the Group aims at maintaining an efficient capital structure that ensures the Group’s operational condi-tions in financial and capital markets in all circumstances despite the fluctuations typical to the sector. The company has a credit rating for its long-term financing. Certain central target values, which correspond to standard requirements set by financing and capital markets, have been defined for the capital structure. No target level has been defined for the credit rating. The Group’s capital structure is regularly assessed by the Group’s Board of Directors and its Audit Committee.
Metsä Board updated the company’s long-term financial goals and decided on a new dividend policy in 2017. Metsä Board’s target for the comparable return on capital employed is at least 12 per cent. According to the company’s new target, the ratio of interest-bearing net liabilities to comparable EBITDA is a maximum of 2.5. This target level gives the company enough flexibility for potential growth invest-ments in the future. The previous target for net gearing (less than 70 per cent) has been abandoned.
The key ratios describing the capital structure and the capital amounts used for the calculation of the key ratio were on 31.12.2017 and 31.12.2016 the following:
EUR million 2017 2016
Interest-bearing net liabilities / EBITDA, comparable 1.2 2.0
Net gearing ratio, % 31 44
EBITDA, comparable 289.1 231.1
Interest-bearing borrowings 577.0 688.0
./. Liquid funds 215.1 220.6
./. Interest-bearing receivables 3.5 3.7
Interest-bearing net liabilities 358.4 463.8
Equity attributable to shareholders of parent company 1,167.4 1,052.5
+ Non-controlling interest 0.0 0.0
Total 1,167.3 1,052.5
In Group’s certain financial contracts financial covenants have been set regarding financial performance and capital structure. Other covenants in the Group’s loan agreements are customary terms and conditions including for example a negative pledge, restrictions on major asset dis-posals, limitations on subsidiary indebtedness, restrictions on changes of business and mandatory prepayment obligations upon a change of control of the Group. During 2015 the improvement of credit ratings removed part the mentioned restrictions. The Group has been in compliance with its covenants during the accounting periods 2017 and 2016.
In case the company could not meet its obligations as defined in financial contracts and in order to avoid a breach of contract that could have an adverse effect on the company’s financial position, it would need to renegotiate its financial arrangements, payback its loans or get its debtors to give up their claims to meet these obligations.
YEAR 2017
REPORT OF THE BOARD OF DIRECTORS
GROUP ACCOUNTS
SHARES AND SHAREHOLDERS
PARENT COMPANY ACCOUNTS
AUDITOR’S REPORT
GOVERNANCE KEY FIGURES
INVESTOR INFORMATION
CONSOLIDATED STATEMENT OF COMPREHENSIVE INCOME | BALANCE SHEET | STATEMENT OF CHANGES IN SHAREHOLDERS’ EQUITY | CASH FLOW STATEMENT | NOTES
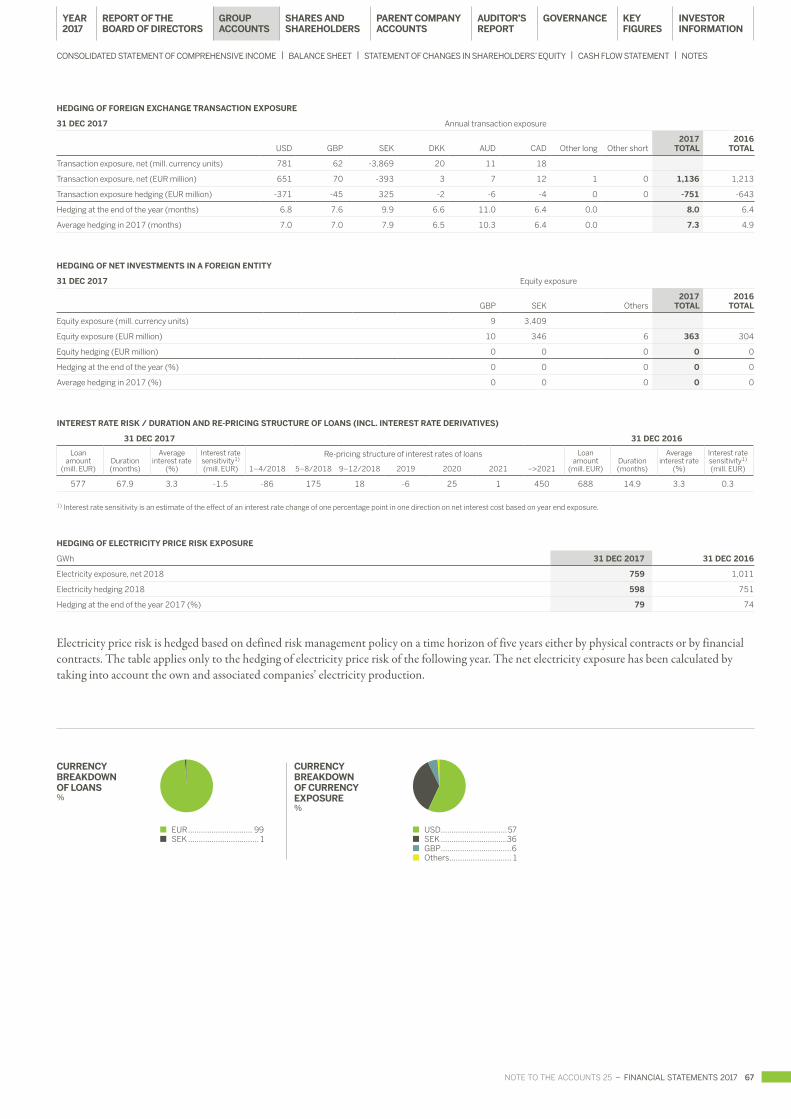
NOTE TO THE ACCOUNTS 25 – FINANCIAL STATEMENTS 2017 67
HEDGING OF FOREIGN EXCHANGE TRANSACTION EXPOSURE
31 DEC 2017 Annual transaction exposure
USD GBP SEK DKK AUD CAD Other long Other short2017
TOTAL2016
TOTAL
Transaction exposure, net (mill. currency units) 781 62 -3,869 20 11 18
Transaction exposure, net (EUR million) 651 70 -393 3 7 12 1 0 1,136 1,213
Transaction exposure hedging (EUR million) -371 -45 325 -2 -6 -4 0 0 -751 -643
Hedging at the end of the year (months) 6.8 7.6 9.9 6.6 11.0 6.4 0.0 8.0 6.4
Average hedging in 2017 (months) 7.0 7.0 7.9 6.5 10.3 6.4 0.0 7.3 4.9
HEDGING OF NET INVESTMENTS IN A FOREIGN ENTITY
31 DEC 2017 Equity exposure
GBP SEK Others2017
TOTAL2016
TOTAL
Equity exposure (mill. currency units) 9 3,409
Equity exposure (EUR million) 10 346 6 363 304
Equity hedging (EUR million) 0 0 0 0 0
Hedging at the end of the year (%) 0 0 0 0 0
Average hedging in 2017 (%) 0 0 0 0 0
INTEREST RATE RISK / DURATION AND RE-PRICING STRUCTURE OF LOANS (INCL. INTEREST RATE DERIVATIVES)
31 DEC 2017 31 DEC 2016
Loanamount
(mill. EUR)Duration(months)
Averageinterest rate
(%)
Interest ratesensitivity1) (mill. EUR)
Re-pricing structure of interest rates of loans Loanamount
(mill. EUR)Duration(months)
Averageinterest rate
(%)
Interest ratesensitivity1)
(mill. EUR)1–4/2018 5–8/2018 9–12/2018 2019 2020 2021 –>2021
577 67.9 3.3 -1.5 -86 175 18 -6 25 1 450 688 14.9 3.3 0.3
1) Interest rate sensitivity is an estimate of the effect of an interest rate change of one percentage point in one direction on net interest cost based on year end exposure.
HEDGING OF ELECTRICITY PRICE RISK EXPOSURE
GWh 31 DEC 2017 31 DEC 2016
Electricity exposure, net 2018 759 1,011
Electricity hedging 2018 598 751
Hedging at the end of the year 2017 (%) 79 74
Electricity price risk is hedged based on defined risk management policy on a time horizon of five years either by physical contracts or by financial contracts. The table applies only to the hedging of electricity price risk of the following year. The net electricity exposure has been calculated by taking into account the own and associated companies’ electricity production.
CURRENCY BREAKDOWN OF CURRENCY EXPOSURE%
CURRENCY BREAKDOWN OF LOANS%
USD ...............................57 SEK ...............................36 GBP .................................6 Others ............................. 1
EUR .............................. 99 SEK ................................. 1
YEAR 2017
REPORT OF THE BOARD OF DIRECTORS
GROUP ACCOUNTS
SHARES AND SHAREHOLDERS
PARENT COMPANY ACCOUNTS
AUDITOR’S REPORT
GOVERNANCE KEY FIGURES
INVESTOR INFORMATION
CONSOLIDATED STATEMENT OF COMPREHENSIVE INCOME | BALANCE SHEET | STATEMENT OF CHANGES IN SHAREHOLDERS’ EQUITY | CASH FLOW STATEMENT | NOTES

68 FINANCIAL STATEMENTS 2017 – NOTE TO THE ACCOUNTS 25
MARKET RISK SENSITIVITY 31 DEC 2017 31 DEC 2017 IMPACT ON EQUITY EXPOSURE AND ANNUAL TRANSACTION EXPOSURE 31 DEC 2017
EUR million
Impact on financial assets
and liabilities
Impact onnet equity of
foreign entities
Impact onnet equity of
foreign entitiesincl. hedging
Impact on annualtransaction expo-
sure (cash flow)
Impact on annualtransaction expo-
sure (cash flow)incl. hedging
INTEREST RATE RISK (100 BP RISE IN INTEREST RATES)
Effect on profit 2.4 1.5 13.1
Effect on other change in equity 9.3
COMMODITY RISK (ELECTRICITY PRICE +20%)
Effect on profit -4.6 2.7
Effect on other change in equity 7.3
FX RISK (USD -10%)
Effect on profit 1.1 -65.1 -28.0
Effect on other change in equity 31.2 -0.1 -0.1
FX RISK (GBP -10%)
Effect on profit 0.1 -7.0 -2.6
Effect on other change in equity 3.5 -1.0 -1.0
FX RISK (SEK -10%)
Effect on profit -1.4 39.3 6.8
Effect on other change in equity -27.2 -34.6 -34.6
MARKET RISK SENSITIVITY 31 DEC 2016 31 DEC 2016 IMPACT ON EQUITY EXPOSURE AND ANNUAL TRANSACTION EXPOSURE 31 DEC 2016
EUR million
Impact on financial assets
and liabilities
Impact onnet equity of
foreign entities
Impact onnet equity of
foreign entitiesincl. hedging
Impact on annualtransaction expo-
sure (cash flow)
Impact on annualtransaction expo-
sure (cash flow)incl. hedging
INTEREST RATE RISK (100 BP RISE IN INTEREST RATES)
Effect on profit -0.3 0.8
Effect on other change in equity 1.0
COMMODITY RISK (ELECTRICITY PRICE +20%)
Effect on profit -6.9 4.1
Effect on other change in equity 11.0
FX RISK (USD -10%)
Effect on profit 7.7 -69.6 -32.1
Effect on other change in equity 21.7 -0.1 -0.1
FX RISK (GBP -10%)
Effect on profit 0.1 -7.5 -4.2
Effect on other change in equity 2.3 -1.4 -1.4
FX RISK (SEK -10%)
Effect on profit -5.2 41.4 18.9
Effect on other change in equity -12.1 -28.3 -28.3
Items with + sign = positive effect = increase of assets / decrease of liabilities / increase of cash flow.Items with - sign = negative effect = decrease of assets / increase of liabilities / decrease of cash flow.
IFRS 7 requires an entity to disclose a sensitivity analysis for each type of market risk to which the entity is exposed at the reporting date, show-ing how profit or loss and equity would have been affected by changes in the relevant risk variable that were reasonably possible at that date. The Group has recognised interest rates, electricity prices and foreign exchange rates as its key market risks and has set 1 per cent interest rate rise, 20 per cent rise in electricity price and 10 per cent weakening of the US dollar, the British pound and the Swedish krona as reasonably possi-ble risk variables. These currencies represent over 90 per cent of Group’s annual transaction exposure. The nature of the market price risk is rela-tively linear so that the size of effects of opposite market price changes do not essentially differ from the presented figures. The scenarios have been calculated by using regular principles of calculating market values of financial instruments described in the Group Accounting policies. Figures at the reporting date reflect quite well the average market risk conditions throughout the reporting period.
Additionally, the Group is presenting figures describing the effects of the risk variables to its equity exposure and annual transaction exposure (cash flow) to present a broader picture about market risks of interest rates, electricity prices and foreign exchange rates. Annual cash flows are based on estimates, but not existing commercial contracts. The weakening of the US dollar and the British pound has a negative impact on annual cash flow and the weakening of the Swedish krona has a positive impact. Hedges reduce this impact depending on hedging strategy. The impact on net equity of foreign entities is arising from the consolidation of subsidiaries to the Group consolidated accounts. The rise of electricity price has a negative impact on cash flow. As according to hedging policy the electricity price risk of the nearest year has mostly been hedged, the impct including hedges remains minor. When the cash flow of the nearest year and all electricity hedges have been taken into account, the calculatory impact is slightly positive.
YEAR 2017
REPORT OF THE BOARD OF DIRECTORS
GROUP ACCOUNTS
SHARES AND SHAREHOLDERS
PARENT COMPANY ACCOUNTS
AUDITOR’S REPORT
GOVERNANCE KEY FIGURES
INVESTOR INFORMATION
CONSOLIDATED STATEMENT OF COMPREHENSIVE INCOME | BALANCE SHEET | STATEMENT OF CHANGES IN SHAREHOLDERS’ EQUITY | CASH FLOW STATEMENT | NOTES

NOTE TO THE ACCOUNTS 25 – FINANCIAL STATEMENTS 2017 69
CASH FLOWS OF INSTALLMENTS AND INTEREST PAYMENT OF FINANCIAL LIABILITIES 31 DEC 2017
EUR millionCarrying amount 2018 2019 2020 2021 2022 2023–
Bonds 308.0
Installments -59.9 -248.1
Interest payment -9.3 -9.3 -6.9 -6.9 -6.9 -34.4
Loans from financial institutions 163.4
Installments -0.2 -0.2 -149.1 -13.8
Interest payment -2.8 -2.8 -0.9 -0.1 -0.1
Pension loans 95.1
Installments -38.5 -32.5 -24.1
Interest payment -3.8 -2.1 -0.6
Finance lease liabilities 7.9
Installments -2.4 -1.7 -1.5 -0.9 -0.7 -0.7
Interest payment -0.2 -0.1 -0.1 -0.0 -0.0 -0.1
Interest-bearing liabilities 1.1
Installments -1.1
Interest payment
NON-CURRENT INTEREST-BEARING LIABILITIES, TOTAL 575.6
REPAYMENTS IN 2018 -41.1
NON-CURRENT INTEREST-BEARING LIABILITIES IN BALANCE SHEET 534.5
Total
Installments -41.1 -94.4 -174.8 -0.9 -14.5 -249.9
Interest payment -16.0 -14.3 -8.5 -7.0 -7.0 -34.4
Current interest-bearing liabilities 1.4
Installments -1.4
Interest payment 0.0
Accounts payables and other liabilities 372.9
Repayment -372.8 -0.2
TOTAL LIABILITIES 950.0
Installments -415.3 -94.6 -174.8 -0.9 -14.5 -249.9
Interest payment -16.0 -14.3 -8.5 -7.0 -7.0 -34.4
Carrying amount
Guarantees agreement 3.0 -0.2 -0.2 0.0 - -0.2 -2.4
Derivative financial instrument liabilities 0.9
Interest rate swaps -0.9 -0.8 -0.6 -0.2 0.3 1.3
Currency derivatives -1,097.8
Commodity derivatives
DERIVATIVE FINANCIAL INSTRUMENT LIABILITIES TOTAL -1,098.7 -0.8 -0.6 -0.2 0.3 1.3
Derivative financial instrument assets 12.3
Interest rate swaps
Currency derivatives 1,102.8
Commodity derivatives 2.4 1.6 3.0 0.3
DERIVATIVE FINANCIAL INSTRUMENT ASSETS TOTAL 1,105.1 1.6 3.0 0.3
Derivative financial instruments cash flow 6.4 0.8 2.4 0.2 0.3 1.3
YEAR 2017
REPORT OF THE BOARD OF DIRECTORS
GROUP ACCOUNTS
SHARES AND SHAREHOLDERS
PARENT COMPANY ACCOUNTS
AUDITOR’S REPORT
GOVERNANCE KEY FIGURES
INVESTOR INFORMATION
CONSOLIDATED STATEMENT OF COMPREHENSIVE INCOME | BALANCE SHEET | STATEMENT OF CHANGES IN SHAREHOLDERS’ EQUITY | CASH FLOW STATEMENT | NOTES

70 FINANCIAL STATEMENTS 2017 – NOTE TO THE ACCOUNTS 25
CASH FLOWS OF INSTALLMENTS AND INTEREST PAYMENT OF FINANCIAL LIABILITIES 31 DEC 2016
EUR millionCarrying amount 2017 2018 2019 2020 2021 2022–
Bonds 222.7
Installments -222.7
Interest payment -9.0 -9.0 -9.0
Loans from financial institutions 199.0
Installments -50.0 -0.2 -0.2 -148.6
Interest payment -3.3 -3.0 -3.1 -0.9
Pension loans 127.6
Installments -38.5 -32.5 -32.5 -24.1
Interest payment -5.2 -3.6 -2.1 -0.6
Finance lease liabilities 23.4
Installments -16.4 -2.2 -1.7 -1.3 -0.8 -1.0
Interest payment -0.3 -0.1 -0.1 0.0 0.0 -0.1
Interest-bearing liabilities 51.0
Installments -49.9 -1.1
Interest payment -0.7
NON-CURRENT INTEREST-BEARING LIABILITIES, TOTAL 623.7
REPAYMENTS IN 2017 -154.7
NON-CURRENT INTEREST-BEARING LIABILITIES IN BALANCE SHEET 469.0
Total
Installments -154.7 -35.0 -257.1 -174.0 -0.8 -2.1
Interest payment -18.5 -15.7 -14.3 -1.5 0.0 -0.1
Current interest-bearing liabilities 64.3
Installments -64.3
Interest payment 0.0
Accounts payables and other liabilities 339.2
Repayment -339.1 -0.1
TOTAL LIABILITIES 1,027.2
Installments -558.1 -35.1 -257.1 -174.0 -0.8 -2.1
Interest payment -18.5 -15.7 -14.3 -1.5 0.0 -0.1
Carrying amount
Guarantees agreement 4.1 -0.3 -0.3 0.0 -0.2 -3.2
Derivative financial instrument liabilities 14.6
Interest rate swaps -1.2 -0.5
Currency derivatives -710.7
Commodity derivatives
DERIVATIVE FINANCIAL INSTRUMENT LIABILITIES TOTAL -711.9 -0.5
Derivative financial instrument assets 5.6
Interest rate swaps
Currency derivatives 697.7
Commodity derivatives 2.9 1.6 -0.2 1.3
DERIVATIVE FINANCIAL INSTRUMENT ASSETS TOTAL 700.6 1.6 -0.2 1.3
Derivative financial instruments cash flow -11.3 1.1 -0.2 1.3
YEAR 2017
REPORT OF THE BOARD OF DIRECTORS
GROUP ACCOUNTS
SHARES AND SHAREHOLDERS
PARENT COMPANY ACCOUNTS
AUDITOR’S REPORT
GOVERNANCE KEY FIGURES
INVESTOR INFORMATION
CONSOLIDATED STATEMENT OF COMPREHENSIVE INCOME | BALANCE SHEET | STATEMENT OF CHANGES IN SHAREHOLDERS’ EQUITY | CASH FLOW STATEMENT | NOTES

NOTE TO THE ACCOUNTS 25 – FINANCIAL STATEMENTS 2017 71
MATURITY ANALYSIS OF CASH FLOW HEDGE ACCOUNTING
Result of the hedging instrument is recognised to the income statement at the realisation of the hedged cash flow. Contractual maturities of hedging instruments match those of the hedged cash flows.
EUR million 31 DEC 2017
Periods when the forecasted cash flow are expected to occur, EUR million
Highly probable
foreign currency
cash flows
Contractualinterest
cash flows
Highly probable commodity cash
flows
Q1 222.1 - -5.6
Q2 268.5 -0.9 -6.0
Q3 141.4 - -5.1
Q4 - -0.9 -4.9
Total 2018 632.1 -1.8 -21.6
2019 -2.5 -11.8
2020 -2.7 -6.4
2021 -2.7 -2.5
2022 -2.7
2023– -5.1
Cash flows total 632.1 -17.4 -42.3
Total nominal values of derivatives designated to hedge accounting 632.1 250.0 42.3
EUR million 31 DEC 2016
Periods when the forecasted cash flow are expected to occur, EUR million
Highly probable
foreign currency
cash flows
Contractualinterest
cash flows
Highly probable commodity cash
flows
Q1 154,8 - -7,7
Q2 115,9 -1,0 -7,7
Q3 82,0 - -7,1
Q4 10,4 -1,0 -7,1
Total 2017 363,2 -2,0 -29,5
2018 -1,0 -16,9
2019 -10,9
2020 -8,7
2021
2022–
Cash flows total 363,2 -3,0 -66,1
Total nominal values of derivatives designated to hedge accounting 363,2 100,0 66,1
YEAR 2017
REPORT OF THE BOARD OF DIRECTORS
GROUP ACCOUNTS
SHARES AND SHAREHOLDERS
PARENT COMPANY ACCOUNTS
AUDITOR’S REPORT
GOVERNANCE KEY FIGURES
INVESTOR INFORMATION
CONSOLIDATED STATEMENT OF COMPREHENSIVE INCOME | BALANCE SHEET | STATEMENT OF CHANGES IN SHAREHOLDERS’ EQUITY | CASH FLOW STATEMENT | NOTES

72 FINANCIAL STATEMENTS 2017 – NOTE TO THE ACCOUNTS 26
26. FAIR VALUE OF FINANCIAL ASSETS AND LIABILITIES
FINANCIAL ASSETS 31 DEC 2017
EUR million Note
Fair value through
profit & loss
Availablefor sale
fin. assetsLoans and
receivables
Derivativesat hedge
accountingAmortised
cost
Totalcarrying amount
Fairvalue
Available for sale investments 14 240.3 240.3 240.3
Other non-current financial assets 15 18.4 18.4 18.4
Accounts receivables and other receivables 18 271.7 271.7 271.7
Cash and cash equivalents 19 215.1 215.1 215.1
Derivative financial instruments 27 3.3 8.9 12.3 12.3
Total 3.3 240.3 505.2 8.9 - 757.7 757.7
FINANCIAL LIABILITIES
Non-current interest-bearing financial liabilities 23 534.5 534.5 545.7
Other non-current financial liabilities 24 0.2 0.2 0.2
Current interest-bearing financial liabilities 23 42.5 42.5 43.9
Accounts payable and other financial liabilities 25 330.3 330.3 330.3
Derivative financial instruments 27 0.0 0.8 0.9 0.9
Total 0.0 - - 0.8 907.5 908.4 921.0
FINANCIAL ASSETS 31 DEC 2016
EUR million Note
Fair value through
profit & loss
Availablefor sale
fin. assetsLoans and
receivables
Derivativesat hedge
accountingAmortised
cost
Totalcarrying amount
Fairvalue
Available for sale investments 14 195.9 195.9 195.9
Other non-current financial assets 15 16.3 16.3 16.3
Accounts receivables and other receivables 18 264.8 264.8 264.8
Cash and cash equivalents 19 220.6 220.6 220.6
Derivative financial instruments 27 5.6 5.6 5.6
Total - 195.9 501.8 5.6 - 703.3 703.3
FINANCIAL LIABILITIES
Non-current interest-bearing financial liabilities 23 469.0 469.0 489.1
Other non-current financial liabilities 24 0.1 0.1 0.1
Current interest-bearing financial liabilities 23 219.1 219.1 220.8
Accounts payable and other financial liabilities 25 303.2 303.2 303.2
Derivative financial instruments 27 6.6 8.0 14.6 14.6
Total 6.6 8.0 991.4 1,006.0 1,027.8
Accounts receivables and other receivables do not include advance payments, accrued tax refunds and employee cost accruals (note 17). Accounts payable and other financial liabilities do not include advance payments, accrued tax expenses and employee cost accruals (note 24).
In Metsä Board Group all interest-bearing liabilities are valued in the balance sheet at amortised cost based on effective interest method. Interest-bearing financial assets have been classified by applying IAS 39
standard. Fair values in the table are based on the present value of cash flow of each liability or assets calculated by market rate. The discount rates applied are between 0.3–2.4 per cent (2016: 0.3–2.3). The fair values of accounts and other receivables and accounts payable and other liabilities do not materially deviate from their carrying amounts in the balance sheet.
NOTE TO THE ACCOUNTS 26YEAR 2017
REPORT OF THE BOARD OF DIRECTORS
GROUP ACCOUNTS
SHARES AND SHAREHOLDERS
PARENT COMPANY ACCOUNTS
AUDITOR’S REPORT
GOVERNANCE KEY FIGURES
INVESTOR INFORMATION
CONSOLIDATED STATEMENT OF COMPREHENSIVE INCOME | BALANCE SHEET | STATEMENT OF CHANGES IN SHAREHOLDERS’ EQUITY | CASH FLOW STATEMENT | NOTES

NOTE TO THE ACCOUNTS 26 – FINANCIAL STATEMENTS 2017 73
FAIR VALUE HIERARCHY OF FINANCIAL ASSETS AND LIABILITIES
ACCOUNTING PRINCIPLES
Financial assets and liabilities are categorised in accordance with IFRS 7 Financial Instruments.
Level 1 Fair value is based on quoted prices in active markets.Level 2 Fair value is determined by using valuation techniques that
use observable price information from market.Level 3 Fair value is based on company estimates and not on mar-
ket data.
The fair values of electricity, natural gas, propane and gas oil derivatives are measured based on publicly quoted market prices (Level 1).
The fair values of currency forwards, currency options and pulp contracts are determined based on market prices on the closing date of the reporting period. The fair values of interest rate swaps are measured applying a method based on the current value of future cash flows, supported by market interest rates on the closing date of the reporting period and other market inputs (Level 2).
The fair value of financial instruments not traded in an active market is determined using various valuation methods. Discretion is used in choosing the methods and making assumptions based primarily on the market conditions prevailing on the closing date of the reporting period (Level 3).
FAIR VALUE HIERARCHY OF FINANCIAL ASSETS AND LIABILITIES 31 DEC 2017
EUR million Note Level 1 Level 2 Level 3 Total
Financial assets at fair value through profit or loss, non-current 14 -
Available for sale financial assets 14 0.0 240.3 240.3
Financial assets at fair value through profit or loss, current 18 -
Derivative financial assets 27 7.3 4.9 12.3
Derivative financial liabilities 27 0.9 0.9
Financial assets not measured at fair value
Cash and cash equivalent 19 215.1 215.1
Financial liabilities not measured at fair value
Non-current interest-bearing financial liabilities 23 545.7 545.7
Current interest-bearing financial liabilities 23 43.9 43.9
FAIR VALUE HIERARCHY OF FINANCIAL ASSETS AND LIABILITIES 31 DEC 2016
EUR million Note Level 1 Level 2 Level 3 Total
Financial assets at fair value through profit or loss, non-current 14
Available for sale financial assets 14 0.0 195.9 195.9
Financial assets at fair value through profit or loss, current 18
Derivative financial assets 27 5.6 5.6
Derivative financial liabilities 27 14.6 14.6
Financial assets not measured at fair value
Cash and cash equivalent 19 220.6 220.6
Financial liabilities not measured at fair value
Non-current interest-bearing financial liabilities 23 489.1 489.1
Current interest-bearing financial liabilities 23 220.8 220.8
FINANCIAL ASSETS AND LIABILITIES MEASURED AT FAIR VALUE BASED ON LEVEL 3
EUR million 2017 2016
Opening balance 195.9 210.1
Total gains and losses in profit or loss -0.0 -0.0
Total gains and losses in other comprehensive income 44.4 -14.2
Purchases - -
Disposals -0.0 -0.0
Closing balance 240.3 195.9
YEAR 2017
REPORT OF THE BOARD OF DIRECTORS
GROUP ACCOUNTS
SHARES AND SHAREHOLDERS
PARENT COMPANY ACCOUNTS
AUDITOR’S REPORT
GOVERNANCE KEY FIGURES
INVESTOR INFORMATION
CONSOLIDATED STATEMENT OF COMPREHENSIVE INCOME | BALANCE SHEET | STATEMENT OF CHANGES IN SHAREHOLDERS’ EQUITY | CASH FLOW STATEMENT | NOTES

74 FINANCIAL STATEMENTS 2017 – NOTE TO THE ACCOUNTS 26
DERIVATIVES
ACCOUNTING PRINCIPLES
Derivative contracts are initially recognised on the balance sheet at fair value at cost, and thereafter during their term-to-maturity revalued at their fair value at each reporting date. The fair value of derivatives is presented in non-interest-bearing receivables or liabilities. Gains and losses resulting from recognition at fair value are treated in accounting as required with regard to the intended use of the derivative contract in question. Derivatives are initially classified as either
1) Hedges of the exposure to changes in the fair value of receiva-bles, liabilities or firm commitments;
2) Hedges of the cash flow from a highly probable forecast transaction;
3) Hedges of a net investment in a foreign entity, or4) Derivatives to which it has been decided not to apply hedge
accounting.
Metsä Board currently applies hedge accounting only to cash flow hedges. When applying hedge accounting at the inception of a hedging relationship, the Group has documented the relationship between the hedged item and the hedging instruments, as well as the hedging strategy observed.
To meet the requirements of hedge accounting, the Group has also continuously carried out effectiveness testing to verify that changes in the fair value of the hedging instrument for each hedg-ing relationship cover any changes in the fair value of the hedged item effectively enough, with respect to the hedged risk.
Changes in the fair value of the effective portion of derivative instruments that meet the criteria for cash flow hedging are recog-
nised in other items of comprehensive income. The gains and losses recognised in equity are not transferred to the income statement until the forecast sale or purchase is realised, and are recognised as an adjustment to the hedged item. If the forecast transaction is no longer expected to occur, the gain or loss accrued in equity is recognised immediately in the income statement.
Derivatives not subject to hedge accounting, as well as the ineffective portion of derivatives subject to hedge accounting, are measured at fair value, and changes in the value of interest rate and currency derivatives are recognised in financial items and changes in the value of commodity derivatives are recognised in other income and expenses.
Hedge accounting in accordance with IAS 39 is applied as cash flow hedging to highly probable cash flows from sales denominated in foreign currencies and contractualcash flows from floating interest rates of loans. In the management of price risks related to commodities, hedge accounting is applied to cash flows from highly probable purchases of electricity, natural gas, propane, gas oil and pulp. The fair values of forward foreign exchange contracts are based on the forward prices prevailing on the balance sheet date, and currency options are measured at fair value in accordance with the Black–Scholes model. Interest rate swaps are measured at the current value of cash flows, with the calculation being based on the market interest rate yield curve. The fair values of electricity, natural gas, propane and gas oil derivatives are measured based on publicly quoted market prices, and the fair values of pulp deriva-tives are measured based on market prices on the balance sheet date.
DERIVATIVES
NOMINAL VALUE FAIR VALUE
EUR million Derivative assets Derivative liabilities Total Cash flow hedgesDerivatives/hedge
accounting not applied
2017
Interest rate swaps 300.0 0.9 -0.9 -0.8 0.0
INTEREST RATE DERIVATIVES 300.0 0.9 -0.9 -0.8 0.0
Currency forward agreements 1,097.8 4.9 4.9 1.6 3.3
Currency option agreements -
Currency swap agreements -
CURRENCY DERIVATIVES 1,097.8 4.9 4.9 1.6 3.3
Electricity derivatives 56.6 5.8 5.8 5.8
Pulp derivatives -
Oil derivatives 7.5 0.8 0.8 0.8
Other commodity derivatives 3.1 0.8 0.8 0.8
COMMODITY DERIVATIVES 67.1 7.3 7.3 7.3
DERIVATIVES TOTAL 1,465.0 12.3 0.9 11.4 8.1 3.3
YEAR 2017
REPORT OF THE BOARD OF DIRECTORS
GROUP ACCOUNTS
SHARES AND SHAREHOLDERS
PARENT COMPANY ACCOUNTS
AUDITOR’S REPORT
GOVERNANCE KEY FIGURES
INVESTOR INFORMATION
CONSOLIDATED STATEMENT OF COMPREHENSIVE INCOME | BALANCE SHEET | STATEMENT OF CHANGES IN SHAREHOLDERS’ EQUITY | CASH FLOW STATEMENT | NOTES
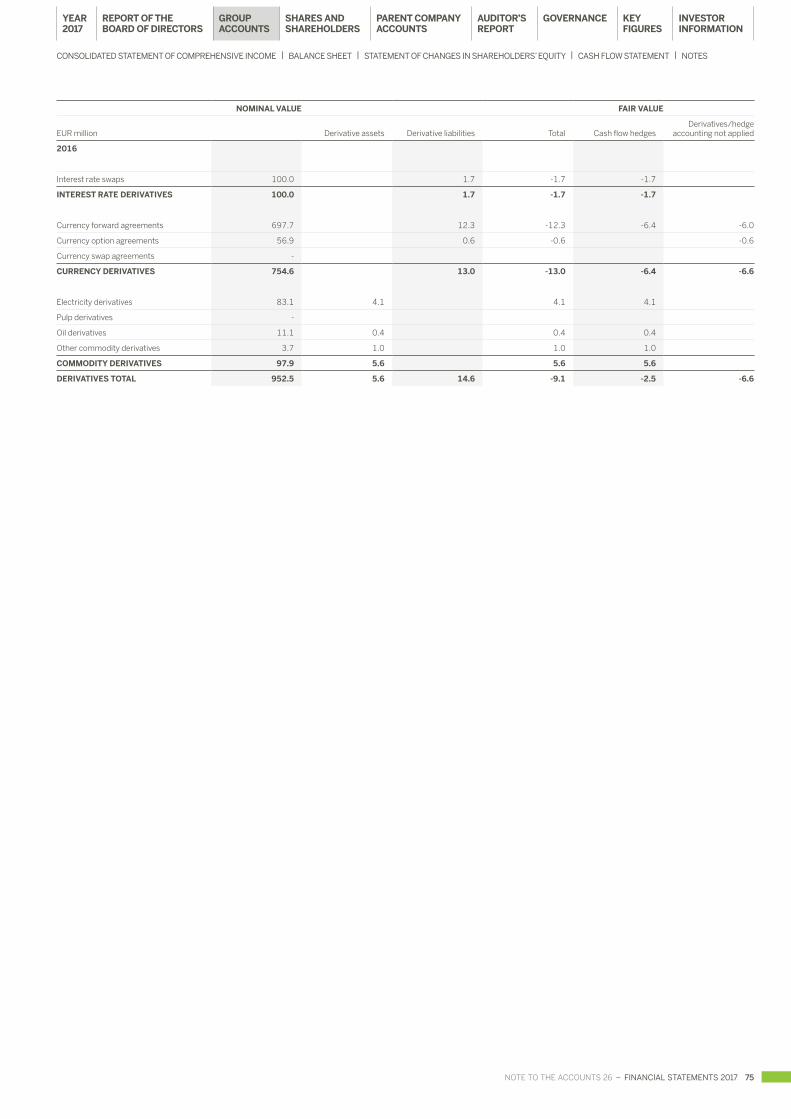
NOTE TO THE ACCOUNTS 26 – FINANCIAL STATEMENTS 2017 75
NOMINAL VALUE FAIR VALUE
EUR million Derivative assets Derivative liabilities Total Cash flow hedgesDerivatives/hedge
accounting not applied
2016
Interest rate swaps 100.0 1.7 -1.7 -1.7
INTEREST RATE DERIVATIVES 100.0 1.7 -1.7 -1.7
Currency forward agreements 697.7 12.3 -12.3 -6.4 -6.0
Currency option agreements 56.9 0.6 -0.6 -0.6
Currency swap agreements -
CURRENCY DERIVATIVES 754.6 13.0 -13.0 -6.4 -6.6
Electricity derivatives 83.1 4.1 4.1 4.1
Pulp derivatives -
Oil derivatives 11.1 0.4 0.4 0.4
Other commodity derivatives 3.7 1.0 1.0 1.0
COMMODITY DERIVATIVES 97.9 5.6 5.6 5.6
DERIVATIVES TOTAL 952.5 5.6 14.6 -9.1 -2.5 -6.6
YEAR 2017
REPORT OF THE BOARD OF DIRECTORS
GROUP ACCOUNTS
SHARES AND SHAREHOLDERS
PARENT COMPANY ACCOUNTS
AUDITOR’S REPORT
GOVERNANCE KEY FIGURES
INVESTOR INFORMATION
CONSOLIDATED STATEMENT OF COMPREHENSIVE INCOME | BALANCE SHEET | STATEMENT OF CHANGES IN SHAREHOLDERS’ EQUITY | CASH FLOW STATEMENT | NOTES

76 FINANCIAL STATEMENTS 2017 – NOTES TO THE ACCOUNTS 27–28
28. CONTINGENT LIABILITIES
DISPUTES AND CLAIMS
In May 2014, Metsä Board petitioned the District Court of Helsinki to revoke the judgment issued by the Arbitral Tribunal on 11 February 2014 that orders Metsä Board to pay EUR 19.7 million in damages to UPM Kymmene Corporation. In a judgment issued in June 2015, the District Court rejected Metsä Board’s petition. Metsä Board appealed the decision of the District Court to the Court of Appeal. The Court of Appeal dismissed Metsä Board’s appeal on 21 October 2016. Metsä Board has applied for leave to appeal the matter to the Supreme Court.
Metsä Board companies have been sellers in several share transac-tions in recent years. In these divestments, the companies have issued regular seller’s assurances. Claims presented against Metsä Board companies and costs incurred by the companies due to these assurances cannot be ruled out.
EUR million 2017 2016
FOR OWN LIABILITIES
Liabilities secured by pledges
Pension loans 25.4 34.6
Pledges granted 114.6 103.0
Liabilities secured by floating charges
Other liabilities - -
Floating charges - -
Liabilities secured by mortgages
Pension loans 63.8 87.1
Real estate mortages 232.8 232.8
As security of own commitments
Pledged assets -
Guarantees and counter-indemnities 2.8 3.9
Other rent and leasing commitments 11.6 12.2
On behalf of associated companies
Guarantee liabilities 0.1 0.1
On behalf of others
Guarantee liabilities - 0.1
TOTAL
Pledges 114.6 103.0
Floating charges - -
Real estate mortages 232.8 232.8
Guarantees and counter-indemnities 3.0 4.1
Other rent and leasing commitments 11.6 12.2
Total 361.9 352.1
Commitments include granted pledges, mortgages and floating charges as well as guarantees. Pledges granted are shares in associate company (Metsä Fibre).
27. NOTES TO THE CONSOLIDATED CASH FLOW STATEMENT
EUR million 2017 2016
ADJUSTMENTS TO THE RESULT FOR THE PERIOD
Taxes 20.3 11.3
Depreciation, amortisation and impairment charges 91.6 102.3
Share of results from associated companies -58.9 -45.1
Gains and losses on sale of non-current assets -11.5 -14.4
Finance costs, net 36.3 30.7
Post employment benefit obligations and provisions -3.3 -11.5
74.6 73.4
CHANGE IN WORKING CAPITAL
Inventories 5.8 -36.3
Accounts receivables and other receivables -8.6 -11.0
Accounts payable and other liabilities 37.0 -27.2
Total 34.1 -74.5
DISPOSALS OF SUBSIDIARIES
No subsidiaries were disposed in 2017.Metsä Board sold its share (25.0 per cent) in a structured entity
Alrec Boiler Oy consolidated as a subsidiary to group accounts in June 2016 to its partner company Rinheat Oy at a price determined in accordance with the shareholder and option agreements in force between the parties. Cash balance of the sold company at the time of the sale was EUR 7.6 million. The disposal had a total cash flow effect of EUR -5.5 million, of which EUR -2.7 million was presented in net cash flow from financing activities. A disposal loss affecting comparabil-ity of EUR -1.1 million was recognized for the divestment.
In September 2011, Metsä Board divested the 100.0 per cent hold-ing in its Austrian subsidiary M-real Hallein GmbH. The company was paid a EUR 4.4 million earn-out for the sale of subsidiary receivables in connection with the divestment in November 2016. The received earn-out was presented as proceeds from sale of subsidiaries in the consoli-dated statement of cash flows. The earn-out resulted in the reporting of a EUR 4.4 million partial reversal of previously recognised divestment loss as an item affecting comparability.
NOTES TO THE ACCOUNTS 27–28YEAR 2017
REPORT OF THE BOARD OF DIRECTORS
GROUP ACCOUNTS
SHARES AND SHAREHOLDERS
PARENT COMPANY ACCOUNTS
AUDITOR’S REPORT
GOVERNANCE KEY FIGURES
INVESTOR INFORMATION
CONSOLIDATED STATEMENT OF COMPREHENSIVE INCOME | BALANCE SHEET | STATEMENT OF CHANGES IN SHAREHOLDERS’ EQUITY | CASH FLOW STATEMENT | NOTES

NOTE TO THE ACCOUNTS 29 – FINANCIAL STATEMENTS 2017 77
OTHER RENT AND LEASE COMMITMENTS
Metsä Board rents various offices and warehouses under non-cancella-ble operating lease agreements as defined in IAS 17. Additionally, some lease contracts entered into by the Group are not finance lease contracts by nature. Some contracts are renewable at the end of the lease period.
EUR million 2017 2016
Operating leases
Not later than one year 3.7 4.0
Later than one year and not later than five years 6.8 7.4
Later than five years 1.1 0.7
Total 11.6 12.2
COMMITMENTS RELATED TO PROPERTY, PLANT AND EQUIPMENT
EUR million 2017 2016
Payments due in following 12 months 0.3 11.2
Payments due later - -
Total 0.3 11.2
29. SHARE BASED PAYMENT
ACCOUNTING PRINCIPLES
Share-based incentive programmes in which the payments are made with equity instruments and cash have been established for the company’s top executives. The equity instruments are measured at fair value on the grant date, and recognised as expenses in the income statement and equity evenly over the vesting period. Incentives granted in cash are measured at fair value on the balance sheet date, and recognised as expenses in the income statement and as liabilities on the balance sheet over the vesting period. The effect on profit of the incentive programmes is presented under personnel expenses.
SHARE INCENTIVE SCHEMES
During the review period, Metsä Board had three active share-based incentive schemes: Share incentive scheme 2011, which company Board of Directors decided to adopt on 15 December 2010, Share incentive scheme 2014, which company Board of Directors decided to adopt on 6 February 2014, and Performance based share incentive scheme 2017–2021, which the company Board of Directors decided to adopt on 10 January 2017, as part of company’s incentive and key personnel retainment programme.
The effect on consolidated income statement of share-based incen-tive schemes amounted to EUR 1,824,329 in 2017.
SHARE INCENTIVE SCHEME 2011
The scheme offers the participants the possibility to be awarded Metsä Board Corporation’s B shares for achieving set goals for three incentive periods. Incentive periods are the calendar years 2011–2013, 2012–2014 and 2013–2015. The bonus awarded under the share incentive scheme is determined by achievement of the set goals and paid by the end of April following the incentive period. In addition to shares, the bonus includes a cash component, which is used to cover taxes and tax-like charges incurred by plan participants due to the bonus. The bonus is not paid, if the employee’s contract with the company ends before the end of the vesting period. In addition, the awarded person must continue to own the shares for at least two years following the end of the vesting period.
The shares paid in the scheme have been released, and the related retainment effect on plan participants has ceased.
SHARE INCENTIVE SCHEME 2014 AND PERFORMANCE BASED SHARE
INCENTIVE SCHEME 2017–2021
The schemes offer the participants the possibility to be awarded Metsä Board Corporation’s B shares for achieving set goals for three-year peri-ods. Incentive periods are the calendar years 2014–2016, 2015–2017, 2016–2018, 2017–2019, 2018–2020, and 2019–2021. The bonus awarded under the share incentive scheme is determined by achieve-ment of the set goals and paid in March following the incentive period. In addition to shares, the bonus includes a cash component, which is used to cover taxes and tax-like charges incurred by plan participants due to the bonus. The bonus is not paid, if the employee’s contract with the company ends before the end of the vesting period. In addition, the scheme includes a two-year lock-in period. If the employment of a plan participant ends during the lock-in period, the participant should, as a rule, return the transferred shares to the company without consideration.
Based on attainment of criteria set for incentive period 2014–2016, 141,411 Metsä Board Corporation’s B shares were paid to plan par-ticipants together with the cash component to cover taxes and tax-like charges incurred at the point of share transfer.
The company changed the terms of the scheme during 2016 so that for incentive periods 2014–2016 and 2015–2017 a cap was set for total employee compensation, including the share incentive paid, based on each plan participant’s salary. The part of earned incentive exceed-ing the cap is deferred and paid in full in cash in coming years when allowed by the cap. Starting from vesting period 2016–2018, a salary based cap was set with the effect of cutting the part of share incentive exceeding the cap and resulting in the forfeiture of the excess part of the incentive. On balance sheet date, the deferred compensation for period 2014–2016 equals the value of 94,741 shares and related cash component to cover taxes and tax-like charges.
NOTE TO THE ACCOUNTS 29YEAR 2017
REPORT OF THE BOARD OF DIRECTORS
GROUP ACCOUNTS
SHARES AND SHAREHOLDERS
PARENT COMPANY ACCOUNTS
AUDITOR’S REPORT
GOVERNANCE KEY FIGURES
INVESTOR INFORMATION
CONSOLIDATED STATEMENT OF COMPREHENSIVE INCOME | BALANCE SHEET | STATEMENT OF CHANGES IN SHAREHOLDERS’ EQUITY | CASH FLOW STATEMENT | NOTES

78 FINANCIAL STATEMENTS 2017 – NOTE TO THE ACCOUNTS 29
Key characteristics and transactions of the share incentive scheme 2014 are summarised in the table below:
31 Dec 2017 2014–2016 2015–2017 2016–2018 Total
Key characteristics
Shares allocated to the scheme, shares 427,500 427,500 266,250 1,121,250
Grant date(s) 17.3.2014, 10.6.2014, 1.11.2016 27.2.2015, 1.11.2016 18.4.2016, 1.11.2016
Criteria Equity ratio, ROCE,EBIT multiplier
Equity ratio, ROCE,EBIT multiplier
Equity ratio, ROCE andEBIT
Personnel (31 December 2017) 18
FACTORS USED TO DETERMINE FAIR VALUE 1)
Share price at grant date, EUR 3.37 5.85 5.60
Fair value of share at grant date, EUR 2.90 5.12 4.94
Annual dividend assumption in fair value measurement, EUR 0.10 0.14 0.22
Share price at payment time / balance sheet date, EUR 6.31 7.15 7.15
Fair value on balance sheet date, EUR 2,602,476 3,364,789 1,039,649 7,006,914
EFFECT ON RESULT AND FINANCIAL POSITION (EURO)
Expense in 2017, share based payments 557,997 720,329 280,673 1,558,999
Expense in 2017, share based payments, settled as equity 199,212 272,091 104,847 576,150
Liability recognised for share based payments, end of 2017 1,257,418 1,171,232 224,846 2,653,496
Number of shares 1 January 2017 2)
Outstanding at the beginning of the period 348,335 383,075 243,750 975,159
Changes during the year
Shares granted 0 2,742 7,917 10,659
Shares forfeited 0 64,917 33,333 98,250
Shares exercised 45,979 0 0 45,979
Shares expired 89,173 0 0 89,173
Number of shares 31 December 2017
Outstanding at the end of the period 213,183 320,900 218,334 752,417
Exercisable at the end of the period 213,183 320,900 218,334 752,417
1) The fair value of the share settled component at the grant date was the share price of Metsä Board Corporation’s B share less any dividends estimated by analyst consensus to be paid before the payment of the incentive. Additionally, any rights issues are taken into account in line with the applicable rights issue factor. The fair value of the cash settled part changes every reporting date following changes in share closing price until the end of the vesting period. The fair value of the share based payment is recognised to the number of shares based on the best available estimate of the total incentive to which the participants are expected to be entitled.2) The amounts in the table represent net amounts, i.e. the number of shares to be given based on the share based payment schemes. In addition, the payment will include a cash settled component used to cover taxes and tax-like charges.
NOTE TO THE ACCOUNTS 29YEAR 2017
REPORT OF THE BOARD OF DIRECTORS
GROUP ACCOUNTS
SHARES AND SHAREHOLDERS
PARENT COMPANY ACCOUNTS
AUDITOR’S REPORT
GOVERNANCE KEY FIGURES
INVESTOR INFORMATION
CONSOLIDATED STATEMENT OF COMPREHENSIVE INCOME | BALANCE SHEET | STATEMENT OF CHANGES IN SHAREHOLDERS’ EQUITY | CASH FLOW STATEMENT | NOTES

NOTE TO THE ACCOUNTS 30 – FINANCIAL STATEMENTS 2017 79
Key characteristics and transactions of the performance based share incentive scheme 2014 are summarised in the table below:
Performance based
31 Dec 2017 2016–2018 Total
Key characteristics
Shares allocated to the scheme, shares 269,167 269,167
Grant date(s) 6.4.2017
Criteria Equity ratio, ROCE andEBIT
Personnel (31 December 2017) 21
FACTORS USED TO DETERMINE FAIR VALUE 1)
Share price at grant date, EUR 6.37
Fair value of share at grant date, EUR 5.92
Annual dividend assumption in fair value measurement, EUR 0.23
Share price at payment time / balance sheet date, EUR 7.15
Fair value on balance sheet date, EUR 1,838,641 1,838,641
EFFECT ON RESULT AND FINANCIAL POSITION (EURO)
Expense in 2017, share based payments 265,330 265,330
Expense in 2017, share based payments, settled as equity 110,814 110,814
Liability recognised for share based payments, end of 2017 154,516 154,516
Number of shares 1 January 2017 2)
Outstanding at the beginning of the period 0 0
Changes during the year
Shares granted 305,000 305,000
Shares forfeited 35,833 35,833
Shares exercised 0 0
Shares expired 0 0
Number of shares 31 December 2017
Outstanding at the end of the period 269,167 269,167
Exercisable at the end of the period 269,167 269,167
1) The fair value of the share settled component at the grant date was the share price of Metsä Board Corporation’s B share less any dividends estimated by analyst consensus to be paid before the payment of the incentive. Additionally, any rights issues are taken into account in line with the applicable rights issue factor. The fair value of the cash settled part changes every reporting date following changes in share closing price until the end of the vesting period. The fair value of the share based payment is recognised to the number of shares based on the best available estimate of the total incentive to which the participants are expected to be entitled.2) The amounts in the table represent net amounts, i.e. the number of shares to be given based on the share based payment schemes. In addition, the payment will include a cash settled component used to cover taxes and tax-like charges.
30. RELATED PARTY TRANSACTIONS
Related parties include Metsä Board’s ultimate parent company Metsäliitto Cooperative, which owns 41.7 per cent of Metsä Board’s shares and 61.5 per cent of the voting rights (including shares owned by Metsäliitto Employees’ Pension Foundation), other subsidiaries of Metsäliitto, associated companies and joint ventures as well as Metsäliitto Employees’ Pension Foundation. The members of the Board of Directors, Metsä Group’s Executive Management Team and Metsä Board’s Corporate Management Team as well as their close fam-ily members are also included in related parties.
The most significant subsidiaries of Metsäliitto, with which Metsä Board has business transactions, are as follows:Metsä Tissue GroupMetsä Fibre GroupMetsä Forest Sverige Ab
Metsä Fibre has been consolidated by using equity method according to Investments in associates standard (IAS 28). Related party transactions with Metsä Fibre are presented as transactions with sister companies.
Financial operations of the Group have been centralised to Metsä Group Treasury Oy, which is a wholly-owned subsidiary of Metsäliitto Cooperative and in charge of managing the Group companies’ financial positions according to the strategy and financial policy defined by the Group, providing necessary financial services and acting as a compe-tence center in financial matters. Financial transactions with Metsä Group Treasury Oy are carried out at market prices.
The value of wood purchases from Metsäliitto Cooperative was EUR 107.9 million (2016: 105.5) and pulp purchases from Metsä Fibre Oy EUR 303.2 million (305.7). The purchases were carried out at market prices.
Metsä Board is participating in the supplementary pension arrange-ment of Metsä Group executives. Payments to the arrangement amounted to EUR 0.4 million in 2017 (2016: 0.3).
NOTE TO THE ACCOUNTS 30YEAR 2017
REPORT OF THE BOARD OF DIRECTORS
GROUP ACCOUNTS
SHARES AND SHAREHOLDERS
PARENT COMPANY ACCOUNTS
AUDITOR’S REPORT
GOVERNANCE KEY FIGURES
INVESTOR INFORMATION
CONSOLIDATED STATEMENT OF COMPREHENSIVE INCOME | BALANCE SHEET | STATEMENT OF CHANGES IN SHAREHOLDERS’ EQUITY | CASH FLOW STATEMENT | NOTES

80 FINANCIAL STATEMENTS 2017 – NOTE TO THE ACCOUNTS 30
Metsäliitto Employees’ Pension Foundation is a separate legal entity granting defined supplementary pension benefits to part of Metsä Board officials and manages foundation’s assets. The foundation owns about 0.1 per cent of Metsä Board Corporation. Furthermore, the foundation has invested EUR 0.2 million in Metsäliitto Cooperative’s participations. Metsä Board did not pay any contributions to the foun-dation in 2017 and 2016. In its 2017 financial statements the Group recognized a EUR 2.5 million receivable from the foundation arising from refund of surplus assets. The employer loans granted by the foun-dation to Metsä Board amounted to EUR 5.9 million (5.9) in 2017.
EUR millionTransactions withparent company
Transactions withsister companies
2017 2016 2017 2016
Sales 9.0 11.2 58.2 57.3
Other operating income 3.1 3.0 1.3 10.6
Purchases 107.9 105.5 501.3 492.4
Share of result from associated companies - - 58.9 45.0
Dividend income 0.0 0.0 31.1 32.9
Interest income - - 0.1 0.1
Interest expenses 0.1 0.1 1.9 2.7
Receivables
Accounts receivables and other receivables 1.8 2.2 28.4 19.3
Cash and cash equivalents - - 207.0 215.5
Liabilities
Accounts payable and other liabilities 14.2 10.7 37.3 120.5
TRANSACTION AND BALANCES WITH ASSOCIATED COMPANIES AND JOINT VENTURES
EUR million 2017 2016
Sales 0.7 0.7
Purchases 5.5 6.1
Interest income 0.0 0.0
Receivables
Other non-current financial assets 0.3 0.3
Accounts receivables and other receivables 0.1 0.3
Liabilities
Accounts payable and other liabilities 1.3 1.2
Metsä Board has classified interest-bearing receivables comparable to cash funds and available immediately from Metsä Group’s internal bank Metsä Group Treasury Oy as Cash and cash equivalents.
The receivables from group companies do not include doubtful receivables, and no bad debt was recognised during the period. No security or collateral has been provided for group liabilities.
Key management includes members of the Board as well as Corporate Management Team.
REMUNERATION PAID TO THE KEY MANAGEMENT
EUR 2017 2016
Salaries and other remuneration 3,229,277.25 4,330,918.51
Pension costs 647,473.55 808,878.85
Total 3,876,750.80 5,139,797.36
THE REMUNERATION PAID TO THE MEMBERS OF THE BOARD OF
DIRECTORS OF THE PARENT COMPANY AND SHAREHOLDING
Shareholding2017EUR
2016EUR
Kari Jordan Chairman 1,033,147 109,759.95 101,903.99
Martti Asunta Vice chairman 60,450 94,639.91 87,993.58
Mikael Aminoff (until 23 March 2017) - 4,200.00 69,863.92
Kirsi Komi 64,064 75,799.92 71,063.92
Kai Korhonen 200,834 85,399.92 80,663.92
Liisa Leino 168,709 76,999.92 71,063.92
Jussi Linnaranta (from 23 March 2017) 5,239 72,799.92 -
Juha Niemelä 162,709 76,999.92 71,663.92
Veli Sundbäck 53,729 75,799.92 71,063.92
Erkki Varis 117,301 75,799.92 71,063.92
Total 1,866,182 748,199.30 696,345.01
Pension payments of the members of the Board were EUR 92,497.90 in 2017 (98,864.60). Metsä Board’s Annual General Meeting 2017 decided, that about one half of the remuneration will be paid in cash while the other half is paid in company’s B shares to be acquired from the stock exchange during April 2017. Remuneration of Corporate Management Team consists of fixed monthly salary, annual bonus determined by each Team member position’s ability to affect Group’s financial result, pension benefits, CEO’s share based incentive scheme and shareholding programme for Corporate Management Team.
The monthly salary of CEO Mika Joukio is EUR 40,211. The salary includes car and phone benefits and extended insurance cover for travel and accidents. In addition, the Board may, in accordance with CEO contract, decide that the CEO receives bonus pay based on his overall performance and equalling his salary of up to seven months. In 2017, CEO Mika Joukio was paid EUR 1,339,475.78 in total compensation and consisting of EUR 506,662.30 in fixed salary, EUR 25,198.56 in annual bonus and EUR 807,614.92 in share based incentives and related cash component. Additionally, EUR 398,124.69 of share based incentive payments accruing from vesting period 2014–2016 was deferred and will be paid later in accordance with share based incentive scheme rules.
In 2016, CEO Mika Joukio was paid EUR 1,173,861.42 in total compensation and consisting of EUR 498,301.01 in fixed salary, EUR 229,849.37 in annual bonus and EUR 445,711.04 in share based incen-tives and related cash component.
The members of Corporate Management Team are entitled to bonus pay corresponding to a maximum of their respective six-month salaries. The bonus pay is defined and decided by the Board of Directors and was in years 2017 and 2016 based on the development of company’s operating result and cash flow, achievement of function specific profit and other targets as well as personal targets. Salaries including benefits paid to other memebers of Corporate Management Team than CEO were EUR 974,431.69 (2016: EUR 1,093,383.59), bonuses EUR 66,393.19 (439,657.05) and share-based incentive including related cash component EUR 848,976.59 (927,671.44) with total at EUR 1,889,801.47 (EUR 2,460,712.08). Additionally, EUR 994,669.63 of share based incentive payments accruing from vesting period 2014–2016 was deferred and will be paid later in accordance with share based incentive scheme rules.
NOTE TO THE ACCOUNTS 30YEAR 2017
REPORT OF THE BOARD OF DIRECTORS
GROUP ACCOUNTS
SHARES AND SHAREHOLDERS
PARENT COMPANY ACCOUNTS
AUDITOR’S REPORT
GOVERNANCE KEY FIGURES
INVESTOR INFORMATION
CONSOLIDATED STATEMENT OF COMPREHENSIVE INCOME | BALANCE SHEET | STATEMENT OF CHANGES IN SHAREHOLDERS’ EQUITY | CASH FLOW STATEMENT | NOTES

NOTE TO THE ACCOUNTS 31 – FINANCIAL STATEMENTS 2017 81
Share based incentive schemes and the shareholding programme for Board of Directors are presented in Note 29.
The CEO’s mutual term of notice is six months. In case the CEO contract is terminated by the Board of Directors, the CEO is entitled to receive discharge compensation equal to his 12-month salary.
The period of notice for other members of Corporate Management Team is six months. Corporate Management Team members with the exception of CEO and Senior Vice President, Human Resources, are entitled to additional severance compensation varying from zero to 12-month salary in case of employment termination on grounds not related to the affected Management Team member.
The CEO is covered by statutory employee pension scheme. This offers pension benefits based on term of service and renumeration earned as prescribed in applicable legislation. Finnish pension system includes basic salary, bonuses and taxable value of fringe benefits in its definition of remuneration, but excludes stock options and share based compensation. Through supplementary pension arrangements, the CEO is entitled to retire at the age of 62 years. His pension will be equal to 60 per cent of his salary at the time of retirement calculated in accordance with Finnish pension legislation and based on the calcula-tion period of five years immediately preceding retirement. In case the CEO’s contract is terminated prior to retirement, the pension earned by the CEO becomes vested.
Excluding the CEO, the Corporate Management Team members have no pension arrangements differing from statutory pensions. Corporate Management Team members are covered by statutory employee pension scheme. This offers pension benefits based on term of service and renumeration earned as prescribed in applicable legisla-tion. Finnish pension system includes basic salary, bonuses and taxable value of fringe benefits in its definition of remuneration, but excludes stock options and share based compensation. The expenses arising from the Corporate Management Team members defined contribution pen-sion plans were EUR 0.3 million (0.4). The Group has no off balance sheet pension liabilities on behalf of management.
Neither Metsä Board’s CEO nor the members of the Board of Directors had any loans outstanding from the company or its subsidiares.
31. ENVIRONMENTAL AFFAIRS
ACCOUNTING PRINCIPLES
Only additional identifiable costs that are primarily intended to prevent or reduce damage to the environment are included in environmental costs. Environmental costs are capitalised if they are related to future environmental protection measures and bring future economic benefits.
Following is the summary of environmental costs and changes in capi-talised environmental expenditures.
EUR million 2017 2016
INCOME STATEMENT
Materials and services 5.6 6.2
Employee costs
Wages and salaries 0.8 0.8
Other employee costs 0.4 0.4
Depreciation and amortisation 6.1 6.0
Other operating expenses 3.0 3.0
15.9 16.4
BALANCE SHEET
Tangible assets
Acquisition costs, 1 Jan 126.6 122.6
Translation difference -1.4 -0.6
Increases 0.2 5.8
Decreases - -1.2
Depreciation -90.4 -87.6
Carrying amount, 31 Dec 35.0 38.9
PROVISIONS
Environmental obligations 5.6 6.2
THE NOTES
Other commitments for environmental obligations 0.4 0.4
EMISSION ALLOWANCES
ACCOUNTING PRINCIPLES
The Group has received emission allowances in accordance with the European Union Emissions Trading System. Allowances are treated as intangible assets and are measured at acquisition cost. The acquisition cost of emission allowances received without consideration is zero. Emission allowances are used simultane-ously with the carbon dioxide emissions generated during their validity period. Earnings from emission allowances sold are recognised in other operating income. If the emission allowances received without consideration are not sufficient to cover the amount of the actual emissions, the Group purchases additional allowances from the market.
The allowances purchased are recognised in intangible rights at the fair value on the acquisition date. The provision to fulfil the obligation to return the emission allowances is recognised at fair value on the closing date of the reporting period if the emis-sion allowances received without consideration and purchased are not sufficient to cover the amount of the actual emissions.
Metsä Board Group participates in the European Union Emissions Trading System. In 2017, the Group received 673,000 tonnes of emis-sion allowances free of charge. On the balance sheet date, the company held 1,187,000 tonnes of emission allowances. Emissions during the reporting period fell below the amount of emission allowances received free of charge, and emissions during the year did not have an impact on income statement or balance sheet.
In 2017, the Group sold emission allowances worth of EUR 0.3 million. On the balance sheet date, the fair market value of an emission right was EUR 8.09 per tonne and total value of owned rights approxi-mately EUR 9.6 million.
NOTE TO THE ACCOUNTS 31YEAR 2017
REPORT OF THE BOARD OF DIRECTORS
GROUP ACCOUNTS
SHARES AND SHAREHOLDERS
PARENT COMPANY ACCOUNTS
AUDITOR’S REPORT
GOVERNANCE KEY FIGURES
INVESTOR INFORMATION
CONSOLIDATED STATEMENT OF COMPREHENSIVE INCOME | BALANCE SHEET | STATEMENT OF CHANGES IN SHAREHOLDERS’ EQUITY | CASH FLOW STATEMENT | NOTES

82 FINANCIAL STATEMENTS 2017 – NOTES TO THE ACCOUNTS 32–33
32. COMPARABLE KEY FIGURES
New European Securities and Markets Authority (ESMA) guidelines on Alternative Performance Measures are effective for the financial year 2016. ESMA guidelines define alternative performance measures as a financial measure of historical or future financial performance, financial position or cash flows, other than a financial measure defined in the applicable financial reporting framework, in Metsä Board’s case International Financial Reporting Standards as adopted in the EU pursuant to Regulation (EC) No 1606/2002. With the exception of Result per share defined in IAS 33 Earnings Per Share, performance measures provided in the financial statements all qualify as alternative performance measures under the ESMA guidelines.
Metsä Board sees the presentation of alternative performance meas-ures as providing users of financial statements with an improved view of the company’s financial performance and position, including among other things the efficiency of its capital utilization, operational profit-ability and debt servicing capabilities.
From Q3/2016 Metsä Board has relabeled the previously referenced “excluding non-recurring items” non-IFRS financial measures with “comparable” performance measures. Exceptional and material items outside the ordinary course of business have been eliminated from the comparable operating result, and they have been allocated to the oper-ating segments. The change in terminology does not affect the defini-tion of items affecting comparability and therefore no restatement of historical data is necessary.
Metsä Board has defined operating result as follows: Result for the period presented in IFRS income statement before income taxes, finan-cial income and expense as well as share of result of associate companies and joint ventures.
Reconciliation of operating result under IFRS and comparable oper-ating result as well as EBITDA and comparative EBITDA is presented below. Comparable return on capital employed has been calculated using the same adjustments as the comparable operating result, and it has been further adjusted with financial items affecting comparability when applicable. Metsä Board considers that key figures derived in this manner improve comparability between reporting periods.
None of these key figures with items affecting comparability eliminated are key figures used in IFRS reporting, and they cannot be compared with other companies’ key figures identified with the same names. Typical items affecting comparability include material gains and losses on disposals of assets, impairments and impairment reversals in accordance with IAS 36 Impairment of Assets, restructuring costs and their adjustments as well as items arising from legal proceedings. In Metsä Board’s view, comparable performance measures better reflect the underlying operational performance of the Company by eliminating the result effect arising from items and transactions outside ordinary course of business.
Items affecting comparability during the reporting period consisted mainly of a reversal of previously recognized impairment loss of EUR 3.9 million on the closed and sold paper machine at Kyro mill and re-lease to profit and loss of cumulative translation difference amounting to EUR 10.2 million and arising from liquidation of non-operational English subsidiaries in accordance with IFRS accounting rules.
Comparable operating result for the financial year 2016 included a net disposal gain of EUR 9.8 million. Among other things, it consisted of disposals of assets related to wallpaper base business and the sale of Alrec Boiler Oy, a structured entity previously owning the combustion
facility in operation at Kaskinen pulp mill and consolidated to group accounts as a subsidiary. Furthermore, the net gain included an earn-out received from the sale of subsidiary receivables in connection with a subsidiary disposal carried out in 2011 and treated as a reversal of previously recognized disposal loss.
Employee costs of EUR 5.2 million affecting comparability con-sisted of restructuring costs arising from Simpele mill, Belgian sales office and Kyro board and paper mills. Furthermore, a disposal gain of EUR 1.8 million realized by associated company Metsä Fibre was deducted from operating result as an item affecting comparability.
Impairment charges of EUR 8.7 million affecting comparability arose from the remaining carrying values of tangible assets related to the discontinued wallpaper base production at Kyro mill and the closed Belgian sales office while other operating expenses of EUR 2.8 million mainly comprised other expenses arising from wallpaper production discontinuation and the related expense of writing wallpaper base inventories to their net realizable value.
EUR million 2017 2016
OPERATING RESULT 207.1 132.3
Depreciation, amortisation and impairment losses 91.6 102.3
EBITDA 298.7 234.6
Items affecting comparability
Gains and losses on disposal in other operating income and expenses -10.2 -9.8
Employee costs - 5.2
Share of result of associated company - -1.8
Other operating expenses 0.5 2.8
Total -9.7 -3.5
EBITDA, COMPARABLE 289.1 231.1
Depreciation, amortisation and impairment losses -91.6 -102.3
Items affecting comparability:
Impairment charges and reversals of impairments -3.9 8.7
OPERATING RESULT, COMPARABLE 193.5 137.5
"+" sign items = expense affecting comparability
"-" sign items = income affecting comparability
33. EVENTS AFTER THE BALANCE SHEET DATE
Due to suspected information security breach, Metsä Board announced preliminary information on the sales, comparable operating result and earnings per share for the fourth quarter of 2017 on 9 January 2018. The suspected information security breach has not had financial impacts on Metsä Board.
Metsä Board announced an increase of EUR 50 per tonne in the white kraftliner prices in Europe as of 1 February 2018.
Metsä Board is launching a biobased, biodegradable paperboard with a special eco-barrier treatment, developed particularly for food service packaging. In addition to being environmentally friendly, the new product offers efficiencies in printing and converting.
NOTES TO THE ACCOUNTS 32–33YEAR 2017
REPORT OF THE BOARD OF DIRECTORS
GROUP ACCOUNTS
SHARES AND SHAREHOLDERS
PARENT COMPANY ACCOUNTS
AUDITOR’S REPORT
GOVERNANCE KEY FIGURES
INVESTOR INFORMATION
CONSOLIDATED STATEMENT OF COMPREHENSIVE INCOME | BALANCE SHEET | STATEMENT OF CHANGES IN SHAREHOLDERS’ EQUITY | CASH FLOW STATEMENT | NOTES
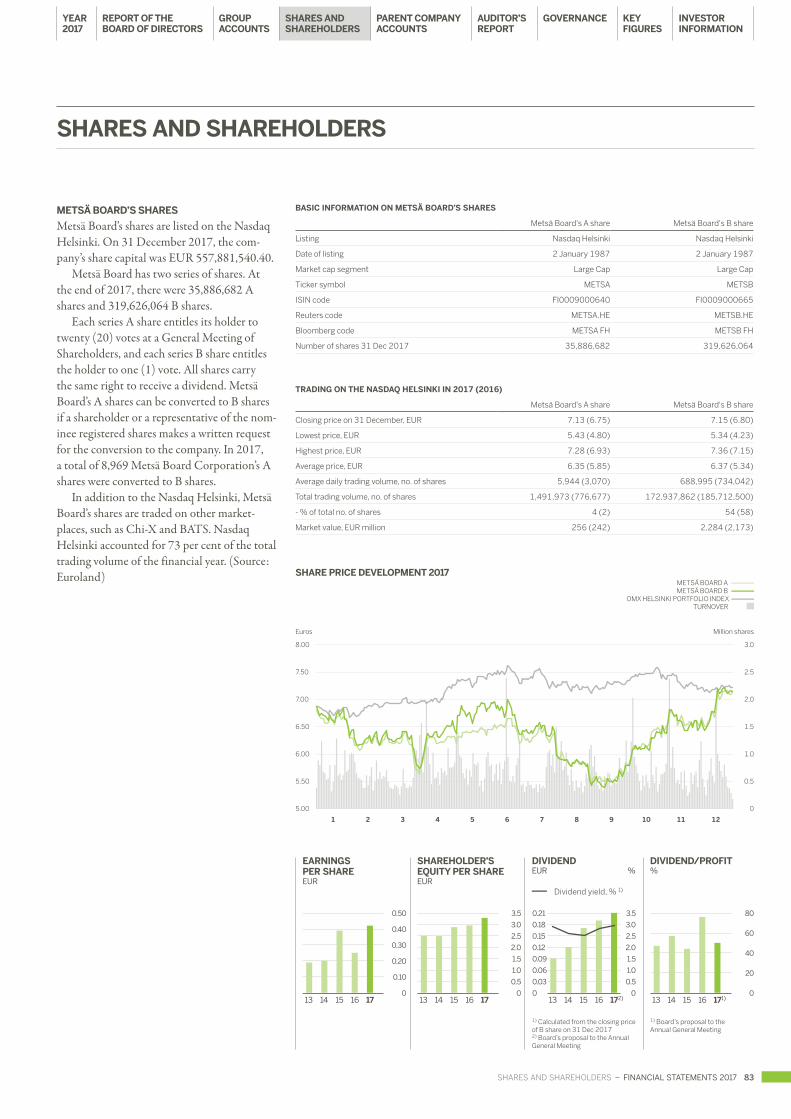
31 842 95 106 117 12
METSÄ BOARD A METSÄ BOARD B
OMX HELSINKI PORTFOLIO INDEX TURNOVER
SHARES AND SHAREHOLDERS – FINANCIAL STATEMENTS 2017 83
SHARES AND SHAREHOLDERS
METSÄ BOARD’S SHARES
Metsä Board’s shares are listed on the Nasdaq Helsinki. On 31 December 2017, the com-pany’s share capital was EUR 557,881,540.40.
Metsä Board has two series of shares. At the end of 2017, there were 35,886,682 A shares and 319,626,064 B shares.
Each series A share entitles its holder to twenty (20) votes at a General Meeting of Shareholders, and each series B share entitles the holder to one (1) vote. All shares carry the same right to receive a dividend. Metsä Board’s A shares can be converted to B shares if a shareholder or a representative of the nom-inee registered shares makes a written request for the conversion to the company. In 2017, a total of 8,969 Metsä Board Corporation’s A shares were converted to B shares.
In addition to the Nasdaq Helsinki, Metsä Board’s shares are traded on other market-places, such as Chi-X and BATS. Nasdaq Helsinki accounted for 73 per cent of the total trading volume of the financial year. (Source: Euroland) SHARE PRICE DEVELOPMENT 2017
BASIC INFORMATION ON METSÄ BOARD’S SHARES
Metsä Board's A share Metsä Board's B share
Listing Nasdaq Helsinki Nasdaq Helsinki
Date of listing 2 January 1987 2 January 1987
Market cap segment Large Cap Large Cap
Ticker symbol METSA METSB
ISIN code FI0009000640 FI0009000665
Reuters code METSA.HE METSB.HE
Bloomberg code METSA FH METSB FH
Number of shares 31 Dec 2017 35,886,682 319,626,064
TRADING ON THE NASDAQ HELSINKI IN 2017 (2016)
Metsä Board's A share Metsä Board's B share
Closing price on 31 December, EUR 7.13 (6.75) 7.15 (6.80)
Lowest price, EUR 5.43 (4.80) 5.34 (4.23)
Highest price, EUR 7.28 (6.93) 7.36 (7.15)
Average price, EUR 6.35 (5.85) 6.37 (5.34)
Average daily trading volume, no. of shares 5,944 (3,070) 688,995 (734,042)
Total trading volume, no. of shares 1,491,973 (776,677) 172,937,862 (185,712,500)
- % of total no. of shares 4 (2) 54 (58)
Market value, EUR million 256 (242) 2,284 (2,173)
8.00 3.0
7.50 2.5
7.00 2.0
6.50 1.5
6.00 1.0
5.50 0.5
5.00 0
Euros Million shares
0.21 3.5
0.18 3.0
0.15 2.5
0.12 2.0
0.09 1.5
0.06 1.0
0.03 0.5
0 013 14 15 16 172)
1) Calculated from the closing price of B share on 31 Dec 20172) Board’s proposal to the Annual General Meeting
Dividend yield, % 1)
DIVIDENDEUR %
80
60
40
20
013 14 15 16 171)
1) Board’s proposal to the Annual General Meeting
DIVIDEND/PROFIT%
0.50
0.40
0.30
0.20
0.10
013 14 15 16 17
EARNINGS PER SHAREEUR
3.5
3.0
2.5
2.0
1.5
1.0
0.5
013 14 15 16 17
SHAREHOLDER’S EQUITY PER SHAREEUR
YEAR 2017
REPORT OF THE BOARD OF DIRECTORS
GROUP ACCOUNTS
SHARES AND SHAREHOLDERS
PARENT COMPANY ACCOUNTS
AUDITOR’S REPORT
GOVERNANCE KEY FIGURES
INVESTOR INFORMATION

84 FINANCIAL STATEMENTS 2017 – SHARES AND SHAREHOLDERS
MAJOR SHAREHOLDERS 31 DEC 20171) A SERIES B SERIES TOTAL SHARES VOTES
SHAREHOLDERS NO. OF SHARES NO. OF SHARES NO. OF SHARES % %
1. Metsäliitto Cooperative 25,751,535 121,939,697 147,691,232 41,54 61,4
2. Varma Mutual Pension Insurance Company 2,203,544 15,041,485 17,245,029 4,85 5,7
3. Ilmarinen Mutual Pension Insurance Company 3,534,330 6,515,339 10,049,669 2,83 7,44
4. Etola Erkki Olavi 0 7,500,000 7,500,000 2,11 0,72
5. The State Pension Fund 0 4,150,000 4,150,000 1,17 0,4
6. Elo Mutual Pension Insurance Company 0 3,500,000 3,500,000 0,98 0,34
7. Maa- ja Metsätaloustuottajain Keskusliitto MTK ry 1,382,473 801,595 2,184,068 0,61 2,74
8. OP-Finland Value Fund 0 2,152,221 2,152,221 0,61 0,21
9. Evli Finnish Small Cap Fund 0 1,902,054 1,902,054 0,54 0,18
10. Säästöpankki Korko Plus Mutual Fund 0 1,799,807 1,799,807 0,51 0,17
11. Savox Investments S.A. 0 1,500,000 1,500,000 0,42 0,14
12. OP-Finland Small Firms Fund 0 1,495,163 1,495,163 0,42 0,14
13. ODIN Finland 0 1,460,704 1,460,704 0,41 0,14
14. The Local Government Pensions Institution 0 1,406,000 1,406,000 0,4 0,14
15. Etera Mutual Pension Insurance Company 0 1,176,258 1,176,258 0,33 0,11
16. Jordan Kari Alpo Erik 0 1,033,147 1,033,147 0,29 0,1
17. Nordea Pro Finland Fund 0 1,026,774 1,026,774 0,29 0,1
18. Danske Finnish Institutional Equity Fund 0 1,014,642 1,014,642 0,29 0,1
19. Fondita Nordic Small Cap Fund 0 1,000,000 1,000,000 0,28 0,1
20. Säästöpankki Kotimaa Mutual Fund 0 982,786 982,786 0,28 0,09
1) Shareholders in the book entry system.
METSÄ BOARD A SHARE
NUMBER OF SHARESNUMBER OF
SHAREHOLDERS %NUMBER OF
SHARES %NUMBER
OF VOTES %
1–10 340 6.36 2,084 0.006 41,680 0.006
11–100 1,675 31.332 100,108 0.279 2,002,160 0.279
101–1,000 2,763 51.684 1,149,531 3.203 22,990,620 3.203
1,001–10,000 543 10.157 1,352,261 3.768 27,045,220 3.768
10,001–100,000 21 0.393 410,816 1.145 8,216,320 1.145
100,001– 4 0.075 32,871,882 91.599 657,437,640 91.599
Total 5,346 100 35,886,682 100 717,733,640 100
of which nominee registered 8 84,856 0.236 1,697,120 0.236
Number issued 35,886,682 100 717,733,640 100
METSÄ BOARD B SHARE
NUMBER OF SHARESNUMBER OF
SHAREHOLDERS %NUMBER OF
SHARES %NUMBER
OF VOTES %
1–10 2,498 5.773 18,556 0.006 18,556 0.006
11–100 11,639 26.9 599,523 0.188 599,523 0.188
101–1,000 19,094 44.13 7,707,381 2.411 7,707,381 2.411
1,001–10,000 9,002 20.805 25,343,479 7.929 25,343,479 7.929
10,001–100,000 927 2.142 22,137,646 6.926 22,137,646 6.926
100,001– 108 0.25 263,819,479 82.54 263,819,479 82.54
Total 43,268 100 319,626,064 100 319,626,064 100
of which nominee registered 10 65,459,323 20.48 65,459,323 20.48
Number issued 319,626,064 100 319,626,064 100
SHARES AND SHAREHOLDERSYEAR 2017
REPORT OF THE BOARD OF DIRECTORS
GROUP ACCOUNTS
SHARES AND SHAREHOLDERS
PARENT COMPANY ACCOUNTS
AUDITOR’S REPORT
GOVERNANCE KEY FIGURES
INVESTOR INFORMATION

SHARES AND SHAREHOLDERS – FINANCIAL STATEMENTS 2017 85
SHAREHOLDINGS OF THE MEMBERS OF THE BOARD OF DIRECTORS AND CEO ON 31 DECEMBER 2017
Holding
Kari Jordan Chairman of the Board of Directors 1,033,147
Martti Asunta Deputy Chairman of the Board of Directors 60,450
Kirsi Komi Member of the Board of Directors 64,064
Kai Korhonen Member of the Board of Directors 200,834
Liisa Leino Member of the Board of Directors 168,709
Jussi Linnaranta Member of the Board of Directors 5,239
Juha Niemelä Member of the Board of Directors 162,709
Veli Sundbäck Member of the Board of Directors 53,729
Erkki Varis Member of the Board of Directors 117,301
Mika Joukio CEO 261,884
The shareholdings of other members of Metsä Board’s Corporate Management Team are presented on pages 114–115.
CHANGES IN SHARE CAPITAL AND NUMBER OF SHARES 1 JAN 2004–31 DEC 2017
Number of shares Share capital, EUR million
2003 Share capital 31 Dec 2003 178,999,425 304.3
2004 Rights issue 148,633,415 252.7
Rights issue 532,772 0.9
Share capital 31 Dec 2004 328,165,612 557.9
2005–2014 No changes
2015 Rights issue, no changes to share capital 27,347,134 -
Share capital 31 Dec 2015 355,512,746 557.9
2016–2017 No changes
Share capital 31 Dec 2017 355,512,746 557.9
SHAREHOLDERS
At the end of 2017, Metsä Board had 5,346 (31 Dec 2016: 4,510) registered shareholders of A shares and 43,268 of B shares (31 Dec 2016: 42,011).
At the end of 2017, Metsäliitto Cooperative owned 42 per cent of the shares, and the voting rights conferred by these shares totalled 61 per cent. Foreign and nominee-registered investors held 20 (15) per cent of the shares. The company does not hold any treasury shares.
IMPACT OF CHANGE IN CONTROL
Some of Metsä Board’s shareholder agree-ments concerning resource and associated companies include provisions under which Metsä Board must offer its shares in an associ-ated company for sale to the other sharehold-ers in the case of a change of control of Metsä Board. Of these agreements, pursuant to the shareholders agreement of Metsä Fibre Oy, Metsä Fibre’s shareholders should offer their shares for sale to the other shareholders in the case of a change of control. A decrease in the voting rights of Metsäliitto Cooperative in Metsä Board to below 50 per cent would not, however, obligate Metsä Board to offer its shares in Metsä Fibre Oy for sale.
BOARD OF DIRECTORS’ AUTHORITY
TO ISSUE SHARES
The Board of Directors is authorised to decide on an issue of shares and any special rights with an entitlement to shares as referred to in Chapter 10, section 1 of the Limited Liability Companies Act as follows. The maximum number of shares that can be issued on the basis of the authorisation is 35,000,000 B shares, which corresponds to approximately 10 per cent of all shares in the company. The Board of Directors decides on all terms and conditions applicable to the issue of shares and the special rights with an entitlement to shares. The authorisation applies to both an issue of new shares and the assignment of own shares. The issue of shares and any special rights with an entitle-ment to shares may occur in departure from a shareholder’s subscription right (private placement). The authorisation is valid until 23 March 2022. The authorisation was fully unused on 31 December 2017.
DIVIDEND POLICY
Metsä Board aims to distribute at least 50 per cent of the result for the financial period as dividend every year. The Board of Directors proposes to the Annual General Meeting to be held on 27 March 2018 that a dividend of EUR 0.21 per share (a total of 355,512,746 shares), equalling 50 per cent of the earnings per share, be paid for the 2017 financial period.
SPLIT OF SHAREHOLDINGS AND VOTING RIGHTS PER GROUP, 31 DECEMBER 2017
SPLIT OF VOTING RIGHTS%
SPLIT OF SHAREHOLDINGS%
Metsäliitto Cooperative ................................................. 41.5 Nominee registered and foreign owners ..................... 19.6 Finnish institutions, companies and organisations ....20.8 Finnish households ........................................................18.1
Metsäliitto Cooperative ....................................................61.4 Nominee registered and foreign owners ..........................7.0 Finnish institutions, companies and organisations ...... 20.7 Finnish households ......................................................... 10.9
YEAR 2017
REPORT OF THE BOARD OF DIRECTORS
GROUP ACCOUNTS
SHARES AND SHAREHOLDERS
PARENT COMPANY ACCOUNTS
AUDITOR’S REPORT
GOVERNANCE KEY FIGURES
INVESTOR INFORMATION

86 FINANCIAL STATEMENTS 2017 – SHARES AND SHAREHOLDERS
SHARE PERFORMANCE
2017 2016 2015 2014 2013
Share prices, EUR
A share high 7.28 6.93 7.67 4.61 3.10
low 5.43 4.80 4.47 2.86 2.13
at year end 7.13 6.75 6.75 4.44 2.99
average 6.35 5.85 5.98 3.39 2.51
B share high 7.36 7.15 7.01 4.43 3.06
low 5.34 4.23 4.47 2.83 2.12
at year end 7.15 6.80 6.86 4.34 3.06
average 6.37 5.34 5.72 3.34 2.50
Trading in shares, units of Nasdaq Helsinki
A share 1,491,973 776,677 1,189,370 1,136,611 713,546
% of total no. of A shares 4.2 2.2 3.3 3.2 2.0
B share 172,937,862 185,712,500 109,988,836 59,119,118 52,692,081
% of total average no. of B shares 54.1 58.1 35.1 20.2 18.0
Number of shares at the year end
A share 35,886,682 35,895,651 35,895,651 35,985,651 35,985,651
B share 319,626,064 319,617,095 319,617,095 292,179,961 292,179,961
Total 355,512,746 355,512,746 355,512,746 328,165,612 328,165,612
Adjusted number of shares at year end 355,512,746 355,512,746 355,512,746 338,216,496 338,216,496
Market capitalisation of shares at year end, EUR million 2,539.6 2,415.7 2,434.9 1,471.6 1,031.2
Number of shareholders1) 43,268 42,011 42,050 40,235 40,390
1) Shareholders in the book entry system. Does not include nominee registered shareholders.
KEY FIGURES PER SHARE
EUR million 2017 2016 2015 2014 2013
Calculation of earnings per share
Result before tax 170.8 101.6 167.1 77.6 57.8
- non-controlling interest 0.0 0.0 0.0 0.0 -0.2
- income taxes -20.3 -11.3 -29.8 -9.1 6.3
= Earnings 150.5 90.4 68,5 63,9 171,1
Adjusted number of shares (average) 355,512,746 355,512,746 349,503,922 338,216,496 338,216,496
Earnings per share, basic and diluted, EUR 0.42 0.25 0.39 0.20 0.19
Shareholders’ equity per share, EUR 3.28 2.96 2.89 2.49 2.51
Dividend per share, EUR 0.211) 0.19 0.17 0.12 0.09
Payout ratio, % 50.0 76.0 43.6 57.1 47.4
Metsä Board shares have no nominal value.
Dividend yield, % of closing price
Series A 2.91) 2.8 2.5 2.6 2.9
Series B 2.91) 2.8 2.5 2.7 2.9
Price/earning ratio (P/E ratio)
Series A 17.0 27.0 17.3 21.9 16.2
Series B 17.0 27.2 17.6 21.3 16.6
P/BV , %
Series A 217.4 228.0 233.6 179.7 118.9
Series B 217.8 229.7 237.4 174.6 121.6
1) Board of Directors proposes that a dividend of EUR 0.21 per share is paid for 2017.
YEAR 2017
REPORT OF THE BOARD OF DIRECTORS
GROUP ACCOUNTS
SHARES AND SHAREHOLDERS
PARENT COMPANY ACCOUNTS
AUDITOR’S REPORT
GOVERNANCE KEY FIGURES
INVESTOR INFORMATION

CALCULATION OF KEY RATIOS – FINANCIAL STATEMENTS 2017 87
CALCULATION OF KEY RATIOS
PROFITABILITY
Return on equity (%) =Profit from continuing operations before tax - income taxes
Shareholders’ equity (average)
Return on capital employed (%) =Profit from continuing operations before tax + interest expenses, net exchange gains/losses and other financial expenses
Total equity + interest-bearing borrowings (average)
FINANCIAL POSITION
Equity ratio (%) =Shareholders’ equity
Total assets - advance payments received
Gearing ratio (%) =Interest-bearing borrowings
Shareholders’ equity
Net gearing ratio (%) =Interest-bearing borrowings - liquid funds - interest-bearing receivables
Shareholders’ equity
SHARE PERFORMANCE INDICATORS
Earnings per share =Profit attributable to shareholders of parent company
Adjusted number of shares (average)
Shareholders’ equity per share =Equity attributable to shareholders of parent company
Adjusted number of shares at 31 December
Dividend per share =Dividends
Adjusted number of shares at 31 December
Payout ratio (%) =Dividend per share
Earnings per share
Dividend yield (%) =Dividend per share
Share price at 31 December
Price/earnings ratio (P/E ratio) (%) =Adjusted share price at 31 December
Earnings per share
P/BV (%) =Adjusted share price at 31 December
Shareholders' equity per share
Adjusted average share price =Total traded volume per share (EUR)
Average adjusted number of shares traded during the financial year
Market capitalisation = Number of shares x market price at 31 December
OTHER KEY FIGURES
Internal financing of capital expenditure (%) =Net cash flow arising from operating activities
Gross capital expenditure
Interest cover =Net cash flow arising from operating activities + net interest expenses
Net interest expenses
Net cash flow arising from operating activities = Net cash flow arising from operating activities in the cash flow statement
YEAR 2017
REPORT OF THE BOARD OF DIRECTORS
GROUP ACCOUNTS
SHARES AND SHAREHOLDERS
PARENT COMPANY ACCOUNTS
AUDITOR’S REPORT
GOVERNANCE KEY FIGURES
INVESTOR INFORMATION
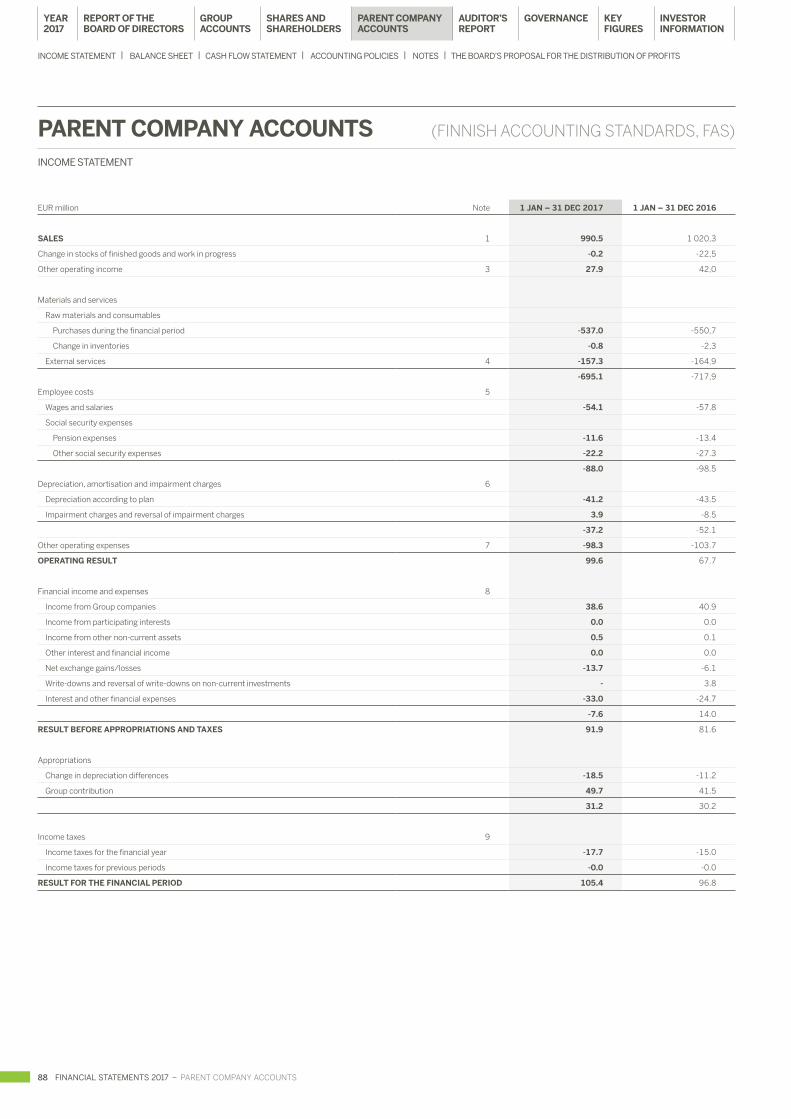
88 FINANCIAL STATEMENTS 2017 – PARENT COMPANY ACCOUNTS
EUR million Note 1 JAN – 31 DEC 2017 1 JAN – 31 DEC 2016
SALES 1 990.5 1 020,3
Change in stocks of finished goods and work in progress -0.2 -22,5
Other operating income 3 27.9 42,0
Materials and services
Raw materials and consumables
Purchases during the financial period -537.0 -550,7
Change in inventories -0.8 -2,3
External services 4 -157.3 -164,9
-695.1 -717,9
Employee costs 5
Wages and salaries -54.1 -57.8
Social security expenses
Pension expenses -11.6 -13.4
Other social security expenses -22.2 -27.3
-88.0 -98.5
Depreciation, amortisation and impairment charges 6
Depreciation according to plan -41.2 -43.5
Impairment charges and reversal of impairment charges 3.9 -8.5
-37.2 -52.1
Other operating expenses 7 -98.3 -103.7
OPERATING RESULT 99.6 67.7
Financial income and expenses 8
Income from Group companies 38.6 40.9
Income from participating interests 0.0 0.0
Income from other non-current assets 0.5 0.1
Other interest and financial income 0.0 0.0
Net exchange gains/losses -13.7 -6.1
Write-downs and reversal of write-downs on non-current investments - 3.8
Interest and other financial expenses -33.0 -24.7
-7.6 14.0
RESULT BEFORE APPROPRIATIONS AND TAXES 91.9 81.6
Appropriations
Change in depreciation differences -18.5 -11.2
Group contribution 49.7 41.5
31.2 30.2
Income taxes 9
Income taxes for the financial year -17.7 -15.0
Income taxes for previous periods -0.0 -0.0
RESULT FOR THE FINANCIAL PERIOD 105.4 96.8
PARENT COMPANY ACCOUNTSINCOME STATEMENT
(FINNISH ACCOUNTING STANDARDS, FAS)
YEAR 2017
REPORT OF THE BOARD OF DIRECTORS
GROUP ACCOUNTS
SHARES AND SHAREHOLDERS
PARENT COMPANY ACCOUNTS
AUDITOR’S REPORT
GOVERNANCE KEY FIGURES
INVESTOR INFORMATION
INCOME STATEMENT | BALANCE SHEET | CASH FLOW STATEMENT | ACCOUNTING POLICIES | NOTES | THE BOARD’S PROPOSAL FOR THE DISTRIBUTION OF PROFITS

PARENT COMPANY ACCOUNTS – FINANCIAL STATEMENTS 2017 89
EUR million Note 31 DEC 2017 31 DEC 2016
ASSETS
NON-CURRENT ASSETS
INTANGIBLE ASSETS 10
Intangible rights 10.1 9.6
Other capitalised expenditure 0.8 1.0
Advance payments and construction in progress 0.8 0.2
11.8 10.8
TANGIBLE ASSETS 10, 25
Land and water 11.2 11.0
Buildings and constructions 91.4 95.5
Machinery and equipment 216.7 232.6
Other tangible assets 2.5 2.6
Advance payment and construction in progress 12.3 8.8
334.2 350.6
INVESTMENTS 11, 15
Shares in Group companies 601.9 558.6
Receivables from Group companies 335.2 345.5
Shares in participating interests 90.9 90.9
Other shares and holdings 40.5 40.5
Other receivables 0.0 0.0
1,068.6 1,035.5
1,414.6 1,396.9
CURRENT ASSETS
Inventories
Raw materials and consumables 33.7 34.5
Finished goods and goods for resale 103.5 103.7
Advance payment 7.0 7.3
144.2 145.5
RECEIVABLES 12, 13, 14, 15
Current
Accounts receivables 114.6 109.4
Receivables from Group companies 252.2 198.6
Receivables from participating interests 0.1 0.3
Other receivables 16.2 12.9
Prepayment and accrued income 14.3 14.4
397.4 335.6
Cash and cash equivalents 3.5 0.6
TOTAL ASSETS 1,959.7 1,878.6
EUR million Note 31 DEC 2017 31 DEC 2016
EQUITY AND LIABILITIES
SHAREHOLDERS’ EQUITY 16
Share capital 557.9 557.9
Reserve for invested unrestricted equity 384.8 384.8
Retained earnings 38.7 9.5
Result for the financial period 105.4 96.8
1,086.9 1,049.0
APPROPRIATIONS
Accumulated depreciation difference 102.7 84.2
PROVISIONS 17, 25
Provisions for pensions 2.3 2.3
Other provisions 5.8 7.3
8.1 9.6
LIABILITIES
NON-CURRENT 19, 20, 21
Bonds 309.4 224.2
Loans from financial institutions 150.3 150.4
Pension loans 55.1 86.9
Accruals and deferred income 0.1 0.1
515.0 461.6
CURRENT 19, 20, 22, 23
Loans from financial institutions 0.2 50.0
Pension loans 37.7 37.7
Advance payments 4.9 6.8
Accounts payable 90.0 76.9
Payables to Group companies 42.0 34.7
Payables to participating interests 0.3 0.2
Other liabilities 5.4 6.3
Accruals and deferred income 66.5 61.6
247.1 274.2
762.0 735.9
TOTAL EQUITY AND LIABILITIES 1,959.7 1,878.6
PARENT COMPANY ACCOUNTS BALANCE SHEET
YEAR 2017
REPORT OF THE BOARD OF DIRECTORS
GROUP ACCOUNTS
SHARES AND SHAREHOLDERS
PARENT COMPANY ACCOUNTS
AUDITOR’S REPORT
GOVERNANCE KEY FIGURES
INVESTOR INFORMATION
INCOME STATEMENT | BALANCE SHEET | CASH FLOW STATEMENT | ACCOUNTING POLICIES | NOTES | THE BOARD’S PROPOSAL FOR THE DISTRIBUTION OF PROFITS

90 FINANCIAL STATEMENTS 2017 – PARENT COMPANY ACCOUNTS
EUR million 1 JAN – 31 DEC 2017 1 JAN – 31 DEC 2016
CASH FLOW FROM OPERATING ACTIVITIES
Operating result 99.6 67.7
Adjustments to operating result a) 33.6 44.9
Change in net working capital b) 60.8 39.9
Interest received 7.5 8.1
Interests paid -34.3 -23.6
Dividends received 31.6 33.0
Other financial items -3.4 3.8
Taxes -13.2 -12.0
NET CASH FLOW FROM OPERATIONS 182.1 161.6
INVESTMENTS
Acquisition of subsidiary shares -51.0 -0.6
Acquisition of participating interests - -24.9
Acquisition of other shares -1.2 -
Capital expenditure -25.8 -27.7
Proceeds from disposal and liquidation of subsidiares 4.4 2.1
Proceeds from disposal of other shares 0.0 0.1
Proceeds from sale of tangible and intangible assets 4.6 10.0
Increase (-) or decrease (+) in other non-current investments - -178.0
TOTAL CASH USED IN INVESTMENTS -69.0 -219.0
CASH FLOW BEFORE FINANCING 113.1 -57.4
FINANCING
Proceeds from non-current interest-bearing liabilities 255.1 5.9
Payment of non-current interest-bearing liabilities -252.3 -37.7
Increase (-) or decrease (+) in interest-bearing non-current receivables -44.9 144.5
Increase (-) or decrease (+) in interest-bearing current receivables -0.6 5.0
Dividends paid -67.5 -60.4
TOTAL FINANCING -110.2 57.2
Change in liquid funds 2.9 -0.1
Liquid funds at 1 Jan 0.6 0.7
LIQUID FUNDS AT 31 DEC 3.5 0.6
a) Adjustments to operating result
Depreciation 37.2 52.1
Gains (-) or losses (+) on sale of non-current assets -2.2 -8.5
Change in provisions -1.5 1.3
Total 33.6 44.9
b) Change in net working capital
Increase (-) or decrease (+) in stocks 1.3 25.2
Increase (-) or decrease (+) in non-interest bearing receivables 31.1 42.3
Increase (+) or decrease (-) in non-interest bearing liabilities 28.4 -27.6
Total 60.8 39.9
PARENT COMPANY ACCOUNTS CASH FLOW STATEMENT
YEAR 2017
REPORT OF THE BOARD OF DIRECTORS
GROUP ACCOUNTS
SHARES AND SHAREHOLDERS
PARENT COMPANY ACCOUNTS
AUDITOR’S REPORT
GOVERNANCE KEY FIGURES
INVESTOR INFORMATION
INCOME STATEMENT | BALANCE SHEET | CASH FLOW STATEMENT | ACCOUNTING POLICIES | NOTES | THE BOARD’S PROPOSAL FOR THE DISTRIBUTION OF PROFITS

PARENT COMPANY ACCOUNTING POLICIES – FINANCIAL STATEMENTS 2017 91
PARENT COMPANY ACCOUNTING POLICIES
Metsä Board Corporation’s financial statements have been prepared in accordance with Finnish accounting standards (FAS).
SALES
Sales are calculated after deduction of indirect sales taxes, trade dis-counts and other items adjusting sales.
EXCHANGE RATE DIFFERENCES
Foreign exchange gains and losses have been booked to net exchange gains/losses under financial income and expense. Open and actual foreign exchange differences hedging sales are recorded immediately to financial income and expenses in the income statement.
TRANSACTIONS IN FOREIGN CURRENCY
Transactions in foreign currency have been recognised at the exchange rate on the day of the transaction.
At the balance sheet date, receivables and liabilities denominated in foreign currency have been translated into euros at the exchange rate quoted by the European Central Bank on the balance sheet date.
DERIVATIVE CONTRACTS
Derivative contracts have not been recognized at fair value. All deriva-tive contracts entered into by Metsä Board Corporation fulfill the crite-ria of hedge accounting as defined under IAS 39 and hedge accounting has been applied to them in consolidated IFRS accounts, or they are hedges on open foreign currency positions recognised in the balance sheet under so-called fair value hedge accounting. Off-balance sheet liabilities arising from derivatives are presented in note 24.
PENSIONS AND PENSION FUNDING
Statutory pensions are handled by pension insurance companies outside the Group. In addition to statutory pensions, some salaried employees have supplementary pension arrangements which are either insured, arranged through Metsäliitto Employees’ Pension Foundation or con-stitute an unfunded liability of the company. Metsäliitto Employees’ Pension Foundation is fully funded based on the fair value of its assets.
Pension insurance premiums have been periodized to correspond to the accrual-based wages and salaries in the financial statements.
INVENTORIES
Inventories are measured at the lower of cost or net realizable value. FIFO principle is observed in measuring inventories or, alternatively, the weighted average cost method. Value of finished and semi-finished goods comprises raw materials, direct wages and salaries, depreciation and amortisation and other direct cost as well as a reasonable share of variable and fixed production overhead cost calculated at normal level
of production. Net realizable value is the estimated selling price less the estimated cost of completion and the estimated costs necessary to make the sale.
PROPERTY, PLANT AND EQUIPMENT AND DEPRECIATION
The carrying values of property, plant and equipment are based on original acquisition costs less depreciation according to plan and impairment losses.
Straight-line depreciation according to plan is based on the estimated useful life of the asset as follows:
Buildings and constructions 20–40 yearsHeavy power plant machinery 20–40 yearsOther heavy machinery 15–20 yearsLightweight machinery and equipment 5–15 yearsOther items 5–10 years
Depreciation is not recorded on the acquisition cost of land and water.
LEASING
Lease payments are treated as rental expenses.
ENVIRONMENTAL EXPENDITURE
Environmental expenditure comprises the identifiable expenses of environmental protection measures aimed primarily at preventing, remedying or alleviating environmental damage.
APPROPRIATIONS
Finnish tax legislation offers the possibility to deduct expenses prema-turely from the profit for the financial year and to transfer them to the balance sheet as provisions. The items are taken into account in tax filings only if they have been entered in the accounts. These items are presented under appropriations in the income statement and include depreciation on property, plant and equipment in excess of plan, which is stated as depreciation difference in the balance sheet and as change in the depreciation difference in the income statement. Received and given group contributions are also presented under appropriations.
PROVISIONS
Future costs and losses, to which the company is committed and which are likely to be realized, are included in the income statement under the appropriate expense heading and in the balance sheet under provi-sions for future costs whenever the precise amount and timing are not known, and in other cases under accrued liabilities. These can be i.a. pension liabilities or costs of discontinued operations and restructuring costs.
YEAR 2017
REPORT OF THE BOARD OF DIRECTORS
GROUP ACCOUNTS
SHARES AND SHAREHOLDERS
PARENT COMPANY ACCOUNTS
AUDITOR’S REPORT
GOVERNANCE KEY FIGURES
INVESTOR INFORMATION
INCOME STATEMENT | BALANCE SHEET | CASH FLOW STATEMENT | ACCOUNTING POLICIES | NOTES | THE BOARD’S PROPOSAL FOR THE DISTRIBUTION OF PROFITS

92 FINANCIAL STATEMENTS 2017 – NOTES TO THE PARENT COMPANY FINANCIAL STATEMENTS
NOTES TO THE PARENT COMPANY FINANCIAL STATEMENTS
EUR million 2017 2016
1. SALES
Finland 83.2 75.6
European Union 517.4 508.1
Rest of Europe 161.7 177.9
Rest of world 228.2 258.7
Total 990.5 1,020.3
2. EXCEPTIONAL ITEMS
Change in stocks of finished goods and work in progress
Write-down of Kyro mill inventories to net realizable value - -1.2
Other operating income
Gains on sale of non-current assets - 7.7
Gains on subsidiary liquidations 1.6
Employee costs
Restructuring cost - 4.9
Other operating expenses
Restructuring cost - 1.5
Other exceptional expenses 0.5 -
Other operating expenses total 0.5 1.5
Impairment charges and reversal of impairment charges
Reversal of impairment of Kyro paper machine -3.9 -
Impairment of Kyro mill tangible assets - 8.5
Exceptional items in income statement total,income (+) or expense (-) 5.0 -8.4
3. OTHER OPERATING INCOME
Rental income 1.1 0.9
Gains on disposal of fixed assets 2.2 9.8
Service revenue 17.5 19.4
Government grants and allowances 0.5 0.0
Scrap and waste sale 0.3 0.1
Other 6.2 11.8
Total 27.9 42.0
4. EXTERNAL SERVICES
Logistics expenses 106.2 118.4
Other external services 51.2 46.5
Total 157.3 164.9
External services include production related services and logistics expenses of sold products. Other operating expenses include among others non-production related services, energy costs, real estate costs and administration costs.
5. EMPLOYEE COSTS
Wages and salaries 54.1 57.8
Pension expenses 11.6 13.4
Other social security expenses 22.2 27.3
98.5 98.5
Key management remuneration
CEO 1.3 1.2
Members of the Board 0.7 0.7
Total 2.1 1.9
Remuneration paid to key management personnel is described in more detail in note 30 of the consolidated Group accounts.
Metsä Board Corporation employed an average of 1,104 people (2016: 1,192).
KPMG Oy Ab was the independent principal auditor of the Group in 2017.
PRINCIPAL AUDITOR FEES
Audit fees 0.14 0.12
Assignments referred to in Chapter 1 Sec 1 Subsec 2 of the Finnish Auditing Act 0.01 0.00
Other fees 0.01 0.00
Total 0.16 0.13
The audit fees are paid for statutory audit of the annual financial statements and related services.
EUR million 2017 2016
YEAR 2017
REPORT OF THE BOARD OF DIRECTORS
GROUP ACCOUNTS
SHARES AND SHAREHOLDERS
PARENT COMPANY ACCOUNTS
AUDITOR’S REPORT
GOVERNANCE KEY FIGURES
INVESTOR INFORMATION
INCOME STATEMENT | BALANCE SHEET | CASH FLOW STATEMENT | ACCOUNTING POLICIES | NOTES | THE BOARD’S PROPOSAL FOR THE DISTRIBUTION OF PROFITS

NOTES TO THE PARENT COMPANY FINANCIAL STATEMENTS – FINANCIAL STATEMENTS 2017 93
EUR million 2017 2016
10. NON-CURRENT ASSETS:INTANGIBLE ASSETS
INTANGIBLE RIGHTS
Acquisition costs, 1 Jan 104.3 105.1
Increases 2.9 0.8
Transfers between asset categories 0.0 -
Decreases -0.0 -1.6
Acquisition costs, 31 Dec 107.2 104.3
Accumulated depreciation, 1 Jan -94.7 -92.2
Accumulated depreciation on deduction and transfers - -
Depreciation for the period -2.3 -2.5
Accumulated depreciation, 31 Dec -97.1 -94.7
Book value, 31 Dec 10.1 9.6
OTHER CAPITALIZED EXPENDITURE
Acquisition costs, 1 Jan 15.9 15.9
Transfers between asset categories 0.0 -
Acquisition costs, 31 Dec 15.9 15.9
Accumulated depreciation, 1 Jan -14.9 -14.8
Accumulated depreciation on deduction and transfers - -
Depreciation for the period -0.1 -0.1
Accumulated depreciation, 31 Dec -15.0 -14.9
Book value, 31 Dec 0.8 1.0
ADVANCE PAYMENTS AND CONSTRUCTION IN PROGRESS
Acquisition costs, 1 Jan 0.2 -
Increases 0.6 0.2
Transfers between asset categories -0.0 -
Acquisition costs, 31 Dec 0.8 0.2
Book value, 31 Dec 0.8 0.2
EUR million 2017 2016
6. DEPRECIATION ACCORDING TO PLAN AND IMPAIRMENT CHARGES
Depreciation according to plan
Intangible rights 2.3 2.5
Other capitalised expenditure 0.1 0.1
Buildings and constructions 5.4 5.4
Machinery and equipment 33.0 35.2
Other tangible assets 0.3 0.3
Total depreciation according to plan 41.2 43.5
Impairment charges and reverse of impairment charges
Buildings and constructions - 2.1
Machinery and equipment -3.9 6.5
Total depreciation according to plan and impairment charges 37.2 52.1
Change in depreciation difference 18.5 11.2
Total depreciation, amortization and impairment charges 55.7 63.3
Accumulated depreciation difference, 1 Jan 84.2 72.9
Increase in depreciation difference 18.5 11.2
Accumulated depreciation difference, 31 Dec 102.7 84.2
7. OTHER OPERATING EXPENSES
Rents and other real estate expenses 6.0 6.5
Purchased services 57.9 59.2
Other operating expenses 34.4 38.1
Total 98.3 103.7
8. FINANCIAL INCOME AND EXPENSES
Dividend income 31.6 33.0
Interest income from non-current investments 7.5 8.0
Other interest income 0.0 0.0
Write-downs and reversal of write-downs on non-current investments - 3.8
Interest expenses -30.8 -23.3
Other financial expenses -2.2 -1.4
6.1 20.1
Net exchange differences -13.7 -6.1
Financial income and expenses, total -7.6 14.0
EXCHANGE DIFFERENCES IN INCOME STATEMENT
Exchange differences on sales -2.7 0.0
Exchange differences on purchases 0.3 -0.1
Exchange differences on financing -11.3 -6.1
Exchange differences, total -13.7 -6.1
9. INCOME TAXES
Income taxes for the financial period 17.7 15.0
Income taxes for previous periods 0.0 0.0
Total 17.7 15.0
In the autumn of 2015, the Finnish Tax Administration took a stand against the deductibility of certain losses in Metsä Board Corporation’s 2014 taxation. Metsä Board has appealed against the decision issued by the Tax Administration, as the company believes the losses are deductible.
YEAR 2017
REPORT OF THE BOARD OF DIRECTORS
GROUP ACCOUNTS
SHARES AND SHAREHOLDERS
PARENT COMPANY ACCOUNTS
AUDITOR’S REPORT
GOVERNANCE KEY FIGURES
INVESTOR INFORMATION
INCOME STATEMENT | BALANCE SHEET | CASH FLOW STATEMENT | ACCOUNTING POLICIES | NOTES | THE BOARD’S PROPOSAL FOR THE DISTRIBUTION OF PROFITS

94 FINANCIAL STATEMENTS 2017 – NOTES TO THE PARENT COMPANY FINANCIAL STATEMENTS
EUR million 2017 2016
11. INVESTMENTS
SHARES IN GROUP COMPANIES
Acquisition costs, 1 Jan 558.6 559.5
Increases 51.0 0.6
Decreases -7.6 -0.9
Write-downs - -0.6
Acquisition costs, 31 Dec 601.9 558.6
Book value, 31 Dec 601.9 558.6
SHARES IN PARTICIPATING INTERESTS
Acquisition costs, 1 Jan 90.9 66.0
Increases - 24.9
Acquisition costs, 31 Dec 90.9 90.9
Book value, 31 Dec 90.9 90.9
OTHER SHARES AND HOLDINGS
Acquisition costs, 1 Jan 40.5 40.6
Decreases -0.0 -0.1
Acquisition costs, 31 Dec 40.5 40.5
Book value, 31 Dec 40.5 40.5
RECEIVABLES FROM GROUP COMPANIES
Acquisition costs, 1 Jan 345.5 174.1
Increases - 329.0
Decreases -10.2 -157.6
Acquisition costs, 31 Dec 335.2 345.5
Book value, 31 Dec 335.2 345.5
OTHER RECEIVABLES
Acquisition costs, 1 Jan 0.0 0.0
No change - -
Acquisition costs, 31 Dec 0.0 0.0
Book value, 31 Dec 0.0 0.0
INVESTMENTS, TOTAL
Acquisition costs, 1 Jan 1,035.5 840.2
Increases 51.0 354.5
Decreases -17.9 -158.6
Write-downs - -0.6
Acquisition costs, 31 Dec 1,068.6 1,035.5
Book value, 31 Dec 1,068.6 1,035.5
12. LOAN RECEIVABLES FROM MANAGEMENT
There are no loan receivables from the CEO, members of the Board of Directors and their deputies as well as persons who are members of similar bodies.
EUR million 2017 2016
10. NON-CURRENT ASSETS:TANGIBLE ASSETS
LAND AND WATER
Acquisition costs, 1 Jan 11.0 12.1
Increases 0.2 0.0
Decreases -0.0 -1.1
Acquisition costs, 31 Dec 11.2 11.0
Book value, 31 Dec 11.2 11.0
BUILDINGS AND CONSTRUCTIONS
Acquisition costs, 1 Jan 276.5 273.1
Increases 0.6 3.3
Transfers between asset categories 0.7 0.2
Decreases -14.8 0.0
Acquisition costs, 31 Dec 263.1 276.5
Accumulated depreciation, 1 Jan -181.0 -173.5
Accumulated depreciation on deduction and transfers 14.7 -
Depreciation and impairment charges for the period -5.4 -7.4
Accumulated depreciation, 31 Dec -171.7 -181.0
Book value, 31 Dec 91.4 95.5
MACHINERY AND EQUIPMENT
Acquisition costs, 1 Jan 1,210.5 1.192.1
Increases 9.6 15.6
Transfers between asset categories 7.6 4.8
Decreases -130.7 -2.0
Acquisition costs, 31 Dec 1,096.9 1.210.5
Accumulated depreciation, 1 Jan -977.9 -938.2
Accumulated depreciation on deduction and transfers 126.7 2.0
Depreciation and impairment charges for the period -29.0 -41.7
Accumulated depreciation, 31 Dec -880.2 -977.9
Book value, 31 Dec 216.7 232.6
Production machinery and equipment, 31 Dec 216.7 232.6
OTHER TANGIBLE ASSETS
Acquisition costs, 1 Jan 9.6 9.4
Increases 0.2 0.2
Decreases -0.8 -
Acquisition costs, 31 Dec 9.0 9.6
Accumulated depreciation, 1 Jan -7.0 -6.7
Accumulated depreciation on deduction and transfers 0.8 -
Depreciation for the period -0.3 -0.3
Accumulated depreciation, 31 Dec -6.5 -7.0
Book value, 31 Dec 2.5 2.6
ADVANCE PAYMENTS AND CONSTRUCTION IN PROGRESS
Acquisition costs, 1 Jan 8.8 6.2
Increases 11.8 7.6
Transfers between asset categories -8.3 -5.0
Acquisition costs, 31 Dec 12.3 8.8
Book value, 31 Dec 12.3 8.8
The remaining net book value of capitalized interest expenses under balance sheet item “Machinery and equipment” was EUR 0.0 million (2016: 0.0). No interest expenses were capitalized during financial years 2017 and 2016.
YEAR 2017
REPORT OF THE BOARD OF DIRECTORS
GROUP ACCOUNTS
SHARES AND SHAREHOLDERS
PARENT COMPANY ACCOUNTS
AUDITOR’S REPORT
GOVERNANCE KEY FIGURES
INVESTOR INFORMATION
INCOME STATEMENT | BALANCE SHEET | CASH FLOW STATEMENT | ACCOUNTING POLICIES | NOTES | THE BOARD’S PROPOSAL FOR THE DISTRIBUTION OF PROFITS

NOTES TO THE PARENT COMPANY FINANCIAL STATEMENTS – FINANCIAL STATEMENTS 2017 95
EUR million 1 Jan Increase Decrease 31 Dec
17. PROVISIONS
Provisions for pension 1.0 - -0.0 0.9
Provisions for unemployment pension costs 1.3 0.1 -0.1 1.3
Restucturing provision 1.0 0.0 -0.8 0.2
Other provisions 6.2 0.0 -0.7 5.6
Total 9.6 0.2 -1.6 8.1
EUR million 2017 2016
18. DEFERRED TAX ASSETS AND LIABILITIES NOT RECOGNISED IN BALANCE SHEET
Deferred tax assets
Provisions 1.6 1.9
Total 1.6 1.9
Deferred tax liabilities
Accumulated depreciation difference 20.5 16.8
Total 20.5 16.8
19. LIABILITIES
Non-current
Non-interest-bearing 0.1 0.1
Interest-bearing 514.9 461.6
Total 515.0 461.6
Current
Non-interest-bearing 209.2 181.1
Interest-bearing 37.9 93.1
Total 247.1 274.2
Bonds Nominal value Interest, % EUR million
2014–2019 60.4 4.00 60.2
2017–2027 250.0 2.75 249.2
Total 310.4 309.4
Metsä Board Corporation has a bond with original value of EUR 225 million issued in March 2014, of which the outstanding nominal value is EUR 60.4 million after the repurchases made in 2017. The bond carries a fixed coupon rate of 4.0 per cent, and maturity date is 13 March 2019. The bond ranks senior and is unsecured.
Metsä Board Corporation issued in September 2017 a bond of EUR 250 mil-lion. The bond carries a fixed coupon rate of 2.75 per cent, and the maturity date is 29 September 2027. The bond ranks senior and is unsecured.
EUR million 2017 2016
13. CURRENT RECEIVABLES
Receivables from Group companies
Accounts receivables 15.6 11.8
Loan receivables 184.7 141.5
Other receivables 49.7 43.7
Prepayment and accrued income 2.1 1.7
Receivables from associated companies
Accounts receivables 0.1 0.3
Receivables from others
Accounts receivables 114.6 109.4
Other receivables 16.2 12.9
Prepayment and accrued income 14.3 14.4
Total 397.4 335.6
14. PREPAYMENT AND ACCRUED INCOME
Insurances 0.7 0.1
Energy taxes and other taxes 7.8 10.8
Other items 5.9 3.5
Total 14.3 14.4
15. INTEREST-BEARING RECEIVABLES
Loan receivables and other non-current assets 335.3 167.5
Liquid funds and other current assets 188.2 142.1
Total 523.5 309.6
16. SHAREHOLDERS’ EQUITY
Share capital, 1 Jan
Series A shares 56.3 56.3
Series B shares 501.6 501.6
Total 557.9 557.9
Conversion of A-shares into B-shares
Series A shares -0.0 -
Series B shares 0.0 -
Total - -
Share capital, 31 Dec
Series A shares 56.3 56.3
Series B shares 501.6 501.6
Total 557.9 557.9
Reserve for invested unrestricted equity 1 Jan 384.8 384.8
No change - -
Reserve for invested unrestricted equity 31 Dec 384.8 384.8
Retained earnings, 1 Jan 106.3 69.9
Dividend -67.5 -60.4
Profit for the period 105.4 96.8
Retained earnings, 31 Dec 144.1 106.3
Shareholders’ equity, total 1,086.9 1,049.0
YEAR 2017
REPORT OF THE BOARD OF DIRECTORS
GROUP ACCOUNTS
SHARES AND SHAREHOLDERS
PARENT COMPANY ACCOUNTS
AUDITOR’S REPORT
GOVERNANCE KEY FIGURES
INVESTOR INFORMATION
INCOME STATEMENT | BALANCE SHEET | CASH FLOW STATEMENT | ACCOUNTING POLICIES | NOTES | THE BOARD’S PROPOSAL FOR THE DISTRIBUTION OF PROFITS
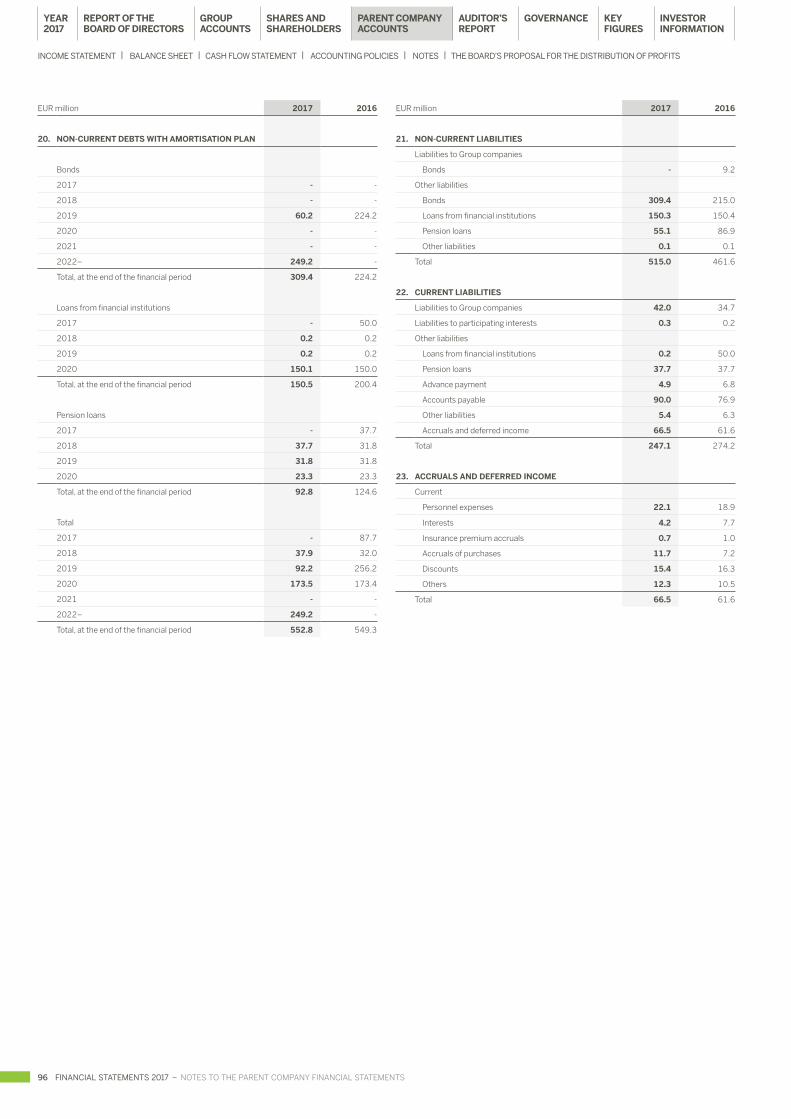
96 FINANCIAL STATEMENTS 2017 – NOTES TO THE PARENT COMPANY FINANCIAL STATEMENTS
EUR million 2017 2016
21. NON-CURRENT LIABILITIES
Liabilities to Group companies
Bonds - 9.2
Other liabilities
Bonds 309.4 215.0
Loans from financial institutions 150.3 150.4
Pension loans 55.1 86.9
Other liabilities 0.1 0.1
Total 515.0 461.6
22. CURRENT LIABILITIES
Liabilities to Group companies 42.0 34.7
Liabilities to participating interests 0.3 0.2
Other liabilities
Loans from financial institutions 0.2 50.0
Pension loans 37.7 37.7
Advance payment 4.9 6.8
Accounts payable 90.0 76.9
Other liabilities 5.4 6.3
Accruals and deferred income 66.5 61.6
Total 247.1 274.2
23. ACCRUALS AND DEFERRED INCOME
Current
Personnel expenses 22.1 18.9
Interests 4.2 7.7
Insurance premium accruals 0.7 1.0
Accruals of purchases 11.7 7.2
Discounts 15.4 16.3
Others 12.3 10.5
Total 66.5 61.6
EUR million 2017 2016
20. NON-CURRENT DEBTS WITH AMORTISATION PLAN
Bonds
2017 - -
2018 - -
2019 60.2 224.2
2020 - -
2021 - -
2022– 249.2 -
Total, at the end of the financial period 309.4 224.2
Loans from financial institutions
2017 - 50.0
2018 0.2 0.2
2019 0.2 0.2
2020 150.1 150.0
Total, at the end of the financial period 150.5 200.4
Pension loans
2017 - 37.7
2018 37.7 31.8
2019 31.8 31.8
2020 23.3 23.3
Total, at the end of the financial period 92.8 124.6
Total
2017 - 87.7
2018 37.9 32.0
2019 92.2 256.2
2020 173.5 173.4
2021 - -
2022– 249.2 -
Total, at the end of the financial period 552.8 549.3
YEAR 2017
REPORT OF THE BOARD OF DIRECTORS
GROUP ACCOUNTS
SHARES AND SHAREHOLDERS
PARENT COMPANY ACCOUNTS
AUDITOR’S REPORT
GOVERNANCE KEY FIGURES
INVESTOR INFORMATION
INCOME STATEMENT | BALANCE SHEET | CASH FLOW STATEMENT | ACCOUNTING POLICIES | NOTES | THE BOARD’S PROPOSAL FOR THE DISTRIBUTION OF PROFITS

NOTES TO THE PARENT COMPANY FINANCIAL STATEMENTS – FINANCIAL STATEMENTS 2017 97
24. CONTINGENT LIABILITIES
DISPUTESIn May 2014, Metsä Board petitioned the District Court of Helsinki to revoke the judgment issued by the Arbitral Tribunal on 11 February 2014 that orders Metsä Board to pay EUR 19.7 million in damages to UPM Kymmene Corporation. In a judgment issued in June 2015, the District Court rejected Metsä Board’s petition. Metsä Board appealed the decision of the District Court to the Court of Appeal. The Court of Appeal dismissed Metsä Board’s appeal on 21 October 2016. Metsä Board has applied for leave to appeal the matter to the Supreme Court.
EUR million 2017 2016
For own liabilities
Liabilities secured by pledges
Pension loans 25.4 34.6
Pledges granted 30.6 30.6
Liabilities secured by mortgages
Pension loans 63.8 87.1
Real estate mortgages 232.8 232.8
As security of own commitments
Guarantees and counter-indemnities 3.2 5.1
Other commitments - 49.9
Other rent and leasing commitments
Payments due in the following year 1.6 1.5
Payments due in subsequent years 2.8 3.2
Total
Pledges 30.6 30.6
Floating charges - -
Real estate mortgages 232.8 232.8
Guarantees and counter-indemnities 3.2 5.1
Other commitments - 49.9
Other rent and leasing commitments 4.3 4.7
Total 270.9 323.1
Other commitments are related to a sale and leaseback arrangement, which Metsä Board terminated in December 2017 by acquiring the lease object from the lessor.
Commitments arising from derivative contracts not recognised in balance sheet are as follows:
EUR million 2017 2017 2016 2016
Nominal value
Fair value
Nominalvalue
Fair value
Interest rate swaps 300.0 -0.9 100.0 -1.7
Interest rate derivatives total 300.0 -0.9 100.0 -1.7
Currency forward agreements 1,097.8 4.9 697.7 -12.3
Currency option agreements - - 56.9 -0.6
Currency derivatives total 1,097.8 4.9 754.6 -13.0
Electricity derivatives 20.2 0.2 45.8 0.9
Oil derivatives 7.5 0.8 11.1 0.4
Other commodity derivatives 1.8 0.4 1.1 0.3
Commodity derivatives total 29.4 1.4 58.1 1.7
Derivatives total 1,427.3 5.5 912.7 -13.0
All derivative agreements of Metsä Board Corporation have been entered into for hedging purposes, and cash flow hedge accounting according to IAS 39 is applied to a major part of the contracts in IFRS financial statements of the Metsä Board Group. Only the part of currency derivatives designated as hedges
of accounts receivables and accounts payables is excluded from the application of hedge accounting.
Interest rate derivatives are interest rate swaps maturing in 1–9 years and entered into to hedge the floating rate interest payments. Currency derivatives contracts concluded to hedge currency cash flows mature fully during the financial year starting on 1 January 2018. Commodity derivatives are electricity forwards, propane forwards and gasoil forwards concluded to hedge the cash flows arising from purchases of these commodities. Commodity derivative contracts mature in years 2018–2021. A more detailed description of financial risk management and the principles applied to derivative contracts is included in note 25 of the consolidated Group accounts.
25. ENVIRONMENTAL ITEMS
Only incremental identifiable costs that are primarily intended to prevent, reduce or repair damage to the environment are included in environmental costs. Environmental expenditures are capitalised if they have been incurred to prevent or reduce future damage or conserve resources and bring future economic benefits.
Following is the summary of environmental costs and changes in capitalised environmental expenditures.
EUR million 2017 2016
Income statement
Materials and consumables 2.9 3.5
Employees costs
Wages and salaries 0.6 0.6
Social security costs 0.3 0.3
Depreciation 3.6 3.4
Other operating expenses 3.9 3.8
11.3 11.7
Balance sheet
Tangible assets
Acquisition costs, 1 Jan 76.6 70.8
Increases 0.2 5.8
Decreases - -
Depreciation -55.1 -51.4
Book value, 31 Dec 21.8 25.2
Provisions
Other provisions 5.6 6.2
EMISSION ALLOWANCESMetsä Board Corporation participates in the European Union Emissions Trading System. In 2017, the company received 283,000 tonnes of emission allowances free of charge. On the balance sheet date, the company held 866,000 tonnes of emission allowances. Actual emissions during the financial period fell short of the amount of emission allowances received free of charge.
Metsä Board Corporation has recognised the emission allowances in accord-ance with the net method. The difference between the emissions and the emis-sion allowances received has been recognised through income statement if the actual emissions have exceeded the allowances received. Actual emission during the period did not have any effect on income statement or balance sheet.
In 2017, Metsä Board Corporation sold emission allowances worth EUR 0.3 million. On the balance sheet date, the fair value of an emission right was EUR 8.09 per tonne and total value of the rights held by the company was about EUR 7.0 million.
YEAR 2017
REPORT OF THE BOARD OF DIRECTORS
GROUP ACCOUNTS
SHARES AND SHAREHOLDERS
PARENT COMPANY ACCOUNTS
AUDITOR’S REPORT
GOVERNANCE KEY FIGURES
INVESTOR INFORMATION
INCOME STATEMENT | BALANCE SHEET | CASH FLOW STATEMENT | ACCOUNTING POLICIES | NOTES | THE BOARD’S PROPOSAL FOR THE DISTRIBUTION OF PROFITS

98 FINANCIAL STATEMENTS 2017 – THE BOARD’S PROPOSAL FOR THE DISTRIBUTION OF PROFITS
THE BOARD’S PROPOSAL FOR THE DISTRIBUTION OF PROFITS
The distributable funds of the parent company amount to EUR 528,987,038.96 of which the result for the period is EUR 105,429,883.16.The Board of Directors proposes to the Annual General Meeting that the distributable funds be distributed as follows:
A dividend of EUR 0.21 per share be paid, or in total 74,657,676.66To be left to the shareholders’ equity 454,329,362.30 528,987,038.96
The Board of Directors proposes that the dividend will be paid on 10 April 2018.
No material changes have taken place with respect to the company’s financial position after the balance sheet date. Liquidity of the company is good.
Espoo, 8 February 2018
Kari Jordan Martti Asunta Kirsi Komi
Kai Korhonen Liisa Leino Jussi Linnaranta
Juha Niemelä Veli Sundbäck Erkki Varis
Mika Joukio CEO
YEAR 2017
REPORT OF THE BOARD OF DIRECTORS
GROUP ACCOUNTS
SHARES AND SHAREHOLDERS
PARENT COMPANY ACCOUNTS
AUDITOR’S REPORT
GOVERNANCE KEY FIGURES
INVESTOR INFORMATION
INCOME STATEMENT | BALANCE SHEET | CASH FLOW STATEMENT | ACCOUNTING POLICIES | NOTES | THE BOARD’S PROPOSAL FOR THE DISTRIBUTION OF PROFITS

AUDITOR’S REPORT – FINANCIAL STATEMENTS 2017 99
AUDITOR’S REPORT
This document is an English translation of the Finnish auditor’s report. Only the Finnish version of the report is legally binding.
TO THE ANNUAL GENERAL MEETING OF METSÄ BOARD CORPORATION
REPORT ON THE AUDIT OF THE FINANCIAL STATEMENTS
OPINION
We have audited the financial statements of Metsä Board Corporation (business identity code 0635366-7) for the year ended 31 December 2017. The financial statements comprise the consolidated balance sheet, statement of comprehensive income, statement of changes in equity, statement of cash flows and notes, including a summary of significant accounting policies, as well as the parent company’s balance sheet, income statement, statement of cash flows and notes.
In our opinion— the consolidated financial statements give a true and fair view of
the group’s financial performance, financial position and cash flows in accordance with International Financial Reporting Standards (IFRS) as adopted by the EU
— the financial statements give a true and fair view of the parent com-pany’s financial performance and financial position in accordance with the laws and regulations governing the preparation of financial statements in Finland and comply with statutory requirements.
Our opinion is consistent with the additional report submitted to the Audit Committee.
BASIS FOR OPINION
We conducted our audit in accordance with good auditing practice in Finland. Our responsibilities under good auditing practice are further described in the Auditor’s Responsibilities for the Audit of the Financial Statements section of our report.
We are independent of the parent company and of the group com-panies in accordance with the ethical requirements that are applicable in Finland and are relevant to our audit, and we have fulfilled our other ethical responsibilities in accordance with these requirements.
In our best knowledge and understanding, the non-audit services that we have provided to the parent company and group companies are in compliance with laws and regulations applicable in Finland regard-ing these services, and we have not provided any prohibited non-audit services referred to in Article 5(1) of regulation (EU) 537/2014. The non-audit services that we have provided have been disclosed in note 5 to the consolidated financial statements.
We believe that the audit evidence we have obtained is sufficient and appropriate to provide a basis for our opinion.
MATERIALITY
The scope of our audit was influenced by our application of materiality. The materiality is determined based on our professional judgement and is used to determine the nature, timing and extent of our audit procedures and to evaluate the effect of identified misstatements on the financial statements as a whole. The level of materiality we set is based on our assessment of the magnitude of misstatements that, individually or in aggregate, could reasonably be expected to have influence on the economic decisions of the users of the financial statements. We have also taken into account misstatements and/or possible misstatements that in our opinion are material for qualitative reasons for the users of the financial statements.
KEY AUDIT MATTERS
Key audit matters are those matters that, in our professional judgment, were of most significance in our audit of the financial statements of the current period. These matters were addressed in the context of our audit of the financial statements as a whole, and in forming our opinion thereon, and we do not provide a separate opinion on these matters. The significant risks of material misstatement referred to in the EU Regulation No 537/2014 point (c) of Article 10(2) are included in the description of key audit matters below.
We have also addressed the risk of management override of internal controls. This includes consideration of whether there was evidence of management bias that represented a risk of material misstatement due to fraud.
THE KEY AUDIT MATTER HOW THE MATTER WAS ADDRESSED IN THE AUDIT
VALUATION OF TANGIBLE AND INTANGIBLE ASSETS
(REFER TO ACCOUNTING POLICIES AND NOTES 10 AND 11 TO THE CONSOLIDATED FINANCIAL STATEMENTS)
Tangible and intangible assets total EUR 815 million and repre-sent 37 percent of the consolidated total assets. Gross investments totalled EUR 65 million.
The impairment tests cover non-financial assets allocated to the business units. Determining the key assumptions used in the cash flow forecasts underlying the impairment tests requires manage-ment judgment.
Due to the significant carrying values involved, valuation of tangi-ble and intangible assets is determined a key audit matter.
Our audit procedures included evaluation of the appropriateness of the capitalization and depreciation principles applied.
We also assessed the key assumptions used in the impairment tests by reference to the budgets approved by the parent company’s Board of Directors, data external to the Group and our own views. We involved KPMG valuation specialists when assessing the mathematical accuracy of the calculations, as well as comparing the assumptions to externally available market and industry data.
In addition, we considered the appropriateness of the disclosures regarding the tangible and intangible assets.
YEAR 2017
REPORT OF THE BOARD OF DIRECTORS
GROUP ACCOUNTS
SHARES AND SHAREHOLDERS
PARENT COMPANY ACCOUNTS
AUDITOR’S REPORT
GOVERNANCE KEY FIGURES
INVESTOR INFORMATION
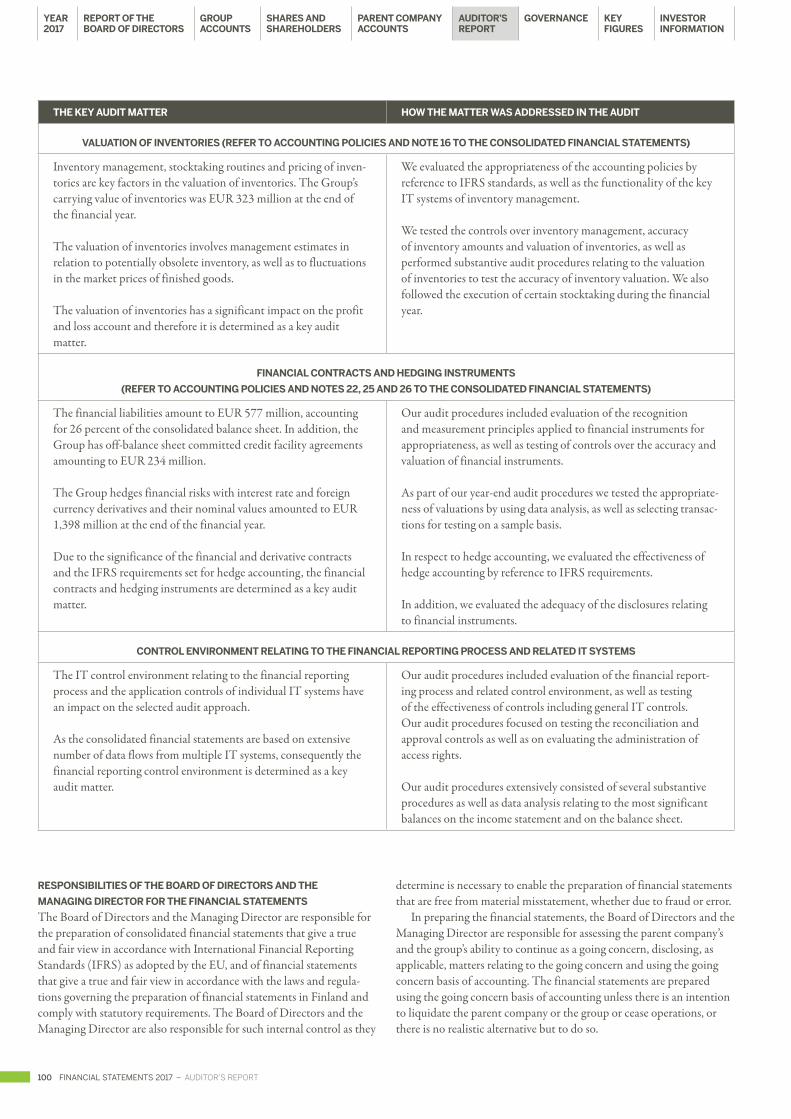
100 FINANCIAL STATEMENTS 2017 – AUDITOR’S REPORT
THE KEY AUDIT MATTER HOW THE MATTER WAS ADDRESSED IN THE AUDIT
VALUATION OF INVENTORIES (REFER TO ACCOUNTING POLICIES AND NOTE 16 TO THE CONSOLIDATED FINANCIAL STATEMENTS)
Inventory management, stocktaking routines and pricing of inven-tories are key factors in the valuation of inventories. The Group’s carrying value of inventories was EUR 323 million at the end of the financial year.
The valuation of inventories involves management estimates in relation to potentially obsolete inventory, as well as to fluctuations in the market prices of finished goods.
The valuation of inventories has a significant impact on the profit and loss account and therefore it is determined as a key audit matter.
We evaluated the appropriateness of the accounting policies by reference to IFRS standards, as well as the functionality of the key IT systems of inventory management.
We tested the controls over inventory management, accuracy of inventory amounts and valuation of inventories, as well as performed substantive audit procedures relating to the valuation of inventories to test the accuracy of inventory valuation. We also followed the execution of certain stocktaking during the financial year.
FINANCIAL CONTRACTS AND HEDGING INSTRUMENTS
(REFER TO ACCOUNTING POLICIES AND NOTES 22, 25 AND 26 TO THE CONSOLIDATED FINANCIAL STATEMENTS)
The financial liabilities amount to EUR 577 million, accounting for 26 percent of the consolidated balance sheet. In addition, the Group has off-balance sheet committed credit facility agreements amounting to EUR 234 million.
The Group hedges financial risks with interest rate and foreign currency derivatives and their nominal values amounted to EUR 1,398 million at the end of the financial year.
Due to the significance of the financial and derivative contracts and the IFRS requirements set for hedge accounting, the financial contracts and hedging instruments are determined as a key audit matter.
Our audit procedures included evaluation of the recognition and measurement principles applied to financial instruments for appropriateness, as well as testing of controls over the accuracy and valuation of financial instruments.
As part of our year-end audit procedures we tested the appropriate-ness of valuations by using data analysis, as well as selecting transac-tions for testing on a sample basis.
In respect to hedge accounting, we evaluated the effectiveness of hedge accounting by reference to IFRS requirements.
In addition, we evaluated the adequacy of the disclosures relating to financial instruments.
CONTROL ENVIRONMENT RELATING TO THE FINANCIAL REPORTING PROCESS AND RELATED IT SYSTEMS
The IT control environment relating to the financial reporting process and the application controls of individual IT systems have an impact on the selected audit approach.
As the consolidated financial statements are based on extensive number of data flows from multiple IT systems, consequently the financial reporting control environment is determined as a key audit matter.
Our audit procedures included evaluation of the financial report-ing process and related control environment, as well as testing of the effectiveness of controls including general IT controls. Our audit procedures focused on testing the reconciliation and approval controls as well as on evaluating the administration of access rights.
Our audit procedures extensively consisted of several substantive procedures as well as data analysis relating to the most significant balances on the income statement and on the balance sheet.
RESPONSIBILITIES OF THE BOARD OF DIRECTORS AND THE
MANAGING DIRECTOR FOR THE FINANCIAL STATEMENTS
The Board of Directors and the Managing Director are responsible for the preparation of consolidated financial statements that give a true and fair view in accordance with International Financial Reporting Standards (IFRS) as adopted by the EU, and of financial statements that give a true and fair view in accordance with the laws and regula-tions governing the preparation of financial statements in Finland and comply with statutory requirements. The Board of Directors and the Managing Director are also responsible for such internal control as they
determine is necessary to enable the preparation of financial statements that are free from material misstatement, whether due to fraud or error.
In preparing the financial statements, the Board of Directors and the Managing Director are responsible for assessing the parent company’s and the group’s ability to continue as a going concern, disclosing, as applicable, matters relating to the going concern and using the going concern basis of accounting. The financial statements are prepared using the going concern basis of accounting unless there is an intention to liquidate the parent company or the group or cease operations, or there is no realistic alternative but to do so.
YEAR 2017
REPORT OF THE BOARD OF DIRECTORS
GROUP ACCOUNTS
SHARES AND SHAREHOLDERS
PARENT COMPANY ACCOUNTS
AUDITOR’S REPORT
GOVERNANCE KEY FIGURES
INVESTOR INFORMATION
AUDITOR’S REPORT – FINANCIAL STATEMENTS 2017 101
AUDITOR’S RESPONSIBILITIES FOR THE
AUDIT OF THE FINANCIAL STATEMENTS
Our objectives are to obtain reasonable assurance on whether the finan-cial statements as a whole are free from material misstatement, whether due to fraud or error, and to issue an auditor’s report that includes our opinion. Reasonable assurance is a high level of assurance, but is not a guarantee that an audit conducted in accordance with good audit-ing practice will always detect a material misstatement when it exists. Misstatements can arise from fraud or error and are considered material if, individually or in aggregate, they could reasonably be expected to influence the economic decisions of users taken on the basis of the financial statements.
As part of an audit in accordance with good auditing practice, we exercise professional judgment and maintain professional scepticism throughout the audit. We also:— Identify and assess the risks of material misstatement of the financial
statements, whether due to fraud or error, design and perform audit procedures responsive to those risks, and obtain audit evidence that is sufficient and appropriate to provide a basis for our opinion. The risk of not detecting a material misstatement resulting from fraud is higher than for one resulting from error, as fraud may involve collusion, forgery, intentional omissions, misrepresentations, or the override of internal control.
— Obtain an understanding of internal control relevant to the audit in order to design audit procedures that are appropriate in the cir-cumstances, but not for the purpose of expressing an opinion on the effectiveness of the parent company’s or the group’s internal control.
— Evaluate the appropriateness of accounting policies used and the reasonableness of accounting estimates and related disclosures made by management.
— Conclude on the appropriateness of the Board of Directors’ and the Managing Director’s use of the going concern basis of accounting and based on the audit evidence obtained, whether a material uncer-tainty exists related to events or conditions that may cast significant doubt on the parent company’s or the group’s ability to continue as a going concern. If we conclude that a material uncertainty exists, we are required to draw attention in our auditor’s report to the related disclosures in the financial statements or, if such disclosures are inadequate, to modify our opinion. Our conclusions are based on the audit evidence obtained up to the date of our auditor’s report. However, future events or conditions may cause the parent company or the group to cease to continue as a going concern.
— Evaluate the overall presentation, structure and content of the finan-cial statements, including the disclosures, and whether the financial statements represent the underlying transactions and events so that the financial statements give a true and fair view.
— Obtain sufficient appropriate audit evidence regarding the financial information of the entities or business activities within the group to express an opinion on the consolidated financial statements. We are responsible for the direction, supervision and performance of the group audit. We remain solely responsible for our audit opinion.
We communicate with those charged with governance regarding, among other matters, the planned scope and timing of the audit and significant audit findings, including any significant deficiencies in internal control that we identify during our audit.
We also provide those charged with governance with a statement that we have complied with relevant ethical requirements regarding independence, and communicate with them all relationships and other
matters that may reasonably be thought to bear on our independence, and where applicable, related safeguards.
From the matters communicated with those charged with govern-ance, we determine those matters that were of most significance in the audit of the financial statements of the current period and are therefore the key audit matters. We describe these matters in our auditor’s report unless law or regulation precludes public disclosure about the matter or when, in extremely rare circumstances, we determine that a matter should not be communicated in our report because the adverse con-sequences of doing so would reasonably be expected to outweigh the public interest benefits of such communication.
OTHER REPORTING REQUIREMENTS
INFORMATION ON OUR AUDIT ENGAGEMENT
We were first appointed as auditors by the Annual General Meeting on 28 March 2012 , and our appointment represents a total period of uninterrupted engagement of 6 years.
OTHER INFORMATION
The Board of Directors and the Managing Director are responsible for the other information. The other information comprises the report of the Board of Directors and the information included in in the Annual Report, but does not include the financial statements and our auditor’s report thereon. We have obtained the report of the Board of Directors prior to the date of this auditor’s report, and the Annual Report is expected to be made available to us after that date. Our opinion on the financial statements does not cover the other information.
In connection with our audit of the financial statements, our respon-sibility is to read the other information identified above and, in doing so, consider whether the other information is materially inconsistent with the financial statements or our knowledge obtained in the audit, or otherwise appears to be materially misstated. With respect to the report of the Board of Directors, our responsibility also includes con-sidering whether the report of the Board of Directors has been prepared in accordance with the applicable laws and regulations.
In our opinion, the information in the report of the Board of Directors is consistent with the information in the financial statements and the report of the Board of Directors has been prepared in accord-ance with the applicable laws and regulations.
If, based on the work we have performed on the other information that we obtained prior to the date of this auditor’s report, we conclude that there is a material misstatement of this other information, we are required to report that fact. We have nothing to report in this regard.
OTHER OPINIONS
We support that the financial statements should be adopted. The pro-posal by the Board of Directors regarding the treatment of distributable funds is in compliance with the Limited Liability Companies Act. We support that the Board of Directors of the parent company and the Managing Director should be discharged from liability for the financial period audited by us.
Espoo, 12 February 2018
KPMG Oy Ab
Raija-Leena HankonenAuthorized Public Accountant
YEAR 2017
REPORT OF THE BOARD OF DIRECTORS
GROUP ACCOUNTS
SHARES AND SHAREHOLDERS
PARENT COMPANY ACCOUNTS
AUDITOR’S REPORT
GOVERNANCE KEY FIGURES
INVESTOR INFORMATION

102 FINANCIAL STATEMENTS 2017 – CORPORATE GOVERNANCE STATEMENT
INTRODUCTION
This statement describing the corporate governance of Metsä Board Corporation (Metsä Board or Company) has been issued as a separate statement pursuant to the Securities Markets Act and the Finnish Corporate Governance Code and is published concur-rently with the Company’s financial state-ments and report of the Board of Directors. The Finnish Corporate Governance Code from 2015 is available at the website of the Finnish Securities Markets Association at www.cgifinland.fi.
Metsä Board is a Finnish public limited company whose A and B series shares are subject to public trading on the official list of NASDAQ Helsinki Ltd. (Helsinki Stock Exchange). In its administration and
governance Metsä Board applies Finnish laws, especially the Companies Act, the Company’s Articles of Association and rules and regula-tions issued pursuant to laws, including those issued by the Financial Supervisory Authority and applying to listed companies. Metsä Board also complies with the rules and recom-mendations of the Helsinki Stock Exchange as applicable to listed companies.
Metsä Board prepares its financial state-ments and interim reports according to the International Financial Reporting Standards (IFRS). The financial statement documents are prepared and published in Finnish and English.
Metsä Board’s headquarters are located in Espoo, Finland. The Company’s registered domicile is Helsinki.
APPLICATION OF THE FINNISH CORPORATE
GOVERNANCE CODE
As a Finnish listed company, Metsä Board applies the Finnish Corporate Governance Code of 2015. Currently Metsä Board does not deviate from any single recommendation of the Code. The new Corporate Governance Code entered into force on 1 January 2016. This statement has been issued in compliance with the regulations concerning reporting content set out in the Corporate Governance Code 2015. The statement has been reviewed by the Board’s Audit Committee.
METSÄ BOARD’S GOVERNANCE STRUCTURE
The Company’s statutory bodies include the General Meeting of Shareholders, the Board
CORPORATE GOVERNANCE STATEMENT
SHAREHOLDERS’ MEETING
BOARD OF DIRECTORS
BOARD COMMITTEES AUDIT
COMMITTEENOMINATION AND COMPENSATION
COMMITTEE
CEO
CORPORATE MANAGEMENT TEAM
FINA
NC
IAL R
EP
OR
TIN
G
INT
ER
NA
L A
UD
ITIN
G
| A
UD
ITIN
G
CORPORATE GOVERNANCE IN METSÄ BOARD
YEAR 2017
REPORT OF THE BOARD OF DIRECTORS
GROUP ACCOUNTS
SHARES AND SHAREHOLDERS
PARENT COMPANY ACCOUNTS
AUDITOR’S REPORT
GOVERNANCE KEY FIGURES
INVESTOR INFORMATION
CORPORATE GOVERNANCE STATEMENT | SALARY AND REMUNERATION REPORT | BOARD OF DIRECTORS | CORPORATE MANAGEMENT TEAM

CORPORATE GOVERNANCE STATEMENT – FINANCIAL STATEMENTS 2017 103
of Directors and the CEO. In addition, a Corporate Management Team assists the CEO in the operative management of the Company and in coordinating its operations. Members of the management team are not members of the Board of Directors. The tasks and responsibilities of the different corporate bodies are specified in the Finnish Companies Act.
Metsä Board has a function based organisation, including sales and marketing, production, finance, development and human resources. Functions are supported by central-ized support functions, most of which are common with other Metsä Group companies. Support functions are based on specific service agreements, the terms of which are at arm’s length.
GENERAL MEETING
The General Meeting of Shareholders is the Company’s highest decision-making body where shareholders use their decision-making power. Each shareholder is entitled to participate in a General Meeting by fol-lowing the procedure described in the notice to the General Meeting. According to the Companies Act, the General Meeting decides on the following matters, among others:• amending the Articles of Association• approving the financial statements• profit distribution• mergers and demergers• acquisition and transfer of own shares• appointing the members of the Board and
specifying their and Board committee members’ compensation
• appointing the auditor and specifying his compensation.
Shareholders are entitled to put forward a matter pertaining to the General Meeting to be addressed when the shareholder delivers a written request to this effect so well in advance that the matter can be included in the notice to the meeting. The Company has specified January 15th as the relevant deadline. In addition, a shareholder has a right to present questions on the items on the agenda of the General Meeting. A shareholder is entitled to participate in a General Meeting
when he/she is included in the register of shareholders eight (8) working days before the General Meeting. An Annual General Meeting takes place each year in June at the latest. Notice to a General Meeting is served at the earliest three months and at the latest three weeks before the meeting by publishing it on the Company’s website and by publish-ing the notice or a summary thereof in at least one Finnish newspaper of general circulation.
An Extraordinary General Meeting will convene if the Board finds it necessary, or if the auditor or shareholders representing at least 10 per cent of all shares deliver a written request to this effect in order to process a specified matter.
BOARD OF DIRECTORS
The Board of Directors is responsible for the Company’s administration and arranging the Company’s operations properly according to applicable laws, the Articles of Association and good corporate governance. The general authority of the Board covers matters that are far-reaching, strategically significant or unusual and which therefore do not belong to the Company’s day-to-day business opera-tions. The Board supervises Metsä Board’s operations and management and decides on strategy, major investments, the Company’s organisation structure and significant financing matters. The Board supervises the proper arrangement of the Company’s opera-tions, and ensures that accounting and asset management control, financial reporting and risk management have been organised in an appropriate manner.
For its operation, the Board has a written working order. In accordance with the work-ing order, the Board’s tasks include:• appointing the CEO and discharging him
and ensuring that the CEO takes care of the Company’s day-to-day administration in accordance with the instructions and guidelines given by the Board;
• establishing necessary committees, appointing their members and approving their working orders;
• addressing and approving the long range plan and corporate strategy;
• accepting the annual operational plan and budget;
• monitoring how the Company’s account-ing, asset management, risk control and financial reporting are arranged;
• deciding on significant investments, busi-ness acquisitions, divestments and closures of operations;
• deciding on considerable investments and financing arrangements;
• deciding on the transfer and pledging of the Company’s significant real property;
• deciding on management authorizations and granting rights to represent the Company;
• monitoring that the Company’s Articles of Association are complied with; convening the General Meeting and monitoring that the decisions taken by the General Meeting are implemented;
• signing and presenting the financial state-ments to the Annual General Meeting for approval, and preparing a proposal for the use of profits;
• approving key policies and guidelines, including the insider guidelines;
• publishing the financial statements bul-leting as well as interim and semi-annual reports;
• publishing or authorizing the CEO to publish all inside information likely to have a significant effect on the value of the Company’s shares, or which otherwise have to be made public according to the Finnish Securities Markets Act or the Rules of the Helsinki Stock Exchange.
The working order of the Board of Directors is presented in full on the Company’s website (www.metsaboard.com > lnvestors > Corporate Governance). The Board can delegate matters in its general authority to the CEO and correspondingly take charge of decision-making in a task that belongs to the CEO’s general authority.
On an annual basis, the Board assesses its own operation and the Company’s governance and decides on any necessary changes.
The Board convenes on a regular basis. In the financial year 2017, the Board held a total of 15 meetings, five of which were phone meetings. All Board members participated in all meetings. (The attendance rate of the
YEAR 2017
REPORT OF THE BOARD OF DIRECTORS
GROUP ACCOUNTS
SHARES AND SHAREHOLDERS
PARENT COMPANY ACCOUNTS
AUDITOR’S REPORT
GOVERNANCE KEY FIGURES
INVESTOR INFORMATION
CORPORATE GOVERNANCE STATEMENT | SALARY AND REMUNERATION REPORT | BOARD OF DIRECTORS | CORPORATE MANAGEMENT TEAM

104 FINANCIAL STATEMENTS 2017 – CORPORATE GOVERNANCE STATEMENT
members was 98 per cent in 2016 and 99 per cent in 2015).
COMPOSITION, DIVERSITY AND
INDEPENDENCE OF THE BOARD OF
DIRECTORS
The composition and number of members of the Board of Directors must facilitate effective fulfilment of the Board’s tasks. The composition of the Board of Directors takes into account the development phase of the Company, ownership structure, the special requirements of the industry and the needs of the Company’s operations. Both sexes are rep-resented on the Board of Directors. A mem-ber of the Board must possess the competence required by the task and the opportunity to allocate sufficient time for the task.
The Board recognizes the benefits to the Company and its shareholders of a diverse and broad Board composition. Diversity sup-ports the Board’s open work atmosphere and decision-making. The Board is responsible for the company’s administration and the proper arrangement of its operations. A key task of the Board is also to support and challenge the operative management from various perspec-tives in a consistent and predictable manner. The successful working by the Board and its Committees requires a diverse composition, knowledge and experience base as well as taking into account the personal qualities of individual members. Metsä Board has identified that key diversity factors for the company include industry knowledge, experi-ence from different fields of business and the international business scene. In addition, vary-ing educational backgrounds, management experience from different business sectors and a varying age and gender structure have been identified as items promoting diversity. Metsä Board’s target is to have both genders repre-sented at the Board. Further, diversity shall correspond to and support the company’s then current development stage and respond to the Company’s and its business’ future develop-ment needs. The Board evaluates the success-ful implementation of these targets as part of
its and its Nomination and Compensation Committee’s normal operation.
According to the Articles of Association, a minimum of five and a maximum of ten ordinary members shall be appointed to the Board of Directors by the shareholders at the Annual General Meeting for a one-year period at a time. The number of consecutive terms is not limited. At present, the Board has nine members.
The Board appoints a Chairman and a Vice Chairman from among its members. The Annual General Meeting of 2017 appointed the following persons as members of the Board of Directors:
• Mr Kari Jordan, born 1956, Chairman, M.Sc. (Econ.), member since 2005, 1,033,147 B-shares
• Mr Martti Asunta, born 1955, Vice Chairman, independent of the Company, M.Sc. (For.), member since 2008, 60,450 B-shares
• Ms Kirsi Komi, born 1963, independent member, L.L.M., member since 2010, 64,064 B-shares
• Mr Kai Korhonen, born 1951, independ-ent member, M.Sc. (Eng.), eMBA, member since 2008, 200,834 B-shares
• Ms Liisa Leino, born 1960, independent member, M.Sc. (Nutrition), member since 2009, 168,709 B-shares
• Mr Jussi Linnaranta, born 1972, independ-ent of the Company, M.Sc. (Agr.), member since 2017, 5,239 B-shares
• Mr Juha Niemelä, born 1946, independent member, M.Sc. (Econ.), member since 2007, 162,709 B-shares
• Mr Veli Sundbäck, born 1946, independ-ent member, L.L.M., member since 2013, 53,729 B shares
• Mr Erkki Varis, born 1948, independent member, M.Sc. (Eng.), member since 2009, 117,301 B-shares
These ownerships include shares possibly owned by controlled entities.
A majority of the members of the Board of Directors are independent of both the Company and its significant shareholders. As
President and CEO of Metsä Group and as Board member of Metsäliitto Cooperative, Chairman Jordan is dependent on both the Company and its majority shareholder Metsäliitto Cooperative. Martti Asunta and Jussi Linnaranta are members of the Board of Metsäliitto Cooperative and consequently dependent on a significant shareholder. Juha Niemelä and Kai Korhonen have served on the Board for more than 10 consecutive years but are considered as independent of the Company and its significant shareholders, based on the Board’s general evaluation.
The Board’s Nomination and Compensation committee proposes to the Annual General Meeting convened for March 23, 2017 that all current Board members except Jordan and Varis be re-elected for a new term and that Mr Ilkka Hämälä and Mr Hannu Anttila be elected as new members. Mr Hämälä holds a M.Sc. (Eng.) degree and acts as the CEO of Metsäliitto Cooperative. Being CEO to Metsäliitto Cooperative Mr Hämälä is dependent on the Company and its significant shareholder. Mr Anttila holds a M.Sc. (Econ.) degree and has retired in the spring of 2017 from the position of Metsä Group’s EVP for strategy. Anttila has acted as the CEO of the Company in 2004–2005. Based on an overall evaluation, Anttila is inde-pendent of the Company but dependent on its significant shareholder for a fixed term of approximately two years. Further information on existing and proposed Board members is available on the Company’s website at (www.metsaboard.com> lnvestors > Corporate Governance).
BOARD COMMITTEES
Board committees provide assistance to the Board of Directors, preparing matters for which the Board is responsible. The Board of Directors appoints an Audit Committee and a Nomination and Compensation Committee from among its members. Every year after the Annual General Meeting, the Board of Directors appoints each committee’s chairman and members. The Board of Directors and
YEAR 2017
REPORT OF THE BOARD OF DIRECTORS
GROUP ACCOUNTS
SHARES AND SHAREHOLDERS
PARENT COMPANY ACCOUNTS
AUDITOR’S REPORT
GOVERNANCE KEY FIGURES
INVESTOR INFORMATION
CORPORATE GOVERNANCE STATEMENT | SALARY AND REMUNERATION REPORT | BOARD OF DIRECTORS | CORPORATE MANAGEMENT TEAM

CORPORATE GOVERNANCE STATEMENT – FINANCIAL STATEMENTS 2017 105
its committees can also seek assistance from external advisors.
Final decisions concerning matters related to the tasks of the committees are made by the Board of Directors on the basis of committee proposals, excluding proposals on Board com-position and compensation made directly to the General Meeting by the Nomination and Compensation Committee.
AUDIT COMMITTEE
The Audit Committee is responsible for assisting the Board of Directors in ensuring that the company’s financial reporting, calcu-lation methods, annual financial statements and other financial information made public by the Company are correct, balanced, trans-parent and clear. On a regular basis, the Audit Committee reviews the internal control and management systems and monitors the pro-gress of financial risk reporting and the audit-ing of the accounts. The Audit Committee assesses the efficiency and scope of internal auditing, the company’s risk management, key risk areas and compliance with applicable laws and regulations. The committee gives a recommendation to the Board concerning the appointment of auditors to the Company. The Audit Committee also processes the annual plan for internal auditing and the reports prepared on significant auditing.
The Audit Committee consists of four Board members who are independent of the Company and its significant shareholders. Since the Annual General Meeting of 2017, Kai Korhonen has been chairman of the Audit Committee with Kirsi Komi, Veli Sundbäck and Erkki Varis as members.
The committee members must have adequate expertise in accounting and financial statement policies. The Audit Committee convenes on a regular basis, at least four times a year, including meeting with the Company’s auditor. The committee chairman provides the Board with a report on each meeting of the Audit Committee. The tasks and respon-sibility areas have been specified in the com-mittee’s working order which the Board has
approved (www.metsaboard.com > lnvestors > Corporate Governance).
When necessary, the following persons are also represented in the Audit Committee meetings as summoned by the Committee: the auditor, Chief Executive Officer and Chief Financial Officer as well as other man-agement representatives and external advisors.
The Audit Committee convened four times during 2017 and the attendance rate of the members was 100 per cent (100 per cent also in 2016 and 2015).
NOMINATION AND COMPENSATION
COMMITTEE
The task of the Nomination and Compensation Committee is to assist the Board of Directors in matters related to the appointment and compensation of the company’s CEO, a possible Deputy CEO and the senior management and prepare matters related to the reward schemes for management and employees. In addition, the Committee prepares for the Annual General Meeting a proposal on the number of Board members, Board composition and Board member com-pensation. The Committee also recommends, prepares and proposes to the Board the CEO’s (and a Deputy CEO’s) nomination, salary and compensation, and further evaluates and provides the Board and the CEO with recom-mendations concerning management rewards and compensation systems.
The Committee consists of five Board members. It convenes on a regular basis at least four times a year. The Committee chairman presents the proposals issued by the Committee to the Board. The tasks and responsibilities of the Nomination and Compensation committee have been specified in the committee’s working order, which the Board approves (www.metsaboard.com > lnvestors > Corporate Governance).
Since the Annual General Meeting of 2017, Kari Jordan has been chairman of the Nomination and Compensation Committee with Martti Asunta, Liisa Leino, Jussi Linnaranta and Juha Niemelä as members.
The Nomination and Compensation Committee convened five times during 2017 and all members participated in all meetings (The attendance rate was 100 per cent also in 2016 and 2015).
CHIEF EXECUTIVE OFFICER
Chief Executive Officer Mika Joukio, M.Sc.(Eng.), born 1964, is responsible for the daily management of the Company’s admin-istration according to the guidelines and instructions given by the Board. In addition, the CEO is responsible for ensuring that the Company’s accounting has been carried out according to applicable laws and that asset management has been organised in a reliable manner. The CEO manages the Company’s daily business and is responsible for control-ling and steering the business areas.
The CEO has a written CEO contract approved by the Board. The Board moni-tors the CEO’s performance and provides a performance evaluation once a year. The CEO is covered by the Finnish Employees’ Pension Act, which provides for a pension compensation based on service years and earn-ings. Basic salary, rewards and fringe benefits are included in the calculation, but not stock option or share plan based income. The Company has commissioned an extra pension insurance policy for the CEO, entitling the CEO to retire at the age of 62. The policy entitles the CEO to receive pension compen-sation equal to 60 per cent of his salary at the time of retirement (calculated in accordance with Finnish pension laws) on the basis of a five-year-period preceding the moment of retirement.
The Board appoints and discharges the CEO. The Board can discharge the CEO without a specific reason. The CEO can also resign from his assignment. The mutual term of notice is six months. The Board may, how-ever, decide to discharge the CEO without a period of notice. When the service contract of the CEO is terminated by the Board, the CEO is entitled to receive discharge compen-sation equal to his 12-month salary.
YEAR 2017
REPORT OF THE BOARD OF DIRECTORS
GROUP ACCOUNTS
SHARES AND SHAREHOLDERS
PARENT COMPANY ACCOUNTS
AUDITOR’S REPORT
GOVERNANCE KEY FIGURES
INVESTOR INFORMATION
CORPORATE GOVERNANCE STATEMENT | SALARY AND REMUNERATION REPORT | BOARD OF DIRECTORS | CORPORATE MANAGEMENT TEAM

106 FINANCIAL STATEMENTS 2017 – CORPORATE GOVERNANCE STATEMENT
DEPUTY TO THE CEO
The Board can at its discretion appoint a Deputy to the CEO. The Deputy to the CEO is responsible for carrying out the CEO’s tasks when the CEO is unable to perform his duties. For the time being no Deputy to the CEO has been appointed.
CORPORATE MANAGEMENT TEAM
In the operative management of Metsä Board, the CEO is assisted by the Corporate Management Team, which consists of Mika Joukio, CEO, together with function heads Harri Pihlajaniemi (Production), Sari Pajari (Sales and Marketing), Jussi Noponen (Finance), Ari Kiviranta (Development) and Susanna Tainio (Human Resources) who are all reporting to the CEO.
Each Corporate Management Team member has a written employment or service contract, With the exception of the CEO members of the Corporate Management Team have no extraordinary pension arrangements which would deviate from applicable pension legislation. The term of notice of Corporate Management team members is six months.
The Corporate Management Team’s tasks and responsibilities include planning investments, specifying and preparing the Company’s strategic guidelines, allocating resources, controlling routine functions as well as preparing several matters to be reviewed by the Board. The Corporate Management Team convenes at the Chairman’s invitation once a month, as a rule, and also otherwise when necessary.
The Corporate Management Team mem-bers’ owned the Company’s shares at the end of the financial year 2017 were as follows:• Mika Joukio 261,884 B-shares• Ari Kiviranta 16,236 B-shares• Jussi Noponen 50,000 B-shares• Sari Pajari 45,740 B-shares• Harri Pihlajaniemi 0 shares• Susanna Tainio 20,505 shares
Possible controlled entities of management team members do not hold shares in the Company.
INTERNAL CONTROL, INTERNAL AUDITING
AND RISK MANAGEMENT
Profitable business requires that operations are monitored continuously and with adequate efficiency. Metsä Board’s internal management and control procedure is based on the Finnish Companies Act, regulations and recommen-dations for listed companies, the Articles of Association and the company’s own approved principles and policies. The functionality of the company’s internal control is evaluated by the company’s internal auditing. Internal control is carried out throughout the organi-sation. Internal control methods include internal guidelines and reporting systems. The following describes the principles, objectives and responsibilities of Metsä Board’s internal control, risk management and internal auditing.
INTERNAL CONTROL
Being a listed company, Metsä Board’s internal control is steered by the Finnish Companies Act and the Securities Market Act, other laws and regulations applicable to the opera-tions and the rules and recommendations of the Helsinki Stock Exchange, including the Corporate Governance Code. External control is carried out by Metsä Board’s auditor and the authorities.
In Metsä Board, internal control covers financial reporting and other monitoring. Internal control is implemented by the Board and operative management as well as the entire personnel. Internal control aims to ensure achieving the goals and objectives set for the company; economical, appropriate and efficient use of resources; correct and reliable financial information and other management information; adherence to external regulations and internal policies; security of operations, information and property in an adequate manner; and the arrangement of adequate and
suitable manual and IT systems to support operations.
Internal control is divided into (i) proac-tive control, such as the specification of cor-porate values, general operational and business principles; (ii) daily control, such as opera-tional systems and work instructions related to operational steering and monitoring; and (iii) subsequent control, such as management evaluations and inspections, comparisons and verifications with the aim of ensuring that the goals are met and that the agreed operational and control principles are followed. The cor-porate culture, governance and the approach to control together create the basis for the entire process of internal control.
MONITORING OF THE FINANCIAL REPORTING
PROCESS, CREDIT CONTROL AND
AUTHORISATION RIGHTS
The financial organisations of the functions and the central administration are responsible for financial reporting. The units and func-tions report the financial figures each month. The functions’ control functions check their units’ monthly performance and report them further to central administration. Functions’ profitability development and business risks and opportunities are discussed in monthly meetings attended by senior management of the Company and of the function in ques-tion. The result will be reported to the Board and the Corporate Management Team each month. The Board presents the Financial Statements to the Annual General Meeting for approval, approves the financial statement bulletin and quarterly reports and decides on their publication. The Company’s internal guidelines provide detailed descriptions on the reporting and control rules and the report-ing procedure.
Credit control in Metsä Board has been centralised under a Credit Committee, which convenes at least each quarter. The develop-ment of trade receivables is monitored in each sales company by credit controllers under the supervision of the Group VP of Credits. Counterparty-specific credit limits are set
YEAR 2017
REPORT OF THE BOARD OF DIRECTORS
GROUP ACCOUNTS
SHARES AND SHAREHOLDERS
PARENT COMPANY ACCOUNTS
AUDITOR’S REPORT
GOVERNANCE KEY FIGURES
INVESTOR INFORMATION
CORPORATE GOVERNANCE STATEMENT | SALARY AND REMUNERATION REPORT | BOARD OF DIRECTORS | CORPORATE MANAGEMENT TEAM
CORPORATE GOVERNANCE STATEMENT – FINANCIAL STATEMENTS 2017 107
within the boundaries of the credit policy confirmed by the Board in cooperation with centralised credit control and business area management. The development of credit risks is reported to the Board on a regular basis.
Authorisation rights concerning expenses, significant contracts and investments have been specified continuously for different organisation levels according to the decision-making authority policy confirmed by the Board and the authority separately granted by the CEO and other management personnel. Investment follow-up is carried out by the Group’s financial administration according to the investment policy confirmed by the Board. After pre-approval, investments are taken to the management teams of the business areas and the Corporate Management Team within the framework of the annual investment plan. Most significant investments are separately submitted for Board approval. Investment follow-up reports are compiled each quarter.
INTERNAL AUDITING
Internal auditing assists the Board and CEO with their control tasks by evaluating the qual-ity of internal control maintained in order to achieve the Company’s objectives. In addition, internal auditing supports the organisation by evaluating and ensuring the functionality of business processes, risk management and the management and administration systems.
The key task of internal auditing is to assess the efficiency and suitability of internal control concerning the company’s functions and units. In its assignment, internal auditing evaluates how well the operational principles, guidelines and reporting systems are adhered to, how property is protected and how effi-ciently resources are used. Internal auditing also acts as an expert in development projects related to its task area and prepares special reports at the request of the Audit Committee or operative management.
Internal auditing operates under the supervision of the Audit Committee and the CEO. Audit observations, recommendations and the progress of measures are reported
to the management of the target audited, the company management and the auditor. Every six months, internal auditing reports its auditing measures, plans and operations to the Audit Committee. Internal auditing applies in its tasks a working order approved by the Board of Directors.
The action plan of internal auditing is prepared for one calendar year at a time. The aim is to allocate the auditing to all functions and units at certain intervals. Auditing is annually allocated to areas that are in a key position regarding the evaluated risk and the company’s objectives at the time. The topical-ity and appropriateness of the action plan are processed with the Company’s management every six months.
The scope and coordination of the audit-ing operations are ensured through regular communication and information exchange with other internal assurance functions and the auditor. When necessary, internal auditing uses external service providers for temporary additional resourcing or special expertise for carrying out demanding evaluation tasks.
RISK MANAGEMENT
Risk management is an essential part of Metsä Board’s standard business planning and leadership. Risk management belongs to daily decision-making, operations follow-up and internal control, and it promotes and ensures that the objectives set by the Company are met.
Linking business management efficiently with risk management is based on the opera-tional principles confirmed by the Board; the aim of the principles is to maintain risk management as a process that is well defined, understandable and sufficiently practical. Risks and their development are reported on a regular basis to the Board’s Audit Committee. Centralised risk management also takes care of the coordination and competitive bidding of Metsä Board’s insurance coverage.
The most crucial objective of risk manage-ment is to identify and evaluate those risks, threats and opportunities which may have an
impact on the implementation of the strategy and on how short-term and long-term objec-tives are met. A separate risk review is also included in the most significant investment proposals. The businesses regularly evaluate and monitor the risk environment and related changes as part of their normal operational planning. The risks identified and their control is reported to the company’s manage-ment, Audit Committee and the Board at least twice a year. Business risks also involve opportunities, and they can be utilised within the boundaries of the agreed risk limits. Conscious risk-taking decisions must always be based on an adequate evaluation of the risk-bearing capacity and the profit/loss potential, among other things.
Risk management responsibilities in Metsä Board are divided among different functions. The Board is responsible for the Company’s risk management and approves the Company’s risk management policy; the Audit Committee evaluates the levels and proce-dures of the Company’s risk management and the essential risk areas and provides the Board with related proposals. The CEO and the Management Team are responsible for the specification and adoption of the risk manage-ment principles. They are also responsible for ensuring that the risks are taken into account in the company’s planning processes and that risk reporting is adequate and appropriate. The Vice President of Risk Management reports to the CFO and is responsible for the Company’s risk management process develop-ment, coordination, the implementation of risk evaluation and the essential insurance decisions. Businesses and support functions identify and evaluate the essential risks related to their own areas of responsibility in their planning processes, prepare for them, take necessary preventive action and report on the risks as agreed.
Metsä Board’s essential risk management elements include implementing a comprehen-sive corporate risk management process that supports the entire business, protecting prop-erty and ensuring business continuity, corpo-rate security and its continuous development,
YEAR 2017
REPORT OF THE BOARD OF DIRECTORS
GROUP ACCOUNTS
SHARES AND SHAREHOLDERS
PARENT COMPANY ACCOUNTS
AUDITOR’S REPORT
GOVERNANCE KEY FIGURES
INVESTOR INFORMATION
CORPORATE GOVERNANCE STATEMENT | SALARY AND REMUNERATION REPORT | BOARD OF DIRECTORS | CORPORATE MANAGEMENT TEAM
108 FINANCIAL STATEMENTS 2017 – CORPORATE GOVERNANCE STATEMENT
as well as crisis management and continuity and recovery plans. According to the risk management policy and principles, adequate risk management forms a necessary part of the preliminary review and implementation stages of projects which are financially or otherwise significant.
The tasks of Metsä Board’s risk manage-ment are to• ensure that all identified risks with an
impact on personnel, customers, products, property, information assets, corporate image, corporate responsibility and opera-tional capacity are controlled according to applicable laws and on the basis of best available information and financial aspects
• ensure that the company’s objectives are met
• fulfil the expectations of stakeholders• protect property and ensure disruption-
free business continuity• optimise the profit/loss possibility ratio• ensure the management of the company’s
overall risk exposure and minimise the overall risks.
The most significant risks and uncertainties that the company is aware of are described in the Report of the Board of Directors.
AUDITING
According to Metsä Board’s Articles of Association, the company has one auditor who shall be an auditing firm authorised by the Central Chamber of Commerce of Finland. The General Meeting appoints the auditor each year. The Audit Committee together with the Audit Committee of the parent entity Metsäliitto Cooperative arranged in 2011 a tender for the audit-ing services. As a result of the tender-ing, the Company’s long-term auditor Pricewaterhouse Coopers Oy was changed to KPMG Oy Ab. Pursuant to the decision of the Annual General Meeting of 2017, KPMG Oy Ab acts as the Company’s auditor and has appointed Raija-Leena Hankonen, APA, as the auditor with main responsibility. The Audit committee controls the appoint-ment procedure of the auditors and provides the Board and the General Meeting with a recommendation for the appointment of the auditor.
In 2017, KPMG Oy Ab received EUR 240,258 (EUR 227,242 in 2016 and EUR 229,742 in 2015) in auditing compensation, KPMG internationally received altogether EUR 401,359 (EUR 425 333 in 2016 and EUR 407,883 in 2015) and other auditing firms outside Finland were paid EUR 36,844 (EUR 15,150 in 2016 and EUR 42,321 in 2015). In addition, KPMG has received EUR 22,449 (EUR 3,864 in 2016 and EUR 10,554 in 2015) for services not related to the actual auditing of the accounts.
INSIDER ADMINISTRATION
Metsä Board group complies in insider matters with Finnish laws, namely the Securities Markets Act, Regulation N:o 596/2014 by the European Parliament and the Commission on market abuse (MAR) and supporting orders and regulations as well as the insider guidelines of NASDAQ Helsinki Ltd. (Helsinki Stock Exchange) (business.nas-daq.com/Docs/Nasdaq-Helsinki-Guidelines-for-Insiders_EN.pdf ). The Board has based on the above rules approved the Company’s own insider guidelines.
Pursuant to MAR Article 14 and Chapter 51 of the Penal Code, a person who possesses inside information shall not (i) engage or attempt to engage in insider dealing by acquir-ing or transferring financial instruments in his own name or on behalf of a third party, (ii) recommend that another person engage in insider dealing or induce another person to engage in insider dealing, (iii) unlawfully disclose inside information to another person, unless such disclosure is made as part of car-rying out normal work duties. The purpose of insider management is to enable a transparent ownership of the Company’s securities by the Company’s insiders, while simultaneously maintaining public trust in the trading with the Company’s securities and their price formation.
Following the MAR becoming effective on 3 July 2016, the Company no longer has a register of public insiders and the Company no longer maintains a permanent company-specific insider register. The Company shall, when required and by decision of the Chairman of the Board of Directors, set up a project-specific insider register to cover all persons who are involved in the prepara-
tion of a specific project containing insider information.
The Company’s managers with a duty to notify include members of the Board of Directors and the CEO. The holdings of such managers and their related parties is public. Each of them have an individual duty vis-à-vis the Company and the competent supervisory authority to notify all transactions executed with the shares and other financial instruments of Metsä Board. Metsä Board will publish all such notifications by means of a stock exchange release.
Trading in the Company’s shares and other financial instruments is prohibited during a period starting at the end of each reporting period and lasting until the results release has been published (always at minimum 30 days; “closed window”). This prohibition applies not only to managers with a duty to notify but also to such other persons specified by the Company who participate in the preparation of financial reports.
RELATED PARTY TRANSACTIONS
The Company’s business activities include contractual relationships with the parent entity Metsäliitto Cooperative and affili-ated companies Metsä Fibre Oy and Metsä Tissue Oyj. In situations where the Board of Directors addresses a business relationship or other contractual relationship or connection to Metsäliitto Cooperative or the Company’s affiliated companies, the Board of Directors shall, if necessary, act without those of its members who are dependent on Metsäliitto Cooperative or the relevant affiliated company.
To assess the independence and impartial-ity of the members of the Board of Directors, the members shall notify the Company of circumstances that may have an impact on the member’s ability to act without conflict of interest.
On 31 December 2017, neither the Board members, nor the Company’s CEO or the Corporate Management Team members had monetary loans from the Company or its subsidiaries. No security arrangements or significant business relations existed between these persons (including their related parties as defined in IFRS) and the Company during 2017.
YEAR 2017
REPORT OF THE BOARD OF DIRECTORS
GROUP ACCOUNTS
SHARES AND SHAREHOLDERS
PARENT COMPANY ACCOUNTS
AUDITOR’S REPORT
GOVERNANCE KEY FIGURES
INVESTOR INFORMATION
CORPORATE GOVERNANCE STATEMENT | SALARY AND REMUNERATION REPORT | BOARD OF DIRECTORS | CORPORATE MANAGEMENT TEAM

SALARY AND REMUNERATION REPORT – FINANCIAL STATEMENTS 2017 109
SALARY AND REMUNERATION REPORT
SALARY AND REMUNERATION REPORT
This salary and remuneration report of Metsä Board Corporation (Metsä Board or the Company) has been issued pursuant to recommendations concerning reporting of the Finnish Corporate Governance Code 2015. The description on remuneration principles and decision-making is updated on a regular basis, two times every calendar year as a start-ing point, however, always in connection with the annual Corporate Governance Statement. A report regarding the fees paid out during the previous financial year is also published concurrently.
DECISION-MAKING ORDER AND PRINCIPLES
OF REMUNERATION
GENERAL
The purpose of the management’s compensa-tion system is to compensate management in a fair and competitive way for a successful and profitable implementation of the Company’s strategy. The objective of remuneration is also to encourage management in the development of the Company’s strategy and business and to thereby act for the benefit the Company in the long run. The Board approves the forms and basis of compensation and incentive systems as well as the measures and targets applied. The Board’s Nomination and Compensation Committee assists the Board in matters relating to management remuneration, conditions of employment and engagement of management members as well as prepares Board decisions relating to management remuneration.
The Company currently uses a short-term bonus scheme for management and personnel as well as a long-term share based compensation scheme for management and key employees.
BOARD OF DIRECTORS
The Annual General Meeting of the Company decides on the remuneration of the Board of Directors. The Nomination and Compensation Committee presents the General Meeting with proposals for remu-neration of the Board of Directors, taking into account the Company’s financial standing at
a given time and, among other things, remu-neration guidelines in other comparable com-panies. The Committee consults, if necessary, the majority shareholder, who has the decisive vote at the General Meeting as regards Board remuneration.
CHIEF EXECUTIVE OFFICER
The Board of Directors in turn appoints and discharges the CEO and approves his salary and compensation. The Board can discharge the CEO without a specific reason. The CEO can also resign from his assignment. The mutual term of notice is six months. The Board may, however, decide to discharge the CEO without a period of notice. When the service contract of the CEO is terminated by the Board, the CEO is entitled to receive dis-charge compensation equal to his 12-month salary. The Board may, in accordance with the CEO’s service contract, decide that the CEO annually receives bonus pay based on his overall performance and corresponding to a maximum of his seven (7) month salary.
The CEO is covered by the Finnish Employees’ Pension Act, which provides for a pension compensation based on service years and earnings. Basic salary, rewards and fringe benefits are included in the calculation, but not stock option or share plan based income. The Company has commissioned an extra pension insurance policy for the CEO, entitling the CEO to retire at the age of 62. The policy entitles the CEO to receive pen-sion compensation equal to 60 per cent of his salary at the time of retirement (calculated in accordance with Finnish pension laws) on the basis of a five-year-period preceding the moment of retirement.
CORPORATE MANAGEMENT TEAM
The CEO decides on the compensation of other Corporate Management Team members in cooperation with the Board Chairman and in accordance with the principles approved and guidelines given by the Board.
Also other Corporate Management Team members have written employment contracts. The period of notice of Corporate Management Team members is six months. Termination of employment without
cause entitles members of the Corporate Management Team (excluding the Vice President for HR) to receive discharge com-pensation equal to their 6 to 12-month salary.
Excluding the CEO, Corporate Management Team members have no extraor-dinary pension arrangements which would deviate from applicable pension legislation. The members are covered by the Finnish Employees’ Pension Act, which provides for a pension compensation based on service years and earnings. Basic salary, rewards and fringe benefits are included in the calculation, but not stock option or share plan based income.
LONG-TERM SHARE INCENTIVE SCHEME
The Board decided in December 2013 to continue the share-based incentive scheme for management. The plan consists of three new three-year earnings periods, namely calendar years 2014–2016, 2015–2017 and 2016–2018. The aim of the plan is to combine the objectives of shareholders and executives in order to increase the value of the company, to commit the executives to perform the mutual strategy, and to offer them a competitive reward plan based on share ownership. At the beginning of each period, the Board of Directors decided on the earnings criteria and defined performance targets. The potential reward from the plan for each of the earn-ings periods is based partly on Metsä Board Group’s equity ratio at the end of the period as well as the development of return on capital employed (ROCE) and operating results (EBIT) and partly based on corresponding indicators for Metsä Group, as determined by the Board for each earnings period. An earnings period is followed by a two-year restriction period during which a participant is not entitled to transfer or dispose of the shares. In case the Company or a participant terminates the employment or service contract during the restriction period, the Board may require the participant to return the shares already earned.
The potential reward for the earnings period 2016–2018 will be paid in 2019 and entitled at the start of the period the payment of a maximum of 243,750 B-shares. On top the Company pays in money an amount covering the applicable withholding tax and
YEAR 2017
REPORT OF THE BOARD OF DIRECTORS
GROUP ACCOUNTS
SHARES AND SHAREHOLDERS
PARENT COMPANY ACCOUNTS
AUDITOR’S REPORT
GOVERNANCE KEY FIGURES
INVESTOR INFORMATION
CORPORATE GOVERNANCE STATEMENT | SALARY AND REMUNERATION REPORT | BOARD OF DIRECTORS | CORPORATE MANAGEMENT TEAM
110 FINANCIAL STATEMENTS 2017 – SALARY AND REMUNERATION REPORT
related payments. The amount of the annu-ally payable reward may be limited. Rewards earned for the earnings periods 2014–2016 and 2015–2017 have been described below under “Remuneration Report 2017”.
The Board decided in January 2017 to further continue the share-based incentive scheme for management. The plan consists of three additional three-year earnings periods, namely calendar years 2017–2019, 2018–2020 and 2019–2021. At the beginning of each period, the Board of Directors decides on the earnings criteria and defines performance targets. The potential reward from the plan for the earnings period 2017–2019 is based 50 per cent on the development of Metsä Board Group’s return on capital employed (ROCE) and 50 per cent on the correspond-ing indicator for Metsä Group, as determined by the Board.
The Board further has the right to limit rewards from the system, in whole or in part, if defined earnings or equity ratio criteria are not met. If the reward together with the short term bonus (2018–2019) or the reward only (2018–2020) would exceed the participant’s annual salary (or in the case of the CEO his annual salary multiplied by two), the exceed-ing part is not paid. An earnings period is followed by a two-year restriction period during which a participant is not entitled to transfer or dispose of the shares. In case the Company or a participant terminates the employment or service contract during the restriction period, the Board may require the participant to return the share reward already earned. The potential reward for the earnings period 2017–2019 is paid in the spring of 2020 in Metsä Board Corporation’s B-shares. Correspondingly the potential reward for the earnings period 2018–2020 is paid in the spring of 2021 in Metsä Board Corporation’s B-shares.
The target group of the plan for the performance period 2017–2019 consisted in December 2017 of 21 participants, including
the members of the Corporate Management Team as well as key individuals in sales, production and corporate administration. Changes in participants during the earnings period such as changes in Corporate manage-ment Team members in January 2015 and September 2017 have an effect on the maxi-mum amount. The rewards to be paid on the basis of the plan for the performance period 2017–2019 will amount to a maximum of 263,750 B shares. In addition, a cash propor-tion is included in the reward to cover taxes and tax-related costs arising from the reward.
REMUNERATION REPORT 2017
BOARD OF DIRECTORS
The Annual General Meeting held in March 2017 resolved to increase the Board’s annual remuneration such that the Chairman received an annual remuneration of EUR 95,000, the Vice Chairman EUR 80,000 and members EUR 62,500. One half of the remuneration was decided to be paid in cash while the other half was to be paid in the Company’s B-series shares acquired from the stock exchange between 1 and 30 April 2017. As a result, the Chairman received 7,964, the Vice Chairman 6,706 and each Board member 5,239 B-series shares at EUR 5.96 per share. The Board members are not allowed to transfer these shares within a period of two years from the grant date. The amount of the cash consideration corresponds to the estimated withholding tax. In addition, the Annual General Meeting resolved to pay to the members a remuneration of EUR 700 per each attended Board and committee meeting. Travel expenses of the Board are compensated in accordance with the Company’s travel policy. Further, the Annual General Meeting decided that an additional monthly compen-sation of EUR 800 be paid to the Chairman of the Audit Committee.
The Nomination and Compensation Committee of the Board of Directors pro-poses to the 2018 Annual General Meeting that the remuneration for the members of the Board of Directors be kept unchanged. The Committee additionally proposes that one half of the annual remuneration be paid in the company’s B-class shares to be acquired from public trading between 1 and 30 April 2018 and that the transfer of these shares would be restricted for a period of two years from the grant date. The Committee finally proposes that an additional monthly remuneration of EUR 800 be paid to the Audit Committee Chairman also going forward. The Board’s annual remuneration has been paid in shares and cash since 2009.
CHIEF EXECUTIVE OFFICER
The monthly salary of CEO Mika Joukio is EUR 40,211. The salary includes car and mobile phone benefits and an extended travel and accident insurance policy. In 2017 the CEO Joukio received a total of: • EUR 1,339,476 in salary, bonuses and
other benefits, including share incen-tive (EUR 1,173,860 in 2016 and EUR 693,140 in 2015), of which
• EUR 506,662 (EUR 498,301 in 2016 and EUR 469,711 in 2015) was fixed compen-sation and
• EUR 25,199 (EUR 229,849 in 2016 and EUR 165,319 in 2015) was short-term bonus pay and
• EUR 807,615 (EUR 445,711 in 2016 and EUR 58,109 in 2015) share incentives and related cash compensation. In addition, the payment of a total of EUR 398,125 of the share reward for the earnings period 2014–2016 was postponed for later pay-ment in accordance with the system rules.
The bonus pay is determined by the Board and was in 2015–2017 based on the Company’s EBIT and cash flow, Metsä
YEAR 2017
REPORT OF THE BOARD OF DIRECTORS
GROUP ACCOUNTS
SHARES AND SHAREHOLDERS
PARENT COMPANY ACCOUNTS
AUDITOR’S REPORT
GOVERNANCE KEY FIGURES
INVESTOR INFORMATION
CORPORATE GOVERNANCE STATEMENT | SALARY AND REMUNERATION REPORT | BOARD OF DIRECTORS | CORPORATE MANAGEMENT TEAM
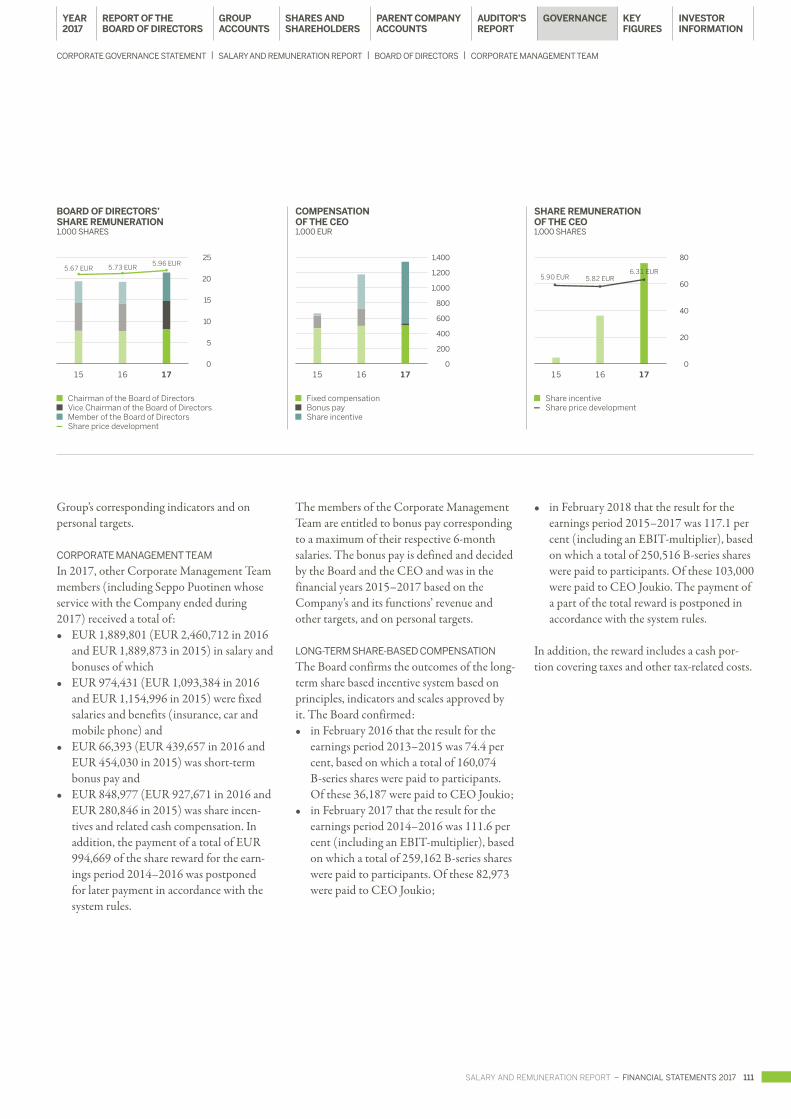
SALARY AND REMUNERATION REPORT – FINANCIAL STATEMENTS 2017 111
Group’s corresponding indicators and on personal targets.
CORPORATE MANAGEMENT TEAM
In 2017, other Corporate Management Team members (including Seppo Puotinen whose service with the Company ended during 2017) received a total of: • EUR 1,889,801 (EUR 2,460,712 in 2016
and EUR 1,889,873 in 2015) in salary and bonuses of which
• EUR 974,431 (EUR 1,093,384 in 2016 and EUR 1,154,996 in 2015) were fixed salaries and benefits (insurance, car and mobile phone) and
• EUR 66,393 (EUR 439,657 in 2016 and EUR 454,030 in 2015) was short-term bonus pay and
• EUR 848,977 (EUR 927,671 in 2016 and EUR 280,846 in 2015) was share incen-tives and related cash compensation. In addition, the payment of a total of EUR 994,669 of the share reward for the earn-ings period 2014–2016 was postponed for later payment in accordance with the system rules.
The members of the Corporate Management Team are entitled to bonus pay corresponding to a maximum of their respective 6-month salaries. The bonus pay is defined and decided by the Board and the CEO and was in the financial years 2015–2017 based on the Company’s and its functions’ revenue and other targets, and on personal targets.
LONG-TERM SHARE-BASED COMPENSATION
The Board confirms the outcomes of the long-term share based incentive system based on principles, indicators and scales approved by it. The Board confirmed: • in February 2016 that the result for the
earnings period 2013–2015 was 74.4 per cent, based on which a total of 160,074 B-series shares were paid to participants. Of these 36,187 were paid to CEO Joukio;
• in February 2017 that the result for the earnings period 2014–2016 was 111.6 per cent (including an EBIT-multiplier), based on which a total of 259,162 B-series shares were paid to participants. Of these 82,973 were paid to CEO Joukio;
• in February 2018 that the result for the earnings period 2015–2017 was 117.1 per cent (including an EBIT-multiplier), based on which a total of 250,516 B-series shares were paid to participants. Of these 103,000 were paid to CEO Joukio. The payment of a part of the total reward is postponed in accordance with the system rules.
In addition, the reward includes a cash por-tion covering taxes and other tax-related costs.
25
20
15
10
5
0
1,400
1,200
1,000
800
600
400
200
0
80
60
40
20
0
SHARE REMUNERATION OF THE CEO1,000 SHARES
15 16 17
Share incentive Share price development
COMPENSATION OF THE CEO1,000 EUR
15 16 17
Fixed compensation Bonus pay Share incentive
5.90 EUR 5.82 EUR6.31 EUR
BOARD OF DIRECTORS’ SHARE REMUNERATION1,000 SHARES
15 16 17
Chairman of the Board of Directors Vice Chairman of the Board of Directors Member of the Board of Directors Share price development
5.67 EUR 5.73 EUR5.96 EUR
YEAR 2017
REPORT OF THE BOARD OF DIRECTORS
GROUP ACCOUNTS
SHARES AND SHAREHOLDERS
PARENT COMPANY ACCOUNTS
AUDITOR’S REPORT
GOVERNANCE KEY FIGURES
INVESTOR INFORMATION
CORPORATE GOVERNANCE STATEMENT | SALARY AND REMUNERATION REPORT | BOARD OF DIRECTORS | CORPORATE MANAGEMENT TEAM

KARI JORDANb. 1956M.Sc. (Econ)Vuorineuvos (Finnish honorary title)
MARTTI ASUNTAb. 1955M.Sc. (Forestry)Metsäneuvos (Finnish honorary title)
LIISA LEINOb. 1960M.Sc. (Nutrition)Teollisuusneuvos (Finnish honorary title)
KIRSI KOMIb. 1963LL.M., Master of Laws
KAI KORHONENb. 1951M.Sc. (Eng), eMBA
112 FINANCIAL STATEMENTS 2017 – METSÄ BOARD CORPORATION’S BOARD OF DIRECTORS
METSÄ BOARD CORPORATION’S BOARD OF DIRECTORS
Chairman of the Board since 2005
Not independent of the company’s significant shareholder
Primary working experience:Metsä Group, President and CEO (2006–31 March 2018)Metsäliitto Cooperative, CEO (2004–2017), vice chairman of the Board (2005–)
Other positions of trust:Metsä Fibre Oy, member of the Board (2004–), chairman of the Board (2006–2017)Metsä Tissue Corporation, member of the Board (2004–)chairman of the Board (2004–2017)Central Chamber of Commerce, member of the Board (2007–2011), chairman of the Board (2012–2016)Confederation of Finnish Industries (EK), member of the Board (2005–2016), vice chairman of the Board (2009–2011 and 2013–2014), member of the Board’s Working Committee (2015–2016)Finnish Forest Industries Federation, chairman of the Board and the Board’s Working Committee (2009–2011), vice chairman of the Board and the Board’s Working Committee (2005–2008 and 2014–2017), member of the Board (2012–2013)Varma Mutual Pension Insurance Company, member of the Supervisory Board (2006–2012), vice chairman of the Board (2013), chairman of the Board (2014), chairman of the Supervisory Board (2015–)Holds several positions of trust in foundations and non-profit associations.
Shares owned in Metsä Board Corporation 31 Dec 2017: 1,033,147 B shares
Member and vice chairman of the Board since 2008
Not independent of the company’s significant shareholder
Primary working experience:Huoneistokeskus Oy, Branch Manager (2003–2005) Municipality of Kuru, Project Manager (2001–2003)Kiinteistötoimisto Martti Asunta LKV, Entrepreneur (1995–2015)Suomen Yhdyspankki, Bank Manager (1993–1995) Tampere Regional Savings Bank (SSP), Area Manager (1988–1993)Federation of Forest Management Associations in Pohjois-Häme, Field Manager, Executive Manager (1982–1988)
Other positions of trust:Metsäliitto Cooperative, chairman of the Board (2008–)Metsä Fibre Oy, member of the Board (2008–)Metsä Tissue Corporation, member of the Board (2008–)Pellervo-Seura, member of the Board (2008–2017), chairman of the Board (2010–2017)Pellervo-Media Oy, chairman of the Board (2013–2017)Finnish Agri-Agency for Food and Forest Development, member of the Board (2012–2018)Cooperative Council of Finland, chairman (2013–)
Shares owned in Metsä Board Corporation 31 Dec 2017: 60,450 B shares
Member of the Board since 2010
Independent of the company and of its significant shareholders
Primary working experience:Nokia Siemens Networks, General Counsel, member of the Executive Board (2007–2010)Nokia Corporation, Vice President, Legal, Networks Business Group Leadership Team (1999–2007)Nokia Corporation, Legal Counsel (1992–1999)
Other positions of trust:Humana AB, member of the Board (2017–)Lindström Invest Oy, member of the Board (2017–)The Finnish National Theatre, member of the Board (2017–) Veikkaus Oy, chairman of the Board (2016)Bittium Oyj, member of the Board (2015–)Martela Corporation, member of the Board (2013–)Finnvera Oyj, member of the Board (2013–)Patria Plc, vice chairman of the Board (2011–2016)Citycon Oyj, member of the Board (2011–)Docrates Oy, chairman of the Board (2011–)Finnish Red Cross Blood Service, member of the Board (2010–), chairman of the Board (2011–)
Shares owned in Metsä Board Corporation 31 Dec 2017: 64,064 B shares
Member of the Board since 2008
Independent of the company and of its significant shareholders
Primary working experience:Stora Enso Oyj, Senior Executive Vice President (1998–2007)
Other positions of trust:Ilmarinen Mutual Pension Insurance Company, member of the Supervisory Board (2006–2008)Finnish Forest Industries Federation, vice chairman of the Board (2006–2007)American Forest & Paper Association, member of the Board (2000–2003)German Pulp and Paper Association, member of the Board (1995–2000)
Shares owned in Metsä Board Corporation 31 Dec 2017: 200,834 B shares
Member of the Board since 2009
Independent of the company and of its significant shareholders
Primary working experience:Leino Group Ltd., full-time chairman of the Board (2006–), CEO (2011–)
Other positions of trust:Elomatic Oy, member of the Board (2011–)Cadmatic Oy, member of the Board (2015–)Yrityssalo Oy, vice chairman of the Board (2017–)Varma Mutual Pension Insurance Company, deputy member of the Board (2011–)The Federation of Finnish Technology Industries, member of the Board (2011–2016)Finnish Business and Policy Forum (EVA), member of the Supervisory Board (2010–2016)Confederation of Finnish Industries (EK), member of the Board (2011–2012)Rautaruukki Corporation, member of the Board (2007–2014)Alko Oy, member of the Board (2009–2011)
Shares owned in Metsä Board Corporation 31 Dec 2017: 168,709 B shares
YEAR 2017
REPORT OF THE BOARD OF DIRECTORS
GROUP ACCOUNTS
SHARES AND SHAREHOLDERS
PARENT COMPANY ACCOUNTS
AUDITOR’S REPORT
GOVERNANCE KEY FIGURES
INVESTOR INFORMATION
CORPORATE GOVERNANCE STATEMENT | SALARY AND REMUNERATION REPORT | BOARD OF DIRECTORS | CORPORATE MANAGEMENT TEAM

JUSSI LINNARANTAb. 1972M.Sc (Agriculture and Forestry)Agronomist
JUHA NIEMELÄb. 1946M.Sc. (Econ)Doctor of Sciences in Economics and Technology h.c.Vuorineuvos (Finnish honorary title)
VELI SUNDBÄCKb. 1946LL.M., Master of LawsAmbassador
ERKKI VARISb. 1948M.Sc. (Eng)
METSÄ BOARD CORPORATION’S BOARD OF DIRECTORS – FINANCIAL STATEMENTS 2017 113
Member of the Board since 2017
Not independent of the company’s significant shareholder
Primary working experience:Agricultural entrepreneur (2001–)Thermal entrepreneur (2003–)Ministry of Agriculture and Forestry, Information and Research Centre, various positions (1997–2007)
Other positions of trust:Metsäliitto Cooperative, member of the Board (2017–)Pohjois-Savo Cooperative bank, member of the Representative Council (2014–2017)Metsäliitto Cooperative, member of the Supervisory Board (2004–2016)The Central Union of Agricultural Producers and Forest Owners (MTK), member of the Energy Committee (2007–2008 and 2014–2016)Kalakukko 2006 ry, member of the LEADER Operational Committee and the Board (2001–2006)
Shares owned in Metsä Board Corporation 31 Dec2017: 5,239 B shares
Member of the Board since 2007
Independent of the company and of its significant shareholders
Primary working experience:UPM-Kymmene Corporation, CEO (1996–2004)
Other positions of trust:MeritaNordbanken Plc, member of the Board (1998–1999)Veikkaus Oy, chairman of the Board (2001–2011)Powerflute Oyj, member of the Board (2005–2013)Green Resources AS, member of the Board and chairman of the Board (2009–2015)
Shares owned in Metsä Board Corporation 31 Dec 2017: 162,709 B shares
Member of the Board since 2013
Independent of the company and of its significant shareholders
Primary working experience:Nokia Corporation, member of the Executive Board, Executive Vice President, Corporate Relations and Responsibility (1996–2008)Ministry for Foreign Affairs, Secretary of State (1993–1996), various positions in the Ministry for Foreign Affairs, diplomatic offices in Brussels and Geneva (1969–1993)
Other positions of trust:Vaaka Partners, chairman of the Board (2010–)IYF, member of the Board (2009–2014)Finnair Plc, member of the Board (2004–2012), vice chairman of the Board (2010–2012)Huhtamäki Oyj, chairman of the Board (1999–2005)Confederation of Finnish Industries (EK), member of the Board (2004–2008)The Federation of Finnish Technology Industries, member and vice chairman of the Board (2004–2007)
Shares owned in Metsä Board Corporation 31 Dec 2017: 53,729 B shares
Member of the Board since 2009
Independent of the company and of its significant shareholders
Primary working experience:Oy Metsä-Botnia Ab, President and CEO (1997–2008)Metsäliitto Group, member of the Executive Management Team (2002–2008)Oy Metsä-Rauma Ab, Managing Director (1994–1996)Oy Metsä-Botnia Ab, Deputy to CEO (1990–1994)
Other positions of trust:Pohjolan Voima Oy, member of the Board (2000–2009)Botnia SA (Uruguay), chairman of the Board (2005–2008)Laatukeskus Excellence Finland Oy, chairman of the Board (2003–2006)Keskinäinen Eläkevakuutusyhtiö Ilmarinen, member of the Supervisory Board (1997–2008)Sunila Oy, member of the Board (1997–2004)
Shares owned in Metsä Board Corporation 31 Dec 2017: 117,301 B shares
YEAR 2017
REPORT OF THE BOARD OF DIRECTORS
GROUP ACCOUNTS
SHARES AND SHAREHOLDERS
PARENT COMPANY ACCOUNTS
AUDITOR’S REPORT
GOVERNANCE KEY FIGURES
INVESTOR INFORMATION
CORPORATE GOVERNANCE STATEMENT | SALARY AND REMUNERATION REPORT | BOARD OF DIRECTORS | CORPORATE MANAGEMENT TEAM

114 FINANCIAL STATEMENTS 2017 – METSÄ BOARD CORPORATION’S CORPORATE MANAGEMENT TEAM
METSÄ BOARD CORPORATION’S CORPORATE MANAGEMENT TEAM
Metsä Group employee since 1990. Chairman of Metsä Board Corporate Management Team since 2014.
Main positions:Metsä Tissue Corporation, CEO (2012–2014)Metsä Board Corporation, Head of Consumer Packaging (2006–2012) Metsä Board Corporation, Vice President and Mill Manager, Metsä Board Kyro and Metsä Board Tako (2006) Metsä Board Corporation, Vice President and Mill Manager, Metsä Board Kyro (2005–2006) Metsä Board Corporation, Senior Vice President, Corporate Logistics and Supply Chain (2004–2005) Metsä Board Corporation, Vice President and Mill Manager, Metsä Board Äänekoski (2001–2004) Various management positions in Metsä Board Corporation since 1990. Shares owned in Metsä Board Corporation 31 Dec 2017: 261,884 B shares
Metsä Group employee since 2000. Member of Metsä Board Corporate Management Team since 2016.
Main positions:Metsä Group, Senior Vice President, Group Finance (2009–2016)Metsä Board Corporation, Senior Vice President, Business Control, Graphic Papers (2008)Metsä Board Corporation, Vice President, Group Business Control (2006–2008)Metsä Board Corporation, Business Controller, Folding Cartons (2003–2006)Nokia Corporation (1999–2000) and Metsä Group (2000–2003), SAP system implementation projects in finance
Shares owned in Metsä Board Corporation 31 Dec 2017: 50,000 B shares
Metsä Group employee since 1993. Member of Metsä Board Corporate Management Team since 2014.
Main positions:Metsä Board Corporation, Senior Vice President, Production and Technology (2015–2017)Metsä Board Corporation, Senior Vice President, Head of Cartonboard business area (2014)Metsä Board Zanders GmbH, Managing Director and Vice President, Mill Manager (2012–2013)Metsä Board Corporation, Vice President, R&D, Consumer Packaging business area (2008–2012) and mill manager, Metsä Board Kyro and Metsä Board Tako (2009–2010)Metsä Board Zanders GmbH, Head of Production (2004– 2008)Metsä Board Corporation, Vice President, R&D (2001–2004)Metsä Board Corporation, Manager, Process Development (1999–2001)Valmet Corporation, Manager, Product Development (1997–1999)Valmet Corporation, USA, Manager, R&D (1995–1997)Metsä Board Corporation, Development Manager (1993–1995)
Shares owned in Metsä Board Corporation 31 Dec 2017: 16,236 B shares
Metsä Group employee since 2007. Member of Metsä Board Corporate Management Team since 2011.
Main positions:Metsä Board Corporation, Senior Vice President, Business Development (2011–2017)Metsä Group, CIO, Senior Vice President (2009–2011)Metsä Group, Director, Group ICT (2007–2009)IBM Corporation, Principal Consultant and Business Development Executive (2002–2007)PwC Management Consulting, Principal Consultant (2000–2002)Jaakko Pöyry Consulting, various positions (Consultant, Senior Consultant, Vice President) in Finland and USA (1990–2000)
Main positions of trust:Tieto Corporation, member of the Board (2012–)
Shares owned in Metsä Board Corporation 31 Dec 2017: 45,740 B shares
MIKA JOUKIOb.1964 M.Sc. (Tech), MBA Chief Executive Officer
JUSSI NOPONENb. 1975M.Sc. (Tech)Chief Financial Officer
ARI KIVIRANTAb. 1963D.Sc. (Tech)Senior Vice President, Development
SARI PAJARIb. 1968M.Sc. (Tech)Senior Vice President, Sales and Marketing
YEAR 2017
REPORT OF THE BOARD OF DIRECTORS
GROUP ACCOUNTS
SHARES AND SHAREHOLDERS
PARENT COMPANY ACCOUNTS
AUDITOR’S REPORT
GOVERNANCE KEY FIGURES
INVESTOR INFORMATION
CORPORATE GOVERNANCE STATEMENT | SALARY AND REMUNERATION REPORT | BOARD OF DIRECTORS | CORPORATE MANAGEMENT TEAM
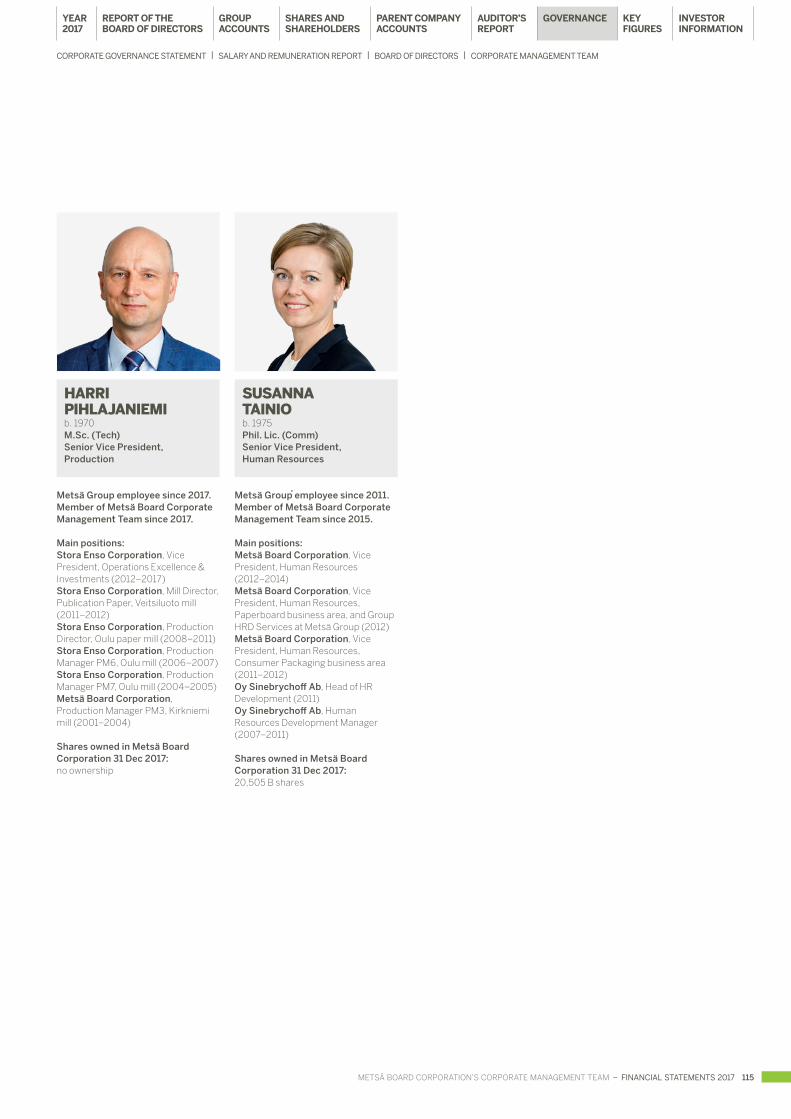
METSÄ BOARD CORPORATION’S CORPORATE MANAGEMENT TEAM – FINANCIAL STATEMENTS 2017 115
Metsä Group employee since 2017. Member of Metsä Board Corporate Management Team since 2017.
Main positions:Stora Enso Corporation, Vice President, Operations Excellence & Investments (2012–2017)Stora Enso Corporation, Mill Director, Publication Paper, Veitsiluoto mill (2011–2012)Stora Enso Corporation, Production Director, Oulu paper mill (2008–2011)Stora Enso Corporation, Production Manager PM6, Oulu mill (2006–2007)Stora Enso Corporation, Production Manager PM7, Oulu mill (2004–2005)Metsä Board Corporation, Production Manager PM3, Kirkniemi mill (2001–2004)
Shares owned in Metsä Board Corporation 31 Dec 2017: no ownership
Metsä Group employee since 2011. Member of Metsä Board Corporate Management Team since 2015.
Main positions:Metsä Board Corporation, Vice President, Human Resources (2012–2014)Metsä Board Corporation, Vice President, Human Resources, Paperboard business area, and Group HRD Services at Metsä Group (2012)Metsä Board Corporation, Vice President, Human Resources, Consumer Packaging business area (2011–2012) Oy Sinebrychoff Ab, Head of HR Development (2011) Oy Sinebrychoff Ab, Human Resources Development Manager (2007–2011)
Shares owned in Metsä Board Corporation 31 Dec 2017: 20,505 B shares
HARRI PIHLAJANIEMIb. 1970M.Sc. (Tech)Senior Vice President, Production
SUSANNA TAINIOb. 1975Phil. Lic. (Comm)Senior Vice President, Human Resources
YEAR 2017
REPORT OF THE BOARD OF DIRECTORS
GROUP ACCOUNTS
SHARES AND SHAREHOLDERS
PARENT COMPANY ACCOUNTS
AUDITOR’S REPORT
GOVERNANCE KEY FIGURES
INVESTOR INFORMATION
CORPORATE GOVERNANCE STATEMENT | SALARY AND REMUNERATION REPORT | BOARD OF DIRECTORS | CORPORATE MANAGEMENT TEAM

116 FINANCIAL STATEMENTS 2017 – QUARTERLY DATA
QUARTERLY DATA
EUR million Total year Quarterly
SALES 2017 2016 IV/2017 III/2017 II/2017 I/2017 IV/2016 III/2016 II/2016 I/2016
METSÄ BOARD 1,848.6 1.720.3 451.3 478.6 474.2 444.5 421.8 440.0 422.9 435.6
OPERATING RESULT, COMPARABLE 2017 2016 IV/2017 III/2017 II/2017 I/2017 IV/2016 III/2016 II/2016 I/2016
METSÄ BOARD 193.5 137.5 54.4 50.4 43.5 45.2 32.8 34.0 35.8 35.0
OPERATING RESULT AND RESULT BEFORE TAXES 2017 2016 IV/2017 III/2017 II/2017 I/2017 IV/2016 III/2016 II/2016 I/2016
OPERATING RESULT 207.1 132.3 54.4 60.6 46.9 45.2 38.5 26.6 34.5 32.7
Share of profit from associated companies 0.0 0.1 0.0 -0.1 0.1 0.0 0.0 0.0 0.0 0.0
Exchange gains/losses -1.1 -4.9 -0.5 0.0 -1.0 0.4 -3.9 -0.7 -1.9 1.6
Other financial income and expenses -35.2 -25.8 -7.1 -16.8 -5.7 -5.7 -6.0 -6.1 -7.1 -6.5
RESULT BEFORE TAXES 170.8 101.6 46.8 43.8 40.3 39.9 28.6 19.8 25.5 27.7
OPERATING RESULT, % OF SALES 2017 2016 IV/2017 III/2017 II/2017 I/2017 IV/2016 III/2016 II/2016 I/2016
METSÄ BOARD 11.2 7.7 12.0 12.7 9.9 10.2 9.1 6.0 8.2 7.5
1,000 t Total year Quarterly
DELIVERIES 2017 2016 IV/2017 III/2017 II/2017 I/2017 IV/2016 III/2016 II/2016 I/2016
Paperboard 1,803 1,607 429 469 477 428 399 422 408 378
Paper 0 35 0 0 0 0 2 7 11 15
Market pulp 515 500 120 123 134 138 116 128 113 144
PRODUCTION 2017 2016 IV/2017 III/2017 II/2017 I/2017 IV/2016 III/2016 II/2016 I/2016
Paperboard 1,817 1,708 459 458 444 456 418 456 428 405
Paper 0 23 0 0 0 0 0 2 9 12
Metsä Fibre’s pulp 1) 619 577 180 152 140 147 149 144 139 146
Metsä Board’s pulp 1,330 1,236 305 353 344 328 306 314 307 309
1) Corresponds to Metsä Board’s ownership of 24.9 per cent in Metsä Fibre.
YEAR 2017
REPORT OF THE BOARD OF DIRECTORS
GROUP ACCOUNTS
SHARES AND SHAREHOLDERS
PARENT COMPANY ACCOUNTS
AUDITOR’S REPORT
GOVERNANCE KEY FIGURES
INVESTOR INFORMATION
QUARTERLY DATA | PRODUCTION CAPACITIES | TEN YEARS IN FIGURES
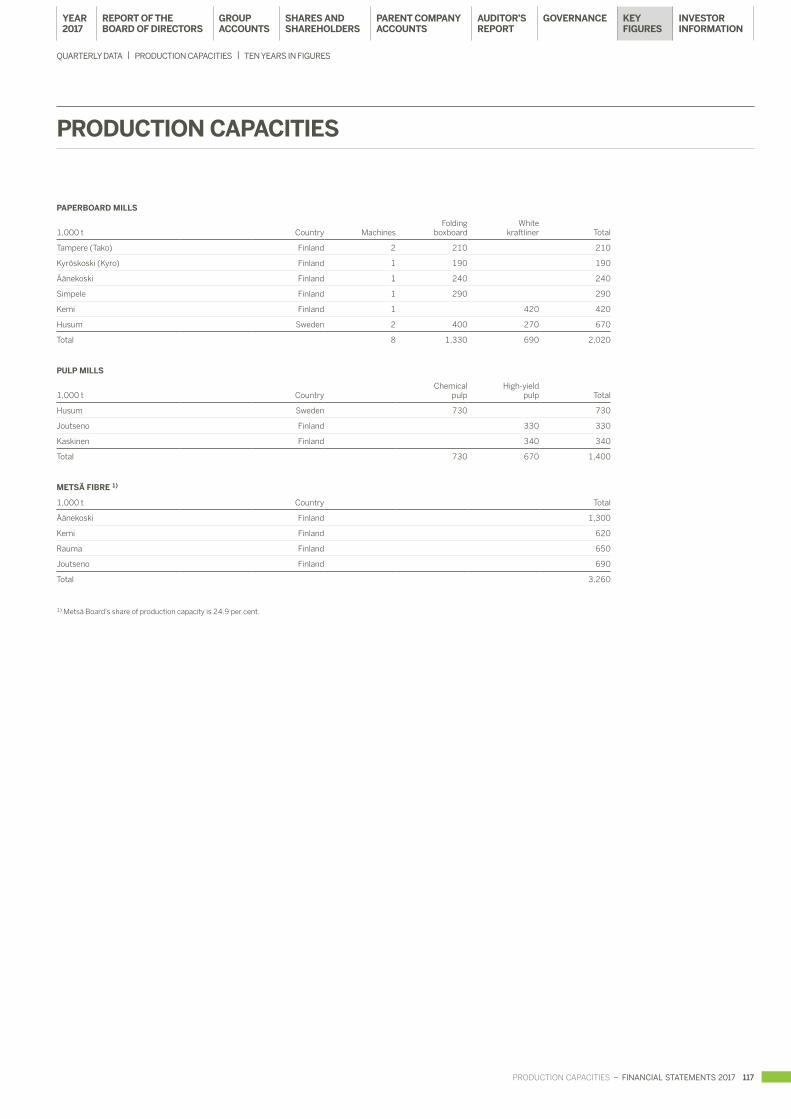
PRODUCTION CAPACITIES – FINANCIAL STATEMENTS 2017 117
PRODUCTION CAPACITIES
PAPERBOARD MILLS
1,000 t Country MachinesFolding
boxboardWhite
kraftliner Total
Tampere (Tako) Finland 2 210 210
Kyröskoski (Kyro) Finland 1 190 190
Äänekoski Finland 1 240 240
Simpele Finland 1 290 290
Kemi Finland 1 420 420
Husum Sweden 2 400 270 670
Total 8 1,330 690 2,020
PULP MILLS
1,000 t CountryChemical
pulpHigh-yield
pulp Total
Husum Sweden 730 730
Joutseno Finland 330 330
Kaskinen Finland 340 340
Total 730 670 1,400
METSÄ FIBRE 1)
1,000 t Country Total
Äänekoski Finland 1,300
Kemi Finland 620
Rauma Finland 650
Joutseno Finland 690
Total 3,260
1) Metsä Board’s share of production capacity is 24.9 per cent.
YEAR 2017
REPORT OF THE BOARD OF DIRECTORS
GROUP ACCOUNTS
SHARES AND SHAREHOLDERS
PARENT COMPANY ACCOUNTS
AUDITOR’S REPORT
GOVERNANCE KEY FIGURES
INVESTOR INFORMATION
QUARTERLY DATA | PRODUCTION CAPACITIES | TEN YEARS IN FIGURES
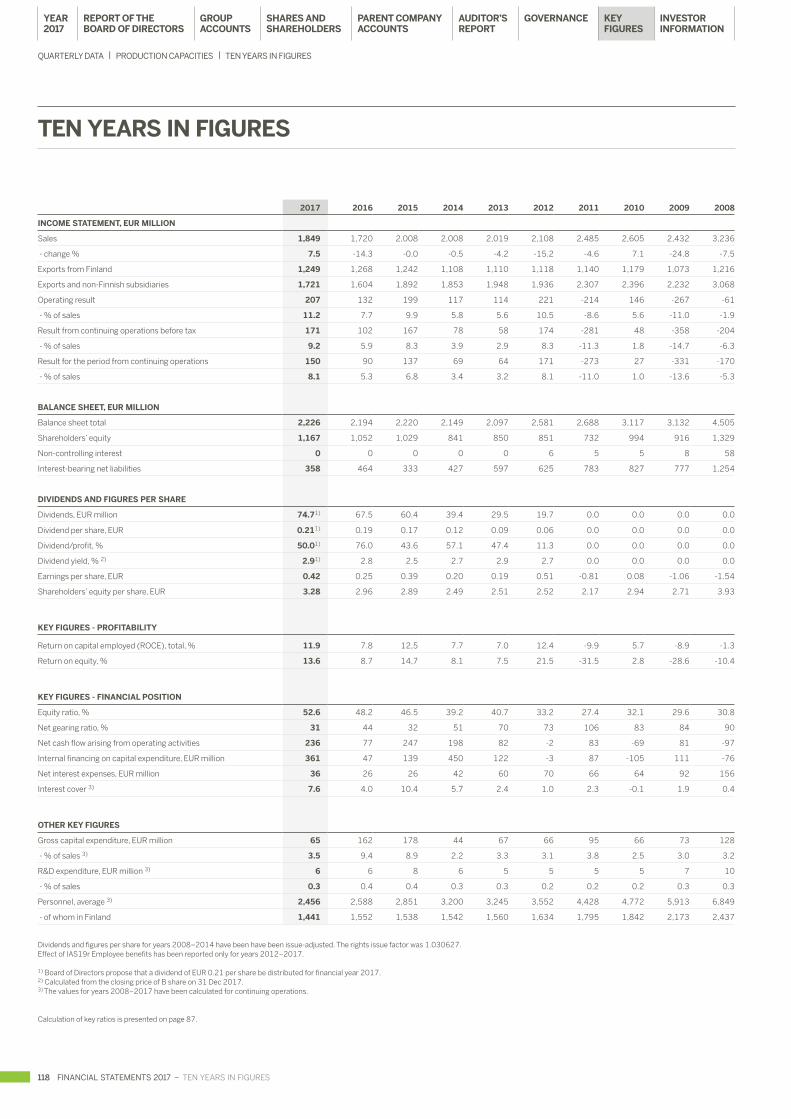
118 FINANCIAL STATEMENTS 2017 – TEN YEARS IN FIGURES
TEN YEARS IN FIGURES
2017 2016 2015 2014 2013 2012 2011 2010 2009 2008
INCOME STATEMENT, EUR MILLION
Sales 1,849 1,720 2,008 2,008 2,019 2,108 2,485 2,605 2,432 3,236
- change % 7.5 -14.3 -0.0 -0.5 -4.2 -15.2 -4.6 7.1 -24.8 -7.5
Exports from Finland 1,249 1,268 1,242 1,108 1,110 1,118 1,140 1,179 1,073 1,216
Exports and non-Finnish subsidiaries 1,721 1,604 1,892 1,853 1,948 1,936 2,307 2,396 2,232 3,068
Operating result 207 132 199 117 114 221 -214 146 -267 -61
- % of sales 11.2 7.7 9.9 5.8 5.6 10.5 -8.6 5.6 -11.0 -1.9
Result from continuing operations before tax 171 102 167 78 58 174 -281 48 -358 -204
- % of sales 9.2 5.9 8.3 3.9 2.9 8.3 -11.3 1.8 -14.7 -6.3
Result for the period from continuing operations 150 90 137 69 64 171 -273 27 -331 -170
- % of sales 8.1 5.3 6.8 3.4 3.2 8.1 -11.0 1.0 -13.6 -5.3
BALANCE SHEET, EUR MILLION
Balance sheet total 2,226 2,194 2,220 2,149 2,097 2,581 2,688 3,117 3,132 4,505
Shareholders’ equity 1,167 1,052 1,029 841 850 851 732 994 916 1,329
Non-controlling interest 0 0 0 0 0 6 5 5 8 58
Interest-bearing net liabilities 358 464 333 427 597 625 783 827 777 1,254
DIVIDENDS AND FIGURES PER SHARE
Dividends, EUR million 74.71) 67.5 60.4 39.4 29.5 19.7 0.0 0.0 0.0 0.0
Dividend per share, EUR 0.211) 0.19 0.17 0.12 0.09 0.06 0.0 0.0 0.0 0.0
Dividend/profit, % 50.01) 76.0 43.6 57.1 47.4 11.3 0.0 0.0 0.0 0.0
Dividend yield, % 2) 2.91) 2.8 2.5 2.7 2.9 2.7 0.0 0.0 0.0 0.0
Earnings per share, EUR 0.42 0.25 0.39 0.20 0.19 0.51 -0.81 0.08 -1.06 -1.54
Shareholders’ equity per share, EUR 3.28 2.96 2.89 2.49 2.51 2.52 2.17 2.94 2.71 3.93
KEY FIGURES - PROFITABILITY
Return on capital employed (ROCE), total, % 11.9 7.8 12,5 7.7 7.0 12.4 -9.9 5.7 -8.9 -1.3
Return on equity, % 13.6 8.7 14,7 8.1 7.5 21.5 -31.5 2.8 -28.6 -10.4
KEY FIGURES - FINANCIAL POSITION
Equity ratio, % 52.6 48.2 46.5 39.2 40.7 33.2 27.4 32.1 29.6 30.8
Net gearing ratio, % 31 44 32 51 70 73 106 83 84 90
Net cash flow arising from operating activities 236 77 247 198 82 -2 83 -69 81 -97
Internal financing on capital expenditure, EUR million 361 47 139 450 122 -3 87 -105 111 -76
Net interest expenses, EUR million 36 26 26 42 60 70 66 64 92 156
Interest cover 3) 7.6 4.0 10.4 5.7 2.4 1.0 2.3 -0.1 1.9 0.4
OTHER KEY FIGURES
Gross capital expenditure, EUR million 65 162 178 44 67 66 95 66 73 128
- % of sales 3) 3.5 9.4 8.9 2.2 3.3 3.1 3.8 2.5 3.0 3.2
R&D expenditure, EUR million 3) 6 6 8 6 5 5 5 5 7 10
- % of sales 0.3 0.4 0.4 0.3 0.3 0.2 0.2 0.2 0.3 0.3
Personnel, average 3) 2,456 2,588 2,851 3,200 3,245 3,552 4,428 4,772 5,913 6,849
- of whom in Finland 1,441 1,552 1,538 1,542 1,560 1,634 1,795 1,842 2,173 2,437
Dividends and figures per share for years 2008–2014 have been have been issue-adjusted. The rights issue factor was 1.030627.Effect of IAS19r Employee benefits has been reported only for years 2012–2017.
1) Board of Directors propose that a dividend of EUR 0.21 per share be distributed for financial year 2017.2) Calculated from the closing price of B share on 31 Dec 2017.3) The values for years 2008–2017 have been calculated for continuing operations.
Calculation of key ratios is presented on page 87.
YEAR 2017
REPORT OF THE BOARD OF DIRECTORS
GROUP ACCOUNTS
SHARES AND SHAREHOLDERS
PARENT COMPANY ACCOUNTS
AUDITOR’S REPORT
GOVERNANCE KEY FIGURES
INVESTOR INFORMATION
QUARTERLY DATA | PRODUCTION CAPACITIES | TEN YEARS IN FIGURES
INVESTOR RELATIONS AND INVESTOR INFORMATION – FINANCIAL STATEMENTS 2017 119
INVESTOR RELATIONS AND INVESTOR INFORMATION
INVESTOR RELATIONS
The task of Metsä Board’s investor relations is to ensure that the market receives accurate and sufficient information in order to determine the value of Metsä Board’s shares. The investor relations function is responsible for planning and providing financial and investor commu-nication. The activities of investor relations also include collecting investor feedback and market information for Metsä Board’s man-agement and Board of Directors. All requests from investors are handled in a centralised manner by Metsä Board’s investor relations.
The tools used in Metsä Board’s investor communication include financial statements bulletins, interim reports, annual reports, stock exchange and press releases, as well as the company’s Investors page at www.metsa board.com/investors. You can also order Metsä Board’s publications and provide feedback on the website. In addition, the company’s investor relations include meetings with investors, Capital Markets Days, semi-nars, webcasts and Annual General Meetings. Investor events are attended variously by the Head of Investor Relations, CEO, CFO and, if needed, other members of the company’s senior management.
INVESTOR RELATIONS IN 2017
In 2017, Metsä Board organised 30 roadshow days in almost 20 different cities in Europe and North America. In addition, the company organised several group and private meetings and telephone conferences with investors and analysts. In June, Metsä Board organised a Capital Markets Day in Helsinki. The partici-pants included nearly 50 institutional inves-tors and analysts. The Capital Markets day included presentations given by the executive management, and the distribution of informa-
tion concerning the company’s strategy and growth, ongoing and future development projects, and the outlook of the paperboard and pulp markets. A telephone conference in which the CEO presented the interim report and the audience had the chance to ask questions was organised in connection with the release of each interim report. Recordings and transcriptions of these events are available on Metsä Board’s Investors pages. During the year, the company also participated in events aimed at private inves-tors, such as the public events organised by the Finnish Foundation for Share Promotion. Metsä Board’s investor communication also makes use of social media through Twitter and LinkedIn accounts, for example.
SILENT PERIOD
Metsä Board does not comment on the company’s financial performance or future outlook from the close of each reporting period up to the publication of the report for the period, apart from substantial changes in the market situation or to correct information that is incorrect.
ANALYST COVERAGE
In 2017, Metsä Board was followed by ten analysts. The analysts’ contact information and consensus forecasts are available on Metsä Board’s Investors pages at www.metsaboard.com/investors. Metsä Board is not responsible for the content, accuracy or extent of the analysts’ views. At least the following broker-age firms conducted analyses of Metsä Board in 2017: ABGSC, Carnegie, Danske Equities, Evli Bank, Handelsbanken, Inderes, Kepler Cheuvreux, Nordea Markets, OP and SEB.
ANNUAL GENERAL MEETING IN 2018
The Annual General Meeting of Metsä Board Corporation will be held at Finlandia Hall, A hall, congress wing, Mannerheimintie 13 E (M1), Helsinki, on Tuesday 27 March 2018 at 3 p.m. EET. Shareholders wishing to take part in the Annual General Meeting and to exercise their right to vote must be registered in the company’s shareholders’ register held by Euroclear Finland Ltd. on 15 March 2018, the record date of the Annual General Meeting, and must register for the meeting by 11 a.m. on 22 March 2018 on the company’s website at www.metsaboard.com, by e-mail to [email protected], by telephone from Monday to Friday between 10 and 11 a.m. at +358 10 465 4102, or by mail to Metsä Board Corporation, Legal Services/Nenonen, P.O. Box 20, 02020 Metsä. Any proxy documents should be delivered to the above address before the last date for registration.
DISTRIBUTION OF DIVIDEND
The Board of Directors proposes to the Annual General Meeting to be held on 27 March 2018 that a dividend of EUR 0.21 per share be paid for the 2017 financial period. The dividend will be paid to shareholders who are registered in the company’s shareholders register held by Euroclear Finland Oy on the dividend payment record date of 29 March 2018. The Board of Directors proposes 10 April 2018 as the dividend payment date.
INVESTOR RELATIONS
CONTACT INFORMATION
Katri SundströmHead of Investor RelationsTel. +358 400 976 [email protected]
Anu JasolaAssistantTel. +358 10 469 [email protected]
General questions and comments on investor relations can be e-mailed to [email protected].
www.metsaboard.com
CLOSED WINDOW FINANCIAL REPORT RELEASE DATE
1 January to 7 February 2018 Financial result for 2017 Thursday 8 February 2018
1 April to 2 May 2018 Interim report January–March Thursday 3 May 2018
1 July to 1 August 2018 Interim report January–June Thursday 2 August 2018
1 October to 7 November 2018 Interim report January–September Thursday 8 November 2018
YEAR 2017
REPORT OF THE BOARD OF DIRECTORS
GROUP ACCOUNTS
SHARES AND SHAREHOLDERS
PARENT COMPANY ACCOUNTS
AUDITOR’S REPORT
GOVERNANCE KEY FIGURES
INVESTOR INFORMATION

120 CONTACT INFORMATION
CONTACT INFORMATION
METSÄ BOARD CORPORATION
Head officeP.O. Box 2002020 METSÄ, Finland
Revontulenpuisto 202100 Espoo, FinlandTel. +358 10 4611
Business ID 0635366–7
www.metsaboard.com
Metsä Board has a global sales network. To locate contact details of Metsä Board sales offices, please visit company website www.metsaboard.com/contacts
YEAR 2017
REPORT OF THE BOARD OF DIRECTORS
GROUP ACCOUNTS
SHARES AND SHAREHOLDERS
PARENT COMPANY ACCOUNTS
AUDITOR’S REPORT
GOVERNANCE KEY FIGURES
INVESTOR INFORMATION


METSÄ BOARD CORPORATION
P.O. Box 20
FI-02020 METSÄ
Tel. +358 10 4611
www.metsaboard.com
Cov
er M
etsä
Boa
rd P
rim
e FB
B B
righ
t 2
35
g/m
2. ©
Met
sä B
oard
20
18
ME
TS
Ä B
OA
RD
AN
NU
AL R
EP
OR
T 2
017
ME
TS
Ä B
OA
RD
AN
NU
AL R
EP
OR
T 2
017

METSÄ BOARD CORPORATION
P.O. Box 20
FI-02020 METSÄ
Tel. +358 10 4611
www.metsaboard.com
Cov
er M
etsä
Boa
rd P
rim
e FB
B B
righ
t 2
35
g/m
2. ©
Met
sä B
oard
20
18
ME
TS
Ä B
OA
RD
AN
NU
AL R
EP
OR
T 2
017
ME
TS
Ä B
OA
RD
AN
NU
AL R
EP
OR
T 2
017