metropolitan area networks -...
TRANSCRIPT
IPTV Bandwidth Demands in MetropolitanArea Networks
Jesse E. Simsarian and Marcus Duelk
Bell Laboratories, Alcatel-Lucent, Holmdel, NJ, jessesgalcatel-lucent.com
Abstract-In this paper, we analyze the bandwidthrequirements in Metropolitan Area Networks (MANs) forproviding Internet Protocol Television (IPTV) services. We findthat the application with the potential to generate highbandwidth in the MAN is Video on Demand (VoD). However,the amount of bandwidth in the MAN depends on the location ofthe video servers and cached video content. Therefore, wedevelop a model of the IPTV network to determine the optimumlocation of the cached video content. From this model, we findthe dependence of the MAN traffic on the fraction of userssimultaneously requesting VoD streams. The results show that asignificant fraction of future MAN traffic, up to 90%, may be dueto these on-demand video services.
Index Terms-Communication System Traffic, Digital TV,Interactive TV, HDTV, Cable TV
I. INTRODUCTION
W5 [E are in the midst of a major shift in the way videocontent is delivered to end users. IPTV systems are
currently being deployed worldwide, and the pace is expectedto increase dramatically in the coming years. While TVservices have traditionally been delivered by Cable TV Multi-Service Operators (MSOs), we are now seeing telecom serviceproviders entering into the video delivery business. It isexpected that both sectors of the industry will transition theirvideo delivery systems to IPTV in the future, in order to takeadvantage of the operations savings inherent in a convergednetwork, and the promises of additional services that becomeavailable to customers on an IPTV platform.
There have been extensive prior studies on contentdistribution networks. Work on unicast content delivery hasproposed algorithms for server placement in the Internet [1][2]and the storage of a portion of a video file at a proxy server[3]. Prior work on on-demand video delivery have comparedmethods such as batching, patching and stream merging toreduce Video-on-Demand (VoD) bandwidth usage by formingmulticast groups [4][5]. Several of these techniques have beenanalyzed in the context of the Internet [6] to minimize deliverycost, with emphasis on server placement and routingprotocols.
This paper applies previous work on content delivery to arealistic metropolitan area network (MAN). In contrast toprevious studies, we consider the situation where a serviceprovider is optimizing content delivery in their privatenetwork, rather than the public Internet. We provide more
detailed cost analysis than prior work, and give estimates forthe total MAN traffic and the traffic mix.An application that generates a large quantity of bandwidth
is "true" VoD, where each user is delivered a unique stream ofcontent allowing full control (e.g. pause, fast forward, andrewind) over the video. We assume a small amount ofbuffering at the client's set-top box (on the order of seconds)so that the delivered stream is viewed nearly in real time. Wedo not consider VoD multicast [4] here since it addscomplexity and becomes less beneficial as the content librarygrows.
Several studies have noted the growing popularity of VoD,with a recent report stating that 20% of users that have accessto VoD use it daily [7]. This type of interactive service isexpected to draw more customers to IPTV, and to become alarger percentage of overall viewing when TV and othercontent in addition to films become available at theconsumer's convenience. The amount of MAN traffic thesesessions generate depends on the location of the video cachethat delivers the content to the user. To determine the optimallocation of the content, we have developed a cost model ofthetotal network including the servers that cache the on-demandvideo as well as the costs associated with data switching andtransport. We find that there is an optimal placement ofcontent at caches in the network that minimizes the totalsystem cost. As the number of users simultaneously accessingthe video content increases, more of the content is shiftedcloser to the user to offset the increased demands on theswitching and transport network. To get a betterunderstanding of the possible impact on future MANnetworks, we report the results as the fraction of total MANtraffic that is expected to be video content compared toprojected levels of data and voice traffic.We begin the analysis in Section II by describing the
amount of data and voice traffic expected to be present in thenetworks in upcoming years. In Section III we give the IPTVnetwork architecture and discuss the traffic generated due tobroadcast TV and VoD. Section IV gives our assumptions onthe content of the VoD service and describes the userbehavior. Section V describes the caching strategy, andsection VI gives the results of the study, with the expectedtraffic composition in the MAN.
II. DATA AND VOICE TRAFFIC
We are not only interested in the quantity of traffic in futureMAN networks, but also the composition of that traffic.
Proceedings of the 2007 15th IEEE Workshop on Local and Metropolitan Area Networks1-4244-11 00-9/07/$25.00 ©2007 IEEE 31

Voice, video, and data traffic will have differentcharacteristics in terms of burstiness and flow durations. Theywill also have different Quality of Service (QoS) requirementlevels. For example, video traffic is sensitive to packet loss,timing jitter, and packet reordering, necessitating a higher QoSthan data traffic. Data traffic such as web browsing and email,on the other hand, is more tolerant to packet retransmissionand reordering. Therefore network operations and networkingequipment will be affected by the future traffic mix.We estimate the future voice and data traffic in the network
in a bottom-up analysis where we use the average bandwidthfor phone calls and Internet usage, the number of households,and the concurrency (the probability among households tohave simultaneous phone calls or Internet sessions). We derivethe average data-bandwidth usage from market studies andmeasurements from Internet exchange points (IXPs) in 2005in combination with studies that project the growth in datatraffic over the next five years.We find that the voice traffic in the M\AN will remain more
or less flat over the next years. For a M\AN serving one millionhouseholds (HHs) and an estimated concurrency of 25%, thetotal voice traffic is about 30 Gb/s. These numbers are derivedfrom market studies forecasting the subscription rate ofmobilephone lines, fixed landlines (PSTN) as well as broadbandphone connections using VoIP [8]. These studies project adecline of PSTN lines but an overall increase in phone linesdue to growth in mobile and VoIP lines. However, the growthin phone subscribers is offset by a decline in requiredbandwidth (BW) per phone call, as shown in Fig. 1.
II
0
a)U,a)
0-a)C:
162160158156154152150148146144142140
2005 2006 2007 2008 2009 2010
878685848382818079787776
Q
-0
a)0
a)
Year
Fig. 1. Projected total phone penetration in the US and estimated Ethernetbandwidth per phone call (mix of PSTN, VoIP and mobile lines). Penetrationrates greater than 100% represent more than one phone per household.
This reduction in BW per voice call is due to traditionalPSTN landlines being replaced by more efficient VoIP ormobile phone lines. We have considered G.711 PCMencoding with 64 kb/s payload BW for PSTN (correspondingto 95.2 kb/s link layer BW using Ethernet), an equal mix ofG.723 IA (26.1-27.2 kb/s payload BW) and G.729A (39.2kb/s payload BW) encoding for VoIP and typical encodingrates of 9.6 kb/s (35.9 kb/s Ethernet BW) for mobile phones[9]. As a result, we estimate the total voice traffic in the MVANto be 29.6 Gb/s in 2005, growing to about 31.3 Gb/s in 2008and then declining to 30.8 Gb/s in 2010. The annual change isless than ±2% during this period.To estimate the data traffic in the M\AN we begin with a
sustained download rate per Internet user during the evening
peak hours (6-10 p.m.) of 60 kb/s in 2005. This number wasderived from recent studies investigating the Internet usagebehavior of roughly half of the broadband access users inJapan [10],[11]. In these studies cumulative distributionfunctions (CDFs) for the daily Internet traffic per user werereported. From these CDFs we obtained a sustained downloadrate of 41 kb/s over 24h per broadband user. Furthermore, wehave analyzed the traffic pattern of more than twenty IXPsworldwide that are publicly available [12]. All ofthem show aperiodic traffic pattern that peaks in the evening hoursbetween 6 and 10 p.m., which would also be peak hours forVoD sessions. We found the peak-to-average bandwidth ratioof 1.44±0.06 to be almost identical for the large exchangepoints. This ratio multiplied with the sustained download rateof 41 kb/s over 24h results in an average Internet downloadrate in the evening hours of 60 kb/s in 2005.
I 70Io 65
o 60.2_
l- 55a)
a) 50
=0 45
0 40
p 352005 2006 2007 2008 2009 2010
l700
600
500
400
300
200
100
I0
-0a)
m
70
C:
a)
cnI
Year
Fig. 2. Projected penetration of broadband Internet access in the US andestimated sustained download rate for Internet usage during evening peakhours. Upper and lower bound estimates for the sustained download rate areindicated by dotted lines.
To obtain future data rates, we use a market study thatforecasts the Internet data traffic generated by consumers andbusinesses from 2005 to 2009 in Western Europe [13], whichpredicts an overall annual growth rate of roughly 5500 with anincrease in the business segment and a growth decline in theconsumer market. Even though IXP traffic growth was in therange of 00% annually over the last years [12] it isanticipated that the growth will slow to roughly 500/ in thedeveloped markets [14]. We have therefore assumed a similargrowth scenario for the US market with Internet trafficgrowing by 5500 per year. Applying this to our averagedownload rate of 60 kb/s in 2005 results in a traffic rate of 537kb/s in the year 2010. Using this sustained download rate witha projected penetration ofbroadband Internet access in 2010 inthe range of 63% [15] to 7900 [16][17], and an estimatedconcurrency of 900/ yields 338 Gb/s of data traffic in theM\AN for 2010. We consider these estimates to have a highdegree of uncertainty due to various reasons: different growthscenarios from different studies, different Internet usagebehavior of residential consumers and enterprise customers,the unclear development of peer-to-peer (P2P) traffic, and theunpredictable behavior of consumers five years from now, forexample. For these reasons we give an upper and lower boundon the data traffic in 2010. To estimate the lower bound westart with a sustained download rate of 40 kb/s in 2005 and anannual growth of 4500, resulting in a download rate of 256
32

kb/s in 2010 and a total data traffic in the MAN of 161 Gb/sfor 2010. Here, we still have assumed the same broadbandpenetration concurrency as previously. For the upper boundwe assume a sustained download rate of 80 kb/s in 2005 withan annual increase of 65%, resulting in a download rate of 978kb/s in 2010 and a total data traffic in the MAN of 616 Gb/sfor 2010. Our estimated trends of increasing Internet usageover the years 2005 to 2010 are shown in Fig. 2.The data traffic includes peer-to-peer (P2P) traffic from
file-sharing sources, which is expected to continue growing.While P2P traffic is thought to contain a large percentage ofillegal video file transfers, we do not consider this traffic to bein the same category as the IPTV video services of interest inthis work, since it does not have the same real-time transportrequirements and content-protected sources.
III. IPTV NETWORK ARCHITECTURE
The IPTV network architecture is shown in Fig. 3. Thenational broadcast content from satellite or direct links isdistributed from the super headend (SUE) to the video huboffices (VHOs) over the wavelength division multiplexed(WDM) national core. The VHOs contain VoD servers thatstore all of the on-demand video content. The video sourceoffices (VSOs) also contain VoD servers that cache the morepopular content closer to the users. The content is thendistributed to the users through the aggregation network whereit is sent to the central offices (COs). Digital subscriber lineaccess multiplexers (DSLAMs) or passive optical networks(PONs) send the content from the COs to homes andbusinesses. While this architecture is based on telecomservice provider networks, the MSO cable networks aresimilar in structure and this work equally applies to them. Theinset table to Fig. 3 shows the number of households servicedby each level of the network. We chose these numbers toroughly coincide with a typical service provider network.We assume that broadcast content utilizes IP multicast to
the DSLAM where it is duplicated for each user in the group.Therefore, broadcast content will consume a relatively smallamount of bandwidth in the MAN network. For example, asystem with 50 high-definition (HD) channels and 200standard-definition (SD) channels consumes only 0.9 Gb/s ofbandwidth. We assume, both for broadcast IPTV and unicastVoD, H.264 (MPEG-4 AVC) encoding with 8 Mb/s for a HDand 2.3 Mb/s for a SD stream. H.264 encoding is morebandwidth efficient than MPEG-2 encoding, which is used inmost of today's installed video equipment and may require upto 19 Mb/s for a HD video stream. Since we expect MPEG-2equipment to be replaced with H.264 over the coming years aswell as a migration towards more high-definition content, weconsidered only HD H.264 encoding in our VoD trafficforecast.
For the VoD traffic to be interactive in real-time, we assumethat a unique stream is sent to each user. Therefore, thereexists the possibility of generating a large amount ofbandwidth in the MAN. We use a cost model to determinehow much of the content should be delivered from the VHOvideo servers, and therefore generating MAN traffic, and how
much should be stored in the VSO server caches and deliveredfrom there. Storing all of the VoD content in each VSO willincur costs in video storage and in video database maintenanceand management. Storing none of the content in the VSOs willcreate expensive transport and routing networks. A previouscost study [6] included a single factor that gave the ratiobetween the server and network bandwidth costs. We performa more detailed analysis to determine the optimal networkconfiguration, by modeling the costs for video storage,bandwidth transport, and routing. We consider the VoDtraffic from one of the VHOs on the national core serving onemillion households, as shown in Fig. 3.
/ Rv/o 1 m
SHE 2 ............ '.\g,,,,,,,,,,,,,Aggregation,SHE ,,.,,,,,,,O VS Network
R/ IIOGbE~)3~c100%aaaaMMAN Core
National DM + WDCore .10
100I, _ 10 Level Number ofVSQ e~ Households
co 10,000VSO 100,000VHO 1,000,000
Fig. 3. IPTV network architecture with the number of households served
We first consider the packet routing and switching costs forVoD traffic. The video servers connect to the network viaLayer 3 routers with GbE interfaces. Packet switching is usedin the aggregation network, which consists of Layer 2 Ethernetswitches with GbE and 10 GbE interfaces. Prior work hasfocused on access network technologies [18], and we do notexpect the results of the present study to depend strongly onthe implementation of the access network. We combine theLayer 2 and 3 contributions into the packet switching/routingcost that we calculate using,
(1) CRS = CEIF (BVHO * HVHO + Btotal * Htotad),where CEIFis the cost per bandwidth of the Ethernet interfaces,BVHO is the bandwidth of traffic to the VHO server cache,HVHO is the number of packet routing hops this trafficundergoes, Btotal is the total quantity of VoD traffic, and Htotalis the number of packet hops that all of the VoD trafficundergoes, whether coming from the VSO or VHO cache. Forthe networking equipment, we include two bidirectionalinterfaces for the traffic traversing each node, and redundancyfor protection.We assume that the MAN core consists of TDM switching
nodes connected with WDM transport links that provideoptical bypass for through traffic. The cost of the TDMswitching and WDM transport is,
(2) CTDM+WDM = BVHO(CTDM +CWDM),where CTDM is the cost per bandwidth of a TDM interface andCWDM is the cost per bandwidth for optical transport on thering.
The cost for the VoD servers comes from the cost to storethe films on disk and the streaming interfaces from the videoservers,
(3) CServer = CStorage(R *Nvso + F) + CStream *NSessions,where Cstorage is the cost per film for disk storage and
33

management, R is the number of films stored at the VSO, NvSois the number of VSO nodes in the network, F is the totalnumber of films offered, Cstream is the cost per VoD stream,and Nsessions is the number of simultaneous VoD sessions. Weassume that the films are stored in their entirety, and there areno storage limits at the VSOs.
IV. VoD CONTENT AND USER BEHAVIOR
While the number of film titles available for VoD ontoday's Cable TV systems is on the order of hundreds, webelieve that future VoD offerings will approach the number oftitles offered by, for example, today's Netflix DVD mail-delivery service, which currently has a catalog of about 60,000films [19]. In order to be competitive with this type ofservice, IPTV providers will likely move towards this kind ofoffering. In this work, we hold the number of offered titlesfixed at 60,000.We model the probability of a film being selected with a
Zipf distribution, P = Mlka, whereM is a normalization factor,k is the popularity rank of the film, and a is the Zipf exponent,which has been found to be close to a = 0.7 for VoD content[2]. Fig. 4 shows the Zipf distribution for 60,000 titles, wherethe integral over all items is normalized to one.
- 0.01-00au() 1E-3-C/)
4-
0
* 1E-4--Q2QL° 1E-5-tl
Films Delivered from VHO
~~~~~~~~~~~~~~~~~~~~~~~~II~~~~~~~~~~~~~~~~~~~~~~~~~I
Cached Films Delivered Ifrom VSO I
I
IR1 10 100 1000 10000
Popularity Rank of FilmFig. 4. The Zipf distribution shows the popularity rank of VoD titles. The
vertical line separates the popular content served by the VSO from less popularcontent served by the VHO.
V. CACHING OF CONTENT
Fig. 5 shows the traffic served by a single CO, VSO, andVHO as the concurrency (the percent of households with asimultaneous HD session) increases from 0 to 4000, with oneHD session per household. The calculation for the CO(dashed line) is the case that all available content is duplicatedand stored at each CO, generating no traffic in the aggregationor MAN portions of the network. Likewise, the VSO (dot-dash line), assumes that all content is stored and deliveredonly from the VSO. The same applies for the VHO (solidline), which is the case where content is only delivered fromthe VHO. These plots give the baseline scenarios with nohierarchical delivery of the video streams.When the number of VoD titles available is small, it is
simpler to have identical content at each cache, delivered froma single network layer such as the VSO (see the calculation ofFig. 5). However, users are interested in a broader range ofcontent, so that it may be advantageous to stream the morepopular titles from a disk cache closer to the user and the lesspopular ones from a server deeper in the network. Deploying
video servers at the CO level will likely incur highmanagement costs associated with maintaining such a largenumber of servers. Therefore, we consider content streamingfrom the VSO and VHO. The vertical bar shown in Fig. 4separates the popular films that are cached and delivered fromthe VSO from the less popular titles that are transported fromthe VHO over the MAN network, with R denoting the contentrank that separates these two categories.
c1000
QD100-
F 10-
0-
> 1-: /I
VHO Traffic- -VSO Traffic
- -CO Traffic
5 10 15 20 25 30 35
VoD Concurrency [% of Households]40
Fig. 5. The traffic served by a single CO, VSO, and VHO. Each curve isthe case that all content is stored and streamed only from that location in thenetwork.
By integrating the Zipf distribution, Fig. 6 shows thecalculated fraction of all sessions that are delivered from theVHO and VSO as a function of R, expressed as a percentageof all films.
o 1.0-
0-j 0.8-E2U-LL,, 0.6-E
-" 0.4-C/)0
o 0.2-.0
,, _
- -vsoVHO
/*
0.0-0 10 20 30 40 50 60 70 80 90 1f00
Percent Cached at VSO, R
Fig. 6. The Fraction of VoD streams delivered from the VSO and VHO asa function of R.
We now use the cost model to determine Ro, the optimumfraction of content stored at the VSOs. Using the networkarchitecture of Fig. 3 and Eqs. 1-3, Fig. 7 shows the calculatedcost of transporting VoD traffic. This example is for 1 HDstream to 10% of the households served by a VHO and itsVSO and CO hierarchy. The curves can be understood asfollows. The TDM and WDM contributions only incur costsfor traffic sent from the VHO. The curve shapes come fromthe fraction of streams delivered from the VHO shown in Fig.6. When all content is distributed from the VHO (R = 0) TDMand WDM contribute a large portion of the total cost, butwhen all content is delivered from the VSO (R = 100%), theyare zero. The switching and routing costs come from the 1GbE links in the aggregation portion of the network and the 10GbE links that are present in both the MAN and theaggregation areas. Since all traffic transits the aggregation
34
U.'
r r n r n n r r n r n r n r n r r n r
-..
0
LL
le

network and is routed from the video servers, the switchingand routing costs will never be zero. The total transport andswitching costs are represented by the top curve in Fig. 7.
2500-
2000-cn0
() 1500-
a) 1000-
500-
-TotalS--Switching and Routing
-*-TDM + WDM
. - - __... *-_ _9"M
10 20 30 40 50 60 70 80 90 100
Percent Cached at VSO, R
Fig. 7. Switching, routing, and transport costs for the VoD traffic as afunction ofR, when 10% of the households receive one HD stream.
2500-
2000-
1500-
1000-
500-
b)2500-
Onnn:- suuucn0(L):a) 1500-
F 1000-
500 -
l Total VoD network- - Video server
(VHO+VSO, $25 per film)- - - Transport & switching
----- 5--:----------
to the VSO. The behavior is sensitive to the parameters in themodel, such as the content storage cost. When the cost of filmstorage is low, $25/film, the optimum caching level reaches100% (all streams sent from VSO) for a low level of VoDusage (24%). As the server cost increases to $50 per film, theless popular titles continue to be delivered from the VHO untilthe VoD concurrency reaches 48%. Typically, operationalcosts for managing the video database are high and mayexceed the basic storage costs. We have therefore alsoconsidered storage costs of $150 per film. In this case theoptimum caching level increases slowly and some content isalways delivered from the VHO.
tO-100-0CO)> 80-
a), 60-
C-)
(D 40-0~EE 20-E
0 n
Server Cost..... $25/film- -- $50/film-- -$1 50/film .-
0
6*
'() 35 405 10 1C5 20 25 30
VoD Concurrency [% of Households]
10 20 30 40 50 60 70 80 90 100
Percent Cached at VSO, R
|TotalVoD network
-- - Video server
(VHO+VSO, $25 per film)- - - Transport & switching
..
0 10 20 30 40 50 60 70 80
Percent Cached at VSO, R
Fig. 8. Cost curves for (a) a low concurrency of 1%,concurrency of 10%
90 100
and (b) a higher
Fig. 8 (a) and (b) show the costs for data transport andswitching, the cost of the VoD servers, and the sum of both.The offset at R = 0 for the server cost accounts for the VHOstorage of all content and the server streaming interfaces. Theserver cost increases linearly with the percentage of filmscached at the VSO. The trade-off between the transport andswitching versus the caching costs is clear, with the optimumcaching level, Ro, at the minimum of the total-cost curve. Fig.8a is for a low concurrency of 1%, whereas Fig. 8b has a
higher concurrency rate of 10%. Both sets of calculations are
for $25 per film cost. It is clear that the minimum in the totalcost curve shifts to a higher caching level as the number ofusers simultaneously requesting a video stream increases.Intuitively speaking, when the VoD usage becomes high, thecontent should be delivered closer to the end user.
Fig. 9 shows the optimum amount of caching, Ro, as a
function of concurrency for different film storage costs. Asthe VoD usage increases, Ro increases, shifting more content
Fig. 9. Sensitivity of the optimum caching level to the cost of film storage
VI. MAN TRAFFIC
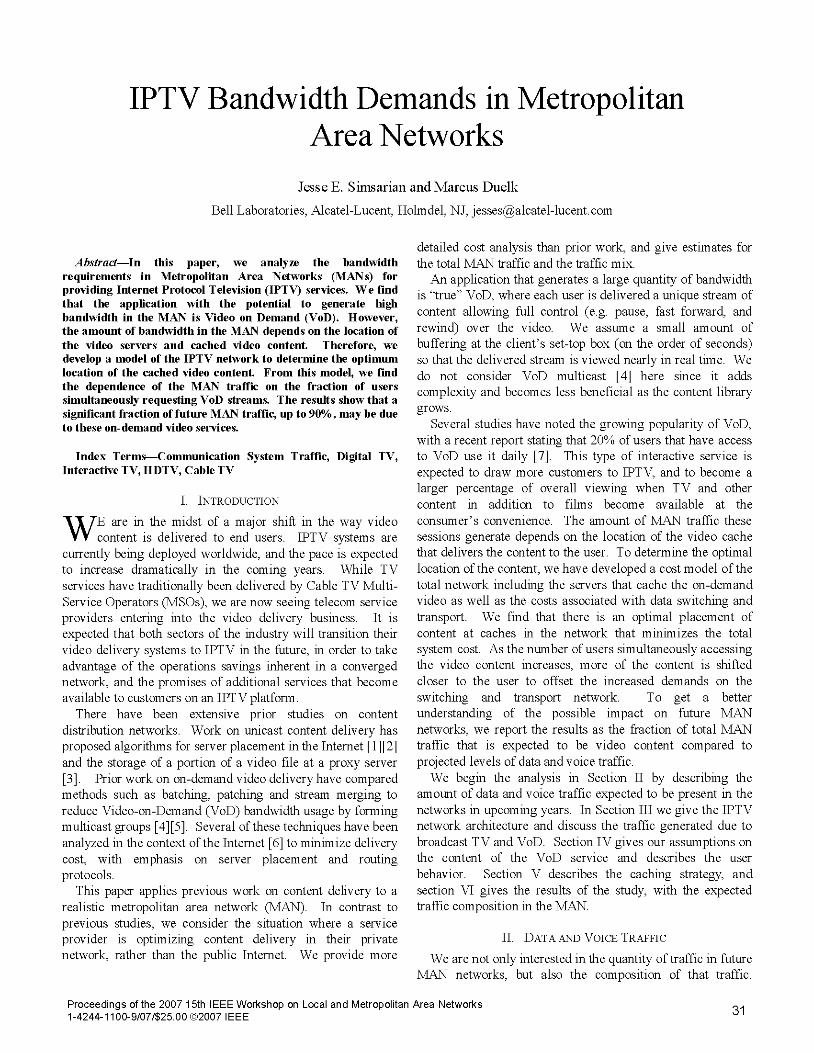
Fig. Oa shows the VoD traffic generated in the MANversus the percentage of households with a VoD connectionfor different caching costs. The optimum amount of cachingis used for each value ofVoD concurrency, which means thatfor each curve, Ro is not held fixed, but increases as the usage
increases (as in Fig. 9). As a consequence, the M\AN trafficreaches a peak for some of the curves, and then decreases as
more content is delivered from the VSO. Note that for lowcaching cost and high concurrency, the optimal MAN trafficfalls to zero and all content is delivered from the VSO (seeFig. 1Oa dotted curve). In this case the network operator mayincrease the number of titles offered in the VHO, whichwould generate MAN traffic. Also shown in Fig. 1 Oa (solidcurve) is the case where all content is delivered from theVHO. As the costs for storage becomes large, the MANtraffic approaches this limit.The MAN video traffic in Fig. 1Ob is given as a fraction of
the total (voice + data + video) bandwidth on the network.The voice and data traffic are from the projections of Fig. 1-2for 2010, i.e. 30 Gb/s of voice traffic and 338 Gb/s of datatraffic. Also shown on two of the curves are error bars thatcome from the upper and lower bounds on the data traffic(616 Gb/s and 161 Gb/s, respectively). For heavy VoDusage, and with streaming all content from the VHO, thevideo portion of traffic on the MAN reaches as high as 9000.This upper bound is independent of the number ofVSOs andthe number of households in the MAN. For networks withlocal video caching the video traffic reaches -40%0 of thetotal MAN traffic, even for low storage costs. This numberdepends on various parameters such as the number ofhouseholds and the number of VSOs in the MAN. For
35
a)
C/)0
a)
U I IP - -I I ' I'I=
u -
u
U 1......
'op..op
.0.lop
.00
example, reducing the number of VSOs reduces the storagecosts and lowers the amount of VoD traffic transported overthe MAN.
a)n00
H-z
>0
b)
F--z
H-F0
0~c
0
0
n
0
2000-
1800-
1600-
1400-
1200-
1000-
800-
600-
400-
200-
0-
100
801
All Content Delivered From VHO- - - VSO Caching, $150/film- -VSO Caching, $50/film* .... VSO Caching, $25/film
5 10 15 20 25 30 35 40
VoD Concurrency [% of Households]-All Content Delivered from VHO
SO Caching $150 filmSO Caching $50-film
-- VSO Caching, $25/film
60 Tf -~60v ---------------
40- ........
20-
-
0 5 10 15 20 25 30 35 40VoD Concurrency [% of Households]
Fig. 10. Absolute (a) and relative (b) magnitude of VoD traffic in theMAN, using data traffic projections for 2010.
We believe that the large fraction of streaming video trafficwill have implications for the design and management of theMAN network. The real-time VoD traffic is sensitive topacket loss, timing jitter, and packet reordering. Networkoperators will have to be aware of these sensitivities, whichmay result in changes to quality of service policies or trafficmonitoring strategies.We now return to the graph of Fig. 5, and recall that high
levels of usage favor moving the cached content to the VSO.For the case of all content cached at the VSO, and 4000concurrency, bandwidth of 320 Gb/s, would be served by theVSO and delivered over the aggregation network. Fig. 1Oaalso shows multiple hundreds of Gb/s of traffic over theMAN network, even when caching at the VSO is employed.The transport of this large quantity of data presents anargument for a higher-bandwidth Ethernet standard. Thepopularity of carrier-class Ethernet is growing for packetaggregation, and today's highest bandwidth Ethernet, 10GbE, will be exceeded by this level of bandwidth demand.Alternatively, multiple 10 Gb links could be deployed, whichmay be more expensive and difficult to manage than a single100 GbE connection. Another possibility is to move thecached content closer to the user, to the CO, requiring theestablishment of more Layer 3 PoPs and incurring higherequipment and network management costs.
VII. CONCLUSION
We have analyzed the bandwidth requirements in the MANfor IPTV systems. We find that the bandwidth depends onwhere VoD content caching and video stream delivery islocated. Our cost model gives the optimal location for thecontent, and from that we determine that future networks
could have a large percentage of real-time video traffic.
ACKNOWLEDGMENT
We thank Marina Thottan, Yigal Bergerano, Weiguo Yang,Martin Zirngibl, David Neilson, and Enrique Hernandez-Valencia for contributions to this paper and valuablediscussions.
REFERENCES
[1] L. Qiu, V. N. Padmanabhan, and G. M. Voelker, "On the Placement ofWeb Server Replicas," in Proc. IEEE INFOCOM2001, pp. 1587-1596.
[2] M. Yang and Z. Fei, "A Model for Replica Placement in ContentDistribution Networks for Multimedia Applications," in Proc. IEEE ICC2003,pp.557 561.
[3] B. Wang, S. Sen, M. Adler, and D. Towsley, "Optimal Proxy CacheAllocation for Efficient Streaming Media Distribution," IEEE Trans.Multimedia, Vol. 6, No. 2, April 2004.
[4] D. Eager, M. Vernon, and J. Zahorjan, "Minimizing BandwidthRequirements for On-Demand Data Delivery," IEEE Trans. Knowl.Data Eng., vol. 13, pp. 742-757, Sept./Oct. 2001.
[5] C. Aggarwal, J. Wolf, and P. Yu, "On optimal batching policies forvideo-on-demand storage servers," in Proc. IEEE Int. Conf MultimediaComputing and Systems, June 1996, pp. 253-258.
[6] J. M. Almeida, D. L. Eager, M. K. Vernon, and S. J. Wright,"Minimizing Delivery Cost in Scalable Streaming Content DistributionSystems," IEEE Trans. on Multimedia, Vol. 6, No. 2, April 2004.
[7] Horowitz Associates (2/2006), The BRIDGE 2006.[8] Pyramid Research, Forecast USA Mobile Demand, June 2006 and
Forecast US Fixed Communications Demand, March 2006.[9] Newport Networks, "VoIP Bandwidth Calculations," White Paper 2005[10] K. Fukuda, K. Cho, and H. Esaki, "The Impact ofResidential Broadband
Traffic on Japanese ISP Backbones," in Proc. ACMSigcomm 2005, vol.35, no. 1, pp. 15-22.
[11] K. Cho, K. Fukuda, H. Esaki, A. Kato, "The Impact and Implications ofthe Growth in Residential User-to-User Traffic," in Proc. ACMSigcomm2006, pp. 207-2 18.
[12] Traffic statistics of major IXPs, including AMS-IX, LINX, DE-CIX,JPNAP, HKIX, JPIX, Equinix, BIX, etc.
[13] "Western Europe IP Transit and Internet Traffic, 2004-2009 Forecast,"IDC Report HP04M, September 2005.
[14] TeleGeography News Release August 2005,http://www.telegeography.com/press/releases/2005-08-23.php.
[15] "Enabling Direct-to-Consumer Broadband Video Strategies," YankeeReport, May 2006
[16] "U.S. Broadband Services, IDC Market Forecast 2005-2009," Report34134, October 2005.
[17] "Worldwide Broadband Services, " IDC Market Forecast 2006-2010,Report 201704, May 2006
[18] M. El-Sayed, Y. Hu, S. Kulkarni, N. Wilson, "Access TransportNetwork for IPTV Video Distribution," in Proc. Optical FiberConference 2006, paper NWC1.
[19] D. Leonhardt, "What Netflix Could Teach Hollywood," New YorkTimes, June 7, 2006.
36