metrobank s.a. and subsidiaries...the information used for the present analysis includes the...
TRANSCRIPT

Translation
Equilibrium Calificadora de Riesgo, S.A.
Rating Report
Contact:
Fernando Arroyo
Hernán Regis
(507) 214-3790
The designation .pa reflects risks comparable only in Panama
METROBANK S.A. AND SUBSIDIARIES Panama City, Panama November 24th, 2016
Rating Category Definition of Rating
Entity A-.pa Reflects high capacity to pay principal and interest in the terms and conditions
agreed upon. The ability to pay is more susceptible to possible adverse changes
in the economic conditions than the higher categories.
Outlook (changed)
To Stable from Positive
“This rating is not a suggestion or recommendation to invest, nor an endorsement or guarantee of the issuance or the solvency of the rated entity”
--------------------------Millions of US$-------------------------
Dec.15 Jun.16 Dec.15 Jun.16
Assets: 1,159.9 1,245.0 Income: 12.5 6.3
Liabilities: 1,025.0 1,105.1 ROAA*: 1.1% 1.0% Equity: 134.9 139.9 ROAE*: 10.2% 9.4%
*As of June 30, 2016 the rates are presented annualized.
The information used for the present analysis includes the Metrobank, S.A. and Subsidiaries Audited Financial Statements as of December 31st,
2012, 2013, 2014, and 2015, as well as Unaudited Financial Statements as of June 30th, 2015 and 2016. Additional financial information furnished
by the Bank was also used. The rating is performed pursuant to what is established in Agreements 2-2010 and 6-2010, issued by the Superintendency of Banks of Panama (SBP).
Rationale: Equilibrium's Rating Committee affirms the
A-.pa rating to Metrobank, S.A. and Subsidiaries
(hereinafter, Metrobank or the Bank) after the evaluation
performed. Also, the outlook was changed to Stable from
Positive.
The rating assigned takes into account the sustained
growth of the Bank's earning assets throughout the last
periods evaluated. Likewise, the adequate technological
infrastructure Metrobank presents favorably contributes,
resulting in greater fee income, thus diversifying its
generation sources. The adequate liquidity ratios
maintained by the Bank are equally positive; the same are
reinforced with the available lines the Bank maintains
with first-rate correspondent banks. Additionally, the
performance of its main subsidiary, Financiera Govimar,
turns out favorable, contributing approximately 35% of
the consolidated net profit.
Notwithstanding the above, the decision to modify the
outlook takes into consideration the upward tendency of
the variation percentage of the Bank's delinquency during
the first semester of 2016, compared to previous periods;
even though said delinquency ratios are still below the
average of the National Banking System (NBS). The
above is also associated to the concentration that
Metrobank presents in its loan portfolio -typical of
corporate banking- where the Top 20 debtors represent
27.3% of the portfolio. Metrobank also has the challenge
to diversify its funding sources, where deposits are still
the main financing item of assets (80%), showing
concentration in its Top 20 depositors (22.5%). It is worth
indicating that, compared to the average of General
License banks in Panama, Metrobank presents a higher
funding cost (3.5% versus 2.0%). The contractual
mismatch between assets and liabilities the Bank shows
in the buckets under one year as a result of the
participation of deposits in these terms was also
considered. Notwithstanding the above, it should be noted
that the overall matching is positive and equivalent to
125.3% of capital funds.
Metrobank, which operates under a General License, is a
bank that is focused in the corporate segment, having
started operations in September 1991. Also, it is a wholly
owned subsidiary of Metro Holding Enterprises, Inc., and
in turn has five registered wholly owned subsidiaries,
among which there is Financiera Govimar S.A., which
core business is granting consumer loans mainly to
retirees and customers from the public sector.
As of June 30, 2016, Metrobank's gross loan portfolio
(consolidated) amounts to US$868.5 million, with a
participation of 69.8% of the Bank's total assets.
Compared to 2015, the portfolio shows a 7.1% increase,
both local and foreign, with 5.4% and 14.5% semester
growth, respectively. It is worth highlighting the greater
dynamism in the disbursements towards the foreign
sector; the same registers a 19.8% participation of the
total portfolio as of the analysis cut-off date (7.6% as of
the 2013 closing). It should be noted that the foreign
portfolio is distributed mainly in Guatemala, Mexico,
Ecuador, Trinidad and Tobago, and Costa Rica. Likewise,
in order to face the deceleration of the local economy, the
Bank's Management has the strategy to continue
increasing the disbursements abroad, the same are mainly
destined to companies dedicated to the industrial sector in
the mentioned countries. When analyzing the composition
of the portfolio by economic sector, it can be observed
that even if commercial maintains the first place with a
30.0% participation, the same has been decreasing
consistently throughout the last periods (48.4% as of the
closing of 2014) as a result of the problems in the Colon
Free Zone, which led the Bank to decide diminishing its
Rating History: Entity → BBB.pa (05.30.08), ↑ BBB+.pa
(10.19.09), ↑ A-.pa (10.31.14).

2
exposure in this market. It should be added that the
services and industries sectors are acquiring greater
importance within the Bank's portfolio, reaching
participations of 15.8% and 13.1%, respectively, at the
end of the first semester of 2016. Regarding the portfolio
concentration, the participation of the Top 20 debtors
goes from 22.8% to 27.3% of total gross loans throughout
the last four periods, while the average credit increases
from US$35,219 to US$51,500 in the same time span,
maintaining the growing tendency.
According to what was indicated above, during the first
semester of the period under evaluation, the
nonperforming and past-due balances ratio increases from
0.5% to 1.7%, as a result of the emergence of delays
between 30 and 90 days in some specific loans, in line
with the relative portfolio concentration. It should be
noted that during the first semester the Bank wrote off
US$0.7 million, therefore the real delinquency ratio is
equivalent to 2.2%. The coverage of the past-due and
nonperforming portfolio is 127.7% if we add up the
specific and the dynamic reserve, a level that, even
though it is above the 97.9% coverage observed in the
SBN, the same is below the 452.5% the Bank showed at
the end of 2015. Likewise, when analyzing the portfolio
classification, a decrease in the participation of credits
classified as Pass from 99.1% to 97.2% is observed, due
to the increase of the portfolio classified as Special
Mention from 0.1% to 2.2%. The latter, according to what
was indicated by the Bank's Management, can be
explained due to a requirement of the Superintendency of
Banks of Panama (SBP) to rate the Colon Free Zone
debtors showing profitability problems, without this
necessarily reflecting payment problems for the time
being.
The Bank's investments portfolio remains as the second
greatest earning asset, with a total of US$259.3 million as
of June 30, 2016, with a positive 14.7% variation during
the semester. It should be indicated that 49.9% of the
portfolio consist of local corporate bonds, out of which
33.2% has investment rating equal to or above A- local,
while the remaining balance is not rated. Also, 18.1% and
14.7% of the Bank's investment portfolio is invested in
Sovereign Debt and Treasury Notes issued by the
Government of Panama.
As to funding, deposits remain as the main source of
Metrobank, financing, as of the cut-off date, 79.7% of
total assets (81.2% as of the closing of 2015). Deposits
increased 5.3% during the period analyzed, an evolution
supported mainly by greater local customers' time
deposits. It should be added that out of total deposits,
76.6% corresponds to time deposits, 12.6% to savings
deposits, 9.1% to demand deposits, and 1.7% to interbank
deposits. Likewise, the upward trend in the concentration
in Top deposits is maintained, where the Top 20 support
22.5% of the total (20.7% as of the closing of 2015). On
the other hand, with the objective to migrate towards a
diversification in funding sources, Metrobank increased
borrowings received from third parties by US$40.9
million, which include the structured financing with the
participation of 4 Foreign Banks and Bladex. In this way,
the participation of borrowings within the funding sources
duplicated from 3.1% to 6.2%.
In terms of liquidity, Metrobank maintains adequate
ratios, reflected in a 64.9% Legal Liquidity Ratio, greater
than the 62.0% of 2015 and the 60.2% observed in
average in the NBS. Likewise, the ratio of available funds
over the more volatile deposits (demand and savings
deposits) changed from 168.0% to 174.5% between the
evaluated periods, higher than the 133.3% of the NBS.
However, it should be indicated that the Bank shows
mismatch gaps under contractual scenarios in the terms
under one year, the same represent 97.5% of the Bank's
capital funds, according to what is indicated at the
beginning of this rationale. This condition is partially
mitigated in case an orderly sale of investments was
simulated, that in the first place considers the realization
of titles related to the Government of Panama. In case this
premise is materialized, the 30 days mismatch gap would
represent 30.0% of the capital funds, a moderate
percentage, since the focus of the measuring of the
contractual mismatch is demanding, since the analysis
assumes that the demand and savings deposits are freely
demandable in the short term.
In terms of the Bank's solvency, even though a decrease
of the Capital Adequacy Ratio (CAR) from 15.6% to
14.4% between the periods evaluated is observed, the
ratio is still maintained at a level considered adequate to
sustain the Bank's assets growth. It should be indicated
that the decrease in the CAR is explained by the 9.8%
expansion in risk-weighted assets due to the portfolio
increase and its deterioration, while the capital funds
increased only by 1.1% reaching US$126.4 million.
In the interannual comparative with the first semester of
2015, Metrobank registers a deterioration in its average
profitability ratios on risk-weighted assets (ROARWA),
resulting mainly from the reduction in non-recurring
income, which include: (i) absence of income from sale
of securities, when a gain of US$1.4 million was
generated in the first semester of 2015, and, (ii) the
elimination of income for advisory services and
customers referred from Financiera Govimar that
represented income for US$0.5 million as of June 2015.
The above was partially compensated by: (i) greater
interest earned on loans (+11.6%), allowing a 12.1%
interannual growth in financial income reaching US$32.5
million and, (ii) greater fees earned on loans that
increased from US$1.9 million to US$3.4 million. Thus,
the Bank's net income decreases 10.6% reaching US$6.3
million, with a 19.4% spread (24.4% as of June 2015),
even though it should be stressed out that the greatest
limiting factor to the results is related to the lower
generation of non-recurring income; since the financial
results before reserves1 increased at a greater pace than
the general and administrative expenses (12.0% vs.
5.8%), supporting said consideration.
Finally, Equilibrium will be watching closely the
evolution of Metrobank's portfolio quality, since the same
has been showing impairments resulting in delinquency
levels close to what is observed in the NBS average. This
event is relevant since the loan portfolio is the main
earning asset of the Bank, therefore a greater deterioration
would impact the earning levels. 1 Interest earned – Interest paid + Net fees.

3
Strengths
1. Growth of productive assets generates greater scale and allows the increasing generation of recurring income.
2. Robust technological infrastructure, a factor that has enabled it to generate higher fee income in the last periods.
3. Adequate liquidity ratios, which are complemented by available lines at correspondent banks.
Weaknesses
1. Relative concentration in deposits as liability funding source.
2. Relative concentration in the loan portfolio.
3. Negative contractual position in buckets below 1 year in the maturity matching, albeit the overall matching is positive and
equivalent to 125.3% of capital funds.
Opportunities
1. Technological and service infrastructure that would allow cross-selling.
2. Synergies between the Bank and its subsidiaries’ operations.
3. Gradual increase of geographic loan portfolio diversification.
4. Country’s economy with good medium-term growth projections.
Threats
1. Strong competition in local market exerts pressure on spreads and demands permanent renewal of comparative advantages
that will allow the reduction of interest rate risks.
2. Local and international credit and price variation risks.
3. At the banking sector level, the system as a whole has relative sensitivity in the presence of reputational risk events.

4
CORPORATE DESCRIPTION
Corporate Governance
Metrobank, S.A. and Subsidiaries, is a Panamanian capital
private entity operating in Panama since 1991 under a
General License granted by the Superintendency of Banks
of Panamá (SBP), which allows it to carry out banking
activities that take effect anywhere in the Republic of
Panamá or abroad.
Metrobank is owned 100% by Metro Holding Enterprises,
Inc., which does not have any other investment. In turn,
Metrobank maintains full control of 5 subsidiary
companies, which provide services that complement the
Bank's typical operation.
Metrobank's Economic Group Structure
Source: Metrobank / Prepared by: Equilibrium
Subsidiary Course of Business
Metroleasing, S.A. Leasing of equipment. It began operating
in April 1995.
Eurovalores, S.A
Financial intermediation, securities
brokerage and other related services. It began operating in August 2005.
Financiera Govimar,
S.A.
Personal loans, mainly under the
modality of direct discount. It is a subsidiary since April 2008.
Metrotrust, S.A. Trust Business. It began operating in
May 2013.
Metrofactoring, S.A. Purchase at a discount of invoices issued by third parties. It began operating in
January 2014.
As of the date of this report, the Board of Directors is
composed in the following manner:
Title Name
Director - President Eric Cohen Solis
Director - Vice-President Roy Katz Rabinovich
Director - Treasurer Eduardo Orillac Motta
Director - Secretary Juan Pablo Fábrega Polleri
Director - Deputy Treasurer Ernesto A. Boyd Sasso
Director - Deputy Secretary Orlando López Arosemena
Director Joseph Fidanque W.
Director Ramesh Chatlani
Director Óscar López Arosemena
Director Rafael Bárcenas P.
Director Abraham Assis
Independent Director Paul Smith Alegre
Independent Director Robert Boyd
Alternate Director Enrique Díaz López
Alternate Director Murad Moisés Harari Dabah Source: Metrobank / Prepared by: Equilibrium
The Board of Directors and management promote the
creation of the organization, processes and tools adequate
for the control and transparency of operations. Likewise,
Audit, Assets and Liabilities (ALCO), Risks, Compliance,
Credit, Human Resources, and Top Management
committees meetings are held, which promote the
strengthening of sound governance practices.
Business Strategy
Metrobank fosters a business strategy focused in
conducting financial transactions with, mostly, corporate
profile customers. Moreover, the products and services
offered by the Bank are geared, to a great extent, towards
the Corporate Banking and Private Banking segments,
while Financiera Govimar acts as the Consumer Banking
area, which constitutes a complement to the above-
mentioned strategy.
It should be noted that Metrobank has expanded its
operational infrastructure during the last years, which led to
greater asset volumes and income received, without
incurring in significant changes in the strategic focus. Bank
has made efforts to continue strengthening its lines of
business and stimulating products cross-selling, also
integrating services based on technology, in order to further
enhance its competitive advantages into the future.
One of the aspects that favor the Bank's operation is its
technological infrastructure, considered robust from the
point of view of controls, effectiveness, management
information, customer service and development of
products/services that generate fees and other income. Of
special interest, Metrobank has formalized relationships
with multiple prestigious companies nationwide, through
the offer of merchant acquisition and the Mobile Cash
services, which show a growing trend in recent years.
Regarding the administration of subsidiaries, Management
arranged for the homologation of Financiera Govimar to
the Bank with respect to: controls, processes, procedures
and policies, with the objective to integrate this subsidiary
at the operational (as the Consumer area of the Entity) and
corporate governance levels. In this way, Govimar remains
focused on granting personal loans using direct discount to
retirees and public sector officers or employees, thus, in
this sense, the strategy has remained consistent. On the
other hand, albeit the Eurovalores business holds a smaller
market share than other stock brokerage firms operating in
the local market, this company has shown a gradual growth
during the last years in terms of assets under administration
and traded transactions volume.
It should be noted that Financiera Govimar is the main
subsidiary of Metrobank, contributing 35.3% of the
consolidated net income as of June 30, 2016 (27.2% as of
June 30, 2015). Financiera Govimar's net income amounts
to US$2.2 million as of June 30, 2016, showing a 15.8%
interannual growth mainly as a result of greater loan fees
income and lower reserves expenses. It is important to
indicate that Govimar's gross loan portfolio was US$71.1
million as of June 30, 2016, with a 2.2% past-due and non-
performing ratio (US$68.7 million and 2.4% as of June 30,
2015, respectively).

5
65.9% 65.3%56.9%
68.6% 63.2%52.3%
30.1% 32.4%
32.8%
27.2%31.6%
35.3%
4.0% 2.3%10.4%
4.2% 5.2%12.4%
2012 2013 2014 Jun.15 2015 Jun.16
Contribution to Net Profit by Subsidiary
Other Subsidiaries
Govimar
Metrobank
Source: Metrobank / Prepared by: Equilibrium
ECONOMIC ANALYSIS
International Environment
In general, the main events happening in the world
economic sphere in recent periods define a mixed picture
for the different countries and regions during 2016.
In the first place, an economic recovery has been observed
in the United States (main trade partner of Latin America)
and a subsequent strengthening of the American Dollar.
The preceding, together with better expectations in the
unemployment and inflation on the part of the United
States, caused the Federal Reserve (FED) to increase
interest rates in December 2015 up to 0.50% from 0.25%.
FED does not expect to increase rates in the short-term,
although it does not rule out to increase interest rates in the
mid- and long-terms.
In contrast, should this scenario materialize, the outlook of
emerging countries worldwide could become more
aggravated, especially regarding the continuity in the
devaluation of their respective currencies, the rising cost of
their debt contracted in Dollars, and possible more
restrictive policies regarding their fiscal policies, all of
which would have repercussions in the payment capacity of
persons and companies located in said countries.
On the other hand, there are other unfavorable factors such
as the pressure suffered by commodities prices, the marked
downward trend experienced by oil prices and other
commodities, as well as the divergence in the application
of monetary policies applied by some advanced economies,
especially in the Euro Zone. Added to this, the exit of Great
Britain from the European Union during June resulted in
even more political and monetary uncertainty to the Old
Continent, added to the fact that the markets have reacted
adversely to said event.
Not less important are the adverse collateral effects on the
Latin-American emerging economies, such as smaller
growth of the primary and secondary sectors (especially
due to the ability to export goods and commodities), a
smaller leeway for Governments to face their fiscal
deficits, as well as greater restrictions for public and
private investment, especially in those economies that, in
addition, experience political imbalances. In particular, the
International Monetary Fund (IMF) has calculated that the
drop in commodities has fluctuated between 30% and 50%
depending on the country, which has had an impact in the
export volume income, especially in South American
countries.
Very much in line with the above, China continues
showing a deceleration in its economic growth; at the same
time that it also decreased its goods import and export
volumes during el 2015. Since China is currently the
second biggest trade partner of Latin America and an
important investment source for the region, it should be
mentioned that these elements influence, to a great extent,
the behavior of emerging countries. As long as a
weakening of the Chinese economy (together with the
Yuan) continues, it is probable that the Latin American
countries will need to diversify in order to adapt to this
environment.
For the time being, the IMF has projected a 3.2% growth of
the worldwide Gross Domestic Product (GDP) during 2016
(compared to the 3.1% during 2015), observing stable
growths in the Euro Zone, the United States, and other
advance economies; while, on the other hand, global
growth for Latin America would be -0.5%, mainly due to
the strong economic recession that Brazil is undergoing.
According to this international organization, the worldwide
economic growth would show a moderate trend again
starting in 2017, once the conditions of emergent
economies are normalized, together with more favorable
macroeconomic conditions regarding commodities.
-6%
-4%
-2%
0%
2%
4%
6%
8%
10%
12%
2010 2011 2012 2013 2014 2015 2016 (P) 2017 (P) 2018 (P)
Comparative GDP Annual Growth
United States China Euro Zone Brazil Latin America and The Caribbean World
Source: International Monetary Fund / Prepared by: Equilibrium
A positive aspect is that Brazil started to recover
economically and politically beginning in the second half
of 2016. Thus, it is expected that the Brazilian and Latin
American economic growth in general recover more
quickly that what was initially estimated. Also, investors
may experience partial relief in their fixed-rate securities
portfolios related to the Brazilian country.
Local Economy
The Panamanian economy is set to be the most dynamic
among the main Latin American countries, since its real
GDP growth result was 5.8% for 2015, above the figures
submitted by other countries from the region, including
those with international investment grade, even with the
real GDP showing a slight deceleration when compared to
previous years’ growth.
The sectors that have been the top contributors to this
dynamism were construction, commercial activity,
financial intermediation, real estate and rental activities, as
well as transportation, warehousing, and communications;
as has been during the last years, based on the national

6
macroeconomic model oriented towards the tertiary sector,
namely, Services.
According to the figures presented by the General
Comptroller's Office of the Republic, the real GDP growth
was 4.9% for the first semester of 2016, which could
indicate a growth below what was initially projected, albeit
it should be taken into account that it did not include the
recent opening of the Expanded Canal (inaugurated on
June 26, 2016), that may increase the economic activity
level within the national territory for the rest of the year.
Additionally, important infrastructure works are planned,
among which we have the construction of Line 2 of the
Subway (Metro), the expansion of the Tocumen
International Airport, the construction of new ports and
logistics parks, the expansion of the electrical transmission
infrastructure, among other future megaprojects; where the
construction of a fourth bridge over the Panama Canal,
together with the construction of a third line of the Subway
(Metro), are already contemplated for the end of the
present decade.
On the other hand, the Economy and Finance Ministry
(MEF, per its acronym in Spanish) has revealed that,
according to preliminary figures, the accumulated fiscal
deficit for 2015 represents 2.0% of the nominal GDP,
meaning an improvement in relation to the 3.4% seen the
previous year. The Government has made efforts to reduce
the weight of expenses from subsidies and encourage an
increase in taxpaying, and consequently the fiscal deficit
represented 0.2% of the nominal GDP as of the closing of
the first quarter of 2016, which is consistent with the 1.5%
limit set forth by the Social Fiscal Responsibility Law
(LRSF, per its acronym in Spanish).
An important aspect revolves around LRSF, since the
Government has promulgated amends with the intention of
maintaining a maximum deficit level for the different
periods. This deficit may be adjusted depending on the
contribution from income generated by the Panama Canal
to the nominal GDP. That is why the Panama Canal
Expansion has been a transcendental event for the country,
since with it there would also be an increase in the
contribution of the interoceanic way to almost 45% starting
in 2017, as well as a 40% increase in investments aimed at
the logistics sector in said period, according to the MEF
estimates.
In this context, the main challenge of the local economy is
centered in the public finance management and the
execution of the budget on the part of the current
Government Administration, without compromising the
public debt or the fiscal deficit, thus revenues collection, a
controlled indebtness, and an efficient use of public
expenses would allow maintaining Panama's soundness as
a country.
RISK MANAGEMENT
The Bank's Risks area is led by a Comprehensive Risks
Assistant Vice-President, which is supported by the differ-
ent units for each one of the different types of risk. At the
corporate governance level, the Bank holds Risk Commit-
tees every month, where eight directors participate in order
to maintain the Board of Directors informed about the
capacity of the Bank to face the different risks it could be
exposed to. Also, a Risks Committee corresponding to
Financiera Govimar is held with a bimonthly frequency. In
addition, the risks management carried out by the Entity is
focused in ensuring adherence to policies and parameters
defined by the Board of Directors by Management at all
times, in order to control risk exposures regarding net
stockholders' equity.
The Bank also has a Corporate Governance and Compli-
ance Vice-President as part of the strategies to strengthen
Metrobank's risk management and control framework and
work under the CRC (Corporate Governance, Risk, Com-
pliance) structure.
Credit Risk
The main evaluation criterion for this type of risk consists
of the exposure of the loan portfolio on the Bank's total
credit and on the net stockholders' equity. Therefore,
Metrobank analyzes the behavior of credit balances
according to product type, debtor economic activity,
geographic sector, among other criteria. Of particular
interest, the Board of Directors assigns global limits for
each country where it wants to participate, thus the Bank
places special emphasis on complying with said exposure
limits not only at loans' level, but also at the interbank
placings and financial investments, as a whole. The
countries chosen by the Board of Directors must meet a
series of requirements, with the main one being holding a
sovereign investment grade rating.
Additionally, the Bank monitors the concentration degree
exercised by its main economic groups, including their
credit balance and the different types of tangible collateral
supporting said facilities. The behavior of credit exposure
with related parties is also observed.
The risks area also monitors the Bank's nonperforming,
past-due and restructured loans, where measures to be
taken are evaluated for each one, as the case may be. This
includes assignment of specific reserves according to the
loans classified pursuant to Agreement 04-2013, review of
collaterals, and legal procedures to take on, in case the
need exists.
The Bank has implemented an internal scoring system for
the Corporate Banking loan portfolio, which objective is to
assign an internal rating based on specific qualitative and
quantitative criteria, according to its risk profile. This is
particularly useful when submitting credit proposals to the
different committees, as well as when following up the
credit behavior of each debtor.
It is worth mentioning that the Bank exercises a periodic
monitoring of the customers' files, both at the Head Office
and branches levels, as a quality control measure.
Market Risk
Market risk in Metrobank is focused in its investments
portfolio. Therefore, the Assistant Vice-President monitors
specific variables of the portfolio, such as average yield,
type of instrument, type of industry of the issuer, risk
rating, average duration, participation of investments on
total credits, proportion of securities issued abroad,

7
unrealized gain/loss amount, among other. Albeit foreign
securities (outside of Latin America) are managed by an
external custodian, the Bank monitors its positions in these
securities in the same manner as its local investments.
As an additional point, the Bank also oversees the
evolution of the VaR and CVaR (Conditional Value at
Risk), so that the maximum loss limits allowed regarding
net stockholders' equity are complied with.
Liquidity Risk
The risks area has prepared procedures for the activation of
the Contingency Plan, which has several levels depending
on the need for liquidity at a given time. The use of repos,
lines of credit, and the renewal of bank borrowings from
banks would be contemplated in case the legal liquidity
rate approaches the regulatory limit.
At the same time, the Board of Directors is kept informed
about the evolution of the concentration degree of Top
depositors, including the different types of deposits they
have in the Bank and those that are pledged as collateral of
the loan portfolio.
The Bank conducts a periodic review of liquidity levels it
maintains in the balance sheet, including the average legal
liquidity ratios (regulatory) and the immediate liquidity
ratio, which is an internal measure of the institution that
takes into consideration a more stringent deposits base.
This analysis is complemented through the monthly
monitoring of the liquidity matching position under
contractual and under renewal statistics scenarios, in turn
supported by overseeing the renewal percentages of time
deposits and the volatility ratios of the different types of
financial liabilities.
Operational Risk
The Assistant Vice-President has homologated the
incidents reporting system for both Metrobank and
Financiera Govimar, in order to monitor the operational
risk of both entities simultaneously.
The Entity has a software through which each area reports
operational risks events, in order to duly follow-up
afterwards with the help of a preventive actions matrix.
As part of its main objectives, the operational risks area has
been able to evaluate all the risks inherent to the identified
processes. The Bank presents its Board of Directors a
summary of these processes by credit product or
management area, as they are updated in the risk matrix.
This way, a constant update of the corresponding risk
matrixes is maintained, so that the areas owning the
processes, implement measures to control the possible risks
observed, supervised by the Comprehensive Risks area.
After considering the controls applied to the inherent
losses, the Bank obtains a residual loss figure, which is
compared to the limit assigned by the Board of Directors.
This allows showing a refined analysis of the main areas or
processes that should be reinforced, in order to reduce
future residual losses.
Metrobank continues developing the Business Impact
Analyses (BIA) for each one of the Bank's processes with
the objective to continue reinforcing its current Business
Continuity Plan to ensure operability in case of
technological failures or external events.
REGULATORY ASPECTS
Regulatory Framework for Capital Adequacy
On February 03 of 2015, the SBP issued Agreement 01-
2015, which sets forth new requirements for the
categorization of the capital funds computable for the
calculation of the Capital Adequacy Ratio (CAR). This
Agreement is applicable to the official banks, a General
License Banks, all International License Banks where the
SBP is the home country supervisor and to all the owners
of bank stock of banking groups that consolidate in
Panama and that the SBP is the home country supervisor.
The Agreement requires compliance with minimum
percentages of adequacy, according to the classification of
capital funds parameters. The components of each one of
the types of capital accepted by the regulation: ordinary
Tier 1 capital, additional Tier 1 capital, and Tier 2 capital
will be determined.
The minimum percentage of Capital Adequacy will
continue being 8%, as it is required under Agreement 05-
2008. However, the new Agreement establishes limits for
the Tier 1 capital, which will increase gradually, until the
adequation periods have elapsed.
The ordinary Tier 1 capital will consist of common shares,
retained and current period earnings, regulatory reserves,
and other elements included in the Agreement. The
calculation of Tier 1 capital according to the new
Agreement deducts Goodwill, in addition to other items or
regulatory adjustments that are not taken into account in
the current regulation. For example, the following are
mentioned:
Accumulated and current
period losses Other intangible assets
Shareholdings greater than
10% in the stockholders'
equity of financial entities
that do not consolidate to in
the Bank
Shareholdings in non-
financial entities included in
the financial consolidation
(greater than 10%)
Unrealized losses on
securities available for sale
Other adjustments
contemplated in the
Agreement
It is worth mentioning that retained and current period
earnings must be validated by the external auditors, in
order to ensure the deduction of every possible,
foreseeable expense, interest, or dividend from said profits.
After applying the corresponding regulatory adjustments,
the resulting ordinary Tier 1 capital must be greater than
4.5% of risk-weighted assets as of January 01, 2019, at the
same time that the total Tier 1 capital must be, as a
minimum, 6% on that date. The SBP will grant an
adequation period to the norm according to the following
table, in which the requirement dates are indicated, starting
July 01, 2016:

8
Type of
capital 07/01/16 07/01/17 01/01/18 01/01/19
Ordinary Tier 1 Capital
3.75% 4.00% 4.25% 4.50%
Total Tier 1
Capital 5.25% 5.50% 5.75% 6.00%
Total capital 8.00% 8.00% 8.00% 8.00%
Source: Superintendency of Banks of Panama
The additional Tier 1 capital will consist of equity
instruments with certain characteristics, among which the
non-cumulative preferred stock, without early redemption
clauses, perpetual, among other characteristics, will be
contemplated. The Bank can comply with the total Tier 1
capital requirement using these instruments, as long as it
complies with the ordinary Tier 1 capital percentage.
On the other hand, Tier 2 capital will continue consisting
of the subordinated bonds or other hybrid capital
instruments that do not meet the characteristics to be
considered additional Tier 1 capital. The Bank can reach
the minimum 8% adequacy using these instruments, as
long as it complies with the total Tier 1 capital levels
required.
The aforementioned will also apply for all the banks that
are subsidiaries of regulated banks, which home country
supervisor is the SBP. That is, the Bank not only has to
comply with the percentages on a consolidated basis, but
also individually, including all the banks that are a part of
the economic group.
The new Agreement will also establish compliance with a
Leverage Coefficient, which is calculated dividing the
ordinary Tier 1 capital by the sum of on- and off-balance
sheet non-weighted assets established by the SBP. The
minimum of this coefficient will be 3.00%. It should be
indicated that, according to information furnished by
Metrobank, the CAR would change from 14.4% to 14.1%
according to the partial parameters to be applied for the
new agreement as of the analysis cut-off.
FINANCIAL PERFORMANCE
METROBANK, S.A. AND SUBSIDIARIES
Assets and Credit Quality
Metrobank's consolidated assets as of June 30, 2016
amount to US$1,245.0 million, 7.3% higher than what it
showed as of the closing of 2015. The assets' growth is
associated to the expansion of the loan portfolio and the
increase in the investments portfolio balance. It should be
added that, interannually, both items mentioned also
support the 11.2% growth of total assets, thus Metrobank
registers a 12.5% average annual growth of assets during
the last four analyzed periods.
11.5% 12.4% 11.4% 10.0% 10.6% 9.3%
17.3% 17.7% 20.6% 20.7% 19.5% 20.8%
67.4% 66.8% 64.7% 66.1% 67.1% 67.2%
3.7% 3.2% 3.3% 3.2% 2.8% 2.7%
0.0%
5.0%
10.0%
15.0%
20.0%
25.0%
30.0%
35.0%
0%
10%
20%
30%
40%
50%
60%
70%
80%
90%
100%
2012 2013 2014 Jun.15 2015 Jun.16
Assets Evolution and Composition
Other
Loans
Investments
Cash and duefrom banks
AssetsAnnualGrowth %
Source: Metrobank and SBP / Prepared by: Equilibrium
Regarding Metrobank's gross loans portfolio, it totals
US$868.5 millions, after a 7.1% expansion compared to the
balance registered as of the closing of 2015. Said growth
occurs both in the local and foreign portfolio, with 5.4%
and 14.5% increases, respectively. The greater dynamism
shown by the disbursements towards the foreign sector
should be highlighted, mainly in Central America,
throughout the last years evaluated, a situation that is also
associated to the Bank's strategy to face the deceleration of
the local economy. In this sense, the participation of
foreign loans reaches 19.8% as of June 30, 2016, from the
18.5% and 15.2% registered as of the closing of December
and June of 2015, respectively.
536.1 607.5 633.2 657.2 660.6 696.5
33.1 49.894.7 117.8 150.2
172.0
Dec.12 Dec.13 Dec.14 Jun.15 Dec.15 Jun.16
Evolution of the Loan Portfolio (in millions of USD)
Local credits Foreign credits
Source: Metrobank / Prepared by: Equilibrium
It should be indicated that the disbursements abroad are
distributed mainly in Guatemala (3.4%), Mexico (3.2%),
Ecuador (1.6%), Trinidad and Tobago (1.5%), and Costa
Rica (1.5%).
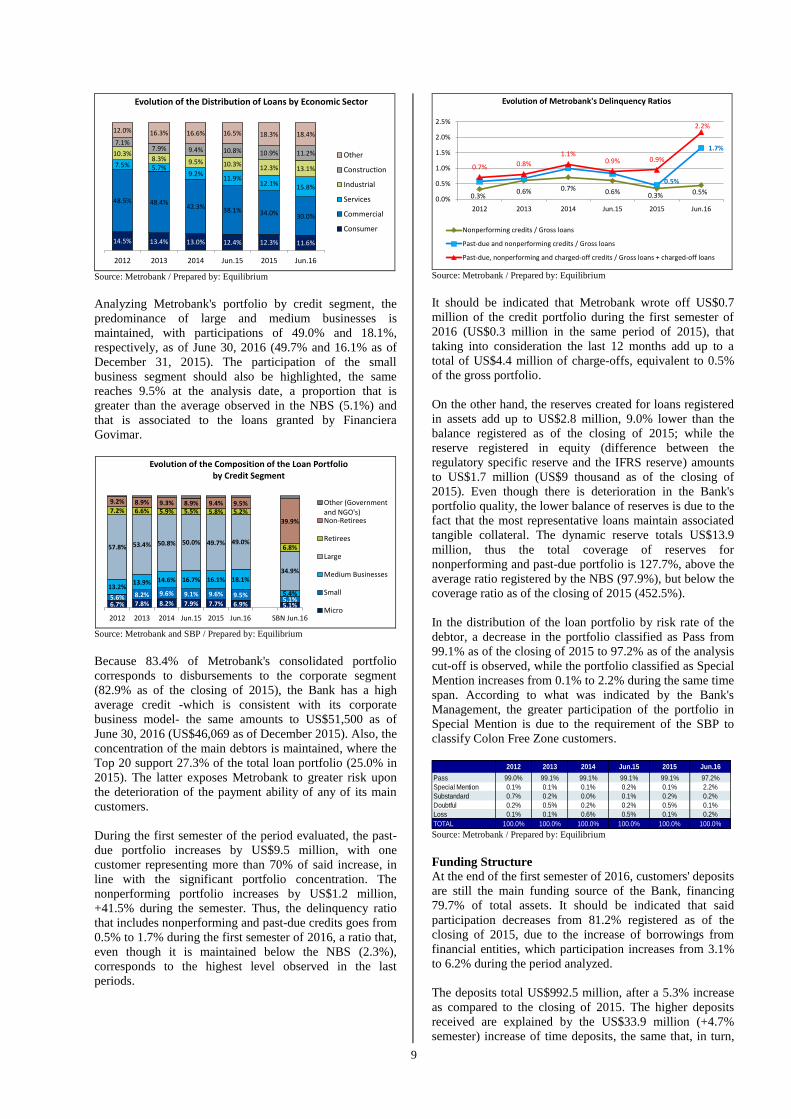
When analyzing the composition of the portfolio by
economic sector, the commercial sector remains in the first
position with 30.0%; however, its participation has
decreased gradually throughout the last periods evaluated,
as a result of greater dynamism in the disbursements to
other economic sectors and less financing of Colon Free
Zone companies. The sectors showing greater activity
within Metrobank's portfolio are services, industrial and
construction. It should be indicated that during the
evaluated semester the sector with greater growth was
services, since the disbursements increased by 39.1%,
placing it in second place in the portfolio composition with
a 15.8% participation.
9
14.5% 13.4% 13.0% 12.4% 12.3% 11.6%
48.5% 48.4%42.3% 38.1% 34.0% 30.0%
7.5% 5.7%9.2%
11.9%12.1% 15.8%
10.3%8.3% 9.5% 10.3%
12.3% 13.1%
7.1%7.9% 9.4% 10.8% 10.9% 11.2%
12.0% 16.3% 16.6% 16.5% 18.3% 18.4%
2012 2013 2014 Jun.15 2015 Jun.16
Evolution of the Distribution of Loans by Economic Sector
Other
Construction
Industrial
Services
Commercial
Consumer
Source: Metrobank / Prepared by: Equilibrium
Analyzing Metrobank's portfolio by credit segment, the
predominance of large and medium businesses is
maintained, with participations of 49.0% and 18.1%,
respectively, as of June 30, 2016 (49.7% and 16.1% as of
December 31, 2015). The participation of the small
business segment should also be highlighted, the same
reaches 9.5% at the analysis date, a proportion that is
greater than the average observed in the NBS (5.1%) and
that is associated to the loans granted by Financiera
Govimar.
6.7% 7.8% 8.2% 7.9% 7.7% 6.9% 5.1%5.6% 8.2% 9.6% 9.1% 9.6% 9.5%
5.1%
13.2%13.9% 14.6% 16.7% 16.1% 18.1%
5.4%
57.8% 53.4% 50.8% 50.0% 49.7% 49.0%
34.9%
7.2% 6.6% 5.9% 5.5% 5.8% 5.2%
6.8%
9.2% 8.9% 9.3% 8.9% 9.4% 9.5%
39.9%
2012 2013 2014 Jun.15 2015 Jun.16 SBN Jun.16
Evolution of the Composition of the Loan Portfolioby Credit Segment
Other (Governmentand NGO's)Non-Retirees
Retirees
Large
Medium Businesses
Small
Micro
Source: Metrobank and SBP / Prepared by: Equilibrium
Because 83.4% of Metrobank's consolidated portfolio
corresponds to disbursements to the corporate segment
(82.9% as of the closing of 2015), the Bank has a high
average credit -which is consistent with its corporate
business model- the same amounts to US$51,500 as of
June 30, 2016 (US$46,069 as of December 2015). Also, the
concentration of the main debtors is maintained, where the
Top 20 support 27.3% of the total loan portfolio (25.0% in
2015). The latter exposes Metrobank to greater risk upon
the deterioration of the payment ability of any of its main
customers.
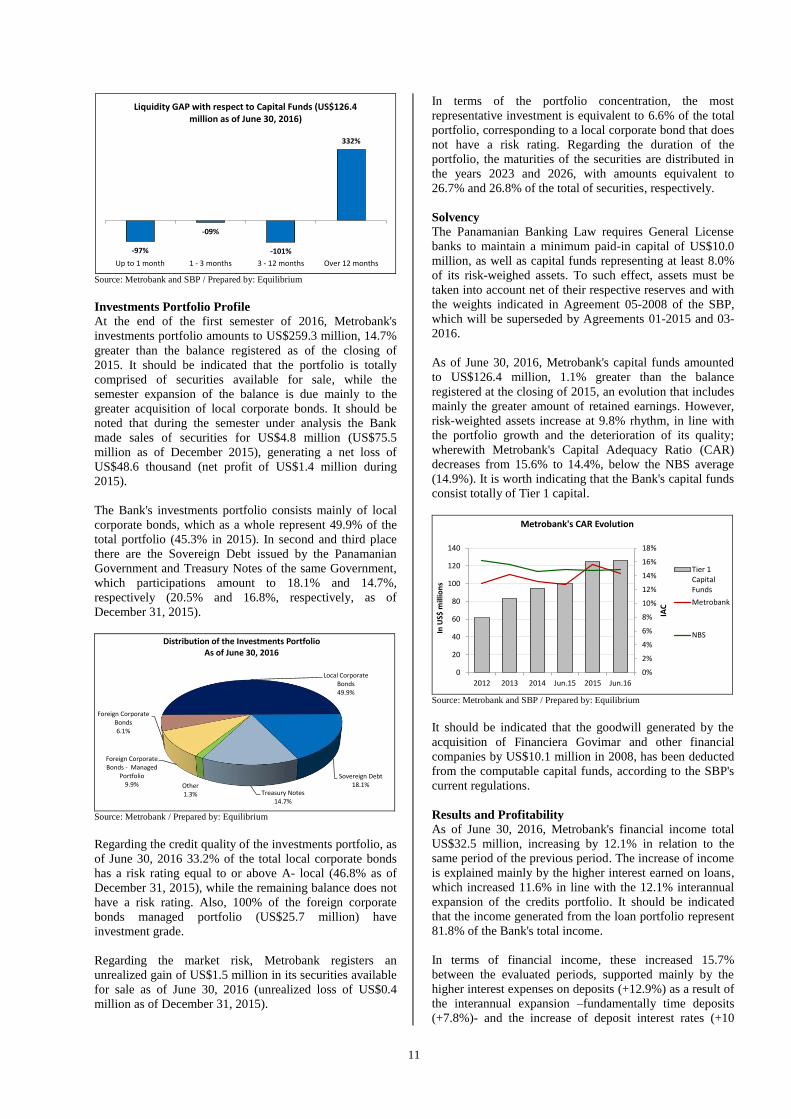
During the first semester of the period evaluated, the past-
due portfolio increases by US$9.5 million, with one
customer representing more than 70% of said increase, in
line with the significant portfolio concentration. The
nonperforming portfolio increases by US$1.2 million,
+41.5% during the semester. Thus, the delinquency ratio
that includes nonperforming and past-due credits goes from
0.5% to 1.7% during the first semester of 2016, a ratio that,
even though it is maintained below the NBS (2.3%),
corresponds to the highest level observed in the last
periods.
0.3%0.6% 0.7% 0.6% 0.3% 0.5%
0.5%
1.7%
0.7% 0.8%
1.1%0.9% 0.9%
2.2%
0.0%
0.5%
1.0%
1.5%
2.0%
2.5%
2012 2013 2014 Jun.15 2015 Jun.16
Evolution of Metrobank's Delinquency Ratios
Nonperforming credits / Gross loans
Past-due and nonperforming credits / Gross loans
Past-due, nonperforming and charged-off credits / Gross loans + charged-off loans
Source: Metrobank / Prepared by: Equilibrium
It should be indicated that Metrobank wrote off US$0.7
million of the credit portfolio during the first semester of
2016 (US$0.3 million in the same period of 2015), that
taking into consideration the last 12 months add up to a
total of US$4.4 million of charge-offs, equivalent to 0.5%
of the gross portfolio.
On the other hand, the reserves created for loans registered
in assets add up to US$2.8 million, 9.0% lower than the
balance registered as of the closing of 2015; while the
reserve registered in equity (difference between the
regulatory specific reserve and the IFRS reserve) amounts
to US$1.7 million (US$9 thousand as of the closing of
2015). Even though there is deterioration in the Bank's
portfolio quality, the lower balance of reserves is due to the
fact that the most representative loans maintain associated
tangible collateral. The dynamic reserve totals US$13.9
million, thus the total coverage of reserves for
nonperforming and past-due portfolio is 127.7%, above the
average ratio registered by the NBS (97.9%), but below the
coverage ratio as of the closing of 2015 (452.5%).
In the distribution of the loan portfolio by risk rate of the
debtor, a decrease in the portfolio classified as Pass from
99.1% as of the closing of 2015 to 97.2% as of the analysis
cut-off is observed, while the portfolio classified as Special
Mention increases from 0.1% to 2.2% during the same time
span. According to what was indicated by the Bank's
Management, the greater participation of the portfolio in
Special Mention is due to the requirement of the SBP to
classify Colon Free Zone customers.
2012 2013 2014 Jun.15 2015 Jun.16
Pass 99.0% 99.1% 99.1% 99.1% 99.1% 97.2%
Special Mention 0.1% 0.1% 0.1% 0.2% 0.1% 2.2%
Substandard 0.7% 0.2% 0.0% 0.1% 0.2% 0.2%
Doubtful 0.2% 0.5% 0.2% 0.2% 0.5% 0.1%
Loss 0.1% 0.1% 0.6% 0.5% 0.1% 0.2%
TOTAL 100.0% 100.0% 100.0% 100.0% 100.0% 100.0% Source: Metrobank / Prepared by: Equilibrium
Funding Structure
At the end of the first semester of 2016, customers' deposits
are still the main funding source of the Bank, financing
79.7% of total assets. It should be indicated that said
participation decreases from 81.2% registered as of the
closing of 2015, due to the increase of borrowings from
financial entities, which participation increases from 3.1%
to 6.2% during the period analyzed.
The deposits total US$992.5 million, after a 5.3% increase
as compared to the closing of 2015. The higher deposits
received are explained by the US$33.9 million (+4.7%
semester) increase of time deposits, the same that, in turn,

10
represent 76.6% of the total takings of Metrobank. It
should be indicated that the increase of times deposits is
due mainly to local deposits, that represent 91.1% of the
total of this type of funding. Savings deposits advanced
5.3%, with a 12.6% participation of total deposits; while
demand deposits represent 9.1% of total deposits after
registering a 1.5% semester increase.
83.6 89.2 113.9 99.8 89.2 90.588.6 101.0
124.8 123.1 118.4 124.7
434.1540.6
636.2705.3
726.4 760.3
0%
5%
10%
15%
20%
25%
30%
0
200
400
600
800
1000
1200
2012 2013 2014 Jun.15 2015 Jun.16
Mill
on
s o
f U
S$
Evolution of Deposits
Interbank timedeposits
Customers'time deposits
Savingsdeposits
Demanddepostis
Total DepositsAnnualVariation %
Source: Metrobank and SBP / Prepared by: Equilibrium
On the other hand, the upward trend in the concentration of
Metrobank's Top depositors observed since 2014 is
maintained. In this sense, the Top 10 depositors represent
14.0% of total deposits, while the Top 20 represent 22.5%
of total takings as of the analysis cut-off date (12.5% and
20.7%, respectively, as of December 31, 2015). It should
be indicated that depositors concentration risk is partially
mitigated by the high renewal ratio of time deposits, with
81% at the evaluated date.
12.6%11.5% 11.0%
12.3% 12.5%14.0%
20.0%18.9% 18.1%
20.1% 20.7%22.5%
2012 2013 2014 Jun.15 2015 Jun.16
Evolution of the Concentration of Top Depositors
Top 10
Top 20
Source: Metrobank / Prepared by: Equilibrium
Regarding obligations with third parties, these increase
US$40.9 million during the first six months of the current
period, totaling US$77.4 million. The increase is due
mainly to a line taken with Bladex for US$40.0 million
(US$10.0 million as of the closing of 2015), the same that
expires in May 2019.
It should be indicated that Metrobank maintains repo lines
for US$15.0 million (US$27.5 million as of December 31,
2015), which expire in August 2016, which are secured
with securities available for sale registered in the Bank's
investments portfolio for US$21.0 million.
80.5% 81.4% 83.8% 84.4% 81.2% 79.7%
9.2% 10.3% 10.1% 9.9% 11.6% 11.2%
2012 2013 2014 Jun.15 2015 Jun.16
Evolution of Funding Sources
Other
Equity
Securities sold underrepurchase agreements
Borrowings
Deposits
Source: Metrobank and SBP / Prepared by: Equilibrium
Stockholders' equity remains in the second place in the
Bank's funding sources, with a 11.2% participation
equivalent to of total assets as of the analysis cut-off
(11.6% as of December 2015). Said item shows a 3.7%
increase in relation to the closing of the previous period,
due to the US$7.4 million increase of retained earnings.
Liquidity and Maturity Matching
As of June 30, 2016, Metrobank's available funds amount
to US$375.5 million, registering a 7.7% variation during
the first six months of the current period. Said evolution is
explained by the 14.7% expansion of the investments
portfolio, item that represents 69.1% of the Bank's total
funds available. Demand deposits due from banks represent
25.0% of total funds available, which dropped 4.6% when
compared to the closing of the previous period.
The increase of funds available at a faster rhythm than
deposits allowed that the coverage of the first on demand
and savings takings increase from 168.0% to 174.5%
during the evaluated period, a ratio above the 133.3%
observed in the NBS average. Also, if the coverage was
measured on total deposits, the ratio improves from 37.0%
to 37.8%; however, it still remains behind the 45.6%
observed in the NBS.
Metrobank's average Legal Liquidity Ratio was 64.9% as
of June 30, 2016 (62.0% as of December 31, 2015),
remaining higher than the average NBS (60.2%) ratio, a
situation associated with the funding type used by the
Bank.
Regarding the liquidity contractual matching, at the end of
the first semester of 2016 Metrobank presents a deficit
position in all the buckets under one year, originated by the
maturity of deposits. In this sense, in the bucket under 30
days the deficit position is equivalent to 97.5% of capital
funds, while for the buckets from 01 to 03 months and
from 03 to 12 months, the mismatch is equivalent to 8.9%
and 100.6% of capital funds, respectively. On the other
hand, in the bucket over one year, the position is a surplus
and equivalent to 332.3% of the total capital funds, the
same is explained by the participation in the maturities of
the securities portfolio and of the loans portfolio in said
bucket. It should be noted that on an aggregate basis
Metrobank's contractual matching is positive and
equivalent to 125.3% of the total of capital funds.
11
-97%
-09%
-101%
332%
Up to 1 month 1 - 3 months 3 - 12 months Over 12 months
Liquidity GAP with respect to Capital Funds (US$126.4 million as of June 30, 2016)
Source: Metrobank and SBP / Prepared by: Equilibrium
Investments Portfolio Profile
At the end of the first semester of 2016, Metrobank's
investments portfolio amounts to US$259.3 million, 14.7%
greater than the balance registered as of the closing of
2015. It should be indicated that the portfolio is totally
comprised of securities available for sale, while the
semester expansion of the balance is due mainly to the
greater acquisition of local corporate bonds. It should be
noted that during the semester under analysis the Bank
made sales of securities for US$4.8 million (US$75.5
million as of December 2015), generating a net loss of
US$48.6 thousand (net profit of US$1.4 million during
2015).
The Bank's investments portfolio consists mainly of local
corporate bonds, which as a whole represent 49.9% of the
total portfolio (45.3% in 2015). In second and third place
there are the Sovereign Debt issued by the Panamanian
Government and Treasury Notes of the same Government,
which participations amount to 18.1% and 14.7%,
respectively (20.5% and 16.8%, respectively, as of
December 31, 2015).
Foreign Corporate Bonds - Managed
Portfolio9.9%
Foreign Corporate Bonds6.1%
Local Corporate Bonds49.9%
Sovereign Debt18.1%
Treasury Notes14.7%
Other1.3%
Distribution of the Investments Portfolio As of June 30, 2016
Source: Metrobank / Prepared by: Equilibrium
Regarding the credit quality of the investments portfolio, as
of June 30, 2016 33.2% of the total local corporate bonds
has a risk rating equal to or above A- local (46.8% as of
December 31, 2015), while the remaining balance does not
have a risk rating. Also, 100% of the foreign corporate
bonds managed portfolio (US$25.7 million) have
investment grade.
Regarding the market risk, Metrobank registers an
unrealized gain of US$1.5 million in its securities available
for sale as of June 30, 2016 (unrealized loss of US$0.4
million as of December 31, 2015).
In terms of the portfolio concentration, the most
representative investment is equivalent to 6.6% of the total
portfolio, corresponding to a local corporate bond that does
not have a risk rating. Regarding the duration of the
portfolio, the maturities of the securities are distributed in
the years 2023 and 2026, with amounts equivalent to
26.7% and 26.8% of the total of securities, respectively.
Solvency
The Panamanian Banking Law requires General License
banks to maintain a minimum paid-in capital of US$10.0
million, as well as capital funds representing at least 8.0%
of its risk-weighed assets. To such effect, assets must be
taken into account net of their respective reserves and with
the weights indicated in Agreement 05-2008 of the SBP,
which will be superseded by Agreements 01-2015 and 03-
2016.
As of June 30, 2016, Metrobank's capital funds amounted
to US$126.4 million, 1.1% greater than the balance
registered at the closing of 2015, an evolution that includes
mainly the greater amount of retained earnings. However,
risk-weighted assets increase at 9.8% rhythm, in line with
the portfolio growth and the deterioration of its quality;
wherewith Metrobank's Capital Adequacy Ratio (CAR)
decreases from 15.6% to 14.4%, below the NBS average
(14.9%). It is worth indicating that the Bank's capital funds
consist totally of Tier 1 capital.
0%
2%
4%
6%
8%
10%
12%
14%
16%
18%
0
20
40
60
80
100
120
140
2012 2013 2014 Jun.15 2015 Jun.16
IAC
In U
S$ m
illio
ns
Metrobank's CAR Evolution
Tier 1CapitalFunds
Metrobank
NBS
Source: Metrobank and SBP / Prepared by: Equilibrium
It should be indicated that the goodwill generated by the
acquisition of Financiera Govimar and other financial
companies by US$10.1 million in 2008, has been deducted
from the computable capital funds, according to the SBP's
current regulations.
Results and Profitability
As of June 30, 2016, Metrobank's financial income total
US$32.5 million, increasing by 12.1% in relation to the
same period of the previous period. The increase of income
is explained mainly by the higher interest earned on loans,
which increased 11.6% in line with the 12.1% interannual
expansion of the credits portfolio. It should be indicated
that the income generated from the loan portfolio represent
81.8% of the Bank's total income.
In terms of financial income, these increased 15.7%
between the evaluated periods, supported mainly by the
higher interest expenses on deposits (+12.9%) as a result of
the interannual expansion –fundamentally time deposits
(+7.8%)- and the increase of deposit interest rates (+10

12
basis points during the first six months of the current
period).
As a result of higher relative variation of expenses
compared to income, Metrobank's gross financial margin
drops from 44.1% to 42.3%; however, in absolute terms,
said margin shows a 7.4% interannual growth. On the other
hand, Metrobank registers higher fees on loans, which
increase by 79.1% reaching US$3.4 million. This latter,
together with lower reserves expense (-57.0%), allowed the
Bank's net financial margin to improve going from 53.9%
to 55.3% between the periods evaluated (+15.1% in
absolute terms).
0%
1%
2%
3%
4%
5%
6%
7%
-
10.0
20.0
30.0
40.0
50.0
60.0
2012 2013 2014 2015 Jun.15Jun.16
Spre
ad
In U
S$ m
illio
ns
Spread
Financialexpenses
Interest on duefrom banks
Interest oninvestments
Interest on loans
Average yield onearning assets*
Average fundingcost
*Does not include fees on loans. Source: Metrobank / Prepared by: Equilibrium
It should be indicated that Metrobank's average yield on
earning assets -not including fees- is 5.7% as of the closing
of the first semester of 2016, while the average funding
cost is 3.5% (3.4% as of June 2015), thus the financial
spread is 2.2% (2.3% as of June 2015), below the NBS
average (2.6%). However, when including fees on loans,
Metrobank's average yield on loans increases to 6.3%
(6.2% as of June 2015), thus the financial spread increases
to 2.8%.
On the other hand, other operating income drops 63.6%
and reaches US$1.3 million. Said evolution is due in the
first place too the result of the sale of securities, since as of
June 30, 2016 there is a loss of US$49 thousand (non
material amount regarding the investments portfolio),
while for the same period of the previous period the result
was a gain of US$1.4 million. It should be indicated that
the result is in line with the decision to make the invest-
ments in advance due to the expectation of the rise of
interest rates that could negatively impact the yields of the
portfolio securities. Another factor that explains the drop
of other income is because in the period evaluated
Metrobank does not register income from advisory ser-
vices and referred customers associated to the operation of
Financiera Govimar, while for the first semester of the
previous period income US$0.5 million was registered for
this concept.
Regarding general and administrative expenses, these
register a 5.8% growth, explained mainly by greater
employees and compensation expenses (+9.1%). Thus, the
result before taxes amounts to US$7.4 million, 7.3% below
than the result achieved in the same period of the previous
year.
As of June 30, 2016, net profits drop by 10.6% resulting in
US$6.3 million, registering in turn a net margin of 19.4%
(24.4% as of June 30, 2015). As a result of the lower result,
the ROAE drops from 13.0% to 9.4% between the periods
evaluated.

13
METROBANK, S.A. AND SUBSIDIARIES
CONSOLIDATED BALANCE SHEET
in thousands of dollars
ASSETS:
Cash and cash items 5,565 0.7% 5,970 0.6% 6,862 0.6% 5,165 0.5% 11,480 1.0% 4,188 0.3% -63.5% -18.9%
Demand deposits due from banks 44,945 5.7% 72,360 7.8% 76,172 7.1% 75,361 6.7% 98,214 8.5% 93,677 7.5% -4.6% 24.3%
Time deposits due from banks 40,645 5.1% 37,336 4.0% 39,804 3.7% 31,901 2.8% 12,988 1.1% 18,300 1.5% 40.9% -42.6%
Total Cash and due from Banks 91,155 11.5% 115,666 12.4% 122,838 11.4% 112,427 10.0% 122,682 10.6% 116,164 9.3% -5.3% 3.3%
Investments in securities available for sale 137,040 17.3% 165,092 17.7% 220,975 20.6% 231,324 20.7% 226,033 19.5% 259,288 20.8% 14.7% 12.1%
Total Investments 137,040 17.3% 165,092 17.7% 220,975 20.6% 231,324 20.7% 226,033 19.5% 259,288 20.8% 14.7% 12.1%
Total Funds Available 228,195 28.9% 280,757 30.1% 343,813 32.0% 343,751 30.7% 348,714 30.1% 375,452 30.2% 7.7% 9.2%
Loans 569,145 72.0% 657,277 70.4% 727,951 67.8% 774,554 69.2% 810,856 69.9% 868,492 69.8% 7.1% 12.1%
Internal sector 536,059 67.8% 607,513 65.1% 633,234 59.0% 657,284 58.7% 660,616 57.0% 696,462 55.9% 5.4% 6.0%
External sector 33,085 4.2% 49,763 5.3% 94,718 8.8% 117,270 10.5% 150,240 13.0% 172,030 13.8% 14.5% 46.7%
Current credits 565,876 71.6% 652,926 70.0% 720,670 67.2% 768,172 68.6% 807,144 69.6% 854,094 68.6% 5.8% 11.2%
Nonperforming and past-due credits 3,269 0.4% 4,351 0.5% 7,281 0.7% 6,382 0.6% 3,713 0.3% 14,398 1.2% 287.8% 125.6%
Non performing credits 1,844 0.2% 3,980 0.4% 5,122 0.5% 4,599 0.4% 2,791 0.2% 3,948 0.3% 41.5% -14.2%
Past-due credits 1,425 0.2% 371 0.0% 2,160 0.2% 1,783 0.2% 922 0.1% 10,449 0.8% 1033.2% 486.1%
Less: - -
Reserve for protection of portfolio 6,425 0.8% 3,343 0.4% 5,196 0.5% 5,707 0.5% 3,110 0.3% 2,829 0.2% -9.0% -50.4%
Discounted unearned Interest, fees and insurance 29,492 3.7% 31,042 3.3% 28,599 2.7% 28,651 2.6% 29,227 2.5% 29,567 2.4% 1.2% 3.2%
Net loans and discounts 533,228 67.4% 622,892 66.8% 694,156 64.7% 740,196 66.1% 778,520 67.1% 836,096 67.2% 7.4% 13.0%
Property, Furniture, Equipment and Improvements 6,503 0.8% 10,348 1.1% 10,759 1.0% 10,668 1.0% 9,842 0.8% 8,880 0.7% -9.8% -16.8%
Goodwill 10,134 1.3% 10,134 1.1% 10,134 0.9% 10,134 0.9% 10,134 0.9% 10,134 0.8% 0.0% 0.0%
Accrued interest receivable 2,639 0.3% 2,702 0.3% 3,586 0.3% 3,525 0.3% 3,957 0.3% 4,648 0.4% 17.5% 31.9%
Other assets 10,123 1.3% 6,288 0.7% 6,567 0.6% 7,342 0.7% 5,211 0.4% 6,725 0.5% 29.0% -8.4%
Assets held for sale 0 0.0% 0 0.0% 4,035 0.4% 4,035 0.4% 3,540 0.3% 3,115 0.3% -12.0% -22.8%
TOTAL ASSETS 790,822 100% 933,122 100% 1,073,052 100% 1,119,652 100.0% 1,159,918 100% 1,245,049 100% 7.3% 11.2%
LIABILITIES:
Local demand deposits 77,962 9.9% 83,042 8.9% 106,290 9.9% 93,809 8.4% 83,288 7.2% 84,880 6.8% 1.9% -9.5%
Foreign demand deposits 5,616 0.7% 6,205 0.7% 7,621 0.7% 5,944 0.5% 5,885 0.5% 5,589 0.4% -5.0% -6.0%
Demand deposits 83,578 10.6% 89,247 9.6% 113,910 10.6% 99,753 8.9% 89,173 7.7% 90,469 7.3% 1.5% -9.3%
Local savings deposits 81,415 8.7% 100,352 9.4% 98,303 8.8% 97,616 8.4% 106,020 8.5% 8.6% 7.8%
Foreign savings deposits 19,594 2.1% 24,431 2.3% 24,801 2.2% 20,800 1.8% 18,682 1.5% -10.2% -24.7%
Savings deposits 88,572 11.2% 101,009 10.8% 124,784 11.6% 123,104 11.0% 118,416 10.2% 124,701 10.0% 5.3% 1.3%
Local time deposits 378,539 47.9% 477,250 51.1% 576,274 53.7% 639,861 57.1% 659,876 56.9% 692,497 55.6% 4.9% 8.2%
Foreign time deposits 55,531 7.0% 63,385 6.8% 59,971 5.6% 65,471 5.8% 66,518 5.7% 67,805 5.4% 1.9% 3.6%
Customers' time deposits 434,069 54.9% 540,635 57.9% 636,245 59.3% 705,332 63.0% 726,394 62.6% 760,301 61.1% 4.7% 7.8%
Interbank demand deposits 1,129 0.1% 226 0.0% 210 0.0% 257 0.0% 208 0.0% 19 0.0% -90.9% -92.7%
Interbank time deposits 29,513 3.7% 28,787 3.1% 24,033 2.2% 16,502 1.5% 8,001 0.7% 17,013 1.4% 112.6% 3.1%
Interbank time deposits 30,642 3.9% 29,012 3.1% 24,243 2.3% 16,759 1.5% 8,209 0.7% 17,031 1.4% 107.5% 1.6%
Total deposits 636,862 80.5% 759,903 81.4% 899,182 83.8% 944,948 84.4% 942,192 81.2% 992,503 79.7% 5.3% 5.0%
Borrowings 28,058 3.5% 25,965 2.8% 17,517 1.6% 12,190 1.1% 36,481 3.1% 77,382 6.2% 112.1% 534.8%
Securities sold under repurchase agreements 37,199 4.7% 32,074 3.4% 27,500 2.6% 27,500 2.5% 27,500 2.4% 15,000 1.2% -45.5% -45.5%
Cashiers' checks and certified checks 3,833 0.5% 5,882 0.6% 4,525 0.4% 8,608 0.8% 2,560 0.2% 4,099 0.3% 60.1% -52.4%
Accrued interest payable 3,343 0.4% 3,596 0.4% 4,457 0.4% 4,934 0.4% 5,455 0.5% 6,675 0.5% 22.4% 35.3%
Pending acceptances 277 0.0% 0 0.0% 746 0.1% 24 0.0% 173 0.0% 0.0% -100.0% -100.0%
Other liabilities 8,621 1.1% 9,992 1.1% 10,879 1.0% 11,076 1.0% 10,639 0.9% 9,479 0.8% -10.9% -14.4%
TOTAL LIABILITIES 718,192 90.8% 837,411 89.7% 964,807 89.9% 1,009,280 90.1% 1,025,001 88.4% 1,105,137 88.8% 7.8% 9.5%
STOCKHOLDERS' EQUITY: - -
Common stock 50,000 6.3% 65,000 7.0% 65,000 6.1% 65,000 5.8% 85,000 7.3% 85,000 6.8% 0.0% 30.8%
Changes in securities available for sale 1,170 0.1% -1,182 -0.1% 2,649 0.2% 278 0.0% -363 0.0% 1,529 0.1% -521.4% 449.1%
Reserve for foreclosed assets 6 0.0% 0 0.0% 8 0.0% 4 0.0% 11 0.0% 11 0.0% 0.0% 200.0%
Regulatory reserve for assets under administration 0 0.0% 0 0.0% 91 0.0% 94 0.0% 113 0.0% 128 0.0% 13.2% 36.6%
Difference between regulatory specific reserve and IFRS reserve 0 0.0% 4,915 0.5% 358 0.0% 0 0.0% 9 0.0% 1,687 0.1% 18414.0% -
Dynamic reserve for loan losses 0 0.0% 0 0.0% 8,210 0.8% 11,867 1.1% 13,682 1.2% 13,872 1.1% 1.4% 16.9%
Net income for the period 6,873 0.9% 9,848 1.1% 11,226 1.0% 7,067 0.6% 12,457 1.1% 6,317 0.5% -49.3% -10.6%
Retained earnings 14,581 1.8% 17,129 1.8% 20,703 1.9% 26,062 2.3% 24,008 2.1% 31,368 2.5% 30.7% 20.4%
TOTAL STOCKHOLDERS' EQUITY 72,630 9.2% 95,711 10.3% 108,244 10.1% 110,372 9.9% 134,917 11.6% 139,912 11.2% 3.7% 26.8%
TOTAL LIABILITIES AND STOCKHOLDERS' EQUITY 790,822 100% 933,122 100% 1,073,052 100% 1,119,652 100.0% 1,159,918 100% 1,245,049 100% 7.3% 11.2%
%Jun.16/Dec.15
Var%
Jun.16/Jun.15
Var%% Jun.15 % Dec.15 % Jun.16% Dec.14Dec.13Dec.12 %

14
METROBANK, S.A. AND SUBSIDIARIES
CONSOLIDATED STATEMENT OF INCOME
(in thousands of dollars)
Financial Income 37,990 100.0% 45,649 100.0% 50,824 100.0% 29,017 100.0% 58,576 100.0% 32,522 100.0% 12.1% 15.3%
Interest earned on loans 32,677 86.0% 39,288 86.1% 41,764 82.2% 23,835 82.1% 48,000 81.9% 26,605 81.8% 11.6% 14.9%
Interest earned on due from banks 99 0.3% 82 0.2% 105 0.2% 93 0.3% 152 0.3% 67 0.2% -27.8% 44.1%
Interest earned on investment in securities 5,214 13.7% 6,279 13.8% 8,955 17.6% 5,090 17.5% 10,424 17.8% 5,850 18.0% 14.9% 16.4%
Financial Expenses 19,238 50.6% 23,847 52.2% 28,814 56.7% 16,212 55.9% 33,874 57.8% 18,765 57.7% 15.7% 17.6%
Interest expense on deposits 22,108 48.4% 27,601 54.3% 15,670 54.0% 32,661 55.8% 17,693 54.4% 12.9% 18.3%
Interest expense on borrowings 1,739 3.8% 1,214 2.4% 543 1.9% 1,214 2.1% 1,072 3.3% 97.5% 0.0%
Gross financial results 18,752 49.4% 21,802 47.8% 22,010 43.3% 12,805 44.1% 24,702 42.2% 13,758 42.3% 7.4% 12.2%
Fees earned 3,836 10.1% 5,436 11.9% 8,969 17.6% 4,182 14.4% 9,848 16.8% 5,170 15.9% 23.6% 9.8%
Loans 1,415 3.7% 2,193 4.8% 4,842 9.5% 1,898 6.5% 5,323 9.1% 3,398 10.4% 79.1% 9.9%
Letters of credit 118 0.3% 309 0.7% 310 0.6% 181 0.6% 347 0.6% 120 0.4% -33.7% 11.7%
Custody and administration of securities 331 0.9% 335 0.7% 295 0.6% 220 0.8% 386 0.7% 149 0.5% -32.6% 30.9%
Transfers, money orders cashiers' checks 910 2.4% 996 2.2% 1,071 2.1% 513 1.8% 1,006 1.7% 459 1.4% -10.5% -6.1%
Merchants' acquisition and points of sales 0 0.0% 661 1.4% 858 1.7% 745 2.6% 1,497 2.6% 270 0.8% -63.8% 74.6%
Advisory fees 254 0.7% 191 0.4% 697 1.4% 112 0.4% 334 0.6% 282 0.9% 151.2% -52.2%
Other 807 2.1% 751 1.6% 895 1.8% 512 1.8% 955 1.6% 493 1.5% -3.8% 6.7%
Fees expenses 879 2.3% 1,146 2.5% 1,470 2.9% 661 2.3% 1,498 2.6% 638 2.0% -3.5% 1.9%
Net fees 2,958 7.8% 4,289 9.4% 7,498 14.8% 3,520 12.1% 8,350 14.3% 4,532 13.9% 28.8% 11.4%
Financial results before reserves 21,710 57.1% 26,092 57.2% 29,508 58.1% 16,325 56.3% 33,052 56.4% 18,290 56.2% 12.0% 12.0%
Loan loss reserve 1,339 3.5% 1,652 3.6% 2,588 5.1% 689 2.4% 1,676 2.9% 296 0.9% -57.0% -35.2%
Reserve for impairment losses on investment in securities 204 0.5% 0 0.0% 0 0.0% 0 0.0% 0 0.0% 0 0.0% - -
Financial results after reserves 20,167 53.1% 24,440 53.5% 26,920 53.0% 15,636 53.9% 31,375 53.6% 17,994 55.3% 15.1% 16.5%
Dividends income 4 0.0% 4 0.0% 5 0.0% 2 0.0% 3 0.0% 4 0.0% 125.8% -44.2%
Gain on sale of securities 1,045 2.7% 932 2.0% 676 1.3% 1,448 5.0% 1,413 2.4% (49) -0.1% -103.4% 108.9%
Other 1,480 3.9% 2,564 5.6% 5,299 10.4% 2,138 7.4% 3,560 6.1% 1,350 4.2% -36.8% -32.8%
Other income (expenses) 2,529 6.7% 3,500 7.7% 5,980 11.8% 3,588 12.4% 4,976 8.5% 1,305 4.0% -63.6% -16.8%
Total operating income, net 22,695 59.7% 27,940 61.2% 32,900 64.7% 19,224 66.2% 36,351 62.1% 19,300 59.3% 0.4% 10.5%
General and administrative expenses 14,488 38.1% 17,013 37.3% 20,661 40.7% 11,239 38.7% 22,334 38.1% 11,896 36.6% 5.8% 8.1%
General operating expenses 6,450 17.0% 6,438 14.1% 8,384 16.5% 4,743 16.3% 9,761 16.7% 4,943 15.2% 4.2% 16.4%
Employee expenses and other compensations 7,541 19.8% 9,085 19.9% 10,622 20.9% 5,625 19.4% 10,860 18.5% 6,139 18.9% 9.1% 2.2%
Depreciation and amortization 497 1.3% 1,490 3.3% 1,654 3.3% 871 3.0% 1,713 2.9% 814 2.5% -6.6% 3.5%
Profits before income taxes 8,208 21.6% 10,927 23.9% 12,239 24.1% 7,984 27.5% 14,017 23.9% 7,404 22.8% -7.3% 14.5%
Income taxes 1,335 3.5% 1,079 2.4% 1,013 2.0% 917 3.2% 1,560 2.7% 1,087 3.3% 18.5% 54.0%
NET INCOME 6,873 18.1% 9,848 21.6% 11,226 22.1% 7,067 24.4% 12,457 21.3% 6,317 19.4% -10.6% 11.0%
Dec.12 % % Dec.14Dec.13 %Var%
Jun.16/Jun.15
Var%
Dic.15/Dic.14% Jun.15 % Dec.15 % Jun.16

15
LIQUIDITY
Investments / Liquid assets 60.1% 58.8% 64.3% 67.3% 64.8% 69.1% 97.9%
Net loans / Deposits 83.7% 82.0% 77.2% 78.3% 82.6% 84.2% 85.6%
(Cash + Due from banks) / Demand and savings deposits 53.0% 60.8% 51.5% 50.4% 59.1% 54.0% 67.4%
(Cash + Due from banks) / Total deposits 14.3% 15.2% 13.7% 11.9% 13.0% 11.7% 23.1%
(Cash + Due from banks) / Total liabilities 12.7% 13.8% 12.7% 11.1% 12.0% 10.5% 19.0%
(Cash + Due from banks + Investments) / Demand and savings deposits 132.6% 147.6% 144.0% 154.2% 168.0% 174.5% 133.3%
(Cash + Due from banks + Investments) / Total deposits 35.8% 36.9% 38.2% 36.4% 37.0% 37.8% 45.6%
(Cash + Due from banks + Investments) / Total liabilities 31.8% 33.5% 35.6% 34.1% 34.0% 34.0% 37.6%
Top 20 depositors / Total deposits 20.0% 18.9% 18.1% 20.1% 20.7% 22.5% N.D.
(Liquid assets + Investments) / Top 20 depositors 1.9 2.0 2.2 1.9 1.8 1.7 N.D.
Legal Liquidity Ratio (average) 58.9% 47.8% 55.6% 64.5% 62.0% 64.9% 60.2%
SOLVENCY
Liabilities / Equity (in number of times) 9.9 8.7 8.9 9.1 7.6 7.9 8.5
Equity / Assets 9.2% 10.3% 10.1% 9.9% 11.6% 11.2% 10.6%
Equity / Gross Loans 12.8% 14.6% 14.9% 14.2% 16.6% 16.1% 16.6%
Fixed assets / Equity 9.0% 10.8% 9.9% 9.7% 7.3% 6.3% N.D.
Financial debt / Liabilities 9.1% 6.9% 4.7% 3.9% 6.2% 8.4% 14.7%
Deposits / Liabilities 88.7% 90.7% 93.2% 93.6% 91.9% 89.8% 82.5%
Time deposits / Deposits 73.0% 75.0% 73.5% 76.4% 78.0% 78.3% 52.2%
Capital Adequacy Ratio9
12.8% 14.2% 13.2% 12.8% 15.6% 14.4% 14.9%
ASSET QUALITY
Nonperforming credits / Gross loans 0.3% 0.6% 0.7% 0.6% 0.3% 0.5% 1.1%
Nonperforming and past-due credits / Gross loans 0.6% 0.7% 1.0% 0.8% 0.5% 1.7% 2.3%
Nonperforming, past-due and charged-off credits / Gross loans + charged-off credits 0.7% 0.8% 1.1% 0.9% 0.9% 2.2% N.D.
Loan loss reserves / Nonperforming credits 348.4% 207.5% 108.4% 124.1% 111.8% 114.4% 85.1%
Loan loss reserves / Nonperforming and past-due credits 196.5% 189.8% 76.3% 89.4% 84.0% 31.4% 39.2%
(Loan loss reserves + dynamic reserve) / (Nonperforming and past-due credits) 196.5% 189.8% 189.0% 275.3% 452.5% 127.7% 97.9%
(Nonperforming credits - Asset reserves) / Equity -6.3% -4.5% -0.4% -1.0% -0.2% -0.4% 1.0%
(Nonperforming + past-due credits - Loan loss reserves - Dynamic Reserve) / Equity -4.3% -4.1% -6.0% -10.1% -9.7% -2.9% 0.3%
Top 20 debtors / Gross loans 22.8% 23.0% 24.6% 24.2% 25.0% 27.3% N.D.
PROFITABILITY
ROAA1
1.0% 1.1% 1.1% 1.3% 1.1% 1.0% 1.4%
ROAE2
10.0% 11.7% 11.0% 13.0% 10.2% 9.4% 13.2%
ROARWA3
1.6% 1.9% 1.7% 1.9% 1.6% 1.4% 1.9%
Average yield on loans (only interest) 6.4% 6.4% 6.0% 6.2% 6.2% 6.2% 5.6%
Average yield on investments (only interest) 4.3% 4.2% 4.6% 4.7% 4.7% 4.6% 2.8%
Average yield on earning assets4 (only interest) 5.7% 5.7% 5.5% 5.7% 5.7% 5.7% 4.5%
Average funding cost5
3.1% 3.1% 3.3% 3.4% 3.5% 3.5% 2.0%
Financial spread (only interest) 2.6% 2.5% 2.2% 2.3% 2.3% 2.2% 2.6%
Average yield on loans (including fees on loans) 6.7% 6.8% 6.7% 6.9% 6.9% 7.0% 6.9%
Average yield on earning assets, incl. fees on loans 6.0% 6.0% 6.0% 6.2% 6.3% 6.3% 5.4%
Financial spread, incl. fees on loans 2.9% 2.8% 2.8% 2.9% 2.8% 2.8% 1.5%
Financial spread7 (only interest) 49.4% 47.8% 43.3% 44.1% 42.2% 42.3% 58.4%
Extraordinary component in net profit 36.8% 35.5% 53.3% 50.8% 39.9% 20.7% 83.4%
EFFICIENCY
Operating expenses / Financial income 38.1% 37.3% 40.7% 38.7% 38.1% 36.6% 59.2%
Operating expenses / Gross margin 77.3% 78.0% 93.9% 87.8% 90.4% 86.5% 101.4%
Employees expenses / Financial income 19.8% 19.9% 20.9% 19.4% 18.5% 18.9% 27.8%
Employees expenses / Gross loans 1.3% 1.4% 1.5% 1.4% 1.3% 1.3% 1.8%
General and administrative expenses / Average total assets 2.1% 2.0% 2.1% 2.1% 2.0% 1.9% 2.5%
Operational efficiency8
59.8% 57.5% 58.2% 56.4% 58.7% 60.7% 59.7%
ADDITIONAL INFORMATION
Annualized intermediation income (US$ thousands) 40,948 49,939 58,322 63,382 66,926 71,443 4,605,759
Annualized intermediation costs (US$ thousands) 19,238 23,847 28,814 31,236 33,874 36,426 1,659,172
Annualized intermediation activity results (US$ thousands) 21,710 26,092 29,508 32,146 33,052 35,017 2,946,587
Number of debtors 16,160 16,089 16,241 15,826 17,601 16,864 N.D.
Average credit (US$) 35,219 40,853 44,822 48,942 46,069 51,500 N.D.
Number of depositors 3,491 3,912 4,465 4,523 4,541 4,589 N.D.
Average deposit (US$) 182,430 194,249 201,385 208,921 207,486 216,279 N.D.
Number of employees 274 293 349 349 356 357 N.D.
Number of offices 3 3 4 4 4 4 N.D.
Charged-off credits for the period (US$ thousands) 753 976 956 308 4,009 728 N.D.
Annualized charged-off credits (US$ thousands) 753 976 956 609 4,009 4,430 N.D.
Charged-off credits % (last 12 months) / Loans 0.1% 0.1% 0.1% 0.1% 0.5% 0.5% N.D.1 ROAA (Return On Average Assets)= Net income 12 months / {(Assets t+ Assets t-1) /2}2 ROAE (Return On Average Equity) = Net income 12 months / {(Equity t+ Equityt-1) / 2}3 ROARWA (Return on Average Risk-Weighted Assets) = Net income 12 months / {(Risk-Weighted assets t + Risk-Weighted assets t-1) / 2}4 Average yield on earning assets = Financial income (does not include fees) / Var. on Due from banks + Investments + Gross loans5 Average funding cost = Financial expenses / Var. Deposits + Borrow ings + Securities sold under repurchase agreement7 Financial spread = (Financial income - Financial expenses) / Financial income8 Operational Eff iciency = Operating Expenses / Financial Results before Reserves (Includes other income)9 Capital Adequacy Ratio = Capital funds / Risk-Weighted assets
Dec.15 Jun.16National Banking
SystemDec.14 Jun.15Dec.13Dec.12FINANCIAL RATIOS

16
© 2016 Equilibrium Calificadora de Riesgo.
CREDIT RATINGS ISSUED BY EQUILIBRIUM CALIFICADORA DE RIESGO S.A. (“EQUILIBRIUM”) CONSTITUTE
THE CURRENT OPINIONS OF EQUILIBRIUM ABOUT THE RELATIVE FUTURE CREDIT RISK OF ENTITIES,
CREDIT COMMITMENTS OR DEBT, OR SECURITIES SIMILAR TO DEBT, AND THE CREDIT RATINGS AND
RESEARCH PUBLICATIONS PUBLISHED BY EQUILIBRIUM (“EQUILIBRIUM'S PUBLICATIONS”) MAY
INCLUDE CURRENT EQUILIBRIUM OPINIONS ABOUT THE RELATIVE FUTURE CREDIT RISK OF ENTITIES,
CREDIT COMMITMENTS OR DEBT, OR SECURITIES SIMILAR TO DEBT. EQUILIBRIUM DEFINES CREDIT
RISK AS THE RISK THAT AN ENTITY CANNOT COMPLY WITH ITS CONTRACTUAL FINANCIAL
OBLIGATIONS ONCE SAID OBLIGATIONS BECOME ENFORCEABLE, AND ANY ESTIMATED FINANCIAL LOSS
IN CASE OF NON-COMPLIANCE. CREDIT RATINGS DO NOT TAKE INTO CONSIDERATION ANY OTHER RISK,
INCLUDING WITHOUT LIMITATION: LIQUIDITY RISK, MAKET VALUE RISK, OR PRICE VOLATILITY.
EQUILIBRIUM'S CREDIT RATINGS AND OPINIONS INCLUDED IN EQUILIBRIUM'S PUBLICATIONS DO NOT
CONSTITUTE STATEMENTS OF CURRENT OR HISTORIC EVENTS. EQUILIBRIUM'S CREDIT RATINGS AND
PUBLICATIONS DO NOT CONSTITUTE OR PROVIDE RECOMMENDATION OR FINANCIAL OR INVESTMENT
ADVICE, AND EQUILIBRIUM'S CREDIT RATINGS AND PUBLICATIONS DO NOT CONSTITUTE OR PROVIDE
RECOMMENDATIONS TO PURCHASE, SELL, OR HOLD DETERMINED SPECIFIC SECURITIES. NOR DO
CREDIT RATINGS OR EQUILIBRIUM'S PUBLICATIONS CONSTITUTE COMMENTS ABOUT THE SUITABILITY
OF AN INVESTMENT FOR ANY SPECIFIC INVESTOR. EQUILIBRIUM ISSUES ITS CREDIT RATINGS AND
PUBLISHES ITS PUBLICATIONS WITH THE EXPECTATION AND THE UNDERSTANDING THAT EVERY
INVESTOR WILL MAKE HIS / HER OWN ASSESMENT AND EVALUATION, WITH DUE CARE, OF EACH
SECURITY SUBJECT TO CONSIDERATION FOR PURCHASE, HOLDING OR SALE.
EQUILIBRIUM'S CREDIT RATINGS AND PUBLICATIONS ARE NOT INTENDED TO BE USED BY SMALL INVESTORS
AND IT WOULD BE RECKLESS FOR A SMALL INVESTOR TO TAKE INTO CONSIDERATION EQUILIBRIUM'S RISK
RATINGS OR PUBLICATIONS WHEN MAKING ANY INVESTMENT DECISION. IN CASE OF DOUBT, YOU SHOULD
CONSULT YOUR FINANCIAL ADVISOR OR OTHER PROFESSIONAL ADVISOR.
ALL THE INFORMATION HEREIN IS PROTECTED BY LAW, INCLUDING WITHOUT LIMITATION COPYRIGHT LAWS,
AND NONE OF SAID INFORMATION MAY BE COPIED, REPRODUCED, REPACKAGED, TRANSMITTED,
TRANSFERRED, DISSEMINATED, REDISTRIBUTED OR RESOLD BY ANY MEANS WHATSOEVER, OR STORED FOR
SUBSEQUENT USE FOR ANY SUCH PURPOSE, IN WHOLE OR IN PART, IN ANY FORM OR MANNER OR BY ANY
MEANS WHATSOEVER, BY ANY PERSON WITHOUT EQUILIBRIUM'S PRIOR WRITTEN CONSENT.
All the information contained herein is obtained by EQUILIBRIUM from sources believed to be accurate and reliable. Because of
the possibility of human and mechanical error as well as other factors, however, all the information contained in this document is
provided “AS IS” without warranty of any kind. EQUILIBRIUM adopts all the necessary measures so that the information it uses
when assigning a credit rating is of sufficient quality and from sources that EQUILIBRIUM believes are reliable, including, when
appropriate, third parties' sources. Without prejudice thereto, EQUILIBRIUM is not an auditor and cannot, at all times and inde-
pendently, verify or validate information received in the rating or preparation or a publication process.
To the fullest extent permitted by law, EQUILIBRIUM and its directors, officers, employees, agents, representatives, licensors, and
suppliers shall have no liability to any person or entity for any indirect, special, consequential or incidental loss or damage resulting
from or relating to the information contained herein or the use of, or inability to use, said information, including if EQUILIBRIUM
or any of its directors, officers, employees, agents, representatives, licensors or suppliers shall be advised in advance of the possibil-
ity of said losses or damages, including without limitation: (a) any current or potential lost profits, or (b) any resulting loss or dam-
age when the corresponding financial instrument is not the object of a specific credit rating assigned by EQUILIBRIUM.
To the fullest extent permitted by law, EQUILIBRIUM and its directors, officers, employees, agents, representatives, licensors and
suppliers shall have no liability for any direct or compensatory loss or damage caused to any person or entity, including without
limitation any negligence (but excluding fraud, wilful intent or any other type of responsibility that cannot be excluded by law)
relating to or any contingencies within or outside of the control of EQUILIBRIUM or any of its directors, officers, employees,
agents, representatives, licensors and suppliers, resulting from or relating to the information herein or the use of, or inability to use,
any said information.
NO WARRANTY WHATSOEVER, EXPRESS OR IMPLIED, AS TO THE ACCURACY, TIMELINESS, COMPLETENESS,
MERCHANTABILITY OR FITNESS FOR ANY SPECIFIC PURPOSE OF ANY RATING OR ANY OTHER OPIONIO OR
INFORMATION IS GIVEN OR MADE BY EQUILIBRIUM IN ANY FORM OR MANNER.
The above is a translation into English of the document in Spanish presented to me.
Panama, December 14, 2016