metrics workshop 21 june 2017 - service desk institute · metrics workshop 21 june 2017 by susan...
TRANSCRIPT

www.servicedeskinstitute.com
Metrics Workshop21 June 2017
By Susan StoreySDI Auditor, ITIL Expert, consultant
and trainer

www.servicedeskinstitute.com
Metrics Workshop
Agenda• 10.00 Welcome• 10.15-11.00 – Introduction to Service Desk Metrics
• Overview – definitions explored and jargon explained• The value of metrics to the service desk• Why it’s important to get it right
• 11.00-11.45 - Key Metrics to Understand• 11.45-12 noon COFFEE BREAK• 12.00-12.45 – Best Practice for Key Performance Indicators• 12.45-13.45 LUNCH and NETWORKING• 13.45-14.30 Practical workshop• 14.30-14.50 – Review of workshop results• 14.50-15.00 – TEA BREAK• 15.00-15.30 –Andy Parker, Ivanti – Do service metrics and quantum mechanics
really have anything in common?• 15.30-15.45 Action plan and questions• 16.00- CLOSE

www.servicedeskinstitute.com
Overview
• Definitions
• Value to Service Desk
• Importance of accuracy

www.servicedeskinstitute.com
We like you but we’re not sure why ….

www.servicedeskinstitute.com
Why we measure
• To understand what’s good and what’s not
• To provide management information for
decision making
• To influence behaviour
• To improve resource management
• To improve speed and productivity

www.servicedeskinstitute.com
Terms and definitions
• Metrics: measurements taken for specific reason; usually to develop insight
• Measurements: detailed dimensions, extent and size of something
• Reporting: presenting metrics with supporting information and narrative
• Management Information: primarily for business planning and decision making
• Business Intelligence:computer-based techniques used to analyse business data

www.servicedeskinstitute.com
Metric objectives
1. To support and manage a service, process or activity
2. To provide accurate, up-to-date and complete information
3. To validate management decisions
4. To highlight direction and targets for future activities
5. To identify complimentary/conflicting priorities
6. To ensure adaptability to changing market conditions

www.servicedeskinstitute.com
Help to connect the dots

www.servicedeskinstitute.com
Maths definitions
• Mean average - to calculate: add up all the numbers, then divide by how many numbers there are.
• Mode – the number which appears most often in a set of numbers.

www.servicedeskinstitute.com
Value to service desk

www.servicedeskinstitute.com
Rules of measurement
• Link to the bottom line
• Link to corporate objectives
• Be forward looking

www.servicedeskinstitute.com
Goals, objectives, targets and trending
• Goal – an aspirationfor where you want to be
• Objective – explains how the goal will be met (SMART)
• Target – tactical, small attainments towards gradually achieving the goal
• Trending – a line of best fit on a graph showing the general direction of progress or regress

www.servicedeskinstitute.com
Using goals, targets and trend lines

www.servicedeskinstitute.com
Common metrics to understand

www.servicedeskinstitute.com
What Service Desk Managers measure
• ASA (Average Speed to Answer)
• ABA (Average Abandon Before Answer)
• ATT (Average Talk Time)
• Availability to take incoming calls
• Average call time
• FCR (First Contact Resolution)
• FLR (First Level Resolution)
• User recalls (user calls to chase up)
• Calls fixed within SLA
• Calls breaching SLA
www.servicedeskinstitute.com
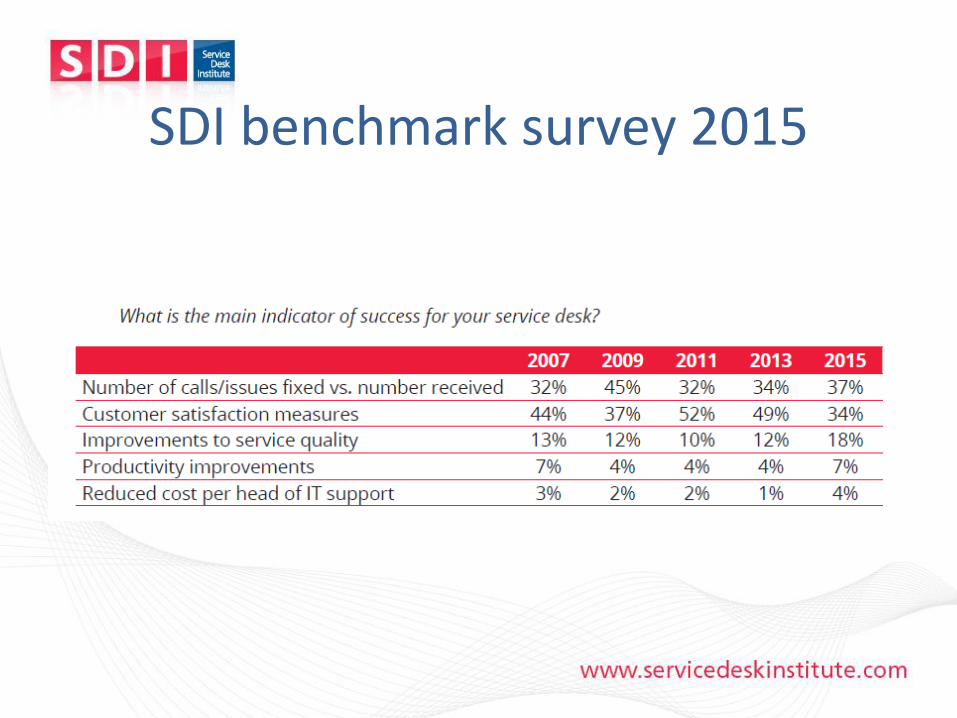
SDI benchmark survey 2015
www.servicedeskinstitute.com
Productivity measures

www.servicedeskinstitute.com
Count sheep whilst tending your flock
(Avg No. of days worked pcm) x (No. of work hrs in day) x (60 mins/hr)
(Avg No. of calls handled by SDA pcm) x (Avg call handle time in mins)Analyst
Utilisation = xx%
(21 working days pcm) x (7.5 work hrs per day) x (60 mins/hr)
(500 calls/pcm) x (10 mins/call)Analyst
Utilisation = 52.9%

www.servicedeskinstitute.com
What do SDAs do all day?• Log and deal with incidents
• Log and deal with service requests
• And……?
www.servicedeskinstitute.com
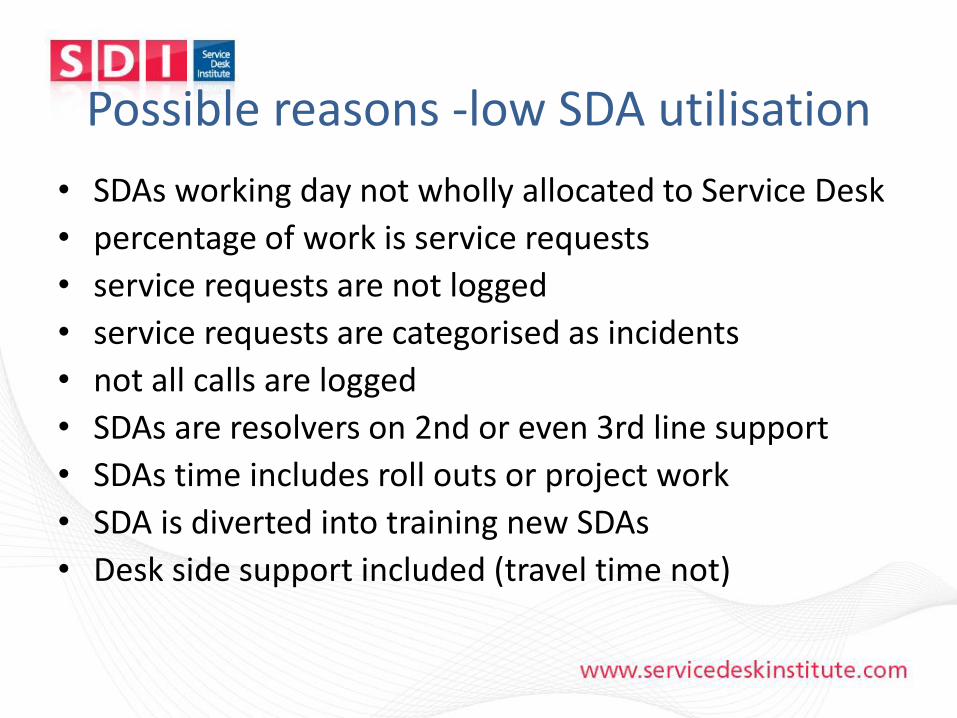
Possible reasons -low SDA utilisation
• SDAs working day not wholly allocated to Service Desk
• percentage of work is service requests
• service requests are not logged
• service requests are categorised as incidents
• not all calls are logged
• SDAs are resolvers on 2nd or even 3rd line support
• SDAs time includes roll outs or project work
• SDA is diverted into training new SDAs
• Desk side support included (travel time not)

www.servicedeskinstitute.com
Reasons for reporting on metrics
• To drill down into the dashboard.
• To present KPI’s with additional commentary
explaining performance highs and lows
• To provide insight and understanding
• To makes suggestions for improvements and
recommend actions
• To demonstrate the value of the Service Desk
• To make decisions
www.servicedeskinstitute.com
Best practice for KPIs
www.servicedeskinstitute.com
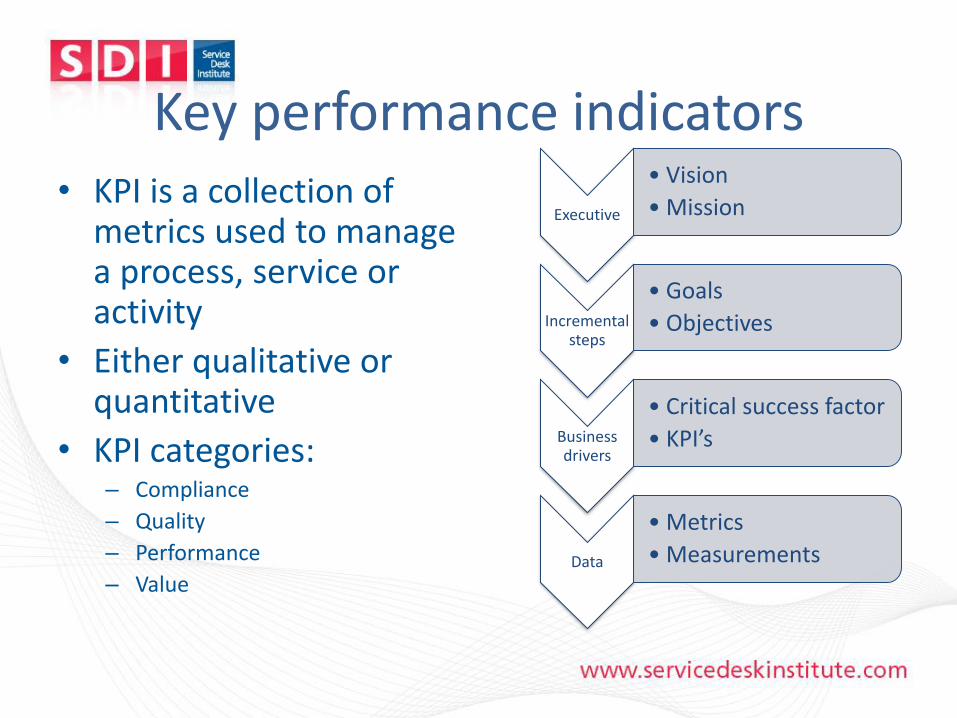
Key performance indicators• KPI is a collection of
metrics used to manage a process, service or activity
• Either qualitative or quantitative
• KPI categories: – Compliance
– Quality
– Performance
– Value
Executive
• Vision
• Mission
Incremental steps
• Goals
• Objectives
Business drivers
• Critical success factor
• KPI’s
Data
• Metrics
• Measurements

www.servicedeskinstitute.com
Measurement affects behaviour
Percentage of calls open longer
than one day (monitoring backlog)
Unhappy customers who have
waited for resolution. SLAs
breached have no ultimate time-
frame
Percentage of calls closed Rushed solutions, likely to be
reopened and result in drop in
customer satisfaction
SLA targets successful Forced call closure, using stop the
clock, logging user recalls
incorrectly as new calls
Most logged per SDA per day Chaotic logging pattern and
unsustainable activity, poor attention
to customer service mistakes

www.servicedeskinstitute.com
Customer satisfaction – survey results
0
50
100
150
200
250
1. How longsystem up
2. How manytimes down
3. Howdisruptive
4. Attitude ofsupport
5. Competenceof support
Re
spo
nse
Questions
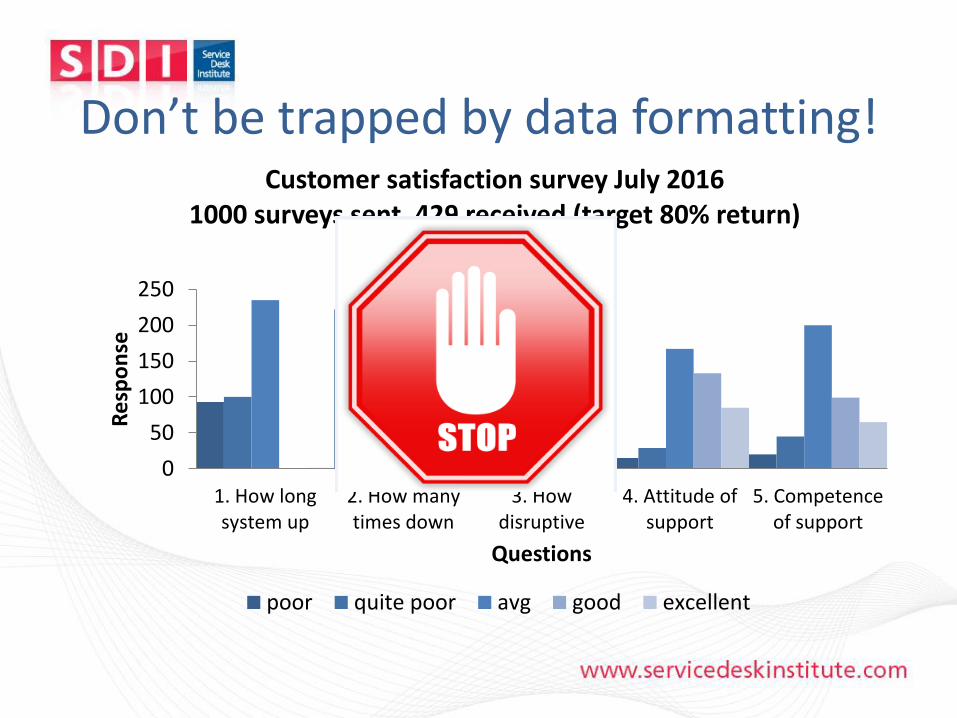
Customer satisfaction survey July 20161000 surveys sent, 429 received (target 80% return)
poor quite poor avg good excellent
www.servicedeskinstitute.com
Don’t be trapped by data formatting!
0
50
100
150
200
250
1. How longsystem up
2. How manytimes down
3. Howdisruptive
4. Attitude ofsupport
5. Competenceof support
Re
spo
nse
Questions
Customer satisfaction survey July 20161000 surveys sent, 429 received (target 80% return)
poor quite poor avg good excellent

www.servicedeskinstitute.com
Weighted scoring
0
1
2
3
4
5
Systemuptime
Number offailures
Disruption Supportattitude
Supportcompetence
Customer satisfaction survey July 20161000 surveys sent, 429 received (target 80%
return)
Response to Q Target

www.servicedeskinstitute.com
SDC measurement requirements
• Every metric needs a SMART target
• All metrics should be trended towards goals over
– 3, 6 and 12 months
• All targets should be reviewed at least annually
• Reporting activities must be undertaken
• Business related metrics must be in evidence
www.servicedeskinstitute.com
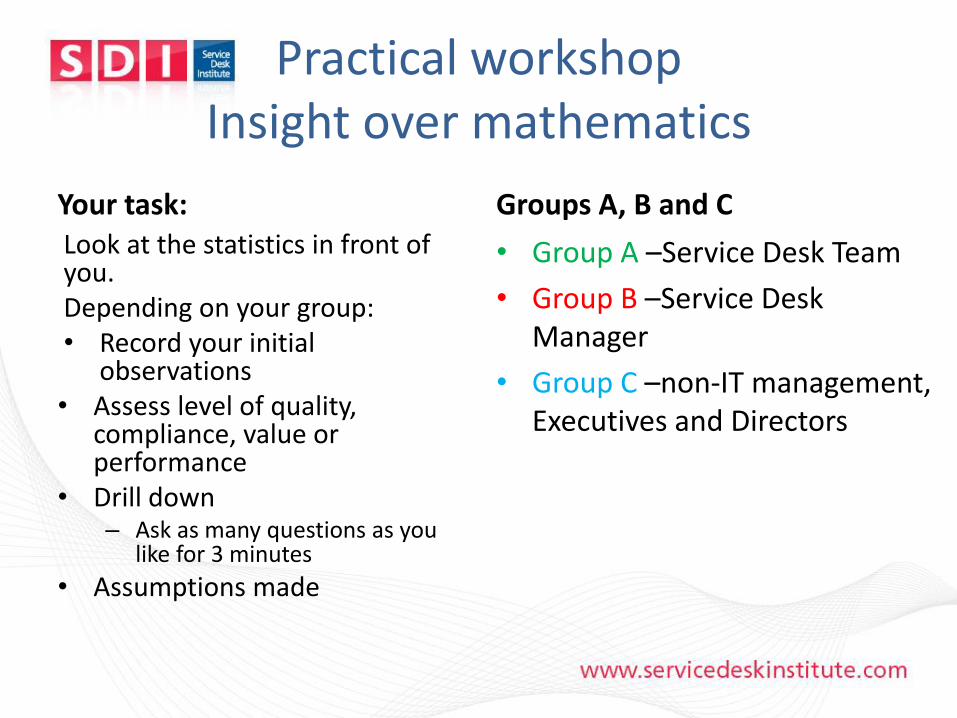
Practical workshopInsight over mathematics
Your task: Look at the statistics in front of you. Depending on your group:• Record your initial
observations• Assess level of quality,
compliance, value or performance
• Drill down – Ask as many questions as you
like for 3 minutes
• Assumptions made
Groups A, B and C
• Group A –Service Desk Team
• Group B –Service Desk Manager
• Group C –non-IT management, Executives and Directors

www.servicedeskinstitute.com
One measurement, many stories
Jan Feb Mar Apr
Calls In 600 650 600 610
Calls closed 550 500 570 580
Printer calls 40 110 25 15
Remote 30 150 40 45
FAQs 5 70 20 30
www.servicedeskinstitute.com
Workshop review
• Group A –Service Desk Team
• Group B –Service Desk Manager
• Group C –non-IT management, Executives and Directors

www.servicedeskinstitute.com
What we measured in 2015

www.servicedeskinstitute.com
SDI benchmark report 2015
30s £37,50065%
21-40 hours4001-5000
10%
£7-£91988
£22,775
61-70%
<=10hours
52.9%
www.servicedeskinstitute.com
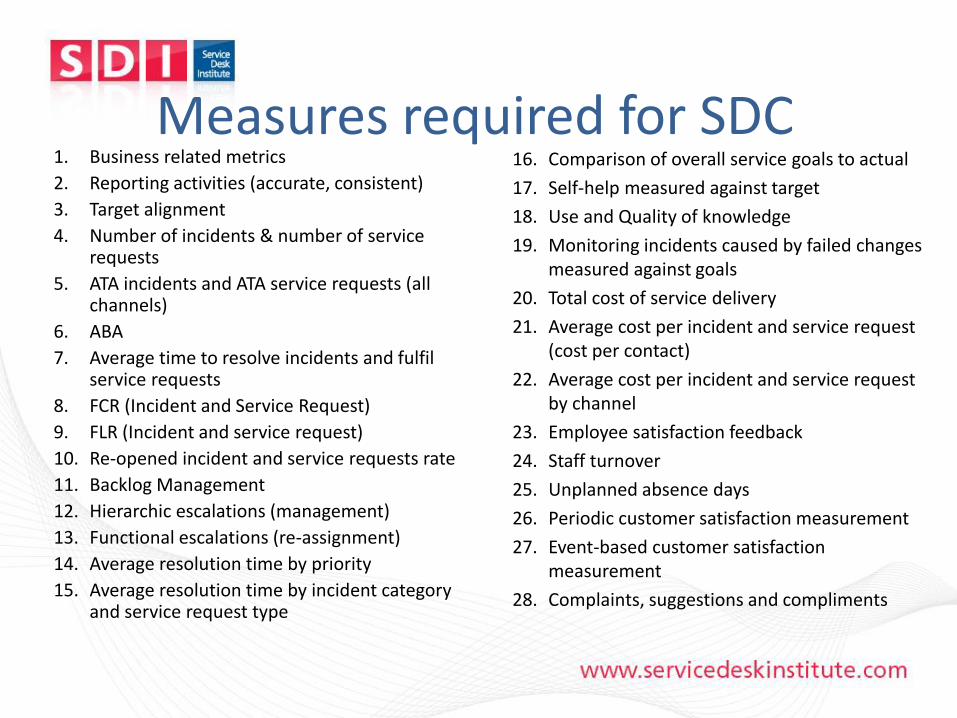
Measures required for SDC1. Business related metrics
2. Reporting activities (accurate, consistent)
3. Target alignment
4. Number of incidents & number of service requests
5. ATA incidents and ATA service requests (all channels)
6. ABA
7. Average time to resolve incidents and fulfil service requests
8. FCR (Incident and Service Request)
9. FLR (Incident and service request)
10. Re-opened incident and service requests rate
11. Backlog Management
12. Hierarchic escalations (management)
13. Functional escalations (re-assignment)
14. Average resolution time by priority
15. Average resolution time by incident category and service request type
16. Comparison of overall service goals to actual
17. Self-help measured against target
18. Use and Quality of knowledge
19. Monitoring incidents caused by failed changes measured against goals
20. Total cost of service delivery
21. Average cost per incident and service request (cost per contact)
22. Average cost per incident and service request by channel
23. Employee satisfaction feedback
24. Staff turnover
25. Unplanned absence days
26. Periodic customer satisfaction measurement
27. Event-based customer satisfaction measurement
28. Complaints, suggestions and compliments

www.servicedeskinstitute.com
Making sense of data

www.servicedeskinstitute.com
Action plan and questions

www.servicedeskinstitute.com
Summary
• Introduction to Service Desk Metrics• Overview – definitions and jargon• Value of metrics to the service desk• Why it’s important to get it right
• Key Metrics to Understand• Best Practice for Key Performance Indicators• Practical workshop• Review of workshop results• Andy Parker - Ivanti and Metrics• Action plan, questions

www.servicedeskinstitute.com
Thank you
Susan Storey [email protected]
07831 576615
© Susan Storey Associates Limited