methods for integrated modeling of landscape change: - oregon
TRANSCRIPT

United StatesDepartment ofAgriculture
Forest Service
Pacific NorthwestResearch Station
General TechnicalReportPNW-GTR-610September 2004
Methods for Integrated Modelingof Landscape Change:Interior Northwest Landscape Analysis System
INLAS
Integrated Multiple
Management Objectives
INLAS ProjectUSDA FS PNW Research Station

Jane L. Hayes is a research biological scientist, and Alan A. Ager is an operationsresearch analyst, Forestry and Range Sciences Laboratory, 1401 Gekeler Lane,La Grande, OR 97850; and R. James Barbour is a research forest productstechnologist, Forestry Sciences Laboratory, P.O. Box 3890, Portland OR 97208-3890
Top (fire) clockwise: EPS Team Photo Archive, Phil Howell, Evelyn Bull (woodpecker),Frank Vanni, Dean Parry, Jamie Barbour, Phil Howell, Jamie Barbour, John Szymoniak
Technical Editors
Photo Credits

Alan A. Ager is an operations research analyst, U.S. Department of Agriculture, ForestService, Pacific Northwest Research Station, Forestry and Range Sciences Laboratory,1401 Gekeler Lane, La Grande, OR [email protected]
Marti Aitken is a resource information manager, U.S. Department of Agriculture, ForestService, Pacific Northwest Research Station, Forestry and Range Sciences Laboratory,1401 Gekeler Lane, La Grande, OR [email protected]
R. James Barbour is a research forest products technologist, U.S. Department ofAgriculture, Forest Service, Pacific Northwest Research Station, Forestry SciencesLaboratory, 620 SW Main, Suite 400, Portland, OR [email protected]
Pete Bettinger is an associate professor, Daniel B. Warnell School of ForestResources, University of Georgia, Athens, GA [email protected]
Roger N. Clark is a research social scientist, U.S. Department of Agriculture, ForestService, Pacific Northwest Research Station, Pacific Wildland Fire Sciences Laboratory,400 N 34th Street, Suite 201, Seattle, WA [email protected]
Mark A. Finney is a research forester, U.S. Department of Agriculture, Forest Service,Rocky Mountain Research Station, Fire Sciences Laboratory, P.O. Box 8089, Missoula,MT [email protected]
David Graetz is a Ph.D. candidate, Department of Forest Resources, Oregon StateUniversity, Corvallis, OR 97331.
Jane L. Hayes is a research biological scientist, U.S. Department of Agriculture, ForestService, Pacific Northwest Research Station, Forestry and Range Sciences Laboratory,1401 Gekeler Lane, La Grande, OR [email protected]
Miles Hemstrom is a research ecologist, U.S. Department of Agriculture, ForestService, Pacific Northwest Research Station, Forestry Sciences Laboratory, 620 SWMain, Suite 400, Portland, OR [email protected]
Philip J. Howell is a fisheries biologist, U.S. Department of Agriculture, Forest Service,Pacific Northwest Region. Howell is located at the Forestry and Range SciencesLaboratory, 1401 Gekeler Lane, La Grande, OR [email protected]
Bruce Johnson is a fish and wildlife biologist, Oregon Department of Fish and Wildlife,1401 Gekeler Lane, La Grande, OR [email protected]
Jeffrey Kline is a research forester, U.S. Department of Agriculture, Forest Service,Pacific Northwest Research Station, Forestry Sciences Laboratory, 3200 SW JeffersonWay, Corvallis, OR [email protected]
Contributing Authors

Gary J. Lettman is a principal forest economist, Oregon Department of Forestry,2600 State Street, Salem, OR [email protected]
Douglas Maguire is an associate professor of silviculture, Department of ForestScience, Oregon State University, Corvallis, OR [email protected]
Robert Riggs is a research wildlife biologist, Boise Building Solutions, NortheastOregon/Idaho Region, 1917 Jackson Street, La Grande, OR [email protected]
Craig L. Schmitt is a plant pathologist, U.S. Department of Agriculture, ForestService, Blue Mountains Pest Management Service Center, 1401 Gekeler Lane,La Grande, OR [email protected]
John Sessions is a university distinguished professor and Stewart Professor offorest engineering, Department of Forest Engineering, Oregon State University,Corvallis, OR [email protected]
Ryan Singleton is a research forester, Department of Forest Science, Oregon StateUniversity, Corvallis, OR [email protected]
Lowell H. Suring is a wildlife ecologist, U.S. Department of Agriculture, ForestService, Terrestrial Wildlife Unit, Forestry Sciences Laboratory, 316 E Myrtle Street,Boise, ID [email protected]
Martin Vavra is a research range scientist, U.S. Department of Agriculture, ForestService, Pacific Northwest Research Station, Forestry and Range Sciences Laboratory,1401 Gekeler Lane, La Grande, OR [email protected]
Barbara C. Wales is a wildlife biologist, U.S. Department of Agriculture, ForestService, Pacific Northwest Research Station, Forestry and Range Sciences Laboratory,1401 Gekeler Lane, La Grande, OR [email protected]
Michael J. Wisdom is a research wildlife biologist, U.S. Department of Agriculture,Forest Service, Pacific Northwest Research Station, Forest Service, Forestry and RangeSciences Laboratory, 1401 Gekeler Lane, La Grande, OR [email protected]
Steven M. Wondzell is a research aquatic ecologist, U.S. Department of Agriculture,Forest Service, Pacific Northwest Research Station, Forestry Sciences Laboratory,3625 93rd Ave., Olympia, WA [email protected]
Methods for Integrated Modeling ofLandscape Change:Interior Northwest Landscape Analysis System
Jane L. Hayes, Alan A. Ager, and R. James Barbour
Technical Editors
U.S. Department of Agriculture, Forest ServicePacific Northwest Research StationPortland, OregonGeneral Technical Report PNW-GTR-610September 2004

Hayes, Jane L.; Ager, Alan. A.; Barbour, R. James, tech. eds. 2004. Methods forintegrated modeling of landscape change: Interior Northwest Landscape AnalysisSystem. Gen. Tech. Rep. PNW-GTR-610. Portland, OR: U.S. Department ofAgriculture, Forest Service, Pacific Northwest Research Station. 218 p.
The Interior Northwest Landscape Analysis System (INLAS) links a number of resource,disturbance, and landscape simulations models to examine the interactions of vegeta-tive succession, management, and disturbance with policy goals. The effects of naturaldisturbance like wildfire, herbivory, forest insects and diseases, as well as specific man-agement actions are included. The outputs from simulations illustrate potential changesin aquatic conditions and terrestrial habitat, potential for wood utilization, and socio-economic opportunities. The 14 chapters of this document outline the current state ofknowledge in each of the areas covered by the INLAS project and describe the objec-tives and organization of the project. The project explores ways to integrate the effectsof natural disturbances and management into planning and policy analyses; illustratepotential conflicts among current policies, natural distrubances, and managementactivities; and explore the policy, economics, and ecological constraints associatedwith the application of effective fuel treatments on midscale landscapes in the interiorNorthwest.
Keywords: Forest simulation analysis, midscale, vegetation succession, disturbance,management.
Abstract
The concept of a process for evaluating policy direction and management options forsubbasin-size landscapes in the interior West evolved from the Pacific NorthwestResearch Station’s Research Initiative for Improving Forest Ecosystem Health andProductivity in Eastern Oregon and Washington. The Interior Northwest LandscapeAnalysis System (INLAS) project was initiated to explore this concept and began withmeetings of resource managers and scientists from various disciplines and institutions.This group suggested ways to build an integrated set of tools and methods for address-ing resource management questions on large, multiowner landscapes. The papers in thisvolume are the outcome of these meetings and document our initial approach to develop-ing an integrated landscape analysis framework. Collectively, the papers illustrate thediversity of methods for modeling different resources and reflect the inherent complexityof linking models to create a functional framework for integrated resource analysis. Weare still a long way from a perfect tool, the linkages among the chapters are not alwaysapparent, and integration issues have not been consistently addressed. We cannotyet address the interrelationships between many key natural and anthropomorphic proc-esses on large landscapes. We also found that integration forced scientists to general-ize relationships and to summarize detailed research findings in order to incorporate theirdisciplines at the landscape scale of the INLAS framework. With a growing interest inintegrated natural resource modeling, we concluded that, despite the fact that we havenot solved all the problems associated with integrating information from different scientificdisciplines, creating this document will provide a valuable resource for future researcherswho want to understand how groups of scientists organize themselves for a project likeINLAS. There are few examples of case studies of similar work in other regions, and toour knowledge, none that document such early stages of these projects’ organization.The reader can learn from both the continuity and lack thereof among the chapters, andperhaps use this publication to learn new ways to deal with the dilemma of how tohybridize long-term research lineages into coherent ways of thinking about integratednatural resource management.
We thank the many disciplinary experts who reviewed the individual chapters. Weappreciate the thoughtful reviews of the entire document provided by W. Connelly, T.M.Quigley, and T. Spies. Thanks also to Judy Mikowski for assistance with formatting theentire document. For their continued invaluable input throughout the INLAS project, wethank Kurt Wiedenmann and personnel from the La Grande Ranger District. We are alsograteful for the many contributions of Bob Rainville to this project.
Preface
Acknowledgments
1 Chapter 1: A Framework for the Development and Application of INLAS:the Interior Northwest Landscape Analysis SystemR. James Barbour, Alan A. Ager, and Jane L. Hayes
17 Chapter 2: A State and Transition Approach for Integrating LandscapeModelsMiles Hemstrom, Alan A. Ager, Martin Vavra, Barbara C. Wales, and MichaelJ. Wisdom
33 Chapter 3: Application of the Forest Vegetation Simulator and Related Toolsfor Integrated Modeling of Forest LandscapesAlan A. Ager
41 Chapter 4: The SafeD Forest Landscape Planning ModelPete Bettinger, David Graetz, Alan A. Ager, and John Sessions
64 Chapter 5: Assessment Techniques for Terrestrial Vertebrates ofConservation ConcernBarbara C. Wales and Lowell H. Suring
73 Chapter 6: Developing a Decision-Support Model for Assessing Conditionand Prioritizing the Restoration of Aquatic Habitat in the Interior ColumbiaBasinSteven M. Wondzell and Philip J. Howell
82 Chapter 7: Modeling the Effects of Large HerbivoresMartin Vavra, Alan A. Ager, Bruce Johnson, Michael J. Wisdom, Miles A.Hemstrom, and Robert Riggs
104 Chapter 8: Simulating Mortality From Forest Insects and DiseasesAlan A. Ager, Jane L. Hayes, and Craig L. Schmitt
117 Chapter 9: Landscape Fire Simulation and Fuel Treatment OptimizationMark A. Finney
132 Chapter 10: Connection to Local CommunitiesGary J. Lettman and Jeffrey D. Kline
137 Chapter 11: Conflicts and Opportunities in Natural Resource Management:Concepts, Tools, and Information for Assessing Values and Places Importantto PeopleRoger N. Clark
153 Chapter 12: Analysis and Modeling of Forest-Land Development at theWildland/Urban InterfaceJeffrey D. Kline
161 Chapter 13: Evaluating Forest Products as Part of Landscape PlanningR. James Barbour, Douglas Maguire, and Ryan Singleton
171 Chapter 14: BibliographyMarti Aitken and Alan A. Ager
Contents

1
Chapter 1: A Framework for the Developmentand Application of INLAS: the Interior North-west Landscape Analysis System
R. James Barbour, Alan A. Ager, and Jane L. Hayes1
The Interior Northwest Landscape Analysis System is a partnership among researchersand natural resource managers from both the public and private sectors. The project isan effort to increase our understanding of the role of vegetative succession, natural dis-turbance, and management actions at the watershed scale. The effort will advance thedevelopment and application of integrated landscape-level planning tools (models, meth-ods, and information) that use consistent assumptions and common data. Focusing onthe subbasin (landscape units of about 202 300 ha) and smaller scales, we will demon-strate the use of existing and new landscape simulation tools to project future succes-sion, disturbance, and management under various policy scenarios. These scenarioswill compare different approaches to achieving short- and long-term ecosystem goals andthe effects of regulatory constraints, ownership patterns, and limited budgets. Of specificinterest is the measurement of the long-term cumulative effects of fuels management andother treatments on key resources. The project is using a 178 000 ha watershed innortheast Oregon to prototype modeling tools and methods. The results of landscapesimulations will help to inform the debate over sustainability of forest, range, and aquaticecosystems in the intermountain West.
Keywords: Forest simulation analysis, midscale, vegetative succession, disturbance,management.
Abstract
1 R. James Barbour is a research forest products technologist,U.S. Department of Agriculture, Forest Service, Pacific NorthwestResearch Station, Forestry Sciences Laboratory, 620 SW Main,Suite 400, Portland, OR 97205. Alan A. Ager is an operationsresearch analyst, and Jane L. Hayes is a research biologicalscientist, U.S. Department of Agriculture, Forest Service, PacificNorthwest Research Station, Forestry and Range SciencesLaboratory, 1401 Gekeler Lane, La Grande, OR 97850.
2
Despite a decade of scientific assessments throughout the interior Pacific Northwest(e.g., Caraher et al. 1992, Everett et al. 1994, Gast et al. 1991, Quigley et al. 1996) andelsewhere (e.g., FEMAT 1993, Johnson 1996), the debate continues over management offorested and range lands, and aquatic systems. It is clear from these and other analysesthat decades of human activities to reduce the risk of unwanted disturbances like wild-fires and to extract goods and services have led to substantial changes in forest condi-tions and productivity. It is also evident that there is no simple remedy given landowner-ship patterns, ecosystem-level management objectives, existing landscape conditions,and the complex array of state and federal regulatory constraints (e.g., Clean Water Act1977, Endangered Species Act [ESA] 1973, National Environmental Policy Act 1969,National Forest Management Act 1976). Large areas of forest land in the intermountainWest remain in conditions lending themselves to uncharacteristically large and severewildfires and insect or disease outbreaks (Ottmar and Sandberg 2001). The problems arecompounded by finite budgets and changing economic conditions and social concernsthat can contribute to constraints on land managers (Quigley et al. 2001).
With the continued dispersal of human populations into areas that were once considered“wild,” the problem of how to manage for natural disturbance over large areas while notimpinging on human populations or negatively affecting the conservation of rare or valu-able resources becomes increasingly complex. Much of the debate over how to managefederal lands is focused on the tradeoffs among active management to produce goodsand services, moderate wildfire and other natural disturbances, and the long-term preser-vation of federally protected plant and animal species. A relevant policy question iswhether short-term goals intended to protect aquatic and terrestrial habitat for specieslisted under the 1973 ESA might impede forest management activities that are neces-sary to improve the long-term sustainability of these species. In the Blue Mountains ofnortheast Oregon, management direction for resource protection and other amenitiesmay prevent treatment of the majority of fuel-laden stands (Wilson et al., n.d.). Marketconditions and operational costs further reduce the extent to which management can beapplied to reduce risk from natural disturbances (Barbour et al., in press).
One thing that is clear from these debates is that society as a whole does not share acommon strategic vision of future forested landscapes. A blueprint for restoring and main-taining these landscapes is needed that considers the combined effects of forest suc-cession, disturbance, and management (Quigley et al. 2001). Many questions remainconcerning efficient and cost-effective scheduling and spatial distribution of managementactivities, such as prescribed fire, thinning, and selective harvesting, on large landscapesto achieve specified goals over the long run (Finney Chapter 9). Further, we do not under-stand the long-term compatibilities among commodity production, recreational use, firerisks, fuel treatments, cumulative effects of management activities on key resources,and fish and wildlife habitat goals. Some hypothesize that restricting active managementwill eventually lead to large natural disturbances that will negate the net effect of protec-tive resource policies. Others feel that management itself poses the greatest threat tosensitive resources. Unfortunately, the debate has been fed, in part, from conflicting pro-jections of potential outcomes. Decisionmakers need unbiased and consistent informa-tion about the likely outcomes of different policies or management practices as theyevaluate options.
Landscape simulation tools can aid in the development of strategic visions for managingforested and range lands by providing a means to project long-term changes from suc-cession, management, and disturbance (e.g., Bettinger et al. Chapter 4, Johnson et al.1998, Keane et al. 1996, Mladenoff and Baker 1999, Spies et al. 2002). Understanding
Introduction

3
how landscapes respond over time to perturbations is key to the development of effectiveforest policy (Turner et al. 2002). Landscape simulation tools also can aid in the growingneed to integrate social concerns with tradeoff analyses of natural resource values (Vogtet al. 2002) and provide a framework to build consistent modeling approaches acrossresource disciplines. Although a number of recent efforts have applied forest landscapesimulation modules to analyze policy issues at broad scales (e.g., Johnson et al. 1998,Keane et al. 1996, Spies et al. 2002), there has been little operational use of these toolsto examine management issues at the watershed or subbasin scale. In addition, previ-ous work has largely been concerned with modeling of forest vegetation, with relativelylittle attention to the problem of modeling nonforest conditions and social values.
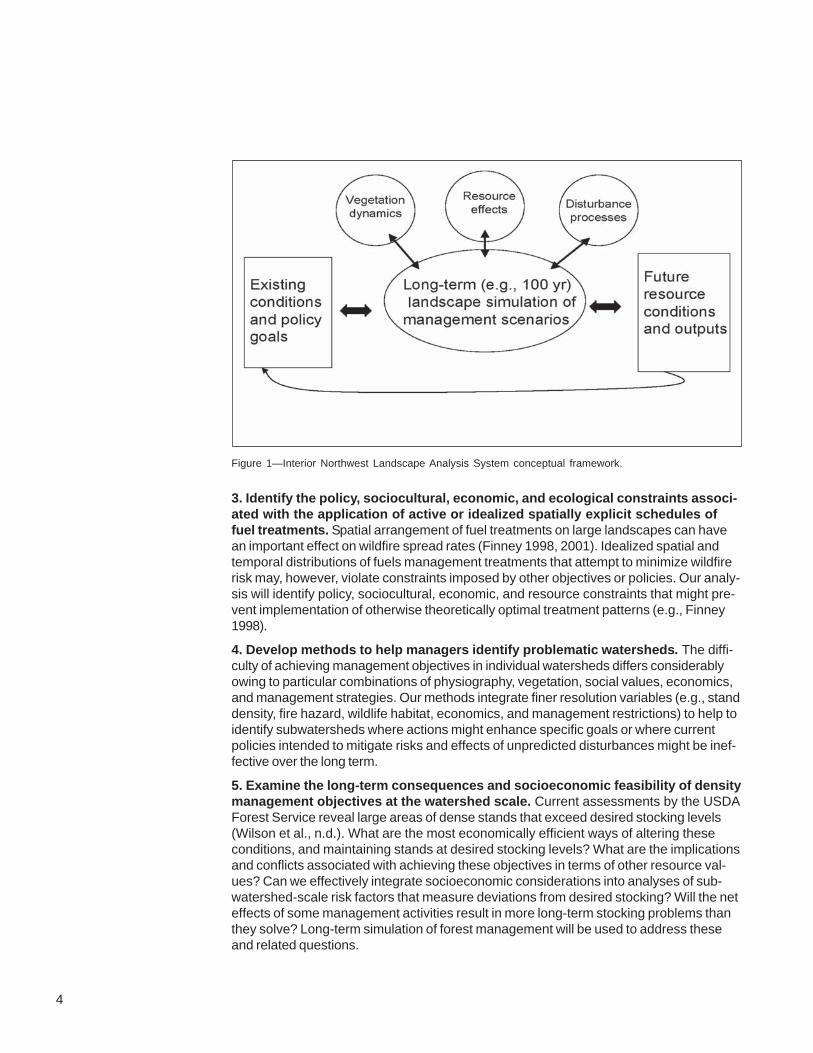
The overall goal of the Interior Northwest Landscape Analysis System (INLAS) project isto advance the development and application of integrated landscape models and applythese tools to examine the effects of forest management on long-term trajectories offorest, range, and aquatic conditions at the subbasin and smaller scales. A primary fo-cus of this work will be to apply simulation methods to measure the relative effects offorest succession, disturbance, and management on multiple-resource goals (fig. 1).
Decisionmakers can apply the techniques developed in this project to measure the re-sponse of large landscapes to different management scenarios ranging from active topassive, while accounting for expected levels of natural disturbance (Quigley et al. 2001).They also can help landowners, managers, and regulatory agencies integrate new scien-tific information into biological assessments, watershed analyses, subbasin reviews, andforest management plans. The landscape simulation methods that are advanced by thisproject will also have utility in a wide range of ecological research, especially that per-taining to disturbance processes and their effects on landscape pattern.
The combined development and application of landscape simulation methods will focuson a set of research objectives that will be addressed on a prototype analysis area.These are:
1. Evaluate the combined effects of management, natural disturbance, and suc-cession on current and future resource conditions. The current set of regulationsand management directions for individual species and habitats may not allow achieve-ment of long-term, landscape-level ecosystem goals to both manage fuels and protectresources. We will examine possible conflicts created by existing policy and manage-ment directions between short-term management for site-specific conditions and thelong-term potential for episodic and chronic disturbances to degrade those conditions.We will create a baseline scenario against which we can compare alternative policy andmanagement options. This baseline scenario will follow current guidelines and forestplans. We will then contrast potential outcomes from this scenario with two opposingscenarios: (1) passive, i.e., custodial management and (2) active, i.e., managementactions aimed at accelerated achievement of goals. Each scenario will examine a rangeof approaches that might be followed by different owners.
2. Develop new knowledge about how to reduce resource impacts by arrangingspatial schedules of treatments to manage disturbance. We will use an adaptiveapproach to apply information developed during early analyses to design spatially explicitschedules of treatments that reduce both immediate adverse effects on desirable site-specific conditions and long-term risks from stochastic disturbances. This work will illus-trate ways to make the most of spatial and temporal variation in terrestrial and aquaticconditions to reduce adverse long-term cumulative effects on sensitive resources bytaking selective management actions, such as reducing fuel loads.
4
Figure 1—Interior Northwest Landscape Analysis System conceptual framework.
3. Identify the policy, sociocultural, economic, and ecological constraints associ-ated with the application of active or idealized spatially explicit schedules offuel treatments. Spatial arrangement of fuel treatments on large landscapes can havean important effect on wildfire spread rates (Finney 1998, 2001). Idealized spatial andtemporal distributions of fuels management treatments that attempt to minimize wildfirerisk may, however, violate constraints imposed by other objectives or policies. Our analy-sis will identify policy, sociocultural, economic, and resource constraints that might pre-vent implementation of otherwise theoretically optimal treatment patterns (e.g., Finney1998).
4. Develop methods to help managers identify problematic watersheds. The diffi-culty of achieving management objectives in individual watersheds differs considerablyowing to particular combinations of physiography, vegetation, social values, economics,and management strategies. Our methods integrate finer resolution variables (e.g., standdensity, fire hazard, wildlife habitat, economics, and management restrictions) to help toidentify subwatersheds where actions might enhance specific goals or where currentpolicies intended to mitigate risks and effects of unpredicted disturbances might be inef-fective over the long term.
5. Examine the long-term consequences and socioeconomic feasibility of densitymanagement objectives at the watershed scale. Current assessments by the USDAForest Service reveal large areas of dense stands that exceed desired stocking levels(Wilson et al., n.d.). What are the most economically efficient ways of altering theseconditions, and maintaining stands at desired stocking levels? What are the implicationsand conflicts associated with achieving these objectives in terms of other resource val-ues? Can we effectively integrate socioeconomic considerations into analyses of sub-watershed-scale risk factors that measure deviations from desired stocking? Will the neteffects of some management activities result in more long-term stocking problems thanthey solve? Long-term simulation of forest management will be used to address theseand related questions.
5
The INLAS is building on two alternative methods to create a framework for modelinglandscape change. First, a state and transition approach (see Hemstrom et al. Chapter2) is being used to build a relatively coarse simulation system that integrates conifersuccession and disturbance, forest management, fluvial processes, invasive plants, andherbivory. State and transition modeling uses a relatively coarse stratification of land-scape conditions into states and simulates changes in landscape condition over time byusing transition probabilities (Hemstrom et al. Chapter 2). These state and transitionmodels evolved from successional studies in ecology and have recently found their wayinto forest planning and landscape assessment (Hann et al. 1997). Some of the advan-tages of this system are that software is well developed (Kurz et al. 2000), and dataneeded to run the model are available. The disadvantage of these methods is that theydo not consider tree list type data or other detailed information about vegetative condi-tions (Hemstrom et al. Chapter 2).
The second approach uses the extension of tree-level growth models (e.g., Forest Veg-etation Simulator [FVS], Stage 1973; ORGANON, Hann et al. 1995) to simulate land-scapes as an assemblage of individual stands, polygons, or pixels (Ager Chapter 3,Bettinger et al. Chapter 4). This stand-level simulation approach has been the focus ofconsiderable work over the past 10 to 15 years, and many improvements have beenmade to consider stand contagion, optimization, wildlife, spatial spread of insect epidem-ics, and consideration of nontimber values, as well as interfaces to the stand simulatorsto simplify the process of organizing stands for simulation (reviewed in Ager Chapter 3).We are exploring several stand-level simulation approaches, ranging from simple sys-tems that use FVS and FVS postprocessors to model each stand in a landscape (AgerChapter 3) to systems based on the Simulation and Analysis of Forests with EpisodicDisturbance (SafeD) model (Graetz 2000) that can perform spatial optimization and in-corporate natural disturbances (Bettinger et al. Chapter 4). Like the state and transitionapproach, there is a growing interest in this type of modeling for both research and op-erational applications. Stand-level landscape simulation models are well suited to prob-lems where a relatively high degree of biological and spatial resolution is required. Thisincludes studies where tree-level parameters like size and species are needed, andwhere management choices are tailored to stand metrics.
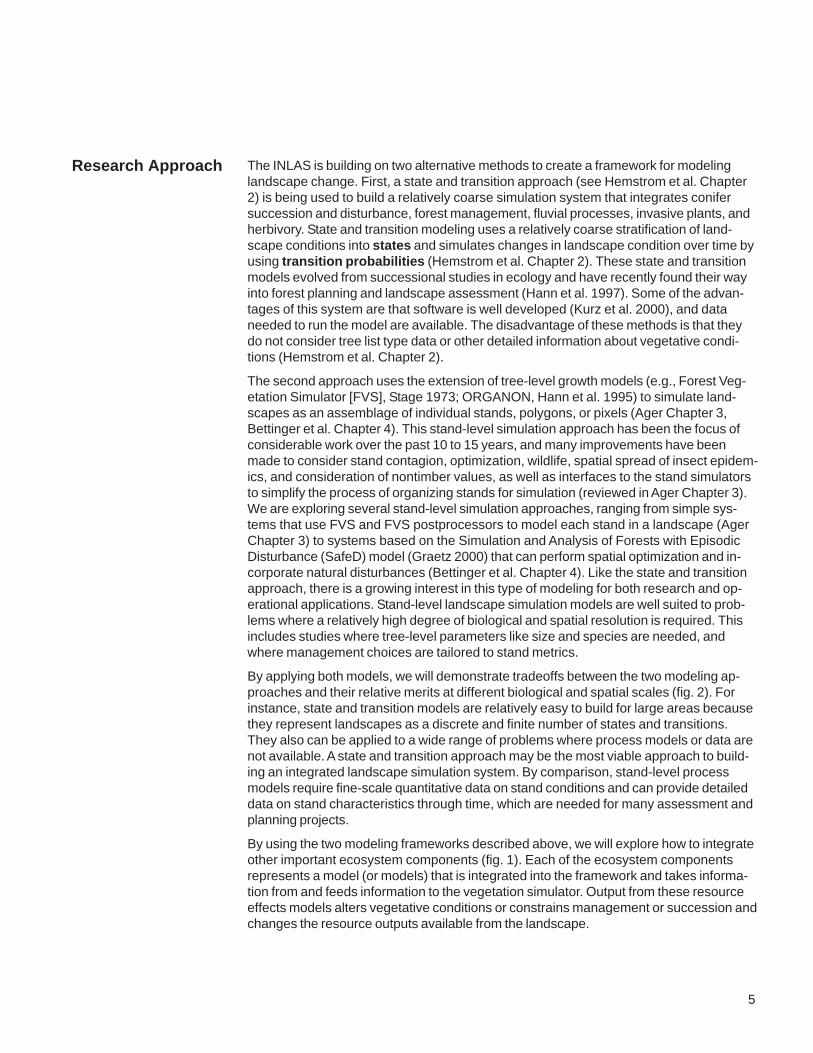
By applying both models, we will demonstrate tradeoffs between the two modeling ap-proaches and their relative merits at different biological and spatial scales (fig. 2). Forinstance, state and transition models are relatively easy to build for large areas becausethey represent landscapes as a discrete and finite number of states and transitions.They also can be applied to a wide range of problems where process models or data arenot available. A state and transition approach may be the most viable approach to build-ing an integrated landscape simulation system. By comparison, stand-level processmodels require fine-scale quantitative data on stand conditions and can provide detaileddata on stand characteristics through time, which are needed for many assessment andplanning projects.
By using the two modeling frameworks described above, we will explore how to integrateother important ecosystem components (fig. 1). Each of the ecosystem componentsrepresents a model (or models) that is integrated into the framework and takes informa-tion from and feeds information to the vegetation simulator. Output from these resourceeffects models alters vegetative conditions or constrains management or succession andchanges the resource outputs available from the landscape.
Research Approach
6
Descriptions of the status or state of the art of modeling efforts in each of the areas,along with research needs, are provided in the subsequent chapters of this volume.Wales and Suring (Chapter 5) identify methods to describe and evaluate habitat abun-dance, quality, and distribution across space and time to help managers and policy-makers understand how successional processes, natural disturbance, and managementactions influence terrestrial habitats. Wondzell and Howell (Chapter 6) review alternativemodeling approaches for assessing conditions and prioritizing the restoration of aquatichabitat in the context of biophysical characteristics of streams and watersheds and land-scape processes. Chronic disturbance by domestic and wild ungulates is known to sig-nificantly affect ecosystem patterns, but as Vavra et al. (Chapter 7) describe, there is aneed to develop models that can project the effects of ungulate herbivory at multiplescales. By contrast, episodic disturbances such as insect and disease outbreaks orwildfire have been the subjects of intensive modeling efforts. Ager et al. (Chapter 8) re-view the quantitative methods for modeling mortality caused by insects and disease anddescribe the major gaps in this area. Finney (Chapter 9) describes the state of the artand research needs in integrating wildfire into landscape planning models. Lettman andKline (Chapter 10) examine approaches to evaluate economic impacts of current andalternative management scenarios, and public values and attitudes toward forests. Theimpacts of human population growth, diversification, movement, and accompanying landuse change are important factors in forest management as the wildland/urban interfaceexpands. Clark (Chapter 11) describes approaches for identifying and evaluating the val-ues and places that are important to people. Kline (Chapter 12) describes modeling and
Figure 2—Comparison of a multistand versus state/transition modeling approach for forest landscapesimulation in terms of biological and geographic scale.
7
analyses of residential and other development scenarios that can contribute to anticipat-ing where land use change is likely to occur. Barbour et al. (Chapter 13) describe tech-niques for displaying the ecological and economic costs and benefits of timber removalor gathering nontimber forest products.
The specifics of how these individual components might be refined and integrated arepart of the major developmental challenges of the INLAS project. Some aspects of inte-gration are covered in the chapters that follow in this volume, whereas others will be de-veloped as the project evolves.
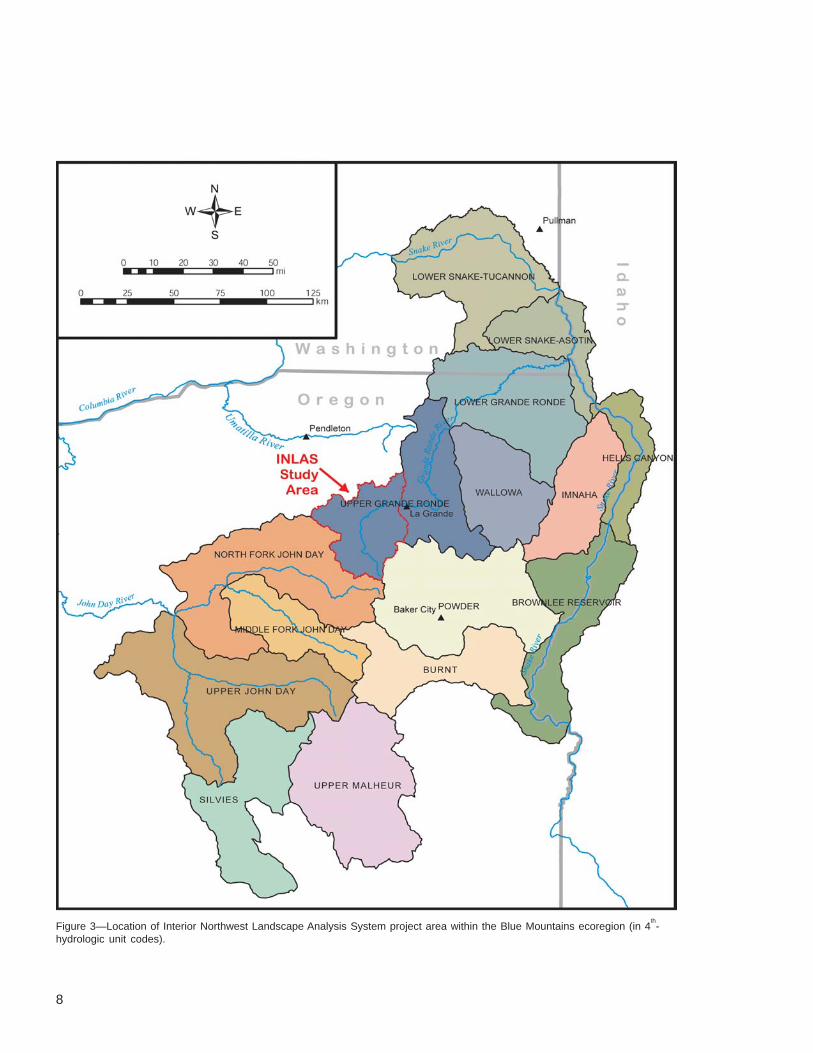
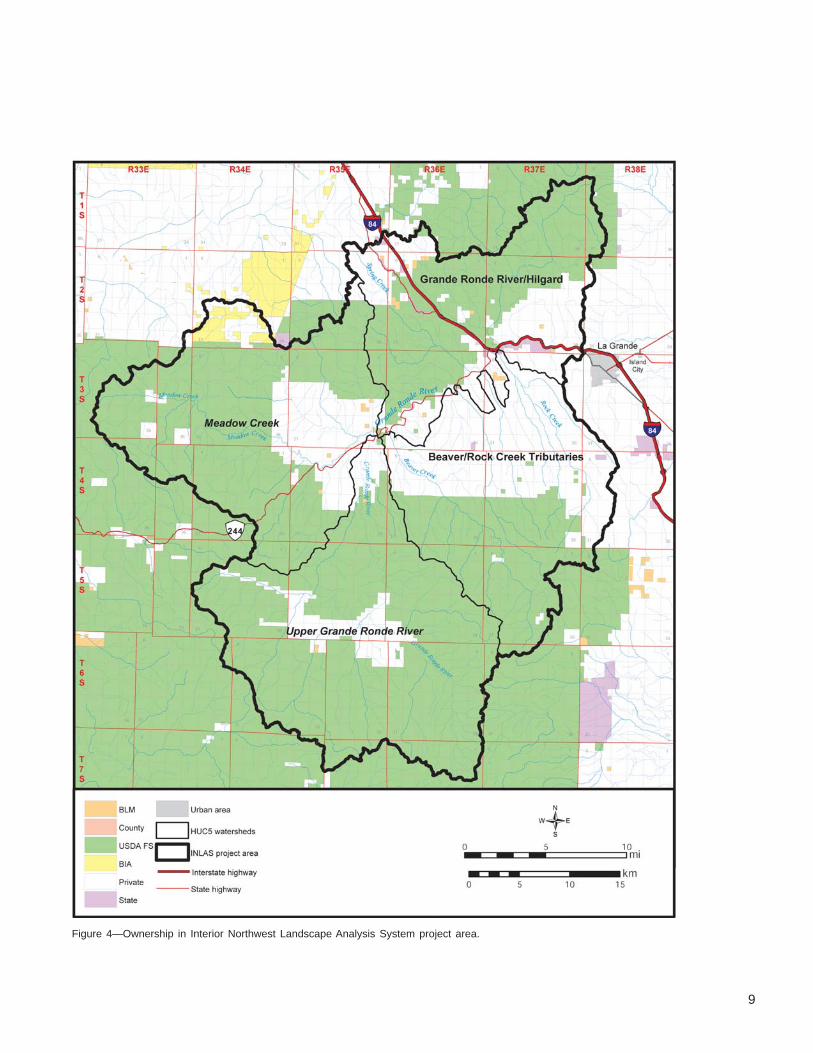
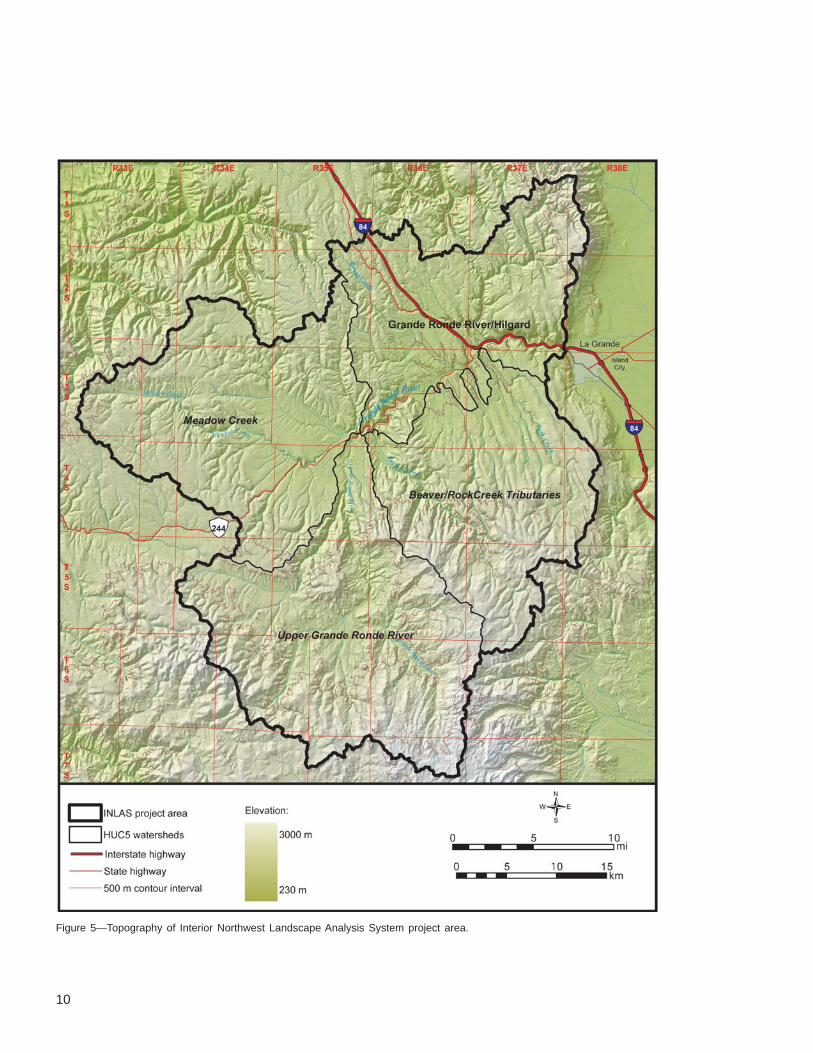
Lying within the Upper Grande Ronde watershed, a 4th-hydrologic unit code (HUC4)subbasin, the INLAS project area comprises four HUC5 units occupying about 178 000ha of mixed forest and rangelands on the eastern flank of the Blue Mountains southwestof La Grande, Oregon (fig. 3). The La Grande Ranger District of the Wallowa-WhitmanNational Forest administers about 123 000 of these ha (fig. 4). Most of the remainingland is nonindustrial private (about 55 000 ha). Smaller areas are owned by the Confeder-ated Tribes of the Umatilla (about 13 800 ha), Boise Cascade (about 5000 ha), and thestate of Oregon (about 810 ha). Numerous residences exist on nonindustrial privatelands around the town of Starkey. The topography is highly varied and complex, withdeeply dissected drainages feeding into the Grande Ronde River as it runs north throughthe center of the subbasin (fig. 5). Elevations range from 820 to over 2130 m. Vegetationranges from xeric, bunchgrass communities at the lower, north end of the project area, tomixed conifer and subalpine fir (Abies lasiocarpa (Hook.) Nutt.) on the eastern flanks ofthe Elkhorn Mountains. Fuel loadings are highly heterogeneous across the project area,and a number of large wildfires have occurred over the last 10 years, burning about 8100ha. Two additional large wildfires burned as much as 24 300 ha on lands immediatelyadjacent to the Upper Grande Ronde subbasin and project area. An outbreak of sprucebudworm (Choristoneura occidentalis) occurred throughout the 1980s causing extensiveDouglas-fir (Pseudotsuga menziesii (Mirb.) Franco) and grand fir (Abies grandis (Dougl.ex D. Don) Lindl.) mortality throughout the Blue Mountains including the Upper GrandeRonde subbasin. Outbreaks of bark beetles (Dendroctonus spp.) have also occurred inand adjacent to the project area.
Forest Service lands are managed with emphases ranging from scenic areas to com-modity production. The Starkey Experimental Forest and Range (about 8900 ha) islocated in the project area on the southwestern portion of the subbasin and includesresearch facilities of the Starkey Project (Rowland et al. 1997, Vavra et al. 2002). TheUpper Grande Ronde subbasin contains habitat for three federally threatened species,the Canada lynx (Lynx canadensis), the gray wolf (Canis lupus), and the bald eagle(Haliaeetus leucocephalus). About 40 additional terrestrial vertebrates of conservationconcern identified by Wisdom et al. (2000) are likely to occur in the Upper GrandeRonde subbasin. This area may provide habitat for several of the 15 insect species cur-rently listed as threatened, endangered, or sensitive in east-side forests (LaBonte et al.2001). The project area includes potential habitat for three federally listed threatened andone candidate plant species (USF&WS 2002). An additional eight plant species, cur-rently designated as sensitive by the USDA, Forest Service, Pacific Northwest Region,have been documented in the INLAS project area. The Grande Ronde River and its tribu-taries also contain habitat for federally threatened chinook salmon (Oncorhynchustshwaytscha (Walbaum)), bull trout (Salvelinus fontinalis), and steelhead (Salvelinusconfluentus). For more detailed information about this area, an extensive bibliography ofreports and published literature is provided in the final chapter of this volume (Aitken andAger Chapter 14).
Project Area
Text continues on page 11
8
Figure 3—Location of Interior Northwest Landscape Analysis System project area within the Blue Mountains ecoregion (in 4th-
hydrologic unit codes).
9
Figure 4—Ownership in Interior Northwest Landscape Analysis System project area.
10
Figure 5—Topography of Interior Northwest Landscape Analysis System project area.

11
Although the direct application of analyses from the prototype area is limited in geo-graphic scope, the lessons learned while conducting these analyses will find use in themuch broader policy arena. The product mix from the INLAS project will include method-ologies, new scientific knowledge, and much information germane to current policy de-bates over sustainability and conservation of natural resources. Analyses will clarifymany socioeconomic and ecological interactions for which we have a poor understand-ing. This will help scientists identify the most productive areas for future research.
We anticipate that methods we develop for the Upper Grande Ronde prototype area willhave applicability to other areas. Some of the methods we develop at the subbasin scalecan be “scaled up” to larger areas, e.g., analysis of lynx habitat, or applied on a largenumber of other subbasins across the Blue Mountains to answer midscale questions. Inaddition, by developing methods at the midscale, we hope to better understand the largerscale issues and develop ways to use our methods and results at both larger (e.g., for-est or regional planning) and smaller scales, (e.g., watershed assessments and projectplans). We are working closely with the regional planning staff members to ensure theproducts produced by INLAS are useful and fit into the planning process. We are alsoworking with the La Grande Ranger District on a relatively small (about 2400 ha) wild-land/urban interface fuels-reduction project to prototype some of the analysis tools.
The users of the products developed during this project include those involved in, or inter-ested in the outcome of, watershed assessments, forest planning, and policy analysis. Amajor drawback of previous landscape modeling efforts is that the data requirements andintricacies of the modeling process rendered existing systems unworkable to most pro-spective users. Many of our methods and processes are built on existing data, tools,and software to make them more readily adaptable by managers who may already befamiliar with the underlying programs. Where new design and development are needed,we plan to work with developers to facilitate the incorporation of our prototype softwareinto preferred systems.
Some of the anticipated outcomes from the INLAS project include:
• Developing methods to perform analyses at the interface of policy, management, andscience that rely on a consistent set of assumptions and common data.
• Providing information from landscape analyses to local and state political leaders,government and private resource managers, scientists, and policymakers.
• Demonstrating the breadth of management options to policymakers, resourcemanagers, researchers, and the public.
• Facilitating discussions about realistic balances among goals among managers,policymakers who represent different landowners, and the public.
• Illustrating how actions by nonfederal owners might influence the capability ofmeeting different policy objectives on federally managed land and vice versa.
• Gaining insights into the influence of scale in determining the importance ofmanagement actions within different ownership patterns.
• Identifying specific knowledge gaps in ecological research, management science,and resource planning analysis.
Audience andProducts
12
The development and application of different aspects of the work are described in thechapters that follow. Each of these component efforts will produce methods and toolsthat not only contribute to accomplishing the specific goals of the INLAS project but alsocan operate outside of the INLAS simulation framework. The integrative products result-ing from interactions among sets of two or more components of the framework will helpto highlight how different resource values complement or conflict with one another.
When you know: Multiply by: To get:
Hectares (ha) 2.47 Acres (ac)
Meters (m) 3.28 Feet (ft)
Ager, A.A. 2004. Application of the Forest Vegetation Simulator and related tools forintegrated modeling of forest landscapes. In: Hayes, J.L.; Ager, A.A.; Barbour, R.J.,tech. eds. Methods for integrating modeling of landscape change: Interior NorthwestLandscape Analysis System. Gen. Tech. Rep. PNW-GTR-610. Portland, OR: U.S.Department of Agriculture, Forest Service, Pacific Northwest Research Station: 33-40.Chapter 3.
Ager, A.A.; Hayes, J.L.; Schmitt, C.L. 2004. Simulating mortality from forest insectsand diseases. In: Hayes, J.L.; Ager, A.A.; Barbour, R.J., tech. eds. Methods for inte-grating modeling of landscape change: Interior Northwest Landscape Analysis Sys-tem. Gen. Tech. Rep. PNW-GTR-610. Portland, OR: U.S. Department of Agriculture,Forest Service, Pacific Northwest Research Station: 104-116. Chapter 8.
Aitken, M.; Ager, A.A. 2004. Bibliography. In: Hayes, J.L.; Ager, A.A.; Barbour, R.J.,tech. eds. Methods for integrating modeling of landscape change: Interior NorthwestLandscape Analysis System. Gen. Tech. Rep. PNW-GTR-610. Portland, OR: U.S.Department of Agriculture, Forest Service, Pacific Northwest Research Station:171-218. Chapter 14.
Barbour, R.J.; Fight, R.D.; Christensen, G.A.; Pinjuv, G.L.; Nagubadi, V. 2004. Thin-ning and prescribed fire and projected trends in wood product potential, financial re-turn, and fire hazard in Montana. Gen. Tech. Rep. PNW-GTR-606. Portland, OR: U.S.Department of Agriculture, Forest Service, Pacific Northwest Research Station. 78 p.
Barbour, R.J.; Maguire, D.; Singleton, R. 2004. Evaluating forest products as part oflandscape pIanning. In: Hayes, J.L.; Ager, A.A.; Barbour, R.J., tech. eds. Methods forintegrating modeling of landscape change: Interior Northwest Landscape AnalysisSystem. Gen. Tech. Rep. PNW-GTR-610. Portland, OR: U.S. Department of Agricul-ture, Forest Service, Pacific Northwest Research Station: 161-170. Chapter 13.
Bettinger, P.; Graetz, D.; Ager, A.A.; Sessions, J. 2004. The SafeD forest landscapeplanning model. In: Hayes, J.L.; Ager, A.A.; Barbour, R.J., tech. eds. Methods forintegrating modeling of landscape change: Interior Northwest Landscape AnalysisSystem. Gen. Tech. Rep. PNW-GTR-610. Portland, OR: U.S. Department of Agricul-ture, Forest Service, Pacific Northwest Research Station: 41-63. Chapter 4.
Caraher, D.L.; Henshaw, J.; Hall, F. [et al.], [panel members]. 1992. Restoring eco-systems in the Blue Mountains: a report to the Regional Forester and forest supervi-sors of the Blue Mountains forests; final report. Portland, OR: U.S. Department ofAgriculture, Forest Service, Pacific Northwest Region. 14 p. [plus appendices].
English Equivalent
Literature Cited

13
Clark, R.N. 2004. Conflicts and opportunities in natural resource management: con-cepts, tools, and information for assessing values and places important to people. In:Hayes, J.L.; Ager, A.A.; Barbour, R.J., tech. eds. Methods for integrating modeling oflandscape change: Interior Northwest Landscape Analysis System. Gen. Tech. Rep.PNW-GTR-610. Portland, OR: U.S. Department of Agriculture, Forest Service, PacificNorthwest Research Station: 137-152. Chapter 11.
Clean Water Act of 1977; 33 U.S.C. s/s 1251 et seq.
Endangered Species Act of 1973 [ESA]; 16 U.S.C. 1531-1536, 1538-1540.
Everett, R.L.; Hessburg, P.F.; Jensen, M.E.; Bormann, B.T. 1994. Eastside forestecosystem health assessment, executive summary. Gen. Tech. Rep. PNW-GTR-317.Portland, OR: U.S. Department of Agriculture, Forest Service, Pacific Northwest Re-search Station. 61 p. Vol. 1. (Everett, R.L., assessment team leader, Eastside forestecosystem health assessment).
Finney, M.A. 1998. FARSITE: fire area simulator—model development and evaluation.Res. Pap. RMRS-RP-4. Fort Collins, CO: U.S. Department of Agriculture, ForestService, Rocky Mountain Research Station. 47 p.
Finney, M.A. 2001. Design of regular landscape fuel treatment patterns for modifying firegrowth and behavior. Forest Science. 47: 219-228.
Finney, M.A. 2004. Landscape fire simulation and fuel treatment optimization. In:Hayes, J.L.; Ager, A.A.; Barbour, R.J., tech. eds. Methods for integrating modeling oflandscape change: Interior Northwest Landscape Analysis System. Gen. Tech. Rep.PNW-GTR-610. Portland, OR: U.S. Department of Agriculture, Forest Service, PacificNorthwest Research Station: 117-131. Chapter 9.
Forest Ecosystem Management Assessment Team [FEMAT]. 1993. Forest ecosys-tem management: an ecological, economic, and social assessment. Portland, OR:U.S. Department of Agriculture; U.S. Department of the Interior [et al.]. [Irregularpagination].
Gast, W.R., Jr.; Scott, D.W.; Schmitt, C. [et al.]. 1991. Blue Mountains forest healthreport: new perspectives in forest health. Portland, OR: U.S. Department of Agricul-ture, Forest Service, Malheur, Umatilla, and Wallowa-Whitman National Forests.[Irregular pagination].
Graetz, D. 2000. The SafeD model: incorporating episodic disturbances and heuristicprogramming into forest management planning for the Applegate River watershed,southwestern Oregon. Corvallis, OR: College of Forest Resources, Oregon StateUniversity. 127 p. M.S. thesis.
Hann, D.W.; Hester, A.S.; Olsen, C.L. 1995. ORGANON user’s manual: edition 5.0.Corvallis, OR: Department of Forest Resources, Oregon State University. 127 p.
Hann, W.J.; Jones, J.L.; Karl, M.G. [et al.]. 1997. Landscape dynamics in the basin.In: Quigley, T.M.; Arbelbide, S.J., eds. An assessment of ecosystem components inthe interior Columbia basin and portions of the Klamath and Great Basins. Gen. Tech.Rep. PNW-GTR-405. Portland, OR: U.S. Department of Agriculture, Forest Service,Pacific Northwest Research Station: 337-1077. Vol. 2. (Quigley, T.M., ed.; InteriorColumbia Basin Ecosystem Management Project: scientific assessment).

14
Hemstrom, M.; Ager, A.A.; Vavra, M. [et al.]. 2004. A state and transition approach forintegrating landscape models. In: Hayes, J.L.; Ager, A.A.; Barbour, R.J., tech. eds.Methods for integrating modeling of landscape change: Interior Northwest LandscapeAnalysis System. Gen. Tech. Rep. PNW-GTR-610. Portland, OR: U.S. Departmentof Agriculture, Forest Service, Pacific Northwest Research Station: 17-32. Chapter 2.
Johnson, K.N. 1996. Bioregional assessments in the Pacific Northwest—past, present,and future. In: Kohm, K.; Franklin, J., eds. Forestry for the 21st century. Washington,DC: Island Press: 397-409.
Johnson, K.N.; Sessions, J.; Franklin, J.; Gabriel, J. 1998. Integrating wildfire intostrategic planning for Sierra Nevada forests. Journal of Forestry. 96(1): 42-49.
Keane, R.E.; Long, D.G.; Menakis, J.P. [et al.]. 1996. Simulating coarse scale vegeta-tion dynamics using the Columbia River basin succession model—CRBSUM. Gen.Tech. Rep. INT-GTR-340. Ogden, UT: U.S. Department of Agriculture, Forest Service,Intermountain Research Station. 50 p.
Kline, J. 2004. Analysis and modeling of forest land development at the forest/urbaninterface. In: Hayes, J.L.; Ager, A.A.; Barbour, R.J., tech. eds. Methods for integrat-ing modeling of landscape change: Interior Northwest Landscape Analysis System.Gen. Tech. Rep. PNW-GTR-610. Portland, OR: U.S. Department of Agriculture, For-est Service, Pacific Northwest Research Station: 153-160. Chapter 12.
Kurz, W.A.; Beukema, S.J.; Klenner, W. [et al.]. 2000. TELSA: the tool for explor-atory landscape scenario analysis. Computers and Electronics in Agriculture. 27:227-242.
LaBonte, J.R.; Scott, D.W.; McIver, J.; Hayes, J.L. 2001. Threatened, endangered,and sensitive insects in eastern Oregon and Washington forests and adjacent lands.Northwest Science. 75(Spec. issue): 185-198.
Lettman, G.J.; Kline, J.D. 2004. Connection to local communities. In: Hayes, J.L.;Ager, A.A.; Barbour, R.J., tech. eds. Methods for integrating modeling of landscapechange: Interior Northwest Landscape Analysis System. Gen. Tech. Rep. PNW-GTR-610. Portland, OR: U.S. Department of Agriculture, Forest Service, Pacific NorthwestResearch Station: 132-136. Chapter 10.
Mladenoff, D.; Baker, W.L. 1999. Development of forest and landscape modeling ap-proaches. In: Mladenoff, D.; Baker, B.L., eds. Spatial modeling of forest landscapechange: approaches and applications. Cambridge, United Kingdom: CambridgeUniversity Press: 1-13.
National Environmental Policy Act of 1969 [NEPA]; 42 U.S.C. 4321 et seq.
National Forest Management Act of 1976 [NFMA]; Act of October 22, 1976; 16U.S.C. 1600.
Ottmar, R.D.; Sandberg, D.V. 2001. Wildland fire in eastern Oregon and Washington.Northwest Science. 75(Spec. issue): 46-54.
Quigley, T.M.; Hayes, J.L.; Starr, G.L. [et al.]. 2001. Improving forest health and pro-ductivity in eastern Oregon and Washington and adjacent lands. Northwest Science.75(Spec. issue): 234-251.

15
Quigley, T.M.; Haynes, R.W.; Graham, R.T., tech. eds. 1996. Integrated scientificassessment for ecosystem management in the interior Columbia basin and portionsof the Klamath and Great Basins. Gen. Tech. Rep. PNW-GTR-382. Portland, OR:U.S. Department of Agriculture, Forest Service, Pacific Northwest Research Station.303 p. (Quigley, T.M., ed.; Interior Columbia Basin Ecosystem Management Project:scientific assessment).
Rowland, M.M.; Bryant, L.D.; Johnson, B.K. [et al.]. 1997. The Starkey project: his-tory, facilities, and data collection methods for ungulate research. Gen. Tech. Rep.PNW-GTR-396. Portland, OR: U.S. Department of Agriculture, Forest Service, PacificNorthwest Research Station. 62 p.
Spies, T.; Reeves, G.; Burnett, K.M. [et al.]. 2002. Assessing the ecological conse-quences of forest policies in a multi-ownership province in Oregon. In: Liu, J.; Taylor,W.W., eds. Integrating landscape ecology into natural resource management. Cam-bridge, United Kingdom: Cambridge Press: 177-207.
Stage, A.R. 1973. Prognosis model for stand development. Res. Pap. RP-INT-137.Ogden, UT: U.S. Department of Agriculture, Forest Service, Intermountain ResearchStation. 32 p.
Turner, M.; Crow T.R.; Liu, J. [et al.]. 2002. Bridging the gap between landscape ecol-ogy and natural resource management. In: Liu, J.; Taylor, W.W., eds. Integrating land-scape ecology into natural resource management. Cambridge, United Kingdom:Cambridge Press: 433-460.
U.S. Fish and Wildlife Service [USF&WS]. 2002. Species list No. 1-4-02-SP-912, FileNo. 118.0000 of September 2002. (Letter to Forest Supervisor listing species of con-cern for the La Grande Ranger District, Wallowa-Whitman National Forest). On filewith: La Grande Ranger District, 3502 Hwy 30, La Grande, OR 97850.
Vavra, M.; Ager, A.A.; Johnson, B. [et al.]. 2004. Modeling the effects of large herbi-vores. In: Hayes, J.L.; Ager, A.A.; Barbour, R.J., tech. eds. Methods for integratingmodeling of landscape change: Interior Northwest Landscape Analysis System. Gen.Tech. Rep. PNW-GTR-610. Portland, OR: U.S. Department of Agriculture, ForestService, Pacific Northwest Research Station: 82-103. Chapter 7.
Vavra, M.; Wisdom, W.; Kie, J. 2002. Ecology effects of ungulate team problem analy-sis, managing disturbance regimes program. Team problem analysis. On file with:Pacific Northwest Research Station, 1401 Gekeler Lane, La Grande, OR 97850.
Vogt, K.; Grove, M.; Asbjornsen, H. [et al.]. 2002. Linking ecological and socialscales for natural resource management. In: Liu, J.; Taylor, W.W., eds. Integratinglandscape ecology into natural resource management. Cambridge, United Kingdom:Cambridge Press: 143-175.
Wales, B.C.; Suring, L. 2004. Assessment techniques for terrestrial vertebrates of con-servation concern. In: Hayes, J.L.; Ager, A.A.; Barbour, R.J., tech. eds. Methods forintegrating modeling of landscape change: Interior Northwest Landscape AnalysisSystem. Gen. Tech. Rep. PNW-GTR-610. Portland, OR: U.S. Department of Agricul-ture, Forest Service, Pacific Northwest Research Station: 64-72. Chapter 5.

16
Wilson, D.; Maguire, D.; Barbour, J. [N.d.]. Assessment of the small-diameter timberharvest from restoration treatments in densely-stocked stands on national forests ineastern Oregon. Western Journal of Applied Forestry.
Wisdom, M.J.; Holthausen, R.S.; Wales, B.C. [et al.]. 2000. Source habitats forterrestrial vertebrates of focus in the interior Columbia basin: broad-scale trends andmanagement implications. Gen. Tech. Rep. PNW-GTR-485. Portland, OR: U.S.Department of Agriculture, Forest Service, Pacific Northwest Research Station.1119 p. 3 vol.
Wondzell, S.; Howell, P. 2004. Developing a decision support model for assessingcondition and prioritizing the restoration of aquatic habitat in the interior ColumbiaBasin. In: Hayes, J.L.; Ager, A.A.; Barbour, R.J., tech. eds. Methods for integratingmodeling of landscape change: Interior Northwest Landscape Analysis System. Gen.Tech. Rep. PNW-GTR-610. Portland, OR: U.S. Department of Agriculture, ForestService, Pacific Northwest Research Station: 73-81. Chapter 6.
17
Chapter 2: A State and Transition Approach forIntegrating Landscape Models
Miles Hemstrom, Alan A. Ager, Martin Vavra, Barbara C. Wales, andMichael J. Wisdom1
We will use state and transition modeling (STM) to project landscape dynamics in aportion of the Upper Grande Ronde subbasin, northeastern Oregon. The Interior North-west Landscape Analysis System effort will develop both process-based models andSTM to represent vegetation, disturbance, and management interactions across largelandscapes. State and transition models are useful for integrating disturbances, man-agement activities, and vegetation growth and development across large, variable land-scapes, but are not currently useful for finding optimal solutions to meet landscapemanagement objectives. Process-based models are useful for detailed modeling of veg-etation changes and optimization but can be difficult to develop and parameterize acrossmany disturbances and highly variable vegetation conditions. We discuss advantagesand limitations of STM in the context of integrated scientific analysis and land manage-ment planning at subbasin and broader scales. We provide an example of how suchmodels might be used to project the integrated effects of vegetation management, fire,invasive plants, ungulate herbivory, and other disturbances on vegetation across a largelandscape in northeastern Oregon. We suggest enhancements of existing STMs that willuse process-based models to calibrate states and transitions.
Keywords: Landscape simulation, northeastern Oregon, landscape ecology.
Abstract
1 Miles Hemstrom is a research ecologist, U.S. Department ofAgriculture, Forest Service, Pacific Northwest Research Station,Forestry Sciences Laboratory, 620 SW Main, Suite 400, Portland,OR 97205. Alan A. Ager is an operations research analyst,Martin Vavra is a research range scientist, Barbara C. Walesis a wildlife biologist, and Michael J. Wisdom is a researchwildlife biologist, U.S. Department of Agriculture, Forest Service,Pacific Northwest Research Station, Forestry and RangeSciences Laboratory, 1401 Gekeler Lane, La Grande, OR 97850.
18
Landscape simulation models have been widely applied to address research and landmanagement policy questions in the Western United States and elsewhere (Bettinger etal. 1997, 1998; Graetz 2000; Hann et al. 1997; Mladenoff and He 1999; USDA and USDI2000). Advances in modeling techniques, computer technology, and geographic informa-tion systems (GIS) have made it possible to model large landscapes at increasingly finerscales of spatial and temporal resolution. However, natural resource planning modelsused in the past focused primarily on conifer succession and management while repre-senting other key ecosystem elements as byproducts (e.g., Alig et al. 2000, Johnson etal. 1986). Although progress has been made in the formulation of multiobjective goals inlandscape simulations (e.g., Sessions et al. 1999, Wedin 1999), there remain manychallenges to building landscape planning models that include all the important distur-bance processes that influence landscape change. Previous efforts have often not in-cluded widespread, chronic disturbances (e.g., ungulate herbivory) or have focused onselected environments (e.g., forests) rather than entire landscapes. Of particular interestin the Interior Northwest Landscape Analysis System (INLAS) context are the net, syner-gistic effects of various disturbances (e.g., fire, invasive plants, large herbivores, andhydrologic processes as they affect geomorphology and associated riparian habitat)across a large landscape that includes a variety of environments. Integrating these kindsof disturbances is exceedingly complex in models that treat vegetation and disturbanceon continuous scales.
An alternative approach is to represent the effects of these disturbances in discrete formin state and transition modeling (STM). In parallel with Simulation and analysis of forestswith episodic Disturbances (SafeD) developments for INLAS (Bettinger et al. Chapter 4),we will use STM for multiresource integration in a landscape planning model. The broadgoal of this work is to develop prototype disturbance models in a STM framework thatintegrates major environments, vegetation types, ownerships, and disturbances across alarge and diverse landscape. This effort will use the Vegetation Development DynamicsTool (VDDT; Beukema and Kurz 1995) and the associated Tool for Exploratory Land-scape Scenario Analysis (TELSA; Kurz et al. 2000), which have many features thatmake them well suited for developing and testing new approaches to landscape simula-tion. Ultimately, this work will lead to more refined, integrated approaches to understand-ing the interplay of disturbances and vegetation across large, variable landscapes. Wealso will examine the potentially complementary linkage of STM with more detailed, con-tinuous simulations from SafeD. Our expectation is that detailed simulations from SafeDcan be used to calibrate states and transitions while STM can examine landscape-wideinteractions of vegetation types and disturbances that cannot readily be included inSafeD.
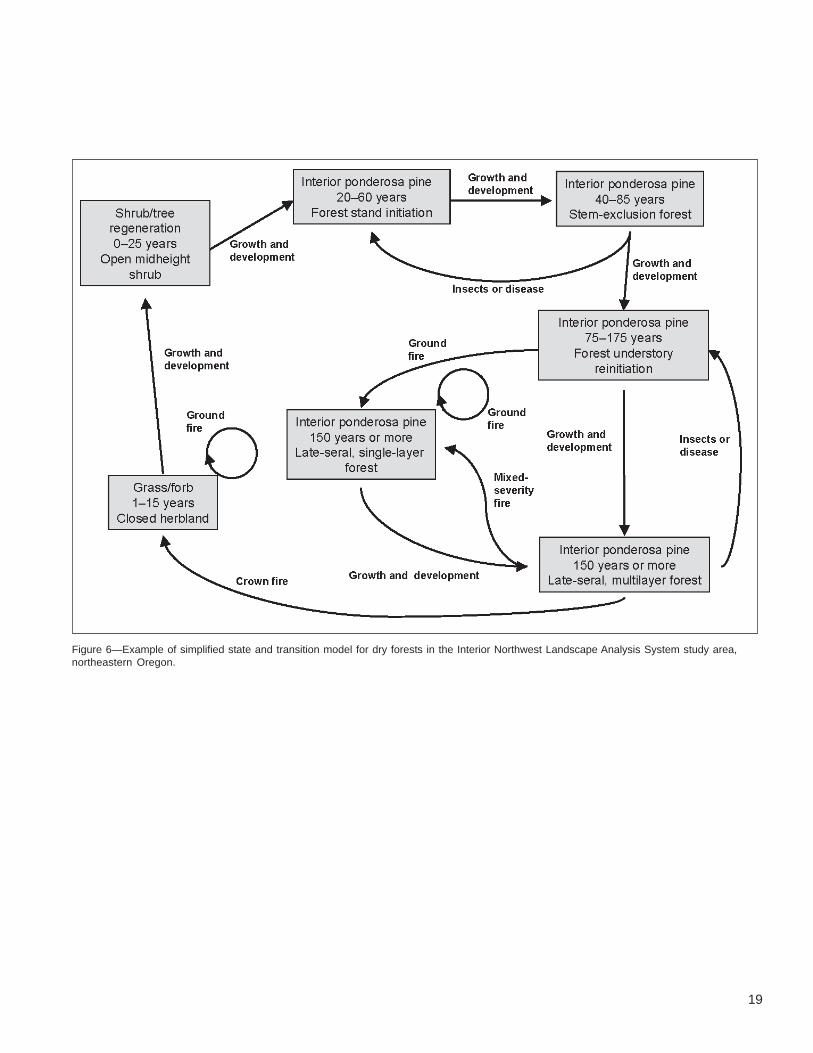
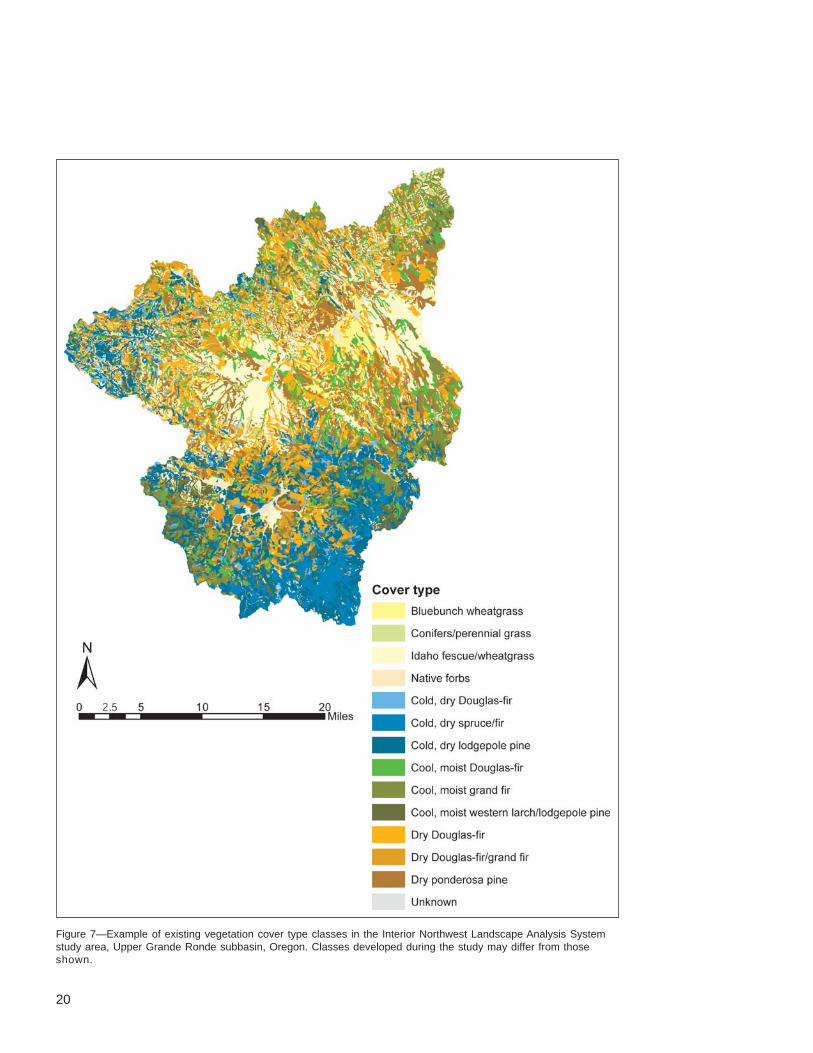
State and transition models treat vegetation composition and structure as “states,” con-nected by transitions that indicate vegetation development over time and disturbance(fig. 6). This STM approach builds from transition matrix models that represent vegeta-tion development as a set of transition probabilities among various vegetation conditions(e.g., Cattelino et al. 1979, Hann et al. 1997, Horn 1975, Laycock 1991, Noble andSlatyer 1980) (figs. 7 and 8). Vegetation states change over time barring managementactivities or disturbances. For example, grass/forb-closed herblands become shrub/treeregeneration-open midheight shrubs after 15 years. State change along the succes-sional, time-dependent path is deterministic and, without disturbance or management,all the vegetation would ultimately accumulate in one long-term stable state. However,disturbance or management activities can change the course of vegetative development
State and TransitionModels
Introduction
Text continues on page 22
19
Figure 6—Example of simplified state and transition model for dry forests in the Interior Northwest Landscape Analysis System study area,northeastern Oregon.
20
Figure 7—Example of existing vegetation cover type classes in the Interior Northwest Landscape Analysis Systemstudy area, Upper Grande Ronde subbasin, Oregon. Classes developed during the study may differ from thoseshown.

21
Figure 8—Example of existing vegetation structure classes in the Interior Northwest Landscape AnalysisSystem study area, Upper Grande Ronde subbasin, Oregon. Classes developed during the study may differfrom those shown.

22
at any point. Depending on disturbance probabilities and consequences, very little orno vegetation may actually accumulate in the long-term stable state at the end pointof succession. In our example (fig. 6), insect and disease activity may reset interiorponderosa pine (Pinus ponderosa Dougl. ex Laws.)/stem-exclusion forest to the stand-initiation condition. In contrast to successional development, disturbances, includingmanagement, are probabilistic and possible at each time step, depending on vegetationstate. A separate model (states and transitions) is developed for each modeling stratum(groups of potential vegetation types in the study area, see Hall 1998). We anticipate15 or more modeling strata in the study area (figs. 7, 8, and 9). The example used forillustration (fig. 6) has been substantially simplified. Most models will be considerablymore complex. Many of the models we use will contain “transition thresholds” influencedby site degradation or invasive plants, beyond which recovery to previous plant commu-nity conditions is difficult or impossible (e.g., Laycock 1991). Hann et al. 1997 andHemstrom et al. (in press) used several such models to depict vegetation change acrossthe interior Columbia basin.
A number of STM systems have been developed in the past 5 to 10 years and applied onWestern landscapes either as research or planning tools, including SIMulating vegetativePatterns and Processes at Landscape ScaLEs (Barrett 2001, Chew 1995), LANDscapeSUccession Model (Barrett 2001, Keane et al. 1996), and VDDT (Beukema and Kurz1995). We will use VDDT (Beukema and Kurz 1995) and the associated TELSA (Kurz etal. 2000). The VDDT planning tool is a nonspatial model that allows building and testingSTM for a set of environmental strata. The TELSA planning tool is a spatial application ofVDDT that includes spatial analyses and spatial contagion of disturbances. Both modelscontain visual interfaces and other features that make them relatively easy to use. Inaddition, they have been used in landscape assessments and land management plan-ning in the interior Northwest. The interior Columbia basin landscape assessment (Hannet al. 1997) built VDDT models for a broad cross section of range and forest lands in theinterior Northwest. These and similar models are being used by some national forests forrevisions to their land management plans (e.g., Merzenich et al., in press). Use of STMis a significant departure for national forest land management planning from past effortswhere harvest scheduling models were predominantly used (e.g., Johnson et al. 1986).Harvest scheduling models made extensive use of timber inventories and linear program-ming to explore resource tradeoffs and marginal costs, as mandated under the planningregulations at the time.
We used the following research approach:
1. Build STM by using the VDDT and TELSA modeling systems to simulate future for-est, woodland, shrubland, and herbland vegetation conditions across the entire UpperGrande Ronde study area.
2. Link vegetation projections with SafeD (Bettinger et al. Chapter 4) and other resourceeffects models to examine the use of those models to calibrate STM for forestedenvironments.
3. Explore ways to add states and transitions for large herbivores, invasive plants, andstreamside/aquatic systems.
4. Examine stochastic effects and model sensitivity to disturbance probabilities.
State and TransitionModeling Systemsand RecentApplications
Objectives andResearch Approach

23
Figure 9—Example of potential vegetation modeling strata in the Interior Northwest Landscape Analysis System study area,Upper Grande Ronde subbasin, Oregon. Classes developed during the study may differ from those shown.

24
A number of tasks are required to build VDDT models for use in the INLAS project. Pro-totype models that might be useful starting points have been built for the interior Colum-bia basin assessment (Hann et al. 1997) and for the forested lands in the BlueMountains province.2 These models will be examined for applicability given the vegetationand environments in the Upper Grande Ronde. A first approximation set of STMs for theUpper Grande Ronde could come from adoption of suitable existing models. We expectthat these first-generation models will require considerable refinement, especially thosefor woodlands, shrublands, and grasslands. A period of model review using the availableliterature and expert opinion will help refine these initial models to produce a secondgeneration. We will include a variety of management activities by adding them as newpathways and, if necessary, vegetation states. The current version of both VDDT andTELSA can accept more than 400 vegetative states and a number of transitions limitedonly by computation time—likely more than sufficient for our purposes. We will designvegetation classes based on the need to add detail for wildlife habitat and other models,starting from those in the current Blue Mountains models. We recognize the importanceof large dead wood in ecosystem processes and wildlife habitat. We will build structuralclasses that include abundant large dead wood for one or two decades following somekinds of stand-replacement disturbances.
Professional judgment often has been used to define vegetation states and to derivetransition probabilities among vegetation states in existing STM. Although the dominantsuccessional or disturbance transitions might be established in the literature for somevegetation types, many other transitions are not well described. Consequently, expertopinion often is used in model development and calibration. The cumulative effect ofmany small errors in estimated transition probabilities may undermine the reliabilityof simulations. Although annual wildfire probabilities often have been developed byusing historical fire data, other transitions are more difficult to quantify, and few dataare available.
We will examine and adjust states and transition probabilities, including those for variousmanagement activities, through the use of process-based models. The Forest VegetationSimulator (FVS) (Crookston and Stage 1999) provides detailed estimates of tree estab-lishment, growth, and mortality based on forest inventory and other data. Simulationsfrom FVS are forest-based mensurational analyses of tree and stand growth as a func-tion of density effects, disturbance effects, management treatments, and other factorsthat affect tree and stand growth. Stand-level simulations from FVS or SafeD will be usedto refine transition probabilities or state conditions for forested lands to make forest-landprojections more accurate. Unfortunately, similar process-based models might not beavailable for nonforest model strata. In this case, we will continue to rely on expert judg-ment and will document the sources and assumptions used.
In addition, vegetation classes in existing models are based on classical successionalstages (e.g., Hann et al. 1997). We hope to examine this choice more closely given thekinds of stands that develop under human influences, some of which may not have goodanalogs in natural successional sequences. Detailed stand-level projections from FVSand SafeD models might provide a range of stand structures that should be included inSTM for forested areas. We envision development of structural classes that representstand architecture rather than successional stages that may or may not be representa-tive of current and future east-side forest stands.
Build State andTransition Models
2 Merzenich, J. 2003. Personal communication. Planning, regionalanalyst. USDA Forest Service, Pacific Northwest Region, P.O. Box3623, Portland, OR 97208.
Link State and TransitionModel and Process-Based Models
25
Objective 2 also will require linking model strata to timber inventories. It should be pos-sible to link STM structure and composition classes to plot-level vegetation data fromexisting forest inventory data. We plan to examine the use of most similar-neighboranalyses (Moeur and Stage 1995, Ohmann and Gregory 2002) to link model strata andtree lists from plot data. We will use multivariate statistical processes to assign tree listsand other information from sampled sites to nonsampled sites based on similarities ofenvironment, photointerpreted attributes, satellite imagery, and other features. This pro-cess may both (1) improve the accuracy of current forest composition and structure esti-mates by using existing plot samples and (2) allow more explicit description of futureforest conditions for timber supply and harvest scheduling. True color aerial photographsat a scale of 1:15,840, black and white ortho photography at 1:24,000, and field standexamination data will be used to develop vegetation maps. A subsample of 10 to 20 per-cent of the photointerpreted polygons will be checked in the field to provide an assess-ment of photointerpretation accuracy.
Native vegetation and associated resources are experiencing significant degradation overwide areas of the interior West from nonnative invasive plants. The cumulative effects gobeyond vegetative change because habitat for terrestrial vertebrates and other species isaffected (Drake et al. 1989), fire regimes are altered (Billings 1994, Bunting et al. 1987,Pellant 1990), and other ecological processes may be disrupted (Billings 1994, Mastersand Sheley 2001). Although the interior Columbia basin project included nonnative inva-sive plants in some STM, we will examine the potential interaction of invasive plants withother disturbances and management activities. State and transition models are a goodchoice for initial efforts to model invasive plant interactions across large landscapes be-cause they can be assembled from sparse literature and data and expert opinion.
Hobbs (1996) argued that native ungulates are critical agents of change in ecosystemsvia three processes: regulation of process rates, modification of spatial mosaics, andaction as switches controlling transitions between alternative ecosystem states. Huntly(1991) identified the impact of herbivores on plant regeneration as a powerful yet little-studied mechanism of influence on vegetation composition, structure, and diversity. Wildand domestic ungulates should be considered potential agents of chronic disturbance(Riggs et al. 2000).
Cattle grazing often reduces cover of grasses and shrubs as well as total vegetationbiomass (Jones 2000). Riggs et al. (2000) reported that in grand fir (Abies grandis(Dougl. ex D. Don) Lindl.) forests of northeast Oregon, understory biomass in ungulateexclosures was 2.1 times greater inside than outside, and forest-floor biomass was 1.5times greater inside than outside. Shrub biomass was influenced more by ungulatesthan was grass or forb biomass. Augustine and McNaughton (1998) concluded thataltered species composition of plant communities in response to selective foragingby ungulates is a general feature of plant-ungulate relations. The authors stated that byungulates altering the competitive relations among plants, differential tolerance of co-occurring plant species becomes an important determinant of the responses of bothwoody and herbaceous plant communities to herbivory. Augustine and McNaughton(1998) also summarized ungulate effects on overstory species and listed several speciesof coniferous and deciduous trees that were herbivory intolerant. Ungulate herbivory isalso a driving force shaping vegetation pattern in coastal coniferous forests (Schreiner etal. 1996, Woodward et al. 1994). Research by these authors indicated that ungulatesmaintained a reduced standing crop, increased forb species richness, and determinedthe distribution, morphology, and reproductive performance of several shrub species.Woodward et al. (1994) further stated that the extent to which herbivores can changeecosystem processes in forests likely depends on the scales of other disturbances.
Invasive Plants
Ungulate Herbivory
26
Herbivory-induced changes in plant community composition have important habitat rami-fications for a number of plant and animal species. Changes in understory structure andlitter accumulations may be important to bird and small mammal populations. Individualspecies of plants and entire plant communities may be at risk under intensive herbivory.Examples of plant species at risk of elimination or severe decline under intensive her-bivory include aspen (Populus tremuloides Michx.), bitterbrush (Purshia tridentata(Pursh) DC.), Pacific yew (Taxus brevifolia Nutt.), and mountain mahogany (Cercocarpusspp. Kunth) (Parks et al. 1998). Negative effects on vertebrate species that depend onthese plants (e.g., cavity nesters in aspen stands, Wisdom et al. 2000) may occur. In-clusion of ungulate herbivory disturbances in STM for the Upper Grande Ronde will allowexamination of two important questions:
1. What changes in composition and structure of plant communities occur as a result ofherbivory at local and regional scales?
2. How does the grazing regime interact with frequency, intensity, and distribution ofepisodic disturbances to influence development of plant communities at local andregional scales?
The first question will initially be addressed through a synthesis of existing research dataand findings from the Starkey project on diet selection and resource selection functionsfor ungulates in the Blue Mountains (e.g., from Johnson et al. 1995, Rowland et al. 2000,Wisdom 1998). Data will yield estimates of plant composition with and without herbivory,and the likelihood of herbivory effects occurring in various forest plant communities. Thesecond question will be addressed through development of STM for the Upper GrandeRonde that explicitly includes ungulate herbivory, based on data synthesized for the firstquestion. Plant succession in forests likely operates as a set of states and transitions,much like the models developed and validated for nonforest ecosystems (Laycock 1991,Westoby et al. 1989). Indeed, it now seems possible that the descriptions of many “cli-max” associations are questionable on this basis (Peek et al. 1978, Riggs et al. 2000,Schreiner et al. 1996). Although our first interest is in building herbivory models for appli-cation in the Upper Grande Ronde, we intend to ultimately apply these models at stand,watershed, and basin scales for the entire Blue Mountains province. The models shouldhave some general application throughout the Rocky Mountain west.
Riparian and aquatic issues have become critical in the inland Northwest (INFISH 1995,PACFISH 1995), and many upland land management activities have impacts on riparianand aquatic resources. Bettinger et al. (1998) attempted to account for impacts of man-agement and disturbance on stream temperatures across large landscapes but did notproject changes in riparian habitat. We will incorporate major physical and biologicalprocesses of riparian zones in an STM framework. Many analogies can be formed be-tween existing STM for upland vegetation and the dynamics of valley-floor landforms andriparian plant communities. It may be possible to describe long-term riparian geomorphicand vegetation states, disturbance probabilities, and transitions among states for spe-cific strata of riparian potentials. Drainage networks might be divided into discrete net-works with different disturbance regimes similar to the stratification of potential vegeta-tion types. Stream segments might be classified according to both their existing andpotential characteristics and their succession described with transition probabilitiesbased on hydrological disturbance regimes. Changes in riparian characteristics couldconsider both fluvial (e.g., floods) and nonfluvial (e.g., fire) disturbances. Treatment priori-ties might be based on channel instability and geomorphic and vegetation potentials. Inaddition, it might be possible to link upland episodic disturbance (e.g., wildfire) and ripar-ian characteristics.
Riparian Vegetation andGeomorphology
27
The STM module will generate several spatial and nonspatial data sets that should linkwell to other INLAS modules. The VDDT and TELSA models project the structural condi-tion and cover type of grassland, shrubland, woodland, and forest vegetation. The VDDTmodel generates area estimates (hectares) for combinations of structure and cover inseveral environmental strata (as indicated by potential vegetation) by using an annualtime step. It also tracks the area affected by individual disturbance transitions for eachsimulation year. Outputs are available in text files that can be readily transformed intodatabases. The TELSA model produces the same kinds of information and GIS cover-ages (e.g., maps) that can be used to examine spatial patterns of vegetation structureand composition as well as disturbances that drive vegetation change. We will adjustoutputs of vegetation conditions and disturbances to fit the needs of wildlife habitat mod-eling and other modules to the degree that our models can produce appropriate informa-tion.
The VDDT and TELSA planning tools use vegetation structure classes that are derivedfrom those suggested by Oliver and Larson (1996) as modified by O’Hara et al. (1996)and used in the interior Columbia basin scientific assessment (Quigley and Arbelbide1997). Our modification of those structure classes will split some forest structures intoclasses for wildlife habitat modeling based on diameter of dominant trees. Discussionswith USDA Forest Service Pacific Northwest Region planning personnel indicate that ourstructural classification should fit well with proposed corporate data standards.3 TheNatural Resource Information System (NRIS) proposes the use of the O’Hara et al.(1996) structure classes as one of the acceptable corporate data standards. In addition,a draft structural classification for the Pacific Northwest Region uses tree diameterbreaks that are compatible with our structure classes. Our potential vegetation classesalso should fit well with corporate data standards because we use aggregates ofecoclasses (Hall 1998).
Our vegetation cover type classes match those currently in use by Blue Mountains na-tional forests (see footnote 2). However, they may not fit well with standard cover typesthat may be used in the future by the USDA Forest Service Pacific Northwest Region(see footnote 3). The Region’s draft standards match NRIS standards and consist ofSociety of American Foresters (Eyre 1980) and Society for Range Management (Shiflet1994) cover types. We found those cover types, which were designed for categorizingvegetation cover across the entire United States, to be insufficiently refined for mappingwildlife habitat and stratifying economic product potential at the scale of our study area.
Model validation is important in evaluating the accuracy and reliability of model projec-tions. Landscape simulation models can be difficult to validate empirically becauseprojections of current conditions into the future may take decades to evaluate, and un-foreseen disturbances or management approaches may generate different futures. If wecould establish vegetation structure and composition conditions for the Upper GrandeRonde area at some point in the past, we might project those conditions to the presentand evaluate differences from current conditions. However, the historical track of distur-bances may be only one of many that could have occurred. Actual past disturbancesmay not have even been those that had a high probability of occurring. Given these diffi-culties and the relatively short timeframe for our work, we take two approaches to evalu-ating model projections. First, we will compare the projections from different vegetation
Validation andSensitivity Analysis
3 Connelly, W. 2003. Personal communication. Economist andanalyst, USDA Forest Service, Pacific Northwest Region, P.O. Box3623, Portland, OR 97208.
Linkages to OtherModules andCorporate Data
28
modeling approaches to look for differences and similarities that may require further ex-amination. Secondly, we will calibrate STM models with stand-scale forest models (e.g.,FVS) that have been widely published and evaluated elsewhere.
Our modeling process will be based on stochastic or probabilistic disturbances. Vegeta-tion transitions will be expressed in terms of probabilities. Both VDDT and TELSA havethe capability of generating many Monte Carlo simulations by using random numberseeds in calculating probabilities. We plan to repeatedly run individual management anddisturbance scenarios to examine the effects of stochastic variation on model results.Our intent is to express model results as probabilistic rather than providing only oneresult for each scenario. In addition, we plan to vary key disturbance probabilities by oneor two standard deviations from the calculated or assigned values to gauge model sensi-tivity.
Land and wildlife managers in the Blue Mountains province are the targeted users of theresearch findings and management tools produced from the activities outlined in thispaper. Clients include managers of public, private, and tribal lands in the Blue Mountainsprovince, encompassing economic and social interests related to management of timber,livestock, wild ungulates, salmon, vertebrates, and plants of conservation concern. Inparticular, the Blue Mountains national forests are beginning revision of land manage-ment plans. The STM may offer some advantages for land management planning. Themodeling framework can be applied to a variety of vegetation types and environments.The models are more easily understood than previous planning models and may providefor better public involvement in the analysis process. The coarse resolution of the internalmodeling states in the STM makes them relatively easy to build, edit, and execute.Technical users also may include scientists, public groups, and resource specialists.Application of the concepts and relations developed as part of this research and associ-ated management tools will also extend beyond the Blue Mountains to similar environ-ments in other provinces of the Pacific Northwest and intermountain West.
Peter Bettinger, Lowell Suring, and Steve Wondzell provided helpful review comments.Funding for this project was provided by the U.S. Department of Agriculture, ForestService, Pacific Northwest Research Station.
When you know: Multiply by: To find:
Miles 1.609 Kilometers
Alig, R.J.; Zheng, D.; Spies, T.A.; Butler, B.J. 2000. Forest cover dynamics in thePacific Northwest west side: regional trends and projections. Res. Pap. PNW-RP-522. Portland, OR: U.S. Department of Agriculture, Forest Service, Pacific NorthwestResearch Station. 22 p.
Augustine, D.J.; McNaughton, S.J. 1998. Ungulate effects on the functional speciescomposition of plant communities: herbivore selectivity and plant tolerance. Journal ofWildlife Management. 62: 1165-1183.
Barrett, T.M. 2001. Models of vegetative change for landscape planning: a comparison ofFETM, LANDSUM, SIMPPLLE, and VDDT. Gen. Tech. Rep. RMRS-GTR-76-WWW.Ogden, UT: U.S. Department of Agriculture, Forest Service, Rocky MountainResearch Station. 14 p.
Products andAudience
Acknowledgments
Metric Equivalents
Literature Cited

29
Bettinger, P.; Graetz, D.; Ager, A.A.; Sessions, J. 2004. The SafeD forest landscapeplanning model. In: Hayes, J.L.; Ager, A.A.; Barbour, R.J., tech. eds. Methods forintegrating modeling of landscape change: Interior Northwest Landscape AnalysisSystem. Gen. Tech. Rep. PNW-GTR-610. Portland, OR: U.S. Department of Agricul-ture, Forest Service, Pacific Northwest Research Station: 41-63. Chapter 4.
Bettinger, P.; Sessions, J.; Boston, K. 1997. Using tabu search to schedule timberharvests subject to spatial wildlife goals for big game. Ecological Modelling. 94:111-123.
Bettinger, P.; Sessions, J.; Johnson, K.N. 1998. Ensuring the compatibility of aquatichabitat and commodity production goals in eastern Oregon with a tabu search proce-dure. Forest Science. 44: 96-112.
Beukema, S.J.; Kurz, W.A. 1995. Vegetation dynamics development tool user’s guide,version 2.0 beta. 76 p. Unpublished report. On file with: ESSA Technologies Ltd., No.300-1765 West 8th Avenue, Vancouver, BC, V6J 5C6, Canada.
Billings, W.D. 1994. Ecological impacts of cheatgrass and resultant fire on ecosystemsin the western Great Basin. In: Monsen, S.B.; Kitchen, S.G., eds. Proceedings–ecol-ogy and management of annual rangelands. Gen. Tech. Rep. INT-GTR-313. Ogden,UT: U.S. Department of Agriculture, Forest Service, Intermountain Research Station:22-30.
Bunting, S.C.; Kilgore, B.M.; Bushey, C.L. 1987. Guidelines for prescribed burningsagebrush steppe rangelands in the northern Great Basin. Gen. Tech. Rep. INT-231.Ogden, UT: U.S. Department of Agriculture, Forest Service, Intermountain Forest andRange Experiment Station. 33 p.
Cattelino, P.M.; Noble, I.R.; Slatyer, R.O.; Kessell, S.R. 1979. Predicting the multiplepathways of plant succession. Environmental Management. 3: 41-50.
Chew, J.D. 1995. Development of a system for simulating vegetative patterns and pro-cesses at landscape scales. Missoula, MT: The University of Montana. 182 p. Ph.D.dissertation.
Crookston, N.L.; Stage, A.R. 1999. Percent canopy cover and stand structure statis-tics from the Forest Vegetation Simulator. Gen. Tech. Rep. RMRS-GTR-24. FortCollins, CO: U.S. Department of Agriculture, Forest Service, Rocky MountainResearch Station. 15 p.
Drake, J.; Mooney, H.; di Castri, E. [et al.], eds. 1989. Ecology of biological invasions:a global perspective. SCOPE 37. New York: John Wiley and Sons. 528 p.
Eyre, F.H. 1980. Forest cover types of the United States and Canada. Washington, DC:Society of American Foresters. 148 p.
Graetz, D.H. 2000. The SafeD model: incorporating episodic disturbances and heuristicprogramming into forest management planning for the Applegate River watershed,southwestern Oregon. Corvallis, OR: Department of Forest Resources, Oregon StateUniversity. 127 p. M.S. thesis.
Hall, F.C. 1998. Pacific Northwest ecoclass codes for seral and potential natural com-munities. Gen. Tech. Rep. PNW-GTR-418. Portland, OR: U.S. Department of Agricul-ture, Forest Service, Pacific Northwest Research Station. 290 p. Vol. 2.
30
Hann, W.J.; Jones, J.L.; Karl, M.G. [et al.]. 1997. Landscape dynamics of the basin.In: Quigley, T.M.; Arbelbide, S.J., tech. eds. An assessment of ecosystem compo-nents in the interior Columbia basin and portions of the Klamath and Great Basins.Gen. Tech. Rep. PNW-GTR-405. Portland, OR: U.S. Department of Agriculture, ForestService, Pacific Northwest Research Station: 337-1055. (Quigley, T.M., tech. ed.;Interior Columbia Basin Ecosystem Management Project: scientific assessment).
Hemstrom, M.A.; Wisdom, M.J.; Hann, W.J. [et al.]. [In press]. Sagebrush-steppevegetation dynamics and restoration potential in the interior Columbia basin, USA.Conservation Biology.
Hobbs, N.T. 1996. Modification of ecosystems by ungulates. Journal of Wildland Man-agement. 60: 695-713.
Horn, H.S. 1975. Markovian properties of forest succession. In: Cody, M.L.; Diamond,J.M., eds. Ecology and evolution of communities. Cambridge, MA: Harvard UniversityPress: 196-211.
Huntly, N. 1991. Herbivores and the dynamics of communities and ecosystems. AnnualReview of Ecology and Systematics. 22: 477-503.
Inland Native Fish Strategy (INFISH). 1995. Environmental assessment: decisionnotice and finding of no significant impact. Interim strategies for managing fish-produc-ing watersheds in eastern Oregon and Washington, Idaho, western Montana and por-tions of Nevada. [Place of publication unknown]: U.S. Department of Agriculture,Forest Service, Intermountain, Northern, and Pacific Northwest Regions. [Irregularpagination].
Johnson, B.K.; Ager, A.; Crim, S.A. [et al.]. 1995. Allocating forage among wild anddomestic ungulates–a new approach. In: Edge, W.D.; Olson-Edge, S.L., eds. Pro-ceedings, sustaining rangeland ecosystems symposium. SR 953. Corvallis, OR:Oregon State University: 166-169.
Johnson, K.N.; Stuart, T.W.; Crim, S.A. 1986. FORPLAN version 2: an overview.Washington, DC: U.S. Department of Agriculture, Forest Service, Land ManagementPlanning Systems Section. 98 p.
Jones, A. 2000. Effects of cattle grazing on North American arid ecosystems: a quanti-tative review. Western North American Naturalist. 60: 155-164.
Keane, R.E.; Long, D.G.; Menakis, J.P. [et al.]. 1996. Simulating coarse-scale dynam-ics using the Columbia River Basin Succession Model—CRBSUM. Gen. Tech. Rep.INT-GTR-340. Ogden, UT: U.S. Department of Agriculture, Forest Service, Intermoun-tain Research Station. 50 p.
Kurz, W.A.; Beukema, S.J.; Klenner, W. [et al.]. 2000. TELSA: the tool for explor-atory landscape scenario analysis. Computers and Electronics in Agriculture. 27:227-242.
Laycock, W.A. 1991. Stable states and thresholds of range condition on North Americanrangelands: a viewpoint. Journal of Range Management. 44(5): 427-433.
Masters, R.A.; Sheley, R.L. 2001. Invited synthesis paper: principles and practices formanaging rangeland invasive plants. Journal of Range Management. 54: 502-517.
31
Merzenich, J.; Kurz, W.; Beukema, S. [et al.]. [In press]. Determining forest fueltreatments for the Bitterroot front using VDDT. In: Arthaud, G.J.; Barrett, T.M., eds.Proceedings of the 8th symposium. Dordrecht, The Netherlands: Kluwer AcademicPublishers.
Mladenoff, D.J.; He, H.S. 1999. Design and behavior of LANDIS, an object-orientedmodel of forest landscape disturbance and succession. In: Mladenoff, D.J.; Baker,W.L., eds. Advances in spatial modeling of forest landscape change: approaches andapplications. Cambridge, United Kingdom: Cambridge University Press: 125-162.
Moeur, M.; Stage, A.R. 1995. Most similar neighbor: an improved sampling inferenceprocedure for natural resource planning. Forest Science. 41(2): 337-359.
Noble, I.R.; Slatyer, R.O. 1980. The use of vital attributes to predict successionalchanges in plant communities subject to recurrent disturbances. Vegetatio. 43: 5-21.
O’Hara, K.L.; Latham, P.A.; Hessburg, P.l.; Smith, B.G. 1996. A structural classifica-tion of inland Northwest forest vegetation. Western Journal of Applied Forestry. 11(3):97-102.
Ohmann, J.L.; Gregory, M.J. 2002. Predictive mapping of forest composition and struc-ture with direct gradient analysis and nearest-neighbor imputation in coastal Oregon,USA. Canadian Journal of Forest Research. 32: 725-741.
Oliver, C.D.; Larson, B.C. 1996. Forest stand dynamics. Updated edition. New York:John Wiley and Sons, Inc. 520 p.
(PACFISH) USDA Forest Service and USDI Bureau of Land Management. 1995.Decision notice/Decision Record, FONSI, EA, Appendices for the Interim strategiesfor managing anadromous fish-producing watersheds in eastern Oregon and Washing-ton, Idaho, and portions of California. Washington, DC: [Irregular pagination].
Parks, C.G.; Bednar, L.; Tiedemann, A.R. 1998. Browsing ungulates–an importantconsideration in dieback and mortality of Pacific yew (Taxus brevifolia) in a northeast-ern Oregon stand. Northwest Science. 72: 190-197.
Peek, J.M.; Johnson, F.D.; Pence, N.N. 1978. Successional trends in a ponderosapine/bitterbrush community related to grazing by livestock, wildlife, and to fire. Journalof Range Management. 31: 49-53.
Pellant, M. 1990. The cheatgrass-wildfire cycle: Are there any solutions? In: McArthur,E.D.; Romney, R.M.; Smith, S.D.; Tueller, P.T., comps. Proceedings, symposium oncheatgrass invasion, shrub die-off, and other aspects of shrub biology and manage-ment. Gen. Tech. Rep. INT-276. Ogden, UT: U.S. Department of Agriculture, ForestService, Intermountain Research Station: 11–18.
Quigley, T.M.; Arbelbide, S.J., tech. eds. 1997. An assessment of ecosystem compo-nents in the interior Columbia basin and portions of the Klamath and Great Basins.Gen. Tech. Rep. PNW-GTR-405. Portland, OR: U.S. Department of Agriculture, ForestService, Pacific Northwest Research Station: 337-1055. Vol. 2. (Quigley, T.M., tech.ed.; Interior Columbia Basin Ecosystem Management Project: scientific assessment).
Riggs, R.A.; Tiedemann, A.R.; Cook, J.G. [et al.]. 2000. Modification of mixed-coniferforests by ruminant herbivores in the Blue Mountains ecological province. Res. Pap.PNW-RP-527. Portland, OR: U.S. Department of Agriculture, Forest Service, PacificNorthwest Research Station. 77 p.
32
Rowland, M.M.; Wisdom, M.J.; Johnson, B.K.; Kie, J.G. 2000. Elk distribution andmodeling in relation to roads. Journal of Wildlife Management. 64: 672-684.
Schreiner, E.G.; Krueger, K.A.; Happe, P.J.; Houston, D.B. 1996. Understory patchdynamics and ungulate herbivory in old-growth forests of Olympic National Park,Washington. Canadian Journal of Forestry Research. 26: 255-265.
Sessions, J.; Johnson, K.N.; Franklin, J.F.; Gabriel, J.T. 1999. Achieving sustainableforest structures on fire prone landscapes while pursuing multiple goals. In: Mladenoff,D.J.; Baker, W.L., eds. Spatial modeling of forest landscape change. Cambridge,United Kingdom: Cambridge University Press: 210-255.
Shiflet, T.N. 1994. Rangeland cover types of the United States. Denver, CO: Society forRange Management. 152 p.
U.S. Department of Agriculture, Forest Service; U.S. Department of the Interior,Bureau of Land Management [USDA and USDI]. 2000. Interior Columbia basinfinal environmental impact statement, BLM/OR/WA/Pt-01/010+1792. Portland, OR.[Irregular pagination].
Wedin, H. 1999. Stand level prescription generation under multiple objectives. Corvallis,OR: Department of Forest Resources, Oregon State University. 178 p. M.S. thesis.
Westoby, M.; Walker, B.; Noy-Meir, I. 1989. Opportunistic management for rangelandsnot at equilibrium. Journal of Range Management. 42: 266-276.
Wisdom, M.J. 1998. Assessing life-stage importance and resource selection forconservation of selected vertebrates. Moscow, ID: University of Idaho. 118 p. Ph.D.dissertation.
Wisdom, M.J.; Holthausen, R.S.; Wales, B.C. [et al.]. 2000. Source habitats for ter-restrial vertebrates of focus in the interior Columbia basin: broad-scale trends andmanagement implications. Gen. Tech. Rep. PNW-GTR-485. Portland, OR: U.S. De-partment of Agriculture, Forest Service, Pacific Northwest Research Station. 434 p.
Woodward, A.; Schreiner, E.G.; Houston, D.B.; Moorhead, B.B. 1994. Ungulate-forest relationships in Olympic National Park: retrospective exclosure studies. North-west Science. 68: 97-110.
33
Chapter 3: Application of the Forest VegetationSimulator and Related Tools for IntegratedModeling of Forest Landscapes
Alan A. Ager1
This chapter describes the use of stand-level growth simulators to address landscapeplanning issues, and outlines work by the Interior Northwest Landscape Analysis Sys-tem (INLAS) project to enhance the functionality of the Forest Vegetation Simulator andrelated tools to meet the needs for landscape analysis tools. Stand-level growth modelsare widely used in the Forest Service and other agencies, and they are logical candi-dates to use as the core for an integrated framework of the kind envisioned for INLAS.However, a number of modifications are needed to facilitate wider application of thesetools to address strategic planning and forest management issues. These proposedmodifications include improved data linkages and streamlined methods for building sce-narios and summarizing results and are described in this chapter.
Keywords: Landscape simulation, landscape ecology, Forest Vegetation Simulator,forest planning.
There is growing interest in applying landscape ecology and simulation methods to forestmanagement problems (Liu et al. 2000, Mladenoff and Baker 1999, Spies et al. 2002).Simulation methods provide the broad and flexible framework needed to model naturaldisturbances, forest succession, and management on large landscapes. Specificproblems of interest include studying the effects of natural disturbance on aquatic andterrestrial habitat reserves (Johnson et al. 1998, Maffei and Tandy 2002) and developingspatially explicit schedules for fuel-reduction treatments (Finney Chapter 9). Analyzingthese problems by using traditional methods used in forest operations research (Dykstra1984) is difficult owing to the stochastic nature of disturbance processes and the needfor spatial detail in strategic planning models. Many new simulation modeling lineageshave evolved over the past 10 to 15 years, and the application of these models is con-tinuing to grow in scale and complexity, resulting in many sophisticated systems for
Abstract
Introduction
1 Alan A. Ager is an operations research analyst, U.S.Department of Agriculture, Forest Service, Forestry and RangeSciences Laboratory, 1401 Gekeler Lane, La Grande, OR 97850.

34
simulating forest succession, management, and disturbance on large landscapes in theWestern United States (Bettinger et al. Chapter 4, Graetz 1999, Hof and Bevers 1998,Kurz et al. 2000, Liu et al. 2000, McCarter 1997, Sessions et al. 1999, Spies et al. 2002,Weise et al. 2000). The growing frequency of severe wildfires on interior forests has cre-ated a need for strategic planning models that examine the costs and benefits of fueltreatments on large landscapes (Johnson et al. 1998, Sessions et al. 1999) and develop-ment of spatially explicit fuel-treatment strategies that best meet multiple resource goalsand constraints, including regulatory standards for terrestrial and aquatic species. Theseproblems have complex spatiotemporal dimensions that must consider forest manage-ment, natural disturbances, and forest succession over time on large landscapes.
Focusing on recent work in the Western United States, there are two commonly usedapproaches to simulate changes in forest vegetation. The first, a state and transitionapproach, stratifies forest and other vegetation into states (e.g., forest structure, covertype) that change according to transitions representing disturbance, management, andsuccession. State and transition models were used for the Columbia River basin assess-ment (Hann et al. 1997), which led to improved software, and more recently, applicationfor forest plan revisions. State and transition models and their application in the InteriorNorthwest Landscape Analysis System (INLAS) project are described by Hemstrom etal. (Chapter 2).
A second approach involves the application of tree-level growth simulators (Hann et al.1995, Stage 1973, Wedin 1999) to model each and every stand on a landscape(Crookston and Havis 2002, Crookston and Stage 1991). Because these methods arerelatively well established and readily available, they are logical choices to addressspecific kinds of resource analyses. However, our review of these tools and methodssuggested that simulating management scenarios on forested landscapes remains acomplex process. Many specialists on national forest ranger districts who do analysesof alternative management scenarios are largely baffled by the array of existing tools andrequired data formats, as well as how they can be adapted to project-level work.
This paper briefly summarizes the development and application of stand-level simulationmodels and their application to management problems in forests in the Western UnitedStates. Subsequent sections describe specific improvements to existing methods tohelp build a coherent modeling framework and facilitate wider application of stand-levelmodels to address strategic planning issues on watersheds with multiple ownerships.
The stand-level simulation approach has been used in a number of applied researchprojects over the past 10 to 15 years; however, much of this work is either not publishedor not described in detail in symposia and other documents. In the simplest approach,landscapes were modeled with stand simulators by simply batch processing all thestands in an area and linking the results to geographic information system (GIS) standmaps. Extending Forest Vegetation Simulator (FVS) to landscapes was advanced withthe developments of the Landscape Management System (McCarter et al. 1997), theParallel Processing Extension (PPE) to the FVS (Crookston and Stage 1991), the Prog-nosis Environmental Indicators model (Greenough et al. 2002), and SUPPOSE, a visualinterface to FVS (Crookston 1997). The Parallel Processing Extension added importantfunctionality (Crookston and Stage 1991) in that it provided the means to consider conta-gion, treatment priorities, and overall landscape condition during the simulation.
Graetz (1999) later demonstrated how stand-level models could be incorporated intolandscape optimization systems (Bettinger et al. Chapter 4).
Stand-LevelLandscapeSimulation andPlanning Models
35
Much of the functionality in current landscape models is derived from the numerousFVS extensions and postprocessors that allow for scaling the simulation system tothe problem at hand. An array of simulation capabilities, including the dynamics of fuelsand fire effects, (Beukema et al. 1997a), insect and disease mortality (Roberts 2002),economics (Fight and Chmelik 1998, Renner and Martin 2002), etc., enhance the utilityof this overall approach for landscape applications. Linkages to visualization systems(McGaughey 2002, 2004) and interfaces like SUPPOSE (Crookston 1997) or the Land-scape Management System (McCarter 1997) make it possible to conduct simple land-scape simulations with a broad array of capabilities.
One common feature among stand-level modeling projects is that tree lists are usuallyimputed for stands where data are missing by using a most-similar-neighbor (Crookstonand Havis 2002, Moeur and Stage 1995) or K-nearest-neighbor (Ohmann and Gregory2002) approach. Imputing means that the tree list is obtained from an existing sampleof tree lists rather than estimating a new tree list. This process is necessary becausetree list data rarely exist for every stand in a project. There have been several recentadvances in methods to impute stand data (Crookston et al. 2002, Temesgen and LeMay2002). More work is needed in this area to determine the effects of imputation errors ondifferent outputs of landscape simulations.
The functionality of the stand-level approach began to more closely match that of tradi-tional forest planning models with the work of Liu et al. (2000), Graetz (1999), Wedin(1999), and others to optimize the scheduling of treatments to meet landscape goals.In this approach, alternative management scenarios are simulated for each stand, andheuristic search algorithms are used to find a combination that best meets the land-scape goals. Goal functions are formulated to allow for multiple-weighted goals. Severalprojects are now using heuristic methods (e.g., Hummel et al. 2002) to sort throughsimulations a posteriori to find prescriptions that maximize single- or multiple-weightedobjectives. In the work of Graetz (1999) and Wedin (1999), the growth and mortality codewas extracted from FVS and incorporated into a stand optimizer. This general lineage oflandscape simulation/optimization models is reviewed by Bettinger et al. (Chapter 4).
Another significant enhancement to stand-level models was attained when spatially ex-plicit stochastic disturbance was incorporated into landscape planning models (Graetz2000, Johnson et al. 1998, Sessions et al. 1999). Periodic wildfire was simulated withthe Fire Area Simulator (FARSITE, Finney 1999) and fire mortality functions were used toupdate tree lists after each wildfire. This work represented a significant convergencebetween landscape ecology models with those used in forest planning and harvestscheduling (Mladenoff and Baker 1999). Spatially explicit models for insect disturbancealso have been integrated into landscape simulations (Beukema et al. 1997b, Smith etal. 2002).
Work continues on many aspects of incorporating nonforest products values into land-scape simulation models (Greenough et al. 2002). Of particular interest are understoryvegetation components, hydrology, wildlife models, and carbon pools. Greenough et al.(2002) provide an example of incorporating an array of environmental indicators into astand-level simulation system.
Application of stand-level simulation methods to landscapes continues to grow in scaleand number. For instance, the Coastal Landscape and Modeling Study (CLAMS) project(Spies et al. 2002) used stand-level modeling (pixels) to simulate 2.6 million ha of thecoastal Oregon region.
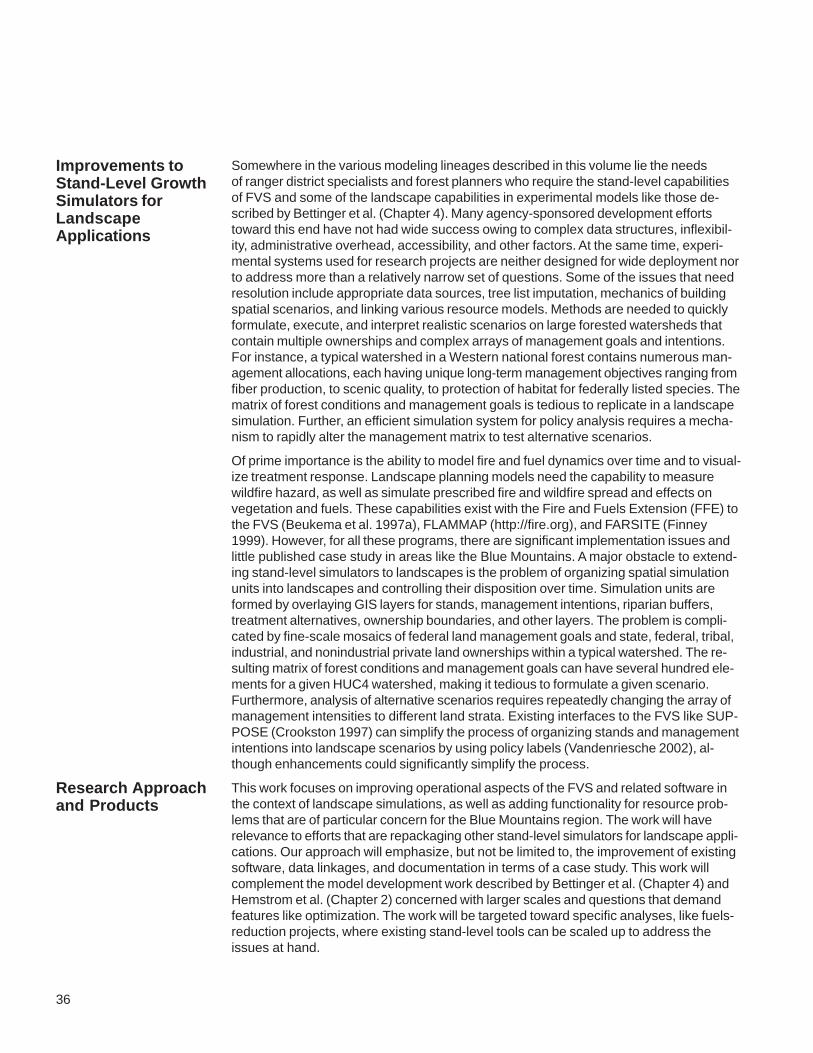
36
Somewhere in the various modeling lineages described in this volume lie the needsof ranger district specialists and forest planners who require the stand-level capabilitiesof FVS and some of the landscape capabilities in experimental models like those de-scribed by Bettinger et al. (Chapter 4). Many agency-sponsored development effortstoward this end have not had wide success owing to complex data structures, inflexibil-ity, administrative overhead, accessibility, and other factors. At the same time, experi-mental systems used for research projects are neither designed for wide deployment norto address more than a relatively narrow set of questions. Some of the issues that needresolution include appropriate data sources, tree list imputation, mechanics of buildingspatial scenarios, and linking various resource models. Methods are needed to quicklyformulate, execute, and interpret realistic scenarios on large forested watersheds thatcontain multiple ownerships and complex arrays of management goals and intentions.For instance, a typical watershed in a Western national forest contains numerous man-agement allocations, each having unique long-term management objectives ranging fromfiber production, to scenic quality, to protection of habitat for federally listed species. Thematrix of forest conditions and management goals is tedious to replicate in a landscapesimulation. Further, an efficient simulation system for policy analysis requires a mecha-nism to rapidly alter the management matrix to test alternative scenarios.
Of prime importance is the ability to model fire and fuel dynamics over time and to visual-ize treatment response. Landscape planning models need the capability to measurewildfire hazard, as well as simulate prescribed fire and wildfire spread and effects onvegetation and fuels. These capabilities exist with the Fire and Fuels Extension (FFE) tothe FVS (Beukema et al. 1997a), FLAMMAP (http://fire.org), and FARSITE (Finney1999). However, for all these programs, there are significant implementation issues andlittle published case study in areas like the Blue Mountains. A major obstacle to extend-ing stand-level simulators to landscapes is the problem of organizing spatial simulationunits into landscapes and controlling their disposition over time. Simulation units areformed by overlaying GIS layers for stands, management intentions, riparian buffers,treatment alternatives, ownership boundaries, and other layers. The problem is compli-cated by fine-scale mosaics of federal land management goals and state, federal, tribal,industrial, and nonindustrial private land ownerships within a typical watershed. The re-sulting matrix of forest conditions and management goals can have several hundred ele-ments for a given HUC4 watershed, making it tedious to formulate a given scenario.Furthermore, analysis of alternative scenarios requires repeatedly changing the array ofmanagement intensities to different land strata. Existing interfaces to the FVS like SUP-POSE (Crookston 1997) can simplify the process of organizing stands and managementintentions into landscape scenarios by using policy labels (Vandenriesche 2002), al-though enhancements could significantly simplify the process.
This work focuses on improving operational aspects of the FVS and related software inthe context of landscape simulations, as well as adding functionality for resource prob-lems that are of particular concern for the Blue Mountains region. The work will haverelevance to efforts that are repackaging other stand-level simulators for landscape appli-cations. Our approach will emphasize, but not be limited to, the improvement of existingsoftware, data linkages, and documentation in terms of a case study. This work willcomplement the model development work described by Bettinger et al. (Chapter 4) andHemstrom et al. (Chapter 2) concerned with larger scales and questions that demandfeatures like optimization. The work will be targeted toward specific analyses, like fuels-reduction projects, where existing stand-level tools can be scaled up to address theissues at hand.
Research Approachand Products
Improvements toStand-Level GrowthSimulators forLandscapeApplications
37
Key areas that will be addressed include the following:
1. Framework. A framework will be produced that describes the application of existingsimulation tools for rapid development and simulation of management scenarios on land-scapes having multiple ownerships. The framework will be a manual of methodology,including a synthesis and compilation of case studies. It also will identify ways to im-prove linkages among existing data sets and software. The framework will review ap-proaches to address issues such as measuring wildfire risk, simulating prescribed fire,treatment constraints, and landscape visualization.
2. Software development. Modifications to existing software will be explored to build acoherent, functional set of software tools that can be applied to a typical project to cap-ture the differences between various treatment scenarios in terms of potential wildfirerisk, fuel loadings, insect mortality, visual impacts, financial outcomes, and other at-tributes. A significant component of this work will be adding to the capabilities of the FVSPPE. Linkages among FVS-related and other software will be examined to find ways toimprove integration of different resource models.
3. Application. The tools will be applied on the Upper Grande Ronde watershed in paral-lel with other INLAS modeling work to analyze a variety of land management scenariosand their long-term outcomes.
The primary audience for the products of this work are district specialists charged withNational Environmental Policy Act analyses of land management scenarios and forestplanners who require detailed projections of forest conditions through time under alterna-tive management scenarios.
When you know: Multi by: To get:
Hectares (ha) 2.47 Acres
Bettinger, P.; Graetz, D.; Ager, A.A.; Sessions, J. 2004. The SafeD forest landscapeplanning model. In: Hayes, J.L.; Ager, A.A.; Barbour, R.J., tech. eds. Methods forintegrating modeling of landscape change: Interior Northwest Landscape AnalysisSystem. Gen. Tech. Rep. PNW-GTR-610. Portland, OR: U.S. Department of Agricul-ture, Forest Service, Pacific Northwest Research Station: 41-63. Chapter 4.
Beukema, S.J.; Greenough, J.A.; Robinson, D.C.E. [et al.]. 1997a. An introductionto the fire and fuels extension to FVS. In: Teck, R.; Moeur, M.; Adams, J., comps.Proceedings: Forest Vegetation Simulator conference. Gen. Tech. Rep. INT-GTR-373.Ogden, UT: U.S. Department of Agriculture, Forest Service, Intermountain ResearchStation: 191-195.
Beukema, S.J.; Greenough, J.A.; Robinson, D.C.E. [et al.]. 1997b. The westwidepine beetle model: a spatially-explicit contagion model. In: Teck, R.; Moeur, M.;Adams, J., comps. Proceedings: Forest Vegetation Simulator conference. Gen. Tech.Rep. INT-GTR-373. Ogden, UT: U.S. Department of Agriculture, Forest Service, Inter-mountain Research Station: 126-130.
Crookston, N.L. 1997. SUPPOSE: an interface to the Forest Vegetation Simulator. In:Teck, R.; Moeur, M.; Adams, J., comps. Proceedings: Forest Vegetation Simulatorconference. Gen. Tech. Rep. INT-GTR-373. Ogden, UT: U.S. Department of Agricul-ture, Forest Service, Intermountain Research Station: 7-14.
Audience
Literature Cited
English Equivalent
38
Crookston, N.L.; Havis, R.N., comps. 2002. Second Forest Vegetation Simulator con-ference. Proc. RMRS-P-25. Fort Collins, CO: U.S. Department of Agriculture, ForestService, Rocky Mountain Research Station. 208 p.
Crookston, N.L.; Moeur, M.; Renner, D. 2002. User’s guide to the most similar neigh-bor imputation program version 2. Gen. Tech. Rep. RMRS-GTR-96. Moscow, ID: U.S.Department of Agriculture, Forest Service, Rocky Mountain Research Station. 35 p.
Crookston, N.L.; Stage, A.R. 1991. User’s guide to the Parallel Processing Extensionof the prognosis model. Gen. Tech. Rep. INT-281. Ogden, UT: U.S. Department ofAgriculture, Forest Service, Intermountain Forest and Range Experiment Station.87 p.
Dykstra, D.P. 1984. Mathematical programming for natural resource management. NewYork: McGraw-Hill, Inc. 318 p.
Fight, R.D.; Chmelik, J.T. 1998. Analysts guide to FEEMA for financial analysis of eco-system management activities. Gen. Tech. Rep. FPL-GTR-111. Madison, WI: U.S.Department of Agriculture, Forest Service, Forest Products Laboratory. 5 p.
Finney, M.A. 1999. Mechanistic modeling of landscape fire patterns. In: Mladenoff, D.;Baker, W., eds. Spatial modeling of forest landscape change: approaches and appli-cations. Cambridge, United Kingdom: Cambridge University Press: 186-209.
Finney, M.A. 2004. Landscape fire simulation and fuel treatment optimization. In:Hayes, J.L.; Ager, A.A.; Barbour, R.J., tech. eds. Methods for integrating modeling oflandscape change: Interior Northwest Landscape Analysis System. Gen. Tech. Rep.PNW-GTR-610. Portland, OR: U.S. Department of Agriculture, Forest Service, PacificNorthwest Research Station: 117-131. Chapter 9.
Graetz, D. 1999. The SafeD model: incorporating episodic disturbances and heuristicprogramming into forest management planning for the Applegate River watershed,southwestern Oregon. Corvallis, OR: Oregon State University, College of Forestry.127 p. M.S. thesis.
Greenough, J.; Kurz, W.; Robinson, D. [et al.]. 2002. Prognosis El: a detailed water-shed-level environmental indicators model. In: Crookston, N.L.; Havis, R.N., comps.Second Forest Vegetation Simulator conference. Proc. RMRS-P-25. Fort Collins, CO:U.S. Department of Agriculture, Forest Service, Rocky Mountain Research Station:122-125.
Hann, D.W.; Hester, A.S.; Olsen, C.L. 1995. ORGANON user’s manual. Ed. 5.0.Corvallis, OR: Department of Forest Resources, Oregon State University. 127 p.
Hann, W.J.; Jones, J.L.; Karl, M.G. [et al.]. 1997. Landscape dynamics of the basin.In: Quigley, T.M.; Arbelbide, S.J., tech. eds. An assessment of ecosystem compo-nents in the interior Columbia basin and portions of the Klamath and Great Basins.Gen. Tech. Rep. PNW-GTR-405. Portland, OR: U.S. Department of Agriculture, ForestService, Pacific Northwest Research Station: 337-1055. Vol 2. (Quigley, T.M., tech.ed.; Interior Columbia Basin Ecosystem Management Project: scientific assessment).
Hemstrom, M.; Ager, A.A.; Vavra, M. [et al.]. 2004. A state and transition approach forintegrating landscape models. In: Hayes, J.L.; Ager, A.A.; Barbour, R.J., tech. eds.Methods for integrating modeling of landscape change: Interior Northwest LandscapeAnalysis System. Gen. Tech. Rep. PNW-GTR-610. Portland, OR: U.S. Department ofAgriculture, Forest Service, Pacific Northwest Research Station: 17-32. Chapter 2.
39
Hof, J.; Bevers, M. 1998. Spatial optimization for managed ecosystems. New York:Columbia University Press. 258 p.
Hummel, S.; Calkin, D.; Barbour, J. 2002. Landscape analysis with FVS and optimi-zation techniques: efficient management planning for the Gotchen Late SuccessionalReserve. In: Crookston, N.L.; Havis, R.N., comps. Second Forest Vegetation Simula-tor conference. Proc. RMRS-P-25. Fort Collins, CO: U.S. Department of Agriculture,Forest Service, Rocky Mountain Research Station: 78-82.
Johnson, K.N.; Sessions, J.; Franklin, J.; Gabriel, J. 1998. Integrating wildfire intostrategic planning for Sierra Nevada forests. Journal of Forestry. 96(1): 42-49.
Kurz, W.A.; Beukema, S.J.; Klenner, W. [et al.]. 2000. TELSA: the tool for explor-atory landscape scenario analysis. Computers and Electronics in Agriculture. 27:227-242.
Liu, G.; Nelson, J.D.; Wardman, C.W. 2000. A target-oriented approach to forestecosystem design—changing the rules of forest planning. Ecological Modelling.127: 269-281.
Maffei, H.; Tandy, B. 2002. Methodology for modeling the spatial and temporal effectsof vegetation management alternatives on late successional habitat in the PacificNorthwest. In: Crookston, N.L.; Havis, R.N., comps. Second Forest Vegetation Simu-lator conference. Proc. RMRS-P-25. Fort Collins, CO: U.S. Department of Agriculture,Forest Service, Rocky Mountain Research Station: 69-77.
McCarter, J.B. 1997. Integrating forest inventory growth and yield, and computer visual-ization into a landscape management system. In: Teck, R.; Moeur, M.; Adams, J.,comps. Proceedings: Forest Vegetation Simulator conference. Gen. Tech. Rep. INT-GTR-373. Ogden, UT: U.S. Department of Agriculture, Forest Service, IntermountainResearch Station: 159-167.
McGaughey, R.J. 2002. Creating visual simulations of fuel conditions predicted by thefire and fuels extension to the Forest Vegetation Simulator. In: Crookston, N.L.; Havis,R.N., comps. Second Forest Vegetation Simulator conference. Proc. RMRS-P-25.Fort Collins, CO: U.S. Department of Agriculture, Forest Service, Rocky MountainResearch Station: 8-13.
McGaughey, R.J. 2004. Seeing the forest and the trees: visualizing stand and land-scape conditions. In: Proceedings, views from the ridge: considerations for planningat the landscape level. Portland, OR: Western Forestry and Conservation Association;U.S. Department of Agriculture, Forest Service, Pacific Northwest Research Station.133 p.
Mladenoff, D.; Baker, W. 1999. Development of forest and landscape modeling ap-proaches. In: Mladenoff, D.; Baker, W., eds. Spatial modeling of forest landscapechange: approaches and applications. Cambridge, United Kingdom: CambridgeUniversity Press: 1-13.
Moeur, M.; Stage, A.R. 1995. Most similar neighbor: an improved sampling inferenceprocedure for natural resource planning. Forest Science. 41(2): 337-359.
Ohmann, J.L.; Gregory, M.J. 2002. Predictive mapping of forest composition and struc-ture with direct gradient analysis and nearest neighbor imputation in coastal Oregon,USA. Canadian Journal of Forest Research. 32: 725-741.

40
Renner, D.L.; Martin, F.C. 2002. Using the fuels and fire effects and economic (ECON)extensions to the Forest Vegetation Simulator (FVS) to evaluate the impacts of silvi-cultural regimes. In: Crookston, N.L.; Havis, R.N., comps. Second Forest VegetationSimulator conference. Proc. RMRS-P-25. Fort Collins, CO: U.S. Department of Agri-culture, Forest Service, Rocky Mountain Research Station: 97-103.
Roberts, J.C. 2002. Using a multichange agent approach with the Forest VegetationSimulator on the Boise National Forest, Idaho. In: Crookston, N.L.; Havis, R.N.,comps. Second Forest Vegetation Simulator conference. Proc. RMRS-P-25. FortCollins, CO: U.S. Department of Agriculture, Forest Service, Rocky Mountain Re-search Station: 53-56.
Sessions, J.; Johnson, K.N.; Franklin, J.F.; Gabriel, J.T. 1999. Achieving sustainableforest structures on fire-prone landscapes while pursuing multiple goals. In: Mladenoff,D.; Baker, W.L., eds. Spatial modeling of forest landscape change: approaches andapplications. Cambridge, United Kingdom: Cambridge University Press: 210-255.
Smith, E.L.; McMahan, A.J.; Eager, T. 2002. Landscape analysis application of thewestwide pine beetle FVS extension. In: Crookston, N.L.; Havis, R.N., comps. Sec-ond Forest Vegetation Simulator conference. Proc. RMRS-P-25. Fort Collins, CO:U.S. Department of Agriculture, Forest Service, Rocky Mountain Research Station:62-67.
Spies, T.A.; Reeves, G.H.; Burnett, K.M. [et al.]. 2002. Assessing the ecologicalconsequences of forest policies in a multi-ownership province in Oregon. In: Liu, J.;Taylor, W.W., eds. Integrating landscape ecology into natural resource management.Cambridge, United Kingdom: Cambridge University Press: 179-207.
Stage, A.R. 1973. Prognosis model for stand development. Res. Pap. INT-137. Ogden,UT: U.S. Department of Agriculture, Forest Service, Intermountain Forest and RangeExperiment Station. 32 p.
Temesgen, H.; LeMay, V. 2002. Linking prognosis BC to aerial attributes for timbersupply analysis in British Columbia. In: Crookston, N.L.; Havis, R.N., comps.Second Forest Vegetation Simulator conference. Proc. RMRS-P-25. Fort Collins, CO:U.S. Department of Agriculture, Forest Service, Rocky Mountain Research Station:126-127.
Vandenriesche, D. 2002. Using the labeling capabilities and Parallel Processing Exten-sion of the Forest Vegetation Simulator for resource supply analyses. In: Crookston,N.L.; Havis, R.N., comps. Second Forest Vegetation Simulator conference. Proc.RMRS-P-25. Fort Collins, CO: U.S. Department of Agriculture, Forest Service, RockyMountain Research Station: 127-132.
Wedin, H. 1999. Stand level prescription generation under multiple objectives. Corvallis,OR: Oregon State University. 178 p. M.S. thesis.
Weise, D.R.; Kimberlin, R.; Arbaugh, M.J. [et al.]. 2000. A risk-based comparison ofpotential fuel treatment trade-off models. In: Neuenschwander, L.F.; Ryan, K.C., tech.eds. Proceedings of the joint fire science conference and workshop. Boise, ID: Univer-sity of Idaho and the International Association of Wildland Fire: 1-7.

41
Chapter 4: The SafeD Forest LandscapePlanning Model
Pete Bettinger, David Graetz, Alan Ager, and John Sessions1
We describe quantitative methods in landscape planning and the application of simula-tion and optimization to analyze alternative policy and management on large landscapes.Landscape planning models can help people see and think in whole-landscape termsand give them a common reference point for discussing conflicting values. Forestedlandscape conditions are projected through space and time and provide a way to helpevaluate the differences among alternative forest policies, and accomplish certain man-agement planning objectives with respect to landscape-level processes and goals.Evaluating alternative forest management policies across the interior West landscapeis complicated by the need to recognize the role of stochastic disturbances such asfire, insect, and disease outbreaks. We describe the development of the Simulation andanalysis of forests with episodic Disturbances (SafeD) model for the Interior NorthwestLandscape Analysis System project. The SafeD model is a multiscale, hybrid simula-tion/optimization model that addresses both optimization of silvicultural prescriptions atthe stand level and the spatial scheduling of these prescriptions on large landscapes tomeet multiobjective goals.
Keywords: Forest landscape planning, fire, natural disturbances, forest planning.
Resolving the myriad of forest policy problems in the Western United States is hinderedby the inability of land managers, policymakers, and planners to analyze tradeoffs ofalternative management scenarios on large, heterogeneous landscapes over long time-frames. With the growing emphasis on managing large landscapes, it has become diffi-cult to identify, visualize, and resolve conflicts on landscapes where there is interest in
Abstract
1 Pete Bettinger is an associate professor, Daniel B. WarnellSchool of Forest Resources, University of Georgia, Athens, GA30602. David Graetz is a graduate research assistant, Depart-ment of Forest Resources, John Sessions is a professor,Department of Forest Engineering, Oregon State University,Corvallis, OR 97331. Alan A. Ager is an operations researchanalyst, U.S. Department of Agriculture, Forestry and RangeSciences Laboratory, 1401 Gekeler Lane, La Grande, OR 97850.
Introduction

42
multiple, long-term goals. In addition, the current patchwork of regulatory policies, exist-ing landscape conditions, and landownership patterns has created a new matrix of op-erational constraints that virtually prohibit active restoration of risk-prone habitat (Quigleyet al. 2001). In many cases, the federal regulations that protect aquatic and terrestrialhabitats are frequently in conflict with management intentions aimed at moderating thethreat of severe wildfires or other disturbances. On typical national forest lands in easternOregon, resource protection prevents fuel treatments and stocking control on over 75percent of the nonwilderness lands (Wilson et al., in press), thereby perpetuating thecycle of fuels buildup and catastrophic wildfire. Low-value products from typical restora-tion activities and finite Forest Service budgets further reduce the areas that can betreated to control density and maintain healthy forest stands.
The past decade has seen the rise of landscape planning models that use simulationand optimization methods to help dissect policy and management goals. Landscapeplanning models evolved from a fusion of landscape ecology models and forest planningefforts (Mladenoff and Baker 1999, Sessions et al. 1999) and allow for the deduction ofresults otherwise unattainable owing to the complexity of the planning problem on largelandscapes (Mladenoff and He 1999). The goal of these models is to provide a mecha-nism to simulate landscape change in response to varying levels of management, distur-bance, and succession (Mladenoff and Baker 1999, Mladenoff and He 1999, Quigley etal. 1996, Roberts and Betz 1999, Sessions et al. 1999). These models hold promise forsolving policy issues, such as those related to the management of disturbance-pronelandscapes, while simultaneously meeting the concerns for forest and rangesustainability and the viability of terrestrial and aquatic species.
Although these hybrid simulation/planning models are clearly valuable tools to sort outthe strategic visions for multiownership watersheds, there remain many gaps, as well asbarriers, to more widespread application. One area that deserves attention is the processfor allocating an array of stand management goals over space and time to meet land-scape-level goals. Management decisions at the stand level, as well as succession anddisturbance processes, ultimately drive landscape change, and the linkage betweendecisions at the stand level and their influence on the attainment of landscape goals ispoorly understood. Clearly, decisions at both scales are important components of land-scape-scale planning. The integration of stand-level optimization processes and land-scape-level optimization processes has yet to be demonstrated.
In this paper, we summarize analytical methods used in landscape planning and de-scribe how this work is being further developed for the Interior Northwest LandscapeAnalysis System (INLAS) project area. The goal of this work is to create a multiscale(i.e., stand and landscape) model that can be used to sort out management issueson large forest and rangeland areas in the interior West. We discuss the concept ofstand-versus landscape-level optimization in meeting multiobjective goals and the inte-gration of these two modeling scales within the INLAS project. Our goal is to apply thismodeling method to address the following questions:
1. Can alternative management scenarios designed at the stand level have a significanteffect on measures of forest ecosystem health, commodity production, and cumula-tive effects when portrayed spatially at a landscape level? That is, do stand-levelobjectives prevent the attainment of landscape-level goals?
2. Do landscape-level objectives prevent the attainment of stand-level goals?

43
3. When measured at the landscape level, can the threat of fire and cumulative water-shed effects be reduced through alternative management policies? Can the spatialdistribution of management activities, within and across ownerships, significantlyaffect measures of forest ecosystem health, commodity production, and cumulativeeffects?
4. Do landownership patterns and behavior affect forest ecosystem health, commodityproduction, and cumulative effects, when portrayed spatially at a landscape level?
5. To what extent are commodity production, fire threat, cumulative effects, and fish andwildlife habitat goals compatible?
The answers to these questions will contribute to the ongoing discussion concerningsustainable management of Western landscapes. The flow of this paper proceeds first bydiscussing the literature associated with the optimization of stand-level goals, then theoptimization of landscape-level goals. These two sets of goals are assumed to operate atdifferent spatial scales and thus may not be complementary. We then describe an ap-proach we are developing to integrate the two concepts by using a hybrid landscapesimulation/optimization model. Landscape simulation or optimization models may offersome advantages for land management planning. In particular, the modeling frameworkcan be designed to address a variety of management objectives and constraints, incor-porate spatial representations of the landscape, and model processes at various scales.The fine resolution that landscape simulation and optimization models can supportmakes them more complex, yet can provide more detailed analyses of alternative poli-cies. The model we propose developing will support an evaluation of policies in the inte-rior West within the INLAS project.
Stand-level optimization methods are used to develop optimal management prescriptionsfor individual stands, given a set of management goals. Stand-level optimization methodshave evolved with the changing demands placed on forests. Initially the goals were tomaximize economic or commodity production values but more recently have placed em-phasis on noncommodity values. The approaches that can be used to develop optimalstand-level management prescriptions include the Hooke and Jeeves method (Haight etal. 1992, Hooke and Jeeves 1961), dynamic programming (Amidon and Akin 1968;Arthaud and Klemperer 1988; Brodie and Kao 1979; ; Brodie et al. 1978; Brukas andBrodie 1999; Chen et al. 1980a, 1980b; Gong 1992; Haight et al. 1985; Hool 1966; Kaoand Brodie 1979; Yoshimoto et al. 1990), nonlinear programming (Kao and Brodie 1980),or specialized heuristics (Bare and Opalach 1987). Many of these approaches key off ofwhole stand growth-and-yield models or stand age/structure models, which do not tendto provide the tree-level data conditions necessary to facilitate the use of fire behaviormodels.
Most stand-level optimization methods reported in the literature focus on meeting foresteconomic or commodity production goals rather than the nontimber goals, such as areduction in the threat of fire, which is becoming more important in the interior West.In fact, the optimization models that key off of individual tree growth-and-yield models(table 1) were developed with fixed-decision criteria, mainly economic, in mind. Thereare, however, some exceptions. Haight et al. (1985), for e.g., tracked biological indica-tors in the development of stand prescriptions although they were not influential in devel-oping the management prescriptions. More recently, Haight et al. (1992) incorporatednontimber outputs into the development of optimal prescriptions by using penalty func-
Stand-LevelOptimization
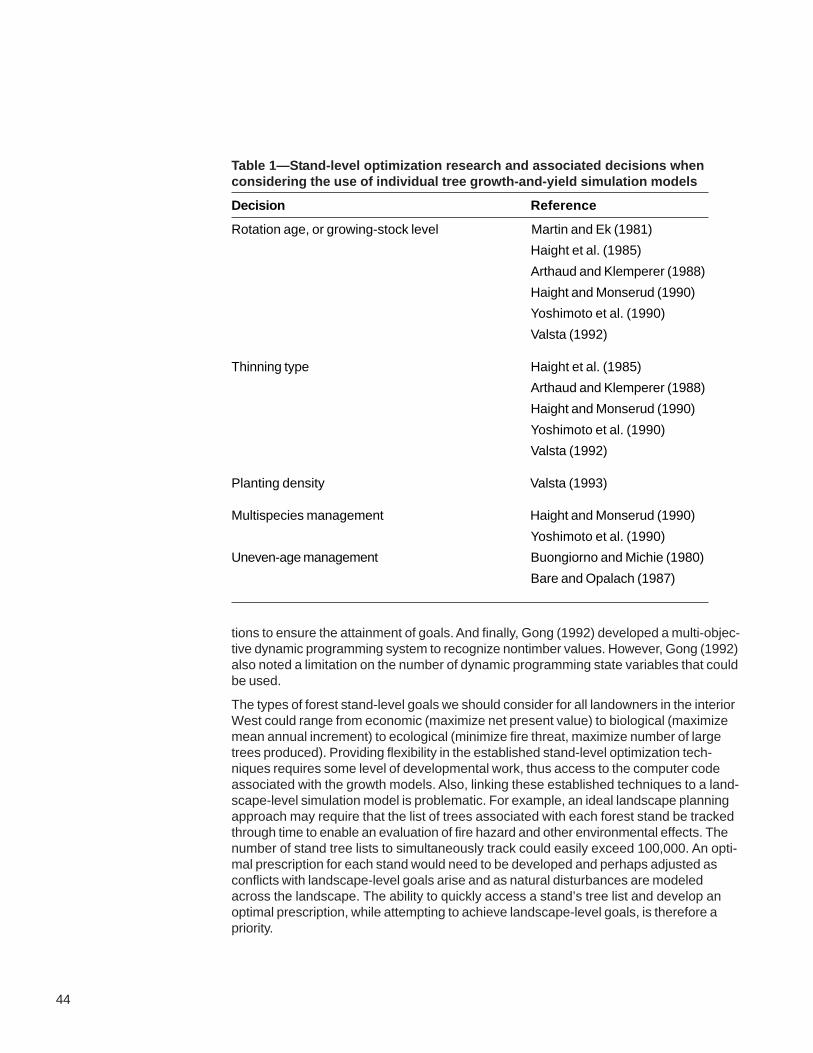
44
tions to ensure the attainment of goals. And finally, Gong (1992) developed a multi-objec-tive dynamic programming system to recognize nontimber values. However, Gong (1992)also noted a limitation on the number of dynamic programming state variables that couldbe used.
The types of forest stand-level goals we should consider for all landowners in the interiorWest could range from economic (maximize net present value) to biological (maximizemean annual increment) to ecological (minimize fire threat, maximize number of largetrees produced). Providing flexibility in the established stand-level optimization tech-niques requires some level of developmental work, thus access to the computer codeassociated with the growth models. Also, linking these established techniques to a land-scape-level simulation model is problematic. For example, an ideal landscape planningapproach may require that the list of trees associated with each forest stand be trackedthrough time to enable an evaluation of fire hazard and other environmental effects. Thenumber of stand tree lists to simultaneously track could easily exceed 100,000. An opti-mal prescription for each stand would need to be developed and perhaps adjusted asconflicts with landscape-level goals arise and as natural disturbances are modeledacross the landscape. The ability to quickly access a stand’s tree list and develop anoptimal prescription, while attempting to achieve landscape-level goals, is therefore apriority.
Table 1—Stand-level optimization research and associated decisions whenconsidering the use of individual tree growth-and-yield simulation models
Decision Reference
Rotation age, or growing-stock level Martin and Ek (1981)
Haight et al. (1985)
Arthaud and Klemperer (1988)
Haight and Monserud (1990)
Yoshimoto et al. (1990)
Valsta (1992)
Thinning type Haight et al. (1985)
Arthaud and Klemperer (1988)
Haight and Monserud (1990)
Yoshimoto et al. (1990)
Valsta (1992)
Planting density Valsta (1993)
Multispecies management Haight and Monserud (1990)
Yoshimoto et al. (1990)
Uneven-age management Buongiorno and Michie (1980)
Bare and Opalach (1987)

45
A stand goal within (SafeD) is defined by some set of attributes that are desired of astand at some future point (or points). An example may be to have a stand that has60 percent of its basal area in western larch (Larix occidentalis Nutt.) with the remain-ing 40 percent in Douglas-fir (Pseudotsuga menziesii (Mirb.) Franco) and grand fir (Abiesgrandis (Dougl. ex D. Don) Lindl.). There is almost an unlimited number of stand goalsthat can be developed for any one stand—the only restriction is that goals must bebased on attributes that are attainable from the data that describe the specific stand ofinterest (i.e., the “tree list”).
Why are stand goals important for INLAS? One objective in INLAS is to create prescrip-tions for the current landscape that can be evaluated as if they were actually imple-mented on the ground. This will be done through computer simulation. Stand goals arecrucial to the development of specific prescriptions because they give us a target anddecision criteria for deciding if certain management actions are needed and in whatquantities. In essence, stand goals quantify the desired conditions of a particular stand.When we optimize a stand prescription, we are essentially measuring attainment (ordeparture) from the stand goal. The closer we are to the goal, the better the prescription.
For any given stand in the INLAS study area, a stand goal may read, “Create a standthat minimizes its departure from a target Stand Density Index (SDI) value and concur-rently maximizes the value of the stand–subject to a minimal harvest volume, when har-vest is planned.”
Mathematically this would be written as:
where
p = a single period,
n = the total number of periods,
w1 and w2 = weights to emphasize importance of each attribute,
VALUE = an attribute that describes the value of the stand,
SDI_DE = an attribute calculated by squaring the SDI deviation (which is the
difference between the obtained SDI and the target SDI),
Hp = the harvest level from the stand during period p, and
MinHarvp = a minimum harvest-level threshold during period p.
In most landscape planning processes, much consideration is given to the decisionvariables and the rules for assigning management activities to decision variables, thequantitative rules for selecting new plan configurations, and the length of time the activityselection process (i.e., search process) is allowed to proceed (i.e., how long the com-puter program is run). Quantitative relationships, or rules, to constrain or guide the as-signment of activities across a landscape can be categorized in many ways; one such
( )∑=
n
pmax
1SDI_DE*(w2) - VALUE*(w1)
Subject to: pMinHarvpp ∀≥ H ,
Landscape-LevelOptimization

46
categorization is whether the relationships require spatial information. The use of spatialinformation can make goal achievement a complex procedure in forest planning applica-tions, but is important for simulating landscape-level processes.
The spatial arrangement of wildlife habitat and forest management activities is importantfor a number of reasons, including complying with regulatory restrictions and organiza-tional policies and addressing aesthetic concerns. Forest regulations, for instance, areplacing increasingly restrictive limits on the size and spatial relationships of harvest unitson both private and public lands (Daust and Nelson 1993). The National Forest Manage-ment Act (1976) provides guidance regarding the appropriate harvest unit size on nationalforest lands, and the Oregon Forest Practices Act (State of Oregon 1999) provides simi-lar guidance for privately owned lands. As a result of a need to manage forest land withinregulatory frameworks, forest management planning now often attempts to achieve land-scape management goals by placing spatial constraints on the scheduling of manage-ment activities (O’Hara et al. 1989).
Landscape-level planning models that allow the optimization of a spatial arrangement ofactivities to meet a set of management objectives vary from the more traditional optimi-zations techniques, such as linear or mixed-integer programming (e.g., Hof et al. 1994),to the nontraditional, but increasingly common heuristic programming techniques (e.g.,Murray and Church 1995). Classical models such as the Timber Resource AllocationMethod (RAM) (Navon 1971) and the Forest Planning Model (FORPLAN) (Johnson et al.1980) were designed to address the problem of optimal scheduling of harvests withforestwide constraints. These models were used from the 1960s to 1990s and are classi-cal in the sense that they use linear programming to allocate resources and activities totimber stands, and to a limited extent, recognize spatial relationships. However, recogni-tion of spatial features in forest planning generally requires the use of integer-decisionvariables. Thus as the problem size increases, the potential solution space also in-creases, but at a disproportionately greater rate (Lockwood and Moore 1993). Mixed-integer programming and integer programming techniques have been used to help solvethese problems and produce feasible management plans, but these techniques havesubstantive limitations (directly related to problem size) when applied to large land-scapes (Lockwood and Moore 1993).
To explore the capabilities of traditional techniques, Hof and Joyce (1992) describednonlinear formulations aimed at accounting for the amount of edge, the juxtapositionof different habitat types, the dispersal distance among habitat types, and the minimumsize of a patch of habitat. Hof et al. (1994) also described a mixed-integer programm-ing approach that incorporates probabilistic objective functions for wildlife viability con-cerns. These approaches were theoretical in nature yet expanded the research bound-aries and provide valuable insight into a much broader range of capabilities of linear,integer, and nonlinear programming methods. The limitations of these techniques persist,however, and both heuristics and simulation models have since been explored as pos-sible alternatives.
The use of heuristics (solution methods that do not guarantee optimality of objectiveshas been achieved) in landscape planning is becoming more prevalent, particularly inplanning processes where the potential solution space is large, or spatial constraintsexist. Many types of complex, nonlinear goals (e.g., spatial and temporal distributionof elk (Cervus elaphus) habitat, as described in Bettinger et al. 1997), which have tradi-tionally been considered too complex to solve with traditional optimization techniques,are now being incorporated into heuristics. In recent years, heuristics have been applied
Heuristics

47
to scheduling problems related to forest management (Hoganson and Rose 1984), for-est transportation (Murray and Church 1995; Nelson and Brodie 1990; Pulkki 1984;Weintraub et al. 1994, 1995), wildlife conservation and management (Arthaud and Rose1996, Bettinger et al. 1997, Haight and Travis 1997), aquatic system management(Bettinger et al. 1998b), and the achievement of biological diversity goals (Kangas andPukkala 1996). Monte Carlo simulation, tabu search (TS), and simulated annealing (SA)are three of the more popular heuristics. Three other more recently developed heuristics,the great deluge algorithm (GDA), threshold accepting, and genetic algorithms, alsoseem to operate as well as the others. Some effort also is being made to integrate theaspects of each into hybrid heuristic techniques, although this research is in its prelimi-nary stages in natural resource management. Although the use of heuristics does notguarantee that a global optimum solution can be located for a particular landscape plan-ning problem, heuristics can produce feasible (and often very good) solutions to complexproblems, in a reasonable amount of time.
Simulated annealing is a search technique that began to be widely used during the early1980s in operations research fields (Dowsland 1993). The foundation for SA was firstpublished by Metropolis et al. (1953) in a scheduling algorithm that simulated the coolingof materials in a heat bath–a process known as annealing. The SA technique is a MonteCarlo method that uses a localized search process, where a subset of solutions is ex-plored by moving from one solution to a neighboring solution with a simple change of acharacteristic of a single-decision variable (1-opt moves), such as the timing of harvestof a management unit.
Threshold accepting (TA) is similar to SA, and was introduced by Dueck and Scheuer(1990). The TA technique also uses a localized search process but uses a slightly differ-ent, and somewhat simpler, set of acceptance rules for a new solution than does SA.Threshold accepting accepts every new (proposed) solution that is not much worsethan the previous solution (within a preset limit of the value of the current solution),whereas in SA, the probability that a lower quality proposed solution would replace thecurrent solution is a function of the quality of the solution and a stochastic element.
The great deluge algorithm is similar to SA in that it uses a localized search process.The GDA was introduced by Dueck (1993) and derives its name from the conceptualframework on which the algorithm works. Consider a problem where the objective is tofind the highest elevation in a fictitious landscape by simply walking around and measur-ing elevations. Logically you would want to continuously measure higher and higherground rather than lower ground. The GDA starts at some unknown location in the land-scape, and subsequently weather conditions would be modeled as though it is “rainingwithout end,” flooding the landscape and making it easier to locate the higher elevations.As the water rises, the GDA moves around the landscape (the solution space) trying to“keep its feet dry” (by only walking on higher and higher ground), and eventually findingwhat it considers the highest spot on the landscape, or an estimate of the global opti-mum solution to a planning problem.
Tabu search has been successfully applied to a number of scheduling problems outsideof forestry and wildlife management, such as those in telecommunications, transporta-tion, shop sequencing, machine scheduling, and layout and circuit design problems(Glover 1990, Glover and Laguna 1993). Within forestry it has been applied to timber har-vest scheduling problems with adjacency (green-up) requirements (Murray and Church1995), as well as for developing forest plans that have landscape goals for elk (Bettingeret al. 1997) and aquatic habitat (Bettinger et al. 1998b). Tabu search with 1-opt movessuch as the harvest timing of a management unit, short-term memory, and aspiration
48
criteria is a good scheduling technique, but generally not as good as SA, TA, or GDA(Bettinger et al. 2002). Using 2-opt (the swapping of choices among two decision vari-ables) (and greater) moves has allowed TS to produce results as good as SA, TA, orGDA (Bettinger et al. 2002), but at a fairly large computing cost (Bettinger et al. 1999).One advantage of TS is that it is well suited to parallel processing.
Genetic algorithms (GA) were developed initially by Holland (1975) in the 1970s. Diversefields such as music generation, genetic synthesis, strategic planning, and machinelearning have benefited from the application of GAs to the scheduling of resources(Srinivas and Patnaik 1994). The GAs have been applied to a limited extent in forestry(Falcão and Borges 2000, Lu and Eriksson 2000, Mullen and Butler 1999). Although GAshave proven to be fairly good in developing moderately complex forest plans (Bettinger etal. 2002), it is more difficult to implement GAs than SA, TA, or GDA. A hybrid GA/TSheuristic technique that utilizes 1-opt and 2-opt TS processes as well as a GA crossoverprocess (Boston and Bettinger 2002) also has shown promise for developing moderatelycomplex forest plans.
Simulation models that schedule forest management activities similar to heuristics andtraditional mathematical programming techniques can be developed to provide the spatialand temporal context to help guide policymakers who are given the task of evaluatingstrategic alternatives. These models might be considered favorable to use in situationswhere stochastic elements are modeled, making optimization difficult. Simulation mod-els generally are developed to capture relevant features of the dynamic nature of some“target system” under study (Birta and Özmizrak 1996), and their reliability is highlydependent on the degree to which the models reflect reality (Li et al. 1993). Gaining reli-ability in a simulation model is not a trivial task. For example, ecological consequencescan differ dramatically depending on the pattern of land use activities imposed on a land-scape (Franklin and Forman 1987); thus one measure of reliability is in modeling realisticland use activities.
Many simulation models have been developed in the last two decades to model events orbehaviors across landscapes. Franklin and Forman’s (1987) was one of the first to simu-late the ecological consequences of forest management activities on a landscape, andindicated that the pattern of management applied to landscapes can result in varyingecological consequences. Others (Flamm and Turner 1994; Gustafson and Crow 1994,1996; Gustafson et al. 2000; Johnson et al. 1998; Li et al. 1993; Turner 1987; Wallin etal. 1994) have since developed models for forested landscapes that simulate a variety ofactivities or disturbances at various spatial and temporal scales. Simulation models havebeen widely used in other natural resource areas as well. For example, they have beendeveloped to focus on other types of disturbances and landscapes, such as gypsy moth(Lymantria dispar) outbreaks (Zhou and Liebhold 1995) and grasslands (Gao et al. 1996).As with heuristics, the use of simulation models does not guarantee that a global opti-mum solution can be located for a particular landscape planning problem; in fact, mostsimulation models do not claim to be attempting to locate optimal solutions. Simulationmodels can, however, produce feasible (and often very good) solutions to complex prob-lems, in a reasonable amount of time.
Some common drawbacks, however, of forest landscape simulation models include:
• Resolution of the landscape scale is low.
Simulation Models
49
• Integration of activities within a hierarchical spatial structure is low. For example,small basic simulation units might be aggregated into larger management units,which might be aggregated into larger management units, which might be aggregatedinto even larger harvest blocks.
• Only a few variables are used to track and allocate activities, such as transitionprobabilities or stand age.
• Use of other socioeconomic or ecological information to track and allocate activitiesis low.
• Landownership is not explicitly recognized.
• Spatial allocation of harvests is stochastic.
• Key landscape variables, such as topography and stream networks, are notrecognized.
• Regeneration harvest sizes are determined by using a normal distribution of harvestsizes.
• Broad management strategies are stochastically implemented.
• Initial conditions of the landscape are randomly assigned.
Two projects have been undertaken in the past 5 years to develop simulation models toovercome most of these limitations. The Coastal Landscape Analysis and ModelingStudy (CLAMS) (http://www.fsl.orst.edu/clams/), centered in the Coast Range of Oregon,is developing the LAndscape Management Policy Simulator (LAMPS) model to evaluatealternative forest management policies across all landownerships, long timeframes (100years), and large areas (2 million ha). The LAMPS model does not, however, incorporatestochastic fire events in the simulation of management policies. The Applegate Project(http://www.cof.orst.edu/research/safefor/) developed a hybrid landscape optimization/simulation modeling system called “Simulation and analysis of forests with episodicDisturbances,” or SafeD (Graetz 2000), that incorporated stochastic fire events. Table 2presents a comparison of a few of the more important aspects of four forest landscapesimulation models: “Safe Forests” (Johnson et al. 1998), LANDIS (Gustafson et al.2000), LAMPS (Bettinger and Lennette 2002), and SafeD.
The approach we are suggesting would be useful in evaluating the aggregate effectsof policies across a forested landscape and centers on the ability to use spatial simula-tion or optimization techniques. This type of approach can provide managers, policy-makers, and planners with the ability to think about forests and their management inways unimagined only a few decades ago. Often called “landscape assessment andplanning,” these approaches help people see and think in whole-landscape terms (notsimply single ownerships) and give them a common reference.
In support of the INLAS project, we are proposing the development of a spatial landscapesimulation model that will use spatial analysis techniques to model forest change acrossall ownerships and over long timeframes. Although the model will use both strategic(long-range, coarse-scale) and tactical (short-range, fine-scale) planning methods, it ismore appropriate to call it a midscale, or regional, simulation model than a fine-scaletactical planning model. Successful implementation requires effective interdisciplinarycollaboration that addresses the economic, ecological, and social dimensions of pro-posed management policies. Bettinger (1999) proposed that four elements were requiredat appropriate levels for a system to be implemented effectively: people, databases,
Approach andDesign of aLandscape PlanningModel
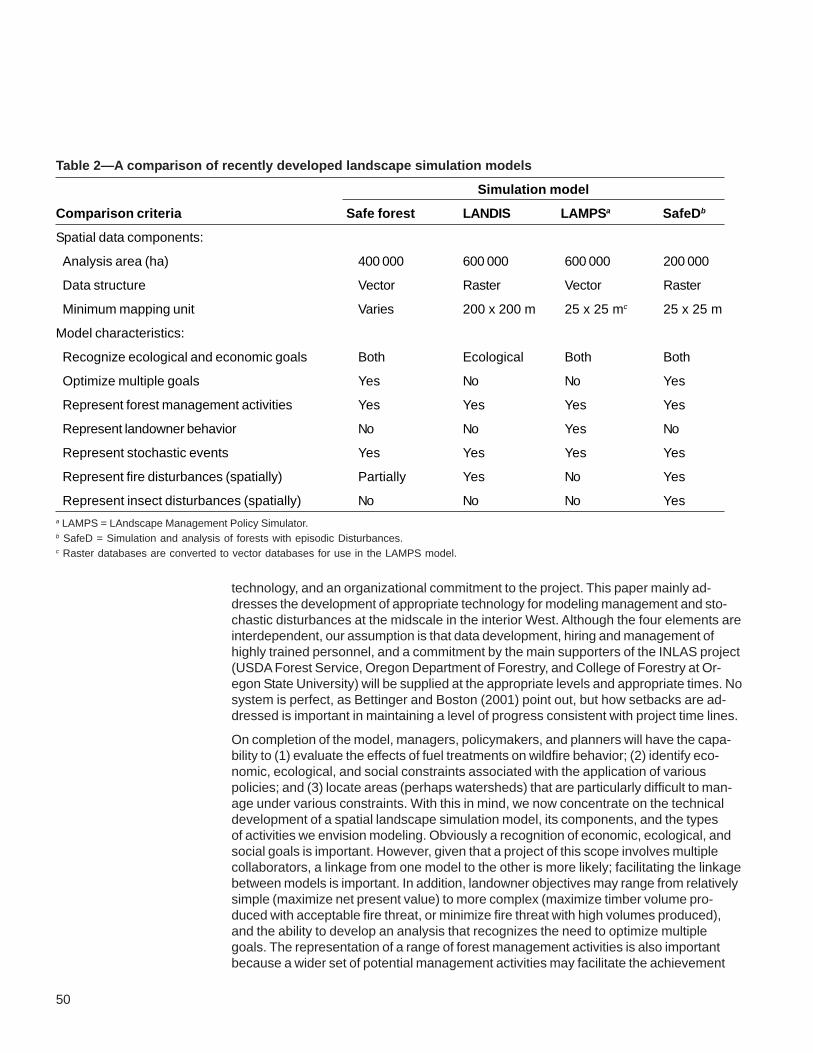
50
technology, and an organizational commitment to the project. This paper mainly ad-dresses the development of appropriate technology for modeling management and sto-chastic disturbances at the midscale in the interior West. Although the four elements areinterdependent, our assumption is that data development, hiring and management ofhighly trained personnel, and a commitment by the main supporters of the INLAS project(USDA Forest Service, Oregon Department of Forestry, and College of Forestry at Or-egon State University) will be supplied at the appropriate levels and appropriate times. Nosystem is perfect, as Bettinger and Boston (2001) point out, but how setbacks are ad-dressed is important in maintaining a level of progress consistent with project time lines.
On completion of the model, managers, policymakers, and planners will have the capa-bility to (1) evaluate the effects of fuel treatments on wildfire behavior; (2) identify eco-nomic, ecological, and social constraints associated with the application of variouspolicies; and (3) locate areas (perhaps watersheds) that are particularly difficult to man-age under various constraints. With this in mind, we now concentrate on the technicaldevelopment of a spatial landscape simulation model, its components, and the typesof activities we envision modeling. Obviously a recognition of economic, ecological, andsocial goals is important. However, given that a project of this scope involves multiplecollaborators, a linkage from one model to the other is more likely; facilitating the linkagebetween models is important. In addition, landowner objectives may range from relativelysimple (maximize net present value) to more complex (maximize timber volume pro-duced with acceptable fire threat, or minimize fire threat with high volumes produced),and the ability to develop an analysis that recognizes the need to optimize multiplegoals. The representation of a range of forest management activities is also importantbecause a wider set of potential management activities may facilitate the achievement
Table 2—A comparison of recently developed landscape simulation models
Simulation model
Comparison criteria Safe forest LANDIS LAMPSa SafeDb
Spatial data components:
Analysis area (ha) 400 000 600 000 600 000 200 000
Data structure Vector Raster Vector Raster
Minimum mapping unit Varies 200 x 200 m 25 x 25 mc 25 x 25 m
Model characteristics:
Recognize ecological and economic goals Both Ecological Both Both
Optimize multiple goals Yes No No Yes
Represent forest management activities Yes Yes Yes Yes
Represent landowner behavior No No Yes No
Represent stochastic events Yes Yes Yes Yes
Represent fire disturbances (spatially) Partially Yes No Yes
Represent insect disturbances (spatially) No No No Yesa LAMPS = LAndscape Management Policy Simulator.b SafeD = Simulation and analysis of forests with episodic Disturbances.c Raster databases are converted to vector databases for use in the LAMPS model.

51
of certain goals. And finally, the ability to recognize or model stochastic events is be-coming more important as these events shape the condition of forests much more thanactivities by humans. Spatially representing fire spread and insect outbreaks as a func-tion of forest conditions and landscape characteristics is important. Obviously the previ-ous forest management practices can affect the risk of a stochastic event occurring;thus when projecting future conditions, the planned activities will also likely affect theserisk levels.
As noted earlier, the main objective of this paper is to develop a spatial forest landscapesimulation model that allows the portrayal of processes (management activities, sto-chastic events, etc.) and subsequent analysis of silvicultural treatments at both thestand and landscape levels. The approach and design of this modeling effort build onthe efforts of Graetz (2000), who developed a preliminary model (SafeD) to incorporatefire and insect disturbances in a landscape planning system. The SafeD model evolvedfrom the efforts of the Sierra Nevada Ecosystem Project (Sessions et al. 1999) and theApplegate Project (Graetz 2000). The SafeD model is a spatially explicit, hybrid simula-tion/optimization model that allows the achievement of multiple resource goals at boththe stand and landscape levels, while recognizing stochastic disturbances, and manage-ment behavior. It uses a distance-independent individual tree growth model (similar tothe Forest Vegetation Simulator) to facilitate the development of optimal stand prescrip-tions, a heuristic scheduling model to allocate prescriptions across the landscape, anda raster-based fire-spread model called Fire Area Simulator (FARSITE, Finney 1998) tomodel fire on the landscape. This modeling framework is attractive because it can sched-ule management activities that attempt to meet long-term landscape goals under anuncertain future of stochastic disturbances.
To recognize the achievement of optimal stand-level prescriptions, optimal landscape-level objectives, and to recognize stochastic events, the operation of the SafeD model issegmented into four processing stages (fig. 10). To recognize the importance of bothstand- and landscape-level goals, SafeD first develops a set of optimal prescriptions foreach stand. It then allocates the prescriptions to the landscape to achieve landscape-level goals. Stochastic events are then applied to the landscape in a spatial manner.Finally, the stand- and landscape-level goals are reevaluated and adjusted, if necessary,to reflect the changes that have occurred on the landscape and in affected stands.
Within SafeD, prescriptions for timber stands are dynamically generated by a stand opti-mization model that uses a combination of the region-limited strategy and path (RLS-PATH) algorithm (Yoshimoto 1990). A number of potential stand-level objectives can berecognized, and an optimal prescription for each can be developed. One challenge for theINLAS science team and collaborators will be in defining the types of stand-level objec-tives that should be modeled. The types of objectives modeled in the Applegate Project(Graetz 2000) included limiting fire hazard, limiting insect and wind-throw hazard, en-hancing wildlife habitat, improving fish habitat, and maximizing net present value. Toachieve these objectives, tree harvesting and snag creation rates were varied, and theresulting residual tree growth monitored. Goal achievement was then measured by usingboth live- and dead-tree characteristics.
Because an optimal stand-level management prescription is developed for all stand-levelobjectives, a second challenge becomes deciding which prescription to actually apply toeach stand. For example, if we had three potential objectives (maximize net presentvalue [a single goal for a stand], minimize fire hazard [a single goal for a stand], or maxi-mize net present value with an acceptable fire hazard [multiple goals for a stand]), three
Optimizing Stand-LevelGoals
The Simulation andAnalysis of Forestswith EpisodicDisturbances Model

52
optimal prescriptions would be developed for each stand on the landscape. Only one ofthese prescriptions can be applied to each stand, however. The prescription choice willbe based on its contribution to overall landscape goals when applied to a stand, whichmay be a function of the spatial location of each stand.
The second stage of SafeD consists of a landscape simulation model that distributesthe optimal stand-level prescriptions through time and space given landscape-level goalsand constraints. It is often confusing to those not closely familiar with forest planningefforts that stand- and landscape-level objectives are not necessarily compatible. A briefexample may help clarify this notion. Let’s say we have four hypothetical stands, eachcontaining a different set of stand conditions. Applying stand-level optimization tech-niques to each to maximize net present value, e.g., may lead to a schedule that indi-cates each should be clearcut immediately. Although this may seem extreme, theseprescriptions are optimal for each stand and represent decisions that are independentof the other stands. If the overall landscape objective of the landowner is to spread theharvests out evenly over time to avoid surges and dips in timber production, one or moreof the optimal stand-level prescriptions could not be used, and some other prescriptionneeds to be developed to represent the management of these stands. Therefore althoughoptimal stand prescriptions can be generated, it is highly unlikely that they will lead
Figure 10—Four-stage process of the Simulation and analysis of forest with episodic Disturbance model.
Optimizing Landscape-Levels Goals

53
directly to an optimal landscape-level scheduling solution (unless both stand- and land-scape-level objectives are exactly the same).
The SafeD model designs planning problems as Model I nonlinear integer problems,where individual stands are tracked through time as they are regenerated or disturbed.The spatial location of each stand, as well as certain stand structural conditions, is im-portant in adequately modeling management behavior and natural disturbance events.
It is clear from the previously provided summary of the literature that traditional tech-niques, such as linear or integer programming, are not appropriate for management plan-ning at the landscape scale when integer variables are required to represent spatial land-scape features. Therefore, a heuristic scheduling technique, the GDA, was chosen foruse as the landscape-level optimization technique in the SafeD model. In the ApplegateProject implementation of SafeD (Graetz 2000), the following objective function wasused:
maximize:
∑∑∑= = =
m
k
q
j
n
ttjktjk xr
1 1 1,,,, , (3)
where
k = a stand;
m = total number of stands in a landscape;
j = a prescription;
q = total number of possible prescriptions;
t = a time period;
n = total number of time periods in a planning horizon;
rk,j,t
= the value of some stand attribute residing in stand k, when managed under pre-scription j, during time period t; and
xk,j,t
= a binary (0-1) variable indicating whether prescription j was assigned to stand kduring time period t.
A variety of constraints can be included in the SafeD model; however, the current versionof the SafeD model uses only two. The first is a constraint limiting the number of pre-scriptions applied to a stand in each time period,
∑=
∀=q
jtjk tkx
1,, ,1 , (4)
and the second is a constraint on the level of equivalent roaded acres (ERA) that re-sulted from management activities. The ERA (McGurk and Fong 1995) is a measureused by the national forests to estimate cumulative impacts to a landscape, and tosome extent, explains the hydrologic recovery of watersheds. There has been somedebate, however, about the ability of ERA to be correlated with changes in measures ofaquatic habitat (sediment and temperature) (Bettinger et al. 1998a). Within SafeD, anERA constraint was applied in each time period and to each subwatershed:

54
wtThresholdERA
A
AERA
wtp
kk
p
kktk
,_ ,
1
1,
∀≤
∑
∑
=
=
where
k = a stand,
p = the total number of stands in a subwatershed,
t = a time period,
w = a watershed,
ERAk,t
= the contribution to equivalent roaded acres by stand k during time period t,
Ak = the area of stand k, and
ERA_Thresholdt,w
= the upper limit on equivalent roaded acres allowed in subwatershedw during time period t.
Other constraints could be added to the SafeD model to guide the scheduling of man-agement activities during the landscape-level optimization process. These may includetimber harvest volume flow constraints, harvest adjacency (green-up) constraints, or themaintenance of a distribution of habitat patch sizes. Constraints also can be applied toindividual landowner groups, or land allocations within landowner groups. Collaborators ofthe INLAS project will be called on to provide guidance in the development of appropriatelandscape-level processes that must be recognized in future versions of SafeD; the land-scape-level objectives and constraints will arise from these discussions.
The third stage of SafeD distributes stochastic events across time and space. The briefdescription of stochastic events that follows is not meant to minimize their importance ina landscape planning effort. Within the SafeD model, fire events are applied in a spatialmanner across the landscape in response to climatic variables and the managementactivities prescribed for each stand. Insect disturbance models were based on expertadvice and are designed to simulate the expected growth-and-yield losses from forestsover the long run. Episodic mortality of trees is embedded in the SafeD model to occurduring drought periods (which are determined in a stochastic manner). Mild and severedrought periods will trigger the application of insect disturbances to the landscape. Dur-ing these insect events, the structural condition of each stand in the landscape is exam-ined, and a decision is made regarding the application of accelerated mortality rules.
Wildfires are applied to the landscape in the SafeD model by using the FARSITE modeldeveloped by Finney (1998). The FARSITE model is a fire growth-and-spread model thatrequires a spatial database describing the landscape. It includes methodology that al-lows the modeling of surface fire spread, crown fire spread, fire spotting, and fuel mois-ture content. Enabling the use of FARSITE requires knowing how many fires will occurduring a specific period, how long they will burn, and where the initiation points are onthe landscape. Probability distributions were used in the Applegate Project (Graetz 2000)to determine these parameters.
Recognizing StochasticEvents
(5),
55
A number of sources of information are brought to bear on the modeling of stochasticevents, including expert knowledge and functional relationship models. The literature onthe effects of fire and insect events on landscapes is broad, yet little exists when oneconsiders including these events in a forest landscape planning model. Some examplesinclude Armstrong et al. (1999) who modeled the effects of natural disturbances (fires) onboreal landscapes nonspatially by assuming a distribution of forest types would be re-generated each year, and Reed and Errico (1986) who modeled the effects of fire in alinear programming model (again, nonspatial), but found that although fire losses may bestochastic, a close approximation to an optimal solution for a forest plan can be devel-oped by using deterministic fire distributions that closely resemble the stochastic distur-bance levels.
The fourth stage of SafeD provides for a reoptimization of stand-level objectives in thosestands affected by the distribution of stochastic events across the landscape. Land-scape-level objectives are then reexamined, and prescriptions reassigned to reflect at-tainment of these goals.
The approach we describe represents a refined forest landscape simulation model that isable to prescribe, schedule, and locate treatments dynamically in response to stochas-tic disturbances (fire, insects, etc.). This type of planning or policy analysis model will beuseful in efforts aimed at evaluating the aggregate effects of policies across a forestedlandscape, and can provide managers, policymakers, and planners with the ability tothink about forests and their management in ways unimagined only a few decades ago.Often called “landscape assessment and planning,” this type of approach helps peoplesee and think in whole-landscape terms (not simply single ownerships) and promotes acommon understanding of the basic processes that underlie landscape change.
We will apply SafeD to evaluate several alternative forest management policies and prac-tices of each landowner in the pilot test area. The economic, ecological, and social ef-fects will be measured for management scenarios that achieve specific goals related tofuels reduction, riparian management, threatened and endangered species habitat, andother values. At the initiation of the INLAS project, the intent (from the Oregon State Uni-versity modeling perspective) was to support the Oregon Department of Forestry’s effortat evaluating landscape management alternatives for eastern Oregon, thus supportingthe Forestry Program for Oregon and providing spatial projections of how the landscapemight look under different management scenarios. It is hoped that simulations fromSafeD also could provide national forest managers direction for choosing forest land-scape management systems that address the tradeoffs associated with timber produc-tion, fire risk, and ecosystem health.
Analysis of alternative policies is the primary product of this modeling effort and will likelybe a learning process for all involved. Outputs from the modeling effort will include a setof GIS databases that provide an indication of the effects of alternative management poli-cies on the forest resources of eastern Oregon. Associated with these GIS databasesare forest structural conditions (as represented by tree lists) that can facilitate furtheranalyses of the effects of policies on wildlife and aquatic habitat resources on forestedlands. Evaluating the impact of policies in a spatial context will require thinking aboutforests and forest resources in a manner heretofore difficult to perform. Although sets ofdata describing economics and commodity production levels will allow a relative compari-son of alternative policy scenarios, examining alternative policies at a landscape scale(with maps) will likely require both quantitative and qualitative approaches.
Reoptimize Stand-LevelPrescriptions
Products andAudience

56
A secondary product of the modeling effort involves a separate analysis of silviculturaltreatments at the stand level. Here our goal is to understand which management prac-tices are most beneficial (from a variety of perspectives: reducing fire hazard, maximizingnet present value, etc.) to implement across broad classes of forests. Examining theresulting stand-level decisions, in light of forest-level goals and landscape disturbances,may provide management direction for both federal and private landowners, where mul-tiple-resource goals influence the management of interior West forests.
The tertiary products developed by the modeling effort will be knowledge, algorithms, andsoftware for modeling the effects of stand management and development on fine litterfalltree mortality, and snag longevity. The decay of large dead wood certainly is importantfor modeling wildlife, insects, and disease response to management and disturbanceprocesses. Snags are tracked through time in the stand-level prescription model. Downwood, however, is not tracked through time, nor is the decay of either resource. The de-cay of wood is important for various biological effects models. The type of “bottom-up”analysis that would be provided (from trees to landscapes) and the growth projectionsthat will ensue after natural disturbances may be useful in calibrating the INLAS stateand transition modeling effort (Hemstrom et al. Chapter 2). Estimates of decay rates forfine litter, coarse woody debris, and snags would also then logically follow and providea mechanism for summarizing these conditions over space and time, then facilitate anevaluation of the effects of management on wildlife species that utilize these resources.In addition, there has been only a limited amount of work aimed at incorporating fueldynamics into the prediction of fire occurrence and behavior. In fact, usually only themean rates of litter inputs and decomposition are used in modeling efforts, with no provi-sion for variation based on stand structure and density levels (e.g., Keane et al. 1996).Yet, stand density strongly influences fuel accumulation (Maguire 1994) and litter de-composition (Piene 1978). Thus the development of models that estimate the effectsof stand management on the production and decay of these resources is important.
The development of landscape simulation or optimization models requires a major col-laboration between scientists, planners, managers, and policymakers to ensure thatthe kind of model developed will have widespread application and acceptance at thespatiotemporal scales at which it is used. As with most large-scale landscape modelingefforts, collaborators of the INLAS project will be called on to provide guidance in theirareas of expertise. In large projects, with 10 to 20 internal collaborators and numerousoutside interest groups shaping the look and feel of an analysis system, the expectedgoals of the project will likely change. For example, a fire specialist will be asked toassist in fine-tuning parameters related to the fire spread model. As refinements aremade to these and other important components of an overall landscape modeling sys-tem, previously developed model components may need to be adjusted.
Although the modeling system we describe is well suited to address a wide spectrum ofissues relating to the dynamics of change in coniferous forests, there remain a numberof gaps in our knowledge about important disturbance factors that affect other significantresources. Of most interest are invasive plants, large herbivores, and hydrologic pro-cesses that regulate stream geomorphology and associated riparian conditions. Dataand models are lacking to incorporate the effects of these factors into detailed simulationmodels like SafeD that model processes like stand growth in a continuous scale. In theabsence of refined data and models, an alternative approach to building a landscapemodel that considers these factors is described by Hemstrom et al. (Chapter 2). Finally,for demonstration purposes, stochastic processes are incorporated into the results only
57
once. For extensive analysis purposes, multiple runs will be required to assess the ca-pacity of the landscape to not only produce the goals suggested by the policymakersbut also to evaluate the projected dynamics of change that affect natural resources.
Two rather difficult issues to address are those related to sensitivity analysis and valida-tion of the SafeD process. Sensitivity analyses give the customer of the simulation sys-tem products a sense of the importance of variables in the model. At present, no sen-sitivity analysis has been planned. Given the number of variables included in the firemodel, the stand-level prescription generator, and the SafeD landscape model, the num-ber of potential scenarios that can be modeled is infinite. The difficulty for a sensitivityanalysis effort will be in determining which parameters to keep constant, and which tovary. It may be more difficult to determine which to keep constant in a sensitivity analy-sis, because it assumes that these variables are reflective of the human or natural sys-tem. Validation of large forest landscape models has generally been limited to anassessment of how well the model simulates what is typically known (e.g., recent har-vest levels, recent areas treated with various management prescriptions). It has beensuggested that one should use simulation models to evaluate paths from past conditionsto the present. This would allow one to evaluate how well the models can explain pastbehavior of landscapes and may provide a good clue as to how they can help explainfuture behavior. However, projecting a historical landscape to the present is problematic.One would need databases that describe the landscape 20, 30, or more years ago to dothis, an effort not planned within the INLAS project. Thus validation of large-scale forestlandscape planning models is elusive. A number of verification processes are used todetermine whether submodels within the larger SafeD modeling framework are workingas intended, by comparing various output products to the models (e.g., the Forest Veg-etation Simulator) from which the processes were derived. In addition, the cumulativeresults from a landscape simulation (harvest volumes, areas treated, fire risk, etc.) willbe evaluated for reasonableness, which while not a validation, may suggest how well thesimulation model is performing.
The authors thank Jamie Barbour and Jane Hayes for their guidance in developing thispaper, and Kevin Boston, J. Douglas Brodie, and Miles Hemstrom for their thoughtfulreviews.
When you know: Multiply by: To get:
Hectares (ha) 2.47 Acres
Meters (m) 3.28 Feet
Amidon, E.L.; Akin, G.S. 1968. Dynamic programming to determine optimum levels ofgrowing stock. Forest Science. 14: 287-291.
Armstrong, G.W.; Cumming, S.G.; Adamowicz, W.L. 1999. Timber supply implica-tions of natural disturbance management. The Forestry Chronicle. 75: 497-504.
Arthaud, G.J.; Klemperer, W.D. 1988. Optimizing high and low thinnings in loblollypine with dynamic programming. Canadian Journal of Forest Research. 18: 1118-1122.
Arthaud, G.J.; Rose, D. 1996. A methodology for estimating production possibility fron-tiers for wildlife habitat and timber value at the landscape level. Canadian Journal ofForest Research. 26: 2191-2200.
Bare, B.B.; Opalach, D. 1987. Optimizing species composition in uneven-aged foreststands. Forest Science. 33: 958-970.
Acknowledgments
English Equivalents
Literature Cited

58
Bettinger, P. 1999. Distributing geographic information systems capabilities to fieldoffices: benefits and challenges. Journal of Forestry. 97(6): 22-26.
Bettinger, P.; Boston, K. 2001. A conceptual model for describing decisionmakingsituations in integrated natural resource planning and modeling projects. Environ-mental Management. 28: 1-7.
Bettinger, P.; Boston, K.; Sessions, J. 1999. Intensifying a heuristic forest harvestscheduling search procedure with 2-opt decision choices. Canadian Journal of ForestResearch. 29: 1784-1792.
Bettinger, P.; Graetz, D.; Boston, K. [et al.]. 2002. Eight heuristic planning techniquesapplied to three increasingly difficult wildlife planning problems. Silva Fennica. 36:561-584.
Bettinger, P.; Johnson, K.N.; Sessions, J. 1998a. Evaluating the association amongalternative measures of cumulative watershed effects on a forested watershed in east-ern Oregon. Western Journal of Applied Forestry. 13: 15-22.
Bettinger, P.; Lennette, M. 2002. LAndscape Management Policy Simulator (LAMPS),version 1.1 user’s manual. Corvallis, OR: Department of Forest Resources, OregonState University. 97 p.
Bettinger, P.; Sessions, J.; Boston, K. 1997. Using tabu search to schedule timberharvests subject to spatial wildlife goals for big game. Ecological Modeling. 94:111–123.
Bettinger, P.; Sessions, J.; Johnson, K.N. 1998b. Ensuring the compatibility of aquatichabitat and commodity production goals in eastern Oregon with a tabu search proce-dure. Forest Science. 44: 96–112.
Birta, L.G.; Özmizrak, F.N. 1996. A knowledge-based approach for the validation ofsimulation models: the foundation. ACM Transactions of Modeling and ComputerSimulation. 6(1): 76–98.
Boston, K.; Bettinger, P. 2002. Combining tabu search and genetic algorithm heuristictechniques to solve spatial harvest scheduling problems. Forest Science. 48: 35-46.
Brodie, J.D.; Adams, D.; Kao, C. 1978. Analysis of economic impacts on thinning androtation for Douglas-fir, using dynamic programming. Forest Science. 24: 513-522.
Brodie, J.D.; Kao, C. 1979. Optimizing thinning in Douglas-fir with three-descriptordynamic programming to account for accelerated diameter growth. Forest Science.25: 665-672.
Brukas, V.; Brodie, J.D. 1999. Economic optimisation of silvicultural regimes for Scotspine using dynamic programming. Baltic Forestry. 5(1): 28-34.
Buongiorno, J.; Michie, B.R. 1980. A matrix model of uneven-aged forest management.Forest Science. 26: 609-625.
Chen, C.M.; Rose, D.W.; Leary, R.A. 1980a. Derivation of optimal stand density overtime—a discrete stage, continuous state dynamic programming solution. ForestScience. 26: 217-227.
59
Chen, C.M.; Rose, D.W.; Leary, R.A. 1980b. How to formulate and solve optimal standdensity over time problems for even-aged stands using dynamic programming. Gen.Tech. Rep. NC-56. St. Paul, MN: U.S. Department of Agriculture, Forest Service,North Central Research Station. 17 p.
Daust, D.K.; Nelson, J.D. 1993. Spatial reduction factors for strata-based harvestschedules. Forest Science. 39(1): 152-165.
Dowsland, K.A. 1993. Simulated annealing. In: Reeves, C.R., ed. Modern heuristictechniques for combinatorial problems. New York: John Wiley and Sons, Inc.: 20-69.
Dueck, G. 1993. New optimization heuristics: the great deluge algorithm and the record-to-record travel. Journal of Computational Physics. 104: 86-92.
Dueck, G.; Scheuer, T. 1990. Threshold accepting: a general purpose optimization algo-rithm appearing superior to simulated annealing. Journal of Computational Physics.90: 161-175.
Falcão, A.O.; Borges, J.G. 2000. Designing an evolution program for solving integerforest management scheduling models: an application in Portugal. Forest Science.47: 158-168.
Finney, M.A. 1998. FARSITE: Fire Area Simulator–model development and evaluation.Res. Pap. RMRS-RP-4. Ogden, UT: U.S. Department of Agriculture, Forest Service,Rocky Mountain Research Station. 47 p.
Flamm, R.O.; Turner, M.G. 1994. Alternative model formulations for a stochastic simu-lation of landscape change. Landscape Ecology. 9: 37-46.
Franklin, J.F.; Forman, R.T.T. 1987. Creating landscape patterns by forest cutting:ecological consequences and principles. Landscape Ecology. 1: 5-18.
Gao, Q.; Li, J.; Zheng, H. 1996. A dynamic landscape simulation model for the alkalinegrasslands on Songnen Plain in northeast China. Landscape Ecology. 11: 339-349.
Glover, F. 1990. Tabu search–Part II. ORSA Journal of Computing. 2(1): 4-32.
Glover, F.; Laguna, M. 1993. Tabu search. In: Reeves, C.R., ed. Modern heuristic tech-niques for combinatorial problems. New York: John Wiley and Sons, Inc.: 70-150.
Gong, P. 1992. Multiobjective dynamic programming for forest resource management.Forest Ecology and Management. 48: 43-54.
Graetz, D.H. 2000. The SafeD model: incorporating episodic disturbances and heuristicprogramming into forest management planning for the Applegate River watershed,southwestern Oregon. Corvallis, OR: Department of Forest Resources, Oregon StateUniversity. 127 p. M.S. thesis.
Gustafson, E.J.; Crow, T.R. 1994. Modeling the effects of forest harvesting on land-scape structure and the spatial distribution of cowbird brood parasitism. LandscapeEcology. 9: 237-248.
Gustafson, E.J.; Crow, T.R. 1996. Simulating the effects of alternative forest man-agement strategies on landscape structure. Journal of Environmental Management.46: 77-94.

60
Gustafson, E.J.; Shifley, S.R.; Mladenoff, D.J. [et al.]. 2000. Spatial simulation offorest succession and timber harvesting using LANDIS. Canadian Journal of ForestResearch. 30: 32-43.
Haight, R.; Brodie, J.D.; Dahms, W. 1985. A dynamic programming algorithm for opti-mization of lodgepole pine management. Forest Science. 31: 321-330.
Haight, R.; Monserud, R. 1990. Optimizing any-aged management of mixed-speciesstands: II. Effects of decision criteria. Forest Science. 36: 125-144.
Haight, R.G.; Monserud, R.A.; Chew, J.D. 1992. Optimal harvesting with stand densitytargets: managing Rocky Mountain conifer stands for multiple forest outputs. ForestScience. 38: 554-574.
Haight, R.G.; Travis, L.E. 1997. Wildlife conservation planning using stochastic optimi-zation and importance sampling. Forest Science. 43(1): 129-139.
Hemstrom, M.; Ager, A.; Vavra, M. [et al.]. 2004. The application of state and transi-tion models for integrated landscape simulation. In: Hayes, J.L.; Ager, A.A.; Barbour,R.J., tech. eds. Methods for integrating modeling of landscape change: Interior North-west Landscape Analysis System. Gen. Tech. Rep. PNW-GTR-610. Portland, OR:U.S. Department of Agriculture, Forest Service, Pacific Northwest Research Station:17-32. Chapter 2.
Hof, J.G.; Bevers, M.; Joyce, L.; Kent, B. 1994. An integer programming approach forspatially and temporally optimizing wildlife populations. Forest Science. 40: 177-191.
Hof, J.G.; Joyce, L.A. 1992. Spatial optimization for wildlife and timber in managed for-est ecosystems. Forest Science. 38: 489–508.
Hoganson, H.M.; Rose, D. 1984. A simulation approach for optimal timber managementscheduling. Forest Science. 30(1): 220-238.
Holland, J.H. 1975. Adaptation in natural and artificial systems. Ann Arbor, MI: Univer-sity of Michigan Press. [Pages unknown].
Hooke, R.; Jeeves, T.A. 1961. “Direct search” solution of numerical and statistical prob-lems. Journal of the Association for Computing Machinery. 8: 212-229.
Hool, J.N. 1966. A dynamic programming—Markov chain approach to forest productioncontrol. Forest Science Monograph 12. 26 p.
Johnson, K.N.; Jones, D.B.; Kent, B. 1980. A user’s guide to the forest planning model(FORPLAN). Fort Collins, CO: U.S. Department of Agriculture, Forest Service, LandManagement Planning. [Pages unknown].
Johnson, K.N.; Sessions, J.; Franklin, J.; Gabriel, J. 1998. Integrating wildfire intostrategic planning for Sierra Nevada forests. Journal of Forestry. 96(1): 42-49.
Kangas, J.; Pukkala, T. 1996. Operationalization of biological diversity as a decisionobjective in tactical forest planning. Canadian Journal of Forest Research. 26:103-111.
Kao, C.; Brodie, J.D. 1979. Determination of optimal thinning entry interval usingdynamic programming. Forest Science. 25: 672-674.
61
Kao, C.; Brodie, J.D. 1980. Simultaneous optimization of thinnings and rotation withcontinuous stocking and entry intervals. Forest Science. 26: 338-346.
Keane, R.E.; Morgan, P.; Running, S.W. 1996. FIRE-BGC—a mechanistic ecologicalprocess model for simulating fire succession on coniferous forest landscapes of thenorthern Rocky Mountains. Res. Pap. INT-484. Ogden, UT: U.S. Department of Agri-culture, Forest Service, Intermountain Research Station. 122 p.
Li, H.; Franklin, J.F.; Swanson, F.J.; Spies, T.A. 1993. Developing alternative forestcutting patterns: a simulation approach. Landscape Ecology. 8: 63-75.
Lockwood, C.; Moore, T. 1993. Harvest scheduling with spatial constraints: a simu-lated annealing approach. Canadian Journal of Forest Research. 23: 468–478.
Lu, F.; Eriksson, L.O. 2000. Formulation of harvest units with genetic algorithms. ForestEcology and Management. 130: 57-67.
Maguire, D.A. 1994. Branch mortality and potential litterfall from Douglas-fir trees instands of varying density. Forest Ecology and Management. 70: 41-53.
Martin, G.L.; Ek, A.R. 1981. A dynamic programming analysis of silvicultural alterna-tives for red pine plantations in Wisconsin. Canadian Journal of Forest Research.11: 370-379.
McGurk, B.J.; Fong, D.R. 1995. Equivalent roaded area as a measure of cumulativeeffect of logging. Environmental Management. 19: 609-621.
Metropolis, N.; Rosenbluth, A.; Rosenbluth, M. [et al.]. 1953. Equation of state cal-culations by fast computing machines. Journal of Chemical Physics. 21: 1087-1092.
Mladenoff, D.; Baker, W. 1999. Development of forest and landscape modeling ap-proaches. In: Mladenoff, D.; Baker, W., eds. Spatial modeling of forest landscapechange: approaches and applications. Cambridge, United Kingdom: CambridgeUniversity Press: 1-13.
Mladenoff, D.; He, H.S. 1999. Design, behavior and application of LANDIS, an object-oriented model of forest landscape disturbance and succession. In: Mladenoff, D.;Baker, W., eds. Spatial modeling of forest landscape change: approaches and appli-cations. Cambridge, United Kingdom: Cambridge University Press: 125-162.
Mullen, D.S.; Butler, R.M. 1999. The design of a genetic algorithm based spatially con-strained timber harvest scheduling model. In: Seventh symposium on systems analy-sis in forest resources. Gen. Tech. Rep. NC-205. St. Paul, MN: U.S. Department ofAgriculture, Forest Service, North Central Research Station: 57-65.
Murray, A.T.; Church, R.L. 1995. Heuristic solution approaches to operational forestplanning problems. OR Spektrum. 17: 193–203.
National Forest Management Act of 1976 [NFMA]. Act of October 22, 1976:16 U.S.C. 1600.
Navon, D.I. 1971. Timber RAM… a long-range planning method for commercial timberlands under multiple-use management. Res. Pap. PSW-70. Berkeley, CA: U.S. De-partment of Agriculture, Forest Service, Pacific Southwest Research Station. 22 p.

62
Nelson, J.; Brodie, J.D. 1990. Comparison of a random search algorithm and mixedinteger programming for solving area-based forest plans. Canadian Journal of ForestResearch. 20: 934-942.
O’Hara, A.J.; Faaland, B.A.; Bare, B.B. 1989. Spatially constrained timber harvestscheduling. Canadian Journal of Forest Research. 19: 715-724.
Piene, H. 1978. Effects of increased spacing on carbon mineralization rates andtemperature in a stand of young balsam fir. Canadian Journal of Forest Research.8: 398-406.
Pulkki, R. 1984. A spatial database—heuristic programming system for aiding decision-making in long-distance transport of wood. Acta Forestalia Fennica 188. 89 p.
Quigley, T.M.; Haynes, R.W.; Graham, R.T., tech. eds. 1996. Integrated scientificassessment for ecosystem management in the interior Columbia basin and portionsof the Klamath and Great Basins. Gen. Tech. Rep. PNW-GTR-382. Portland, OR:U.S. Department of Agriculture, Forest Service, Pacific Northwest Research Station.303 p.
Quigley, T.M.; Haynes, R.W.; Hann, W.J. 2001. Estimating ecological integrity in theinterior Columbia River basin. Forest Ecology and Management. 153: 161-178.
Reed, W.J.; Errico, D. 1986. Optimal harvest scheduling at the forest level in the pres-ence of fire. Canadian Journal of Forest Research. 16: 266-278.
Roberts, D.; Betz, D. 1999. Simulating landscape vegetation dynamics of BryceCanyon National Park with the vital attributes/fuzzy systems model VAFS/LANDSIM.In: Mladenoff, D.; Baker, W., eds. Advances in spatial modeling of forest landscapechange: approaches and applications. Cambridge, United Kingdom: CambridgeUniversity Press. 99-124.
Sessions, J.; Johnson, K.N.; Franklin, J.F.; Gabriel, J.T. 1999. Achieving sustainableforest structures on fir-prone landscapes while pursuing multiple goals. In: Mladenoff,D.; Baker, W., eds. Spatial modeling of forest landscape change: approaches andapplications. Cambridge, United Kingdom: Cambridge University Press: 210-255.
Srinivas, M.; Patnaik, L.M. 1994. Genetic algorithms: a survey. Computer. (June):17-26.
State of Oregon. 1999. Revised statutes, Chapter 527: insect and disease control;forest practices. http://www.leg.state.or.us/ors/527.html. (January 10, 2002).
Turner, M.G. 1987. Spatial simulation of landscape changes in Georgia: a comparisonof 3 transition models. Landscape Ecology. 1: 29-36.
Valsta, L.T. 1992. A scenario approach to stochastic anticipatory optimization in standmanagement. Forest Science. 38: 430-447.
Valsta, L.T. 1993. Stand management optimization based on growth simulators. Res.Pap. 453. Helsinki, Finland: The Finnish Forest Research Institute, Information Sys-tems Group. 51 p.
63
Wallin, D.O.; Swanson, F.J.; Marks, B. 1994. Landscape pattern response to changesin pattern generation rules: land-use legacies in forestry. Ecological Applications.4: 569-580.
Weintraub, A.; Jones, G.; Magendzo, A. [et al.]. 1994. A heuristic system to solvemixed integer forest planning models. Operations Research. 42: 1010-1024.
Weintraub, A.; Jones, G.; Meacham, M. [et al.]. 1995. Heuristic procedures for solv-ing mixed-integer harvest scheduling–transportation planning models. Canadian Jour-nal of Forest Research. 25: 1618-1626.
Wilson, D.; Maguire, D.; Barbour, J. [In press]. Assessment of the small-diametertimber harvest from restoration treatments in densely-stocked stands on national for-ests in eastern Oregon. Western Journal of Applied Forestry.
Yoshimoto, A.; Haight, R.G.; Brodie, J.D. 1990. A comparison of the pattern searchalgorithm and the modified path algorithm for optimizing an individual tree model. For-est Science. 36: 394-412.
Zhou, G.; Liebhold, A.M. 1995. Forecasting the spatial dynamics of gypsy moth out-breaks using cellular transition models. Landscape Ecology. 10: 177-189.

64
Chapter 5: Assessment Techniques forTerrestrial Vertebrates of ConservationConcern
Barbara C. Wales and Lowell H. Suring1
The quantity and quality of habitat for many wildlife species have changed throughoutthe interior Western United States over the last 150 years owing to a variety of naturaland human-caused disturbances. Results from regional landscape models indicate thatmany species in this region are currently at risk of extirpation. Little is known, however,about how landscape mosaics and patterns of vegetation contribute to the viability ofwildlife populations at finer scales. The increased ability to model vegetation and distur-bances, including insects and fire, allows the opportunity to explore how potentialchanges in vegetation structure and composition may affect wildlife populations at finerscales. We identify methods to describe and evaluate habitat abundance, quality, anddistribution across area and time, considering alternative management goals and as-sumptions at a landscape scale. Landscape simulation modeling results associated witha prototype subbasin in northeastern Oregon will be used to develop a decision-supporttool to help managers and scientists design and schedule management activities thatprovide for conservation and recovery of terrestrial vertebrates.
Keywords: Decision support, habitat modeling, species of concern, wildlife.
In recent work associated with the Interior Columbia Basin Ecosystem ManagementProject (ICBEMP), an approach was developed to evaluate how wildlife habitat for spe-cies of conservation concern is distributed across the interior Columbia basin (Raphaelet al. 2001, Wisdom et al. 2000) (tables 3 and 4). These analyses provided insight intothe abundance, quality, and distribution of habitats and to the status of associated ter-restrial species across the basin. Findings demonstrated large declines in old forests,
Abstract
Introduction
1 Barbara C. Wales is a wildlife biologist, U.S. Department ofAgriculture, Forest Service, Pacific Northwest Research Station,Forestry and Range Sciences Laboratory, 1401 Gekeler Lane,La Grande, OR 97850. Lowell H. Suring is a wildlife ecologist,U.S. Department of Agriculture, Forest Service, Terrestrial WildlifeUnit, Forestry Sciences Laboratory, 316 East Myrtle Street, Boise,ID 83702.
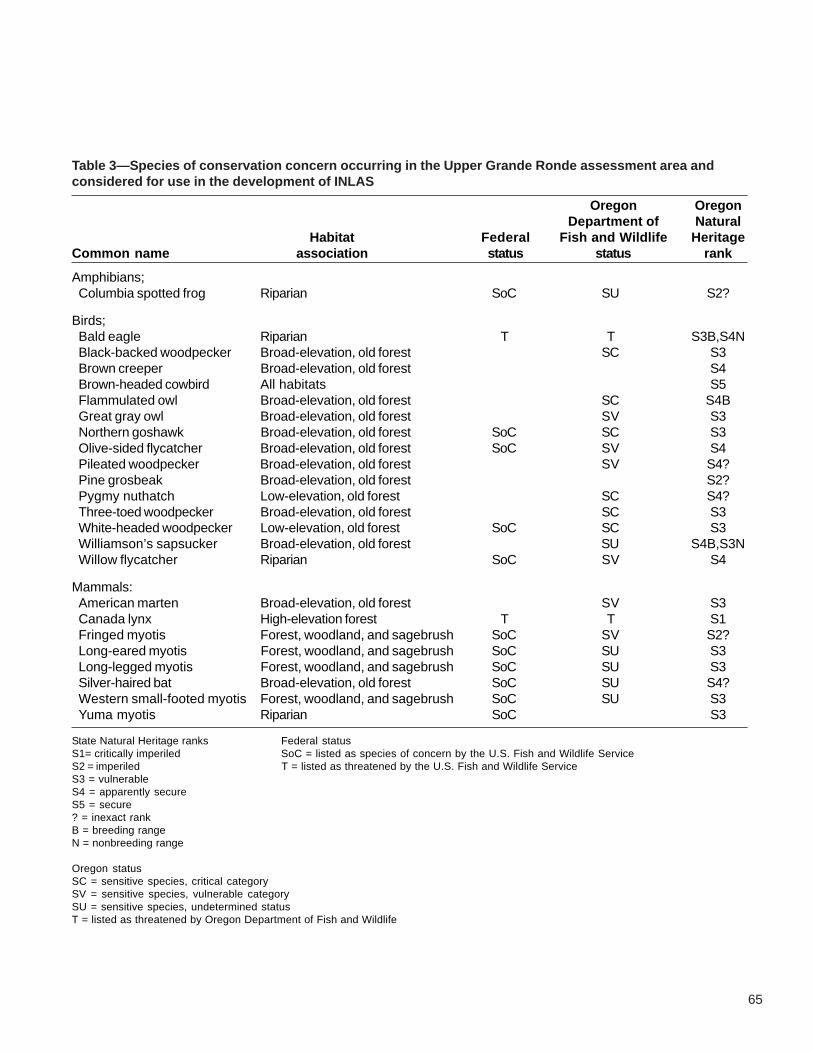
65
Table 3—Species of conservation concern occurring in the Upper Grande Ronde assessment area andconsidered for use in the development of INLAS
Oregon OregonDepartment of Natural
Habitat Federal Fish and Wildlife HeritageCommon name association status status rank
Amphibians;Columbia spotted frog Riparian SoC SU S2?
Birds;Bald eagle Riparian T T S3B,S4NBlack-backed woodpecker Broad-elevation, old forest SC S3Brown creeper Broad-elevation, old forest S4Brown-headed cowbird All habitats S5Flammulated owl Broad-elevation, old forest SC S4BGreat gray owl Broad-elevation, old forest SV S3Northern goshawk Broad-elevation, old forest SoC SC S3Olive-sided flycatcher Broad-elevation, old forest SoC SV S4Pileated woodpecker Broad-elevation, old forest SV S4?Pine grosbeak Broad-elevation, old forest S2?Pygmy nuthatch Low-elevation, old forest SC S4?Three-toed woodpecker Broad-elevation, old forest SC S3White-headed woodpecker Low-elevation, old forest SoC SC S3Williamson’s sapsucker Broad-elevation, old forest SU S4B,S3NWillow flycatcher Riparian SoC SV S4
Mammals:American marten Broad-elevation, old forest SV S3Canada lynx High-elevation forest T T S1Fringed myotis Forest, woodland, and sagebrush SoC SV S2?Long-eared myotis Forest, woodland, and sagebrush SoC SU S3Long-legged myotis Forest, woodland, and sagebrush SoC SU S3Silver-haired bat Broad-elevation, old forest SoC SU S4?Western small-footed myotis Forest, woodland, and sagebrush SoC SU S3Yuma myotis Riparian SoC S3
State Natural Heritage ranks Federal statusS1= critically imperiled SoC = listed as species of concern by the U.S. Fish and Wildlife ServiceS2 = imperiled T = listed as threatened by the U.S. Fish and Wildlife ServiceS3 = vulnerableS4 = apparently secureS5 = secure? = inexact rankB = breeding rangeN = nonbreeding range
Oregon statusSC = sensitive species, critical categorySV = sensitive species, vulnerable categorySU = sensitive species, undetermined statusT = listed as threatened by Oregon Department of Fish and Wildlife
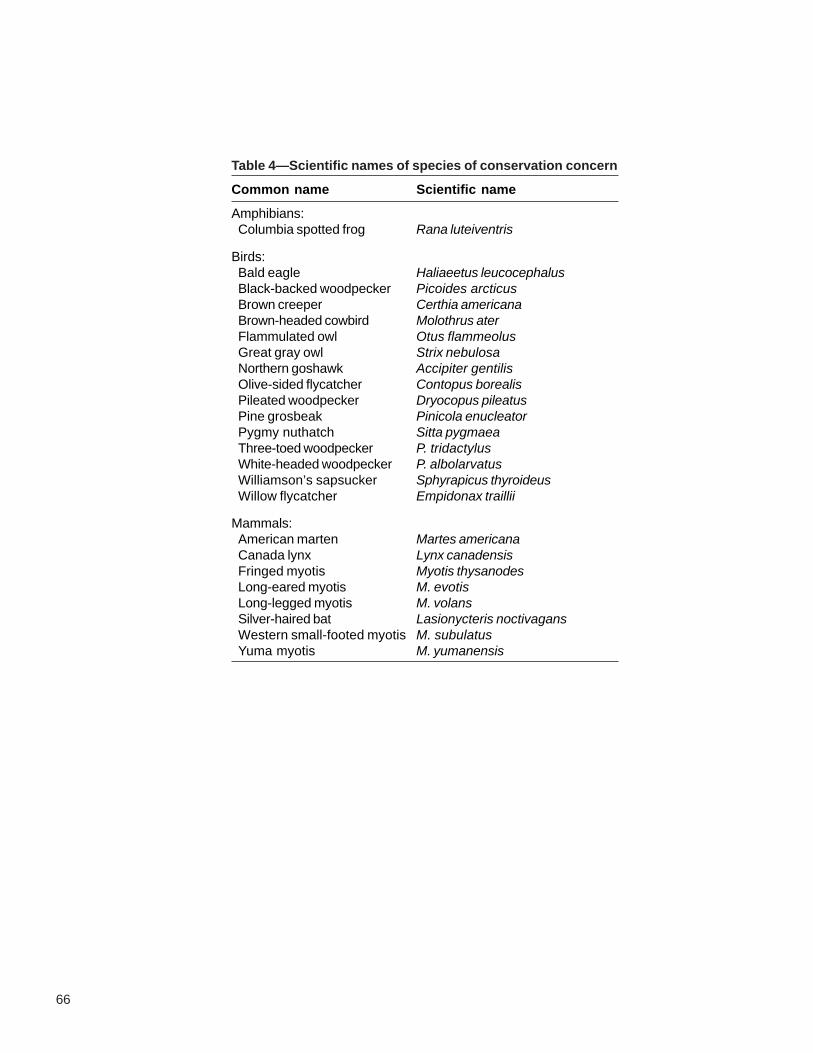
66
Table 4—Scientific names of species of conservation concern
Common name Scientific name
Amphibians:Columbia spotted frog Rana luteiventris
Birds:Bald eagle Haliaeetus leucocephalusBlack-backed woodpecker Picoides arcticusBrown creeper Certhia americanaBrown-headed cowbird Molothrus aterFlammulated owl Otus flammeolusGreat gray owl Strix nebulosaNorthern goshawk Accipiter gentilisOlive-sided flycatcher Contopus borealisPileated woodpecker Dryocopus pileatusPine grosbeak Pinicola enucleatorPygmy nuthatch Sitta pygmaeaThree-toed woodpecker P. tridactylusWhite-headed woodpecker P. albolarvatusWilliamson’s sapsucker Sphyrapicus thyroideusWillow flycatcher Empidonax traillii
Mammals:American marten Martes americanaCanada lynx Lynx canadensisFringed myotis Myotis thysanodesLong-eared myotis M. evotisLong-legged myotis M. volansSilver-haired bat Lasionycteris noctivagansWestern small-footed myotis M. subulatusYuma myotis M. yumanensis
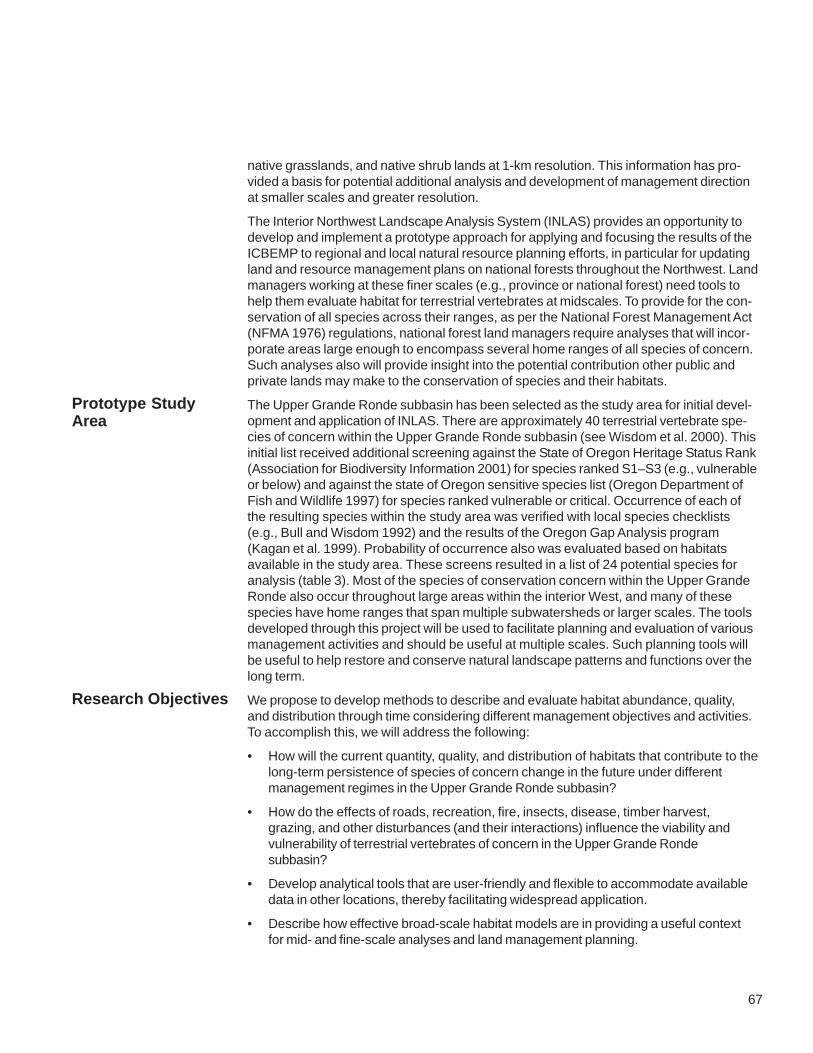
67
native grasslands, and native shrub lands at 1-km resolution. This information has pro-vided a basis for potential additional analysis and development of management directionat smaller scales and greater resolution.
The Interior Northwest Landscape Analysis System (INLAS) provides an opportunity todevelop and implement a prototype approach for applying and focusing the results of theICBEMP to regional and local natural resource planning efforts, in particular for updatingland and resource management plans on national forests throughout the Northwest. Landmanagers working at these finer scales (e.g., province or national forest) need tools tohelp them evaluate habitat for terrestrial vertebrates at midscales. To provide for the con-servation of all species across their ranges, as per the National Forest Management Act(NFMA 1976) regulations, national forest land managers require analyses that will incor-porate areas large enough to encompass several home ranges of all species of concern.Such analyses also will provide insight into the potential contribution other public andprivate lands may make to the conservation of species and their habitats.
The Upper Grande Ronde subbasin has been selected as the study area for initial devel-opment and application of INLAS. There are approximately 40 terrestrial vertebrate spe-cies of concern within the Upper Grande Ronde subbasin (see Wisdom et al. 2000). Thisinitial list received additional screening against the State of Oregon Heritage Status Rank(Association for Biodiversity Information 2001) for species ranked S1–S3 (e.g., vulnerableor below) and against the state of Oregon sensitive species list (Oregon Department ofFish and Wildlife 1997) for species ranked vulnerable or critical. Occurrence of each ofthe resulting species within the study area was verified with local species checklists(e.g., Bull and Wisdom 1992) and the results of the Oregon Gap Analysis program(Kagan et al. 1999). Probability of occurrence also was evaluated based on habitatsavailable in the study area. These screens resulted in a list of 24 potential species foranalysis (table 3). Most of the species of conservation concern within the Upper GrandeRonde also occur throughout large areas within the interior West, and many of thesespecies have home ranges that span multiple subwatersheds or larger scales. The toolsdeveloped through this project will be used to facilitate planning and evaluation of variousmanagement activities and should be useful at multiple scales. Such planning tools willbe useful to help restore and conserve natural landscape patterns and functions over thelong term.
We propose to develop methods to describe and evaluate habitat abundance, quality,and distribution through time considering different management objectives and activities.To accomplish this, we will address the following:
• How will the current quantity, quality, and distribution of habitats that contribute to thelong-term persistence of species of concern change in the future under differentmanagement regimes in the Upper Grande Ronde subbasin?
• How do the effects of roads, recreation, fire, insects, disease, timber harvest,grazing, and other disturbances (and their interactions) influence the viability andvulnerability of terrestrial vertebrates of concern in the Upper Grande Rondesubbasin?
• Develop analytical tools that are user-friendly and flexible to accommodate availabledata in other locations, thereby facilitating widespread application.
• Describe how effective broad-scale habitat models are in providing a useful contextfor mid- and fine-scale analyses and land management planning.
Prototype StudyArea
Research Objectives
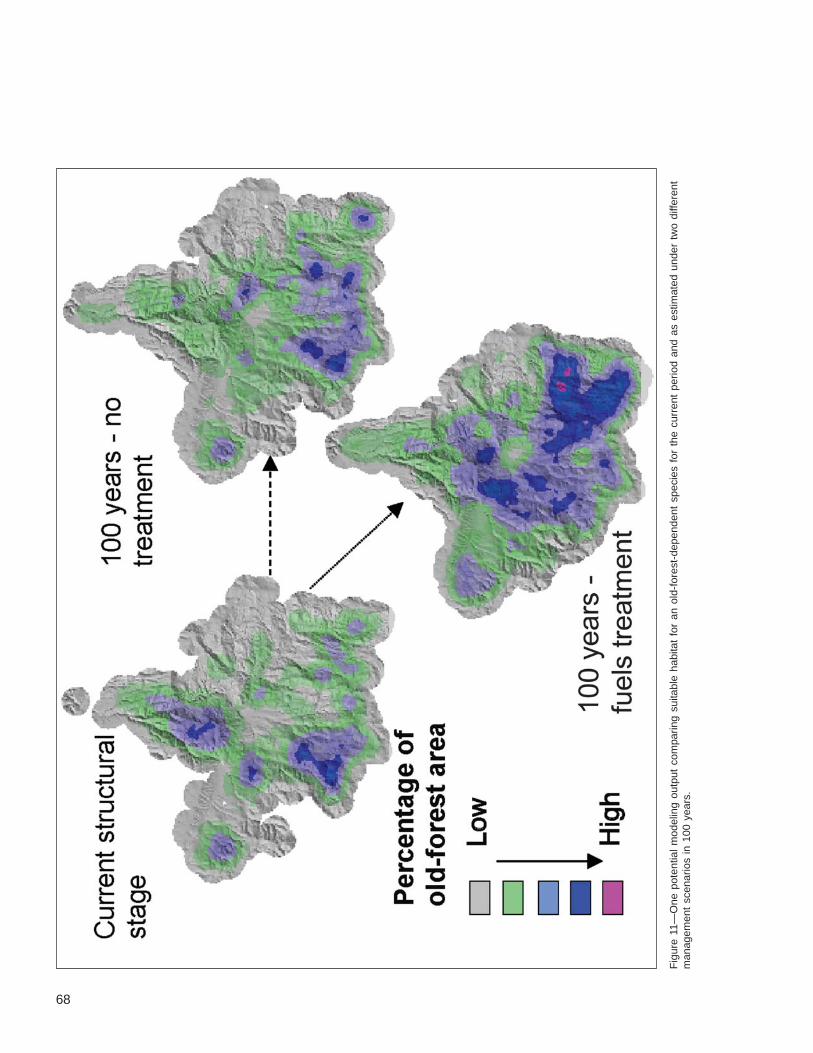
68
Fig
ure
11—
One
pot
entia
l m
odel
ing
outp
ut c
ompa
ring
suita
ble
habi
tat
for
an o
ld-f
ores
t-de
pend
ent
spec
ies
for
the
curr
ent
perio
d an
d as
est
imat
ed u
nder
tw
o di
ffere
ntm
anag
emen
t sc
enar
ios
in 1
00 y
ears
.
69
Evaluating landscape change may be more important than current landscape structure indeveloping an understanding of long-term population dynamics of terrestrial vertebrates(Dunn et al. 1991, Knick and Rotenberry 2000). By using a combination of geographicinformation system spatial modeling and decision-support models (DSMs), we will evalu-ate changes in wildlife habitat under different management regimes through time as wellas develop assessment processes for wildlife species at a subbasin scale. Figure 11displays how one potential output might look comparing two different management sce-narios through time. We will explore the use of Bayesian belief networks (BBNs), a typeof DSM, as well as other more traditional modeling techniques such as habitat suitabilityindex models. See Wondzell and Howell (Chapter 6) for more discussion regarding theuse of DSMs.
Bayesian modeling is just one of numerous types of wildlife habitat modeling that cancalculate an index of population response.2 It can provide a modeling approach that (1)displays major influences on the persistence of wildlife populations and their values andinteractions, (2) combines categorical and continuous variables, (3) combines empiricaldata with expert judgment, often from multiple experts; and (4) expresses predicted out-comes as likelihoods as a basis for risk analysis and risk management (Marcot et al.2001). The models can rely on outputs from other models, such as projected vegeta-tion, to estimate the amount of habitat available, and other environmental factors, toestimate the quality of habitat (Raphael et al. 2001). It is likely models will be developedat two scales, site-specific and subbasin, which will be hierarchically nested. The site-specific model will estimate habitat quantity and quality at the scale of a pixel (or stand),whereas the subbasin model will summarize those results to assess the overall condi-tions within a subbasin. Figure 12 shows an example of a site-specific belief networkmodified from the work of Raphael et al. (2001). Within the subbasin model, it is possibleto assess the connectivity of hiqh-quality habitats, another important aspect for somewildlife species.
The wildlife models will rely heavily on the outcomes of the vegetation modeling de-scribed by Hemstrom et al. (Chapter 2) and Bettinger et al. (Chapter 4). Many of thespecies of concern in our study area are dependent on snags and coarse woody debris(CWD). Because insects, disease, and fire are imbedded in the vegetation modelingefforts, snags will be addressed. We will develop methods to quantify snag and CWDdevelopment within the vegetation models. In addition, a companion project in the samestudy area will be developing landscape models to predict snag and CWD densities inrelation to vegetation type and landscape characteristics, such as distance to nearestroads and towns, elevation, and slope, which we will build into our habitat models (Bateand Wisdom 2001). We also will be working to develop close links with other resourcemodules such as recreation, social, and riparian. Although little empirical data exist onspecies distribution across the subbasin, we will use any available data to help build themodels and use existing models such as those developed by McGrath et al. (2003),Sallabanks et al. (2002), and Roloff and Haufler (1997) (also footnote 2). Our knowledgeon species environmental requirements and population dynamics differs widely per spe-cies, so some models will be better developed than others.
2 Roloff, G.J. 2001. Breeding habitat potential model for northerngoshawks in the Idaho Southern Batholith. [Pages unknown].Unpublished document. On file with: Timberland Resources, BoiseCascade Corporation, 1564 Tomlinson Road, Mason, MI 48854.
Methods

70
The performance of BBN models, as well as alternative approaches to BBN models,also may be evaluated where alternative models exist that are compatible with vegeta-tion data generated by the INLAS base models (e.g., Hemstrom et al. Chapter 2 andBettinger et al. Chapter 4). Performance of BBN and other models may be evaluated invarious ways, including the use of Bayesian statistics (Lee 2000), or through other analy-ses of model predictions versus empirical observations (Rowland et al. 2003, Wisdom etal. 2002). Tests of model performance will provide an opportunity to explore how differentprocedures for modeling wildlife habitat compare in terms of their results, veracity, andcompatibility with INLAS models for other resources. In addition, the models developedduring this analysis will be evaluated through a companion project to be conducted in thestudy area by scientists from the University of Idaho, which will provide information indeveloping a final set of user-friendly models.
Figure 12—Example of a Bayesian belief network model adapted from Raphael et al. (2001). This example was used to quantify habitat qualityand quantity within a subwatershed for pygmy nuthatch.
71
As a result of this work, we will provide prototype decision-support models that can beused to describe the amount, distribution, and quality of habitat for terrestrial vertebratesthroughout the interior West. These analytical tools will help managers and scientistsdesign and schedule management activities that will provide for the conservation of ter-restrial species at a landscape scale through time. We will apply this prototype to theUpper Grande Ronde subbasin. The models we build will give a relative index to habitatquality or species persistence, depending on the scale.
M. Wisdom, R. Riggs, and G. Roloff provided comments on the manuscript.
When you know: Multiply by: To get:
Kilometers (km) 0.06125 Miles
Association for Biodiversity Information. 2001. NatureServe: an online encyclopediaof life (Web application), version 1.4. Arlington, VA. http://www.natureserve.org/.(July 6).
Bate, L.J.; Wisdom, M.J. 2001. Pre-proposal to investigate snag-log-road relationsat stand and landscape scales in the interior Columbia basin. Portland, OR: U.S.Department of Agriculture, Forest Service, Pacific Northwest Research Station.Onfile with: Michael Wisdom, USDA Forest Service, Forestry and Range SciencesLaboratory, 1401 Gekeler Lane, La Grande, OR 97850.
Bettinger, P.; Graetz, D.; Ager, A.A.; Sessions, J. 2004. The SafeD forest landscapeplanning model. In: Hayes, J.L.; Ager, A.A.; Barbour, R.J., tech. eds. Methods forintegrating modeling of landscape change: Interior Northwest Landscape AnalysisSystem. Gen. Tech. Rep. PNW-GTR-610. Portland, OR: U.S. Department of Agricul-ture, Forest Service, Pacific Northwest Research Station: 41-63. Chapter 4.
Bull, E.L.; Wisdom, M.J. 1992. Fauna of the Starkey Experimental Forest and Range.Gen. Tech. Rep. PNW-GTR-291. Portland, OR: U.S. Department of Agriculture, ForestService, Pacific Northwest Research Station. [Not paged].
Dunn, C.P.; Sharpe, D.M.; Guntenspergen, G.R. [et al.]. 1991. Methods for analyzingtemporal changes in landscape pattern. In: Turner, M.G.; Gardner, R.H., eds. Quanti-tative methods in landscape ecology: the analysis and interpretation of landscapeheterogeneity. New York: Springer-Verlag: 173-198.
Hemstrom, M.; Ager, A.A.; Vavra, M. [et al.]. 2004. State and transition approach forintegrating landscape models. In: Hayes, J.L.; Ager, A.A.; Barbour, R.J., tech. eds.Methods for integrating modeling of landscape change: Interior Northwest LandscapeAnalysis System. Gen. Tech. Rep. PNW-GTR-610. Portland, OR: U.S. Department ofAgriculture, Forest Service, Pacific Northwest Research Station: 17-32. Chapter 2.
Kagan, J.S.; Hak, J.C.; Csuti, B. [et al.]. 1999. Oregon Gap Analysis Project final re-port: a geographic approach to planning for biological diversity. Portland, OR: OregonNatural Heritage Program. 72 p.
Knick, S.T.; Rotenberry, J.T. 2000. Ghosts of habitat past: contribution of landscapechange to current habitats used by shrubland birds. Ecology. 81: 220-227.
Lee, D. 2000. Assessing land-use impacts on bull trout using Bayesian belief networks.In: Ferson, S.; Burgman, M., eds. Quantitative methods for conservation biology. NewYork: Springer: 127-147.
Literature Cited
Products andAudience
Acknowledgments
English Equivalent

72
Marcot, B.G.; Holthausen, R.S.; Raphael, M.G. [et al.]. 2001. Using Bayesian beliefnetworks to evaluate fish and wildlife population viability under land management alter-natives from an environmental impact statement. Forest Ecology and Management.153: 29-42.
McGrath, M.T.; DeStefano, S.; Riggs, R.A. [et al.]. 2003. Spatially explicit influenceson northern goshawk nesting habitat in the interior Pacific Northwest. Wildlife Mono-graphs. 154. 63 p.
National Forest Management Act of 1976 [NFMA]. Act of October 22, 1976; 16U.S.C. 1600.
Oregon Department of Fish and Wildlife. 1997. Sensitive species. Portland, OR. 9 p.
Raphael, M.G.; Wisdom, M.J.; Rowland, M.M. [et al.]. 2001. Status and trendsof habitats of terrestrial vertebrates in relation to land management in the InteriorColumbia River basin. Forest Ecology and Management. 153: 63-87.
Roloff, G.J.; Haufler, J.B. 1997. Establishing population viability planning objectivesbased on habitat potentials. Wildlife Society Bulletin. 25: 895-904.
Roloff, G.J.; Wilhere, G.F.; Quinn, T.; Kohlmann, S. 2001. An overview of models andtheir role in wildlife management. In: Johnson, D.H.; O’Neil, T.A., eds. Wildlife-habitatrelationships in Oregon and Washington. Corvallis, OR: Oregon State UniversityPress: 512-536.
Rowland, M.M.; Wisdom, M.J.; Johnson, D.H. [et al.]. 2003. Evaluation of landscapemodels for wolverine in the interior Northwest U.S.A. Journal of Mammalogy. 84(1):92-105.
Sallabanks, R.; Riggs, R.A.; Cobb, L.E. 2002. Bird use of forest structural classes ingrand fir forests of the Blue Mountains, Oregon. Forest Science. 48(2): 311-322.
Wisdom, M.J.; Holthausen, R.S.; Wales, B.C. [et al.]. 2000. Source habitats for ter-restrial vertebrates of focus in the interior Columbia basin: broad-scale trends andmanagement implications. Gen. Tech. Rep. PNW-GTR-485. Portland, OR: U.S.Department of Agriculture, Forest Service, Pacific Northwest Research Station. 3 vol.1119 p. (Quigley, T.M., tech. ed. Interior Columbia Basin Ecosystem ManagementProject: scientific assessment).
Wisdom, M.J.; Wales, B.C.; Rowland, M.M. [et al.]. 2002. Performance of greatersage-grouse models for conservation assessment in the Interior Columbia basin,USA. Conservation Biology. 16: 1232-1242.
Wondzell, S.; Howell, P. 2004. Developing a decision-support model for assessingcondition and prioritizing the restoration of aquatic habitat in the interior Columbiabasin. In: Hayes, J.L.; Ager, A.A.; Barbour, R.J., tech. eds. Methods for integratingmodeling of landscape change: Interior Northwest Landscape Analysis System. Gen.Tech. Rep. PNW-GTR-610. Portland, OR: U.S. Department of Agriculture, Forest Ser-vice, Pacific Northwest Research Station: 73-81. Chapter 6.
73
Chapter 6: Developing a Decision-SupportModel for Assessing Condition and Prioritizingthe Restoration of Aquatic Habitat in theInterior Columbia Basin
Steven M. Wondzell and Philip J. Howell1
The INLAS Aquatic Module is part of the larger Interior Northwest Landscape AnalysisSystem (INLAS)—a multidisciplinary effort to develop midscale analytical tools to projectsuccession and disturbance dynamics across landscapes in the interior Northwest.These tools are intended to be used to examine change in ecological and socioeco-nomic systems under various policy or management options (Barbour et al. Chapter 1).For the Aquatics Module, we are developing tools to assess midscale aquatic habitat inthe context of the biophysical characteristics of streams and watersheds and landscape-scale processes, including natural disturbances such as fire, and alternative manage-ment scenarios. We will apply these analytical tools to a demonstration area (the UpperGrande Ronde River subbasin), where we will assess factors influencing conditions ofaquatic habitat and water quality and evaluate the potential cumulative effects of alterna-tive management scenarios on aquatic habitat, hydrology, and erosion. The tools we aredeveloping are intended to help natural resource specialists and managers define thetypes of management most likely to be compatible with guidelines for aquatic speciesand their habitat and management objectives for other resources.
Keywords: Decision-support models, aquatic habitat, water quality, salmon, steelhead,bull trout, alternative management scenarios.
Chinook salmon (Oncorhynchus tshawytscha) (Walbaum), steelhead (O. mykiss [for-merly Salmo gairdneri Richardson), and bull trout (Salvelinus confluentus (Suckley))have been eliminated from much of their historical range and are now listed as threat-
Abstract
Introduction
1 Steven M. Wondzell is a research aquatic ecologist, U.S.Department of Agriculture, Forest Service, Pacific NorthwestResearch Station, Forest Sciences Laboratory, 3625 93rd Ave.,Olympia, WA 98512. Philip J. Howell is a fisheries biologist, U.S.Department of Agriculture, Forest Service, Pacific NorthwestRegion, 1401 Gekeler Lane, La Grande, OR 97850.
74
ened or endangered within most of the interior Columbia River basin (USDA and USDI2000). Other native fishes also have declined (Lee et al. 1997). Many factors have con-tributed to declines, including (1) overharvest; (2) blocked access and increased mortal-ity of migrating fish from dams; (3) interactions between wild fish and hatchery stocks,which appear to impair fitness of wild stocks; and (4) degradation of spawning and rear-ing habitat (Federal Caucus 2000). Degraded water quality is closely linked to issuessurrounding degraded spawning and rearing habitat. Thousands of miles of streamsthroughout the Columbia River basin, including the Upper Grande Ronde subbasin(Grande Ronde Water Quality Committee 2000), have been listed as impaired by thestates under section 303d of the Clean Water Act for failing to meet water quality stan-dards (Lee et al. 1997). Streams in USDA Forest Service (USDA FS) ownership are mostcommonly listed for failure to meet standards for sediment/siltation/turbidity, water tem-perature, and flow (Lee et al. 1997).
The USDA FS and other federal agencies, including National Marine and Fisheries Ser-vice (NMFS), U.S. Fish and Wildlife Service (USF&WS), and USDI Bureau of Land Man-agement (BLM) have been developing broad-scale approaches to address aquatic andother land management issues within the region (FCRPS Biological Opinion 2000, Fed-eral Caucus 2000, USDA and USDI 2000). These broad-scale plans recognize the impor-tance of maintaining existing high-quality habitat in tributaries of the Columbia basin andrestoring habitat that is currently degraded.
The success of broad-scale management depends on the ability of natural resource spe-cialists to convert broad-scale management direction into mid- and fine-scale manage-ment practices. To do this, natural resource specialists, managers, and planners mustbe informed as to the nature and extent of potential impacts resulting from current man-agement practices and proposed changes in those practices (Rieman et al. 2001). Spe-cifically, natural resource specialists need to be able to assess (1) the ability of a stream(or watershed) to support species of interest and other desired resource values, (2) thecurrent condition, and (3) the potential impacts of management decisions on future con-ditions. Managers and planners must be able to use this information to determine thetype and location of management activities most likely to meet desired objectives andto prioritize these activities on the basis of multiple and sometimes conflicting objectives.
Management actions occur in systems with high natural variability and that have beenaltered by a number of historical and current land and water management practices.Thus, predictions of the potential effects of management actions are fraught with uncer-tainty associated with the ecological responses and the complexity of multiple man-agement objectives and strategies under consideration (Rieman et al. 2001). To aidevaluations, land managers in the inland Northwest need tools that formalize these com-plex relationships into a common framework that describes aquatic habitat in the contextof landscape processes and conditions, potential effects of management actions, andsources of uncertainty. There are currently no analytical tools available that provide man-agers the ability to assess conditions of aquatic habitats at mid to fine scales (i.e., 4th to6th hydrologic unit codes or HUCs) in a landscape context and to analyze potential cu-mulative effects of management decisions, including forest harvest, fuels reduction, her-bivory, and riparian management, on aquatic species and their habitats.
The goal of the proposed research is to develop a decision-support tool to help informmanagement decisions at midscales. The proposed research is guided by four primaryquestions:

75
• How have changes in landscape processes, such as fire, over the last 100 to 150years affected aquatic habitat and populations of aquatic species?
• What and where are the principal opportunities to maintain and restore aquaticspecies and water quality?
• What are the cumulative effects of alternative management approaches on aquatichabitat and water quality?
• How can stream restoration opportunities be better integrated with management forother resources?
A variety of modeling approaches are available to address the questions we pose above.Below, we briefly review these modeling approaches and evaluate their suitability for thisproject.
Existing tools are unable to adequately address the questions listed above for variousreasons. First, many models are narrowly focused and thus do not include other factorsthat are likely to influence aquatic and riparian habitat. For example, the Stream Seg-ment Temperature Model (SSTemp) (USGS 1999) is typical of reach-scale temperaturemodels that calculate shading/sun exposure to the stream surface and use temperatureand volume of water flowing into a reach to estimate a new temperature at the bottom ofa reach. These models reliably predict the effect of site-scale modifications on streamtemperatures within relatively short stream reaches. However, they are not designed toanalyze temperature changes within entire stream networks. Secondly, most existingmodels have been designed to answer questions at different scales. For example, theaquatic-effects analysis model developed for the interior Columbia basin (Rieman et al.2001) operates at too coarse a scale, whereas models such as SSTemp work at too finea scale for subbasin planning. Thirdly, most mechanistic models are too complex, requir-ing extensive data and a high degree of expertise to run and analyze, both of which arefrequently not available. Examples of these models include network-scale stream-tem-perature models such as SNTemp (USGS 2000) or distributed hydrology models, suchas the Distributed Hydrology Soil Vegetation Model (DHSVM) (Wigmosta et al. 1994).The DHSVM, e.g., is designed to predict event-based stream discharges and annualwater yield at watershed scales but requires detailed inputs of soil and topographic char-acteristics and is driven by spatially distributed energy and precipitation budgets. TheDHSVM would need to be calibrated to match observed hydrographs and then validatedby predicting hydrographs for a different series of storms or a different watershed. How-ever, it would usually be difficult to obtain local calibration data, and the calibrated modelwill not be readily transferable to other watersheds. Fourthly, most existing models lackfollowup support for technology transfer to agency management units to help naturalresource specialists parameterize the models to local conditions and then run the mod-els. Finally, only a few empirical models have been developed for the interior West thatrelate landscape variables and processes to aquatic habitat or species because theempirical basis for these relationships is limited. All these factors limit the use of com-plex, mechanistic models as planning tools that can be applied to subbasins across theentire Columbia River basin.
Each of the models described above offers some utility toward analyzing a specific prob-lem related to land management practices and their effect on aquatic habitat. None ofthese models, however, attempts to link landscape processes and the range of land
Mechanistic Models
Review of AlternativeModelingApproaches
76
management practices to cumulative effects on either habitat capacity or water quality.We do not know of a linked series of models that would enable a user to simultaneouslyexamine multiple, midscale land management issues and their effect on aquatic habitatcapacity and water quality.
Recently, several models (for example, the Ecosystem Diagnosis and Treatment [EDT]Method, the Plan for Analyzing and Testing Hypotheses [PATH], and the Cumulative RiskInitiative [CRI]) have been developed to help inform decisions related to salmon manage-ment in the Columbia River basin. The EDT model (Mobrand Biometrics 1999) was de-signed to compare effects of alternative strategies for managing hatcheries, hydropower,and harvest. The EDT model was designed to be a comprehensive model, accounting forspatial and temporal interactions between habitat conditions, competition, and predation,and projecting cumulative effects (ISAB 2001). Consequently, the model is relativelycomplex, requiring qualitative and quantitative habitat information about species, whichare represented as a set of rules relating survival to habitat conditions. The model is finescale, utilizing habitat information at the 6th HUC (HUC6 level) and some 40 habitat pa-rameters (ISAB 2001). The EDT model will be required in future subbasin assessmentsin the Columbia River basin, and work is currently underway to integrate EDT into abroader assessment framework to evaluate fish and wildlife species across aquatic, ri-parian, and terrestrial environments (Marcot et al. 2002). Although EDT is a habitat-based model, it was not designed to link instream features to processes occurring inupland areas—processes such as fire and other natural disturbances or land manage-ment activities such as harvest or grazing. Also, EDT does not directly assess uncer-tainty in predicted outcomes, and because the model is complex, it is difficult toground-truth all input data and to review or edit rules linking habitat to the survival of fishspecies (ISAB 2001). These factors would make EDT difficult to use in INLAS.
The PATH and CRI models are statistical modeling approaches focused on populationdynamics of anadromous salmonids. The PATH model (Marmorek et al. 1998) was de-signed to examine Snake River listed salmon and steelhead and to evaluate manage-ment options for these species as affected by survival in specific life stages. The model’smain focus is the survival of fish migrating through the mainstem river corridor and theinfluence of variations in the management and operation of the hydropower system onfish survival. The CRI model statistically examines the survival of fish in freshwater habi-tats as one generalized component of the overall extinction risk for all listed anadromoussalmonids in the Columbia River basin (CRI 2000). However, CRI does not link survival tospecific habitat attributes nor does it consider how habitat might change under differentmanagement scenarios. These factors make PATH and CRI unsuitable for use in INLAS.
Decision-support models (DSMs) are based on decision analysis and provide possiblealternatives to the more traditional modeling approaches described above. Decisionanalysis can be broadly divided into two components: (1) risk analysis and (2) riskmanagement. Risk analysis is the process of identifying the results of alternative deci-sions. Thus, risk analysis can help natural resource specialists examine the expectedeffects of different management strategies (Varis and Kuikka 1999). Further, becauserisk analysis uses explicit, quantitative methods to examine uncertainty (Clemen 1996),risk analysis can be used to assess the influence of various sources of uncertainty (e.g.,variability) on the probability of achieving specific outcomes given a particular decision.Additionally, risk analysis can be used to estimate the value of additional information(e.g., monitoring, watershed analysis). Risk analysis, however, cannot choose the “best”
Decision-Support Models
Expert System, ExpertEvaluation, andStatistical Models
77
management strategy. Risk management is the process of assessing the value of pos-sible outcomes. A formal risk management plan requires that decisionmakers (i.e., man-agers) define their attitudes about risks and assign quantifiable values (e.g., an econo-mic cost or a societal benefit) to each possible outcome identified in the risk analysis.
The use of DSMs to conduct risk analysis for the INLAS aquatic module offers severalspecific advantages that meet our modeling needs. The DSMs can:
• Provide a quantitative framework to describe the current understanding of thecomplex interrelationships between landscape properties and aquatic habitat, toexplicitly define these relationships within the model structure, and then to test theinfluence of each variable on expected outcomes.
• Use outputs from other models (e.g., the projected changes in vegetation, fireseverity and extent, management activities, and other variables from other INLASmodules) to project changes in aquatic habitat units at selected points in time.
• Use expert opinion to parameterize input variables when empirical data are lacking.Additionally, the influence of those opinions and the underlying assumptions areexplicit and consistent within the model. The model is transparent in that key as-sumptions and the values of all variables, including those based on expert opinion,are displayed.
• Incorporate empirical data, mechanistic models, meta-analyses, and subjectiveprobabilities from experts into a single model, integrate information from severaldisciplines, and use that information to analyze alternative management scenarios.
• Be used to test effects of alternative assumptions on outcomes.
• Determine the relative contribution of each variable to model outcomes throughsensitivity analysis of model variables.
At least two DSMs have been developed and are currently in use in the Pacific North-west and interior Columbia basin. The Ecosystem Management Decision Support Sys-tem (EMDS) (Reynolds 1999, Reynolds et al. 2000), developed by the Pacific NorthwestResearch Station, is a fuzzy logic rule-based model providing decision-support tools forlandscape analysis and restoration priority setting. However, the aquatic applications todate have primarily focused on disturbance from landslides and debris flows, rather thanfire, in basins west of the Cascade Range. Further, current applications of EMDS aredriven primarily by inchannel variables, such as large wood and pools, rather than uplandcharacteristics and management activities. Aquatic applications also have not been inte-grated with other resource areas (e.g., vegetation management, terrestrial species).
A Bayesian belief network (BBN) model was developed for the aquatic effects analysisof management alternatives proposed in the environmental impact statement for the inte-rior Columbia basin (Rieman et al. 2001). This model has been used to evaluate broad-scale effects of federal land management alternatives on aquatic habitat and species forthe interior Columbia basin. However, the model is designed for broad-scale analyses ofInterior Columbia Basin Ecosystem Management Project (ICBEMP) management alter-natives. Also, the model does not directly examine the effects of specific managementpractices. Rather it uses measures of management activity, such as road density, to

78
project habitat condition over large spatial scales. Although neither the existing versionsof EMDS nor the ICBEMP BBN model are sufficient to meet our objectives, they areexamples of the types of DSMs most likely to meet the modeling needs identified above.
We will develop a DSM to evaluate the effects of alternative land-management scenarioson salmonid habitat at the subbasin scale within the interior Columbia basin. The workdescribed here is focused on risk analysis. Objectives include:
• Develop midscale analytic tools to:
• Assess aquatic habitat condition in the context of the biophysical characteristicsof streams and watersheds and landscape-scale processes.
• Compare potential cumulative effects of alternative management scenarios onaquatic habitat.
• Help define where and what types of land and water management treatmentsmay be most compatible with aquatic habitat considerations (e.g., key habitatsand limitations of species, sensitive soils, existing roads).
• Develop analytic tools that can incorporate new information to resolve keyuncertainties in an adaptive management framework.
• Develop analytic tools that are spatially explicit (i.e., can analyze and reportinformation at various fine and mid scales),
• Develop analytic tools that are sufficiently flexible to accommodate a variety ofavailable data and that facilitate widespread application,
• Complement other existing midscale aquatic analytic tools (EDT and EMDS).
The initial phase of decision-model development will be to identify the decision con-text(s), responses to be modeled and management alternatives. Decision modelswill then be structured specifically to address each decision situation and to link withother INLAS modules. Conditional dependencies will be parameterized by using the ex-isting data from the region and data gathered from published studies via meta-analysis(Gelman et al. 1995). Where empirical data or other model output are lacking, expertopinion will be solicited from a panel of species and habitat experts and used to param-eterize variables included in the models (Morgan and Henrion 1990). To explicitly incor-porate uncertainty, relationships between environmental variables and habitat capacitywill be modeled as conditional dependencies (probabilities), combined in a BBN (influ-ence diagram) (Haas 2001), dynamic optimization model (Williams 1996), or similardecision-model form. Sensitivity analysis will then be performed on these models.
Although the streams make up only a tiny percentage of the total land base of the UpperGrande Ronde watershed, they can be impacted by land use activities occurring any-where within the watershed. Thus, the decision-support tool developed for the INLASAquatic Module needs to be linked directly to many other INLAS modules. Potentialdirect linkages between the vegetation, disturbance, riparian, wood utilization, herbivory,recreation, and economic modules are illustrated (fig. 13). We will use inputs from theseINLAS modules to characterize watershed attributes that directly or indirectly influencethe aquatic system and then analyze those projected landscapes to evaluate likely habi-tat capacity and water quality effects for short-term (e.g., 5- to 10-year) and long-term(e.g., 100-year) timeframes that would result from specific management scenarios.Aquatic habitat capacity potential also is affected by physical attributes of the subbasin,attributes such as slope steepness, soil types, and valley floor widths, which are fixed
Methods
Links to Other INLASModules
Modeling Approach
Objectives

79
physical attributes and insensitive to management-caused changes. Many of the otherINLAS modules require similar descriptive information. Spatially explicit databases willbe compiled for the INLAS project and available to all INLAS modules so that effects ofspecific management scenarios will be based on identical watersheds.
We will develop DSMs and provide detailed documentation of those models includingmethods used to incorporate data into the decision models, the sensitivity analysis, andevaluation of the relative value (cost benefit) of collecting additional data to better param-eterize model variables. The latter also will be used to make recommendations regardingfuture studies or monitoring efforts.
We also will develop a user-friendly electronic version of the DSMs for use by ForestService biologists.
The DSMs will be applied to the Upper Grande Ronde subbasin to evaluate the influenceof alternative management scenarios developed to address aquatic and other resourceissues.
Figure 13—Example of possible linkages between physical conditions, land management practices, and aquatic habitat capacity to be used fordecision analysis (The actual decision analysis framework will be developed with the use of expert panels during the project). Potential links toother Interior Northwest Landscape Analysis System modules are illustrated (bold text in boxes).
Expected Outputs
80
We acknowledge review comments from Miles Hemstrom, Jim Peterson, and BruceRieman, and especially comments and discussions with Bruce Marcot, all of whichgreatly improved this manuscript.
Barbour, R.J.; Maguire, D.; Singleton, R. 2004. A framework for the development andapplication of INLAS. In: Hayes, J.L.; Ager, A.A.; Barbour, R.J., tech. eds. Methods forintegrating modeling of landscape change: Interior Northwest Landscape AnalysisSystem. Gen. Tech. Rep. PNW-GTR-610. Portland, OR: U.S. Department of Agricul-ture, Forest Service, Pacific Northwest Research Station: 1-16. Chapter 1.
Clemen, R.T. 1996. Making hard decisions: an introduction to decision analysis. 2nd ed.Belmont, CA: Duxbury. 688 p.
Cumulative Risk Initiative [CRI]. 2000. Cumulative risk initiative: a standardized quan-titative analysis of risks faced by salmonids in the Columbia River basin. Seattle, WA:Northwest Fisheries Science Center, NMFS-NOAA. http://www.nwfsc.noaa.gov/cri/pdf_files/CRI2000.pdf. (June 9, 2003).
Federal Caucus. 2000. Vols. 1-2. Conservation of Columbia basin fish, finalbasinwide salmon recovery strategy. Portland, OR: Federal Caucus/BonnevillePower Administration. http://www.salmonrecovery.gov/Final_Strategy_Vol_1.pdf,http://www.salmonrecovery.gov/Final_Strategy_Vol_2.pdf. (June 9, 2003).
Federal Columbia River Power System [FCRPS] Biological Opinion. 2000.Reinitiation of consultation on operation of the federal Columbia River power system,including the juvenile fish transportation program, and 19 Bureau of Reclamationprojects in the Columbia Basin. National Marine Fisheries Service. http://www.nwr.noaa.gov/1hydrop/hydroweb/docs/Final/2000Biop.html. (June 9, 2003).
Gelman, A.B.; Carlin, J.S.; Stern, H.S.; Rubin, D.B. 1995. Bayesian data analysis.Boca Raton, FL: Chapman and Hall. 552 p.
Grande Ronde Water Quality Committee. 2000. Upper Grande Ronde River subbasinwater quality management plan. Portland, OR: Oregon Department of EnvironmentalQuality. http://www.deq.state.or.us/wq/tmdls/UprGR/UprGRWQMP.pdf. (June 9, 2003).
Haas, T.C. 2001. A Web-based system for public-private sector collaborative eco-system management. Stochastic Environmental Research and Risk Assessment.15: 101-131.
Independent Scientific Advisory Board [ISAB]. 2001. Model synthesis report: ananalysis of decision-support tools used in Columbia River basin salmon manage-ment. Report 2001-1. Portland, OR: Northwest Power Planning Council; NationalMarine Fisheries Service. 124 p. http://www.nwcouncil.org/library/isab/isab2001-1.pdf.(June 9, 2003).
Lee, D.C.; Sedell, J.R.; Rieman, B.E. [et al.]. 1997. Broadscale assessment ofaquatic species and habitats. In: Quigley, T.M.; Arbelbide, S.J., tech. eds. 1997. Anassessment of ecosystem components in the interior Columbia basin and portions ofthe Klamath and Great Basins. Gen. Tech. Rep. PNW-GTR-405. Portland, OR: U.S.Department of Agriculture, Forest Service, Pacific Northwest Research Station: 1057-1496. Vol. 3. (Quigley, T.M., tech. ed; Interior Columbia Basin Ecosystem Manage-ment Project: scientific assessment).
Acknowledgments
Literature Cited
81
Marcot, B.G.; McConnaha, W.E.; Whitney, P.H. [et al.]. 2002. A multi-species frame-work approach for the Columbia River basin: integrating fish, wildlife, and ecologicalfunctions [CD-ROM]. Portland, OR: Northwest Power Planning Council. http://www.edthome.org/framework. (June 9, 2003).
Marmorek, D.R.; Peters, C.N.; Parnell, I., eds. 1998. PATH final report for fiscal year1998. Vancouver, BC: ESSA Technologies Ltd. 263 p.
Mobrand Biometrics, Inc. 1999. The EDT method. http://www.edthome.org/framework/Appendicies/Appendix pdfs/Appendix_A.pdf. (June 9, 2003).
Morgan, M.G.; Henrion, M. 1990. Uncertainty: a guide to dealing with uncertainty inquantitative risk and policy analysis. Cambridge, United Kingdom: Cambridge Univer-sity Press. 344 p.
Reynolds, K.M. 1999. EMDS users guide (version 2.0): knowledge-based decision sup-port for ecological assessment. Gen. Tech. Rep. PNW-GTR-470. Portland, OR: U.S.Department of Agriculture, Forest Service, Pacific Northwest Research Station. 63 p.
Reynolds, K.M.; Jensen, M.; Andreasen, J.; Goodman, I. 2000. Knowledge-basedassessment of watershed condition. Computers and Electronics in Agriculture. 27:315-333.
Rieman, B.; Peterson, J.T.; Clayton, J. [et al.]. 2001. Evaluation of potential effects offederal land management alternatives on trends of salmonids and their habitats in theinterior Columbia River basin. Forest Ecology and Management. 153: 43-62.
U.S. Department of Agriculture, Forest Service; U.S. Department of the Interior,Bureau of Land Management. 2000. Interior Columbia basin supplementaldraft environmental impact statement. The Interior Columbia Basin EcosystemManagement Project. Washington, DC: U.S. Government Printing Office. [Irregularpagination].
U.S. Geological Survey [USGS]. 1999. Stream segment temperature model. FortCollins, CO: U.S. Department of the Interior, Biological Resources Division,Fort Collins Science Center. Model documentation. http://www.fort.usgs.gov/products/pubs/4041/4041.pdf and code. http://www.fort.usgs.gov/products/software/SNTEMP/sntemp.asp. (June 9, 2003).
U.S. Geological Survey [USGS]. 2000. Stream segment temperature model. FortCollins, CO: U.S. Department of the Interior, Biological Resources Division,Fort Collins Science Center. Model documentation. http://www.fort.usgs.gov/products/pubs/4090/4090.asp and code. http://www.fort.usgs.gov/products/software/SNTEMP/sntemp.asp. (June 9, 2003).
Varis, O.; Kuikka, S. 1999. Learning Bayesian decision analysis by doing: lessonsfrom environmental and natural resources management. Ecological Modelling. 199:177-195.
Wigmosta, M.; Vail, L.; Lettenmaier, D.P. 1994. A distributed hydrology-vegetationmodel for complex terrain. Water Resources Research. 30: 1665-1679.
Williams, B.K. 1996. Adaptive optimization of renewable natural resources: solutionalgorithms and a computer program. Ecological Modelling. 93: 101-111.
82
Chapter 7: Modeling the Effects of LargeHerbivores
Martin Vavra, Alan A. Ager, Bruce Johnson, Michael J. Wisdom, Miles A.Hemstrom, and Robert Riggs1
Knowledge about the effects of ungulate herbivores on forest and range vegetation in theBlue Mountains in northeastern Oregon is reviewed, and future research needs to im-prove our understanding of herbivory on ecosystem processes are identified. Herbivoreshave had a major influence on the development of current vegetation conditions, yet theireffects are largely ignored in most planning analyses, especially the wild ungulates. Wediscuss alternative modeling approaches to help understand herbivory as a disturbanceprocess and identify gaps in knowledge and data that need attention before models canbe fully integrated with landscape planning systems. For the Interior Northwest Land-scape Analysis System we plan to develop the framework for a conceptual model ofherbivory effects on succession. This model should run at multiple scales but ultimatelyfunction to deliver landscape-level products. The model ultimately will consider herbivoredensity and distribution as inputs.
Keywords: Herbivory, succession, disturbance, modeling, ungulates.
Herbivory by wild and domestic ungulates has profound effects on ecosystem patternsand processes and direct economic implications for production of nearly every commod-ity and amenity associated with forests and rangelands in the Pacific Northwest. Many
Abstract
Introduction
1 Martin Vavra is a research range scientist, Michael J.Wisdom is a research wildlife biologist, and Alan A. Ager isan operations research analyst, U.S. Department of Agriculture,Forest Service, Pacific Northwest Research Station, Forestry andRange Sciences Laboratory, Bruce Johnson is a fish andwildlife biologist, Oregon Department of Fish and Wildlife, 1401Gekeler Lane, La Grande, OR 97850. Miles A. Hemstrom is aresearch ecologist, U.S. Department of Agriculture, ForestService, Pacific Northwest Research Station, Forest ScienceLaboratory, 620 SW Main Suite 400, Portland, OR 97205. RobertRiggs is a research wildlife biologist, Boise Building Solutions,Northeast Oregon/Idaho Region, 1917 Jackson Street, La Grande,OR 97850.
83
factors determine the level of herbivory, and in turn, the magnitude of herbivory effects onecosystems. Impacts associated with the management of ungulate herbivory in relationto ecosystem properties potentially involve millions of dollars. Moreover, the effects ofungulate herbivory on the dynamics of plant succession have strong legal and policyimplications related to federal requirements to maintain viable populations of native spe-cies. Mandates by the Endangered Species Act (1973) and National Forest ManagementAct (1976) make the issue of ungulate herbivory of interest to nearly every user and man-ager of forests and rangelands.
Enough data are available to develop a conceptual framework for linking proposed her-bivory research with potential management products and address three major parts ofungulate-ecosystem relationships: (1) direct effects of ungulate herbivory on ecosys-tems, (2) factors affecting ungulate herbivory, and (3) integration of relevant, unpublisheddata and existing publications to augment parts 1 and 2. Our paper focuses on herbivoryby three ungulates that dominate landscapes of the Blue Mountains and Pacific North-west: elk (Cervus elaphus), mule deer (Odocoileus hemionus), and cattle.
Positive results of appropriate management of these three ungulate species need to befully recognized and articulated. A wealth of existing but unpublished data needs to beintegrated with existing publications and findings from future research. Specifically, mod-els need to be built and validated that project effects of ungulate herbivory at multiplescales, particularly stand, watershed, and basin scales. Such products can be used asendpoints for management application in wildfire rehabilitation and prescribed fire andfuels-reduction programs. They also can be developed as large-scale hypotheses forfurther testing and validation through adaptive management. In this manner, our proposedresearch and potential management products have a strong foundation in research butare of direct utility to managers of ungulates, ungulate herbivory, and the forest ecosys-tems in which ungulates occur.
Model development will occur in a progressive manner. First, broad-scale models of un-gulate resource selection that predict spatially explicit distributions of ungulates on land-scapes will be constructed from information available from the Starkey Project (Johnsonet al. 2000). Ongoing research and published information (Riggs et al. 2000) will be usedto develop a model of herbivore forage preference and resulting forage depletion. Thesemodels form the underpinning of models that predict the effects of herbivory on flora andfauna at landscape scales such as found in range allotments. An ungulate keystoneeffects model will then be targeted as a primary end product. Such a model could beused to understand the effects of herbivory on other resources of interest (e.g., timberproduction, avian species richness, or nutrient recycling) and to assess the degree towhich successional trajectories and vegetation states can be maintained or altered indesired ways.
Succession in forests has been traditionally assumed to progress predictably to climaxplant associations (Clements 1936). Evidence is growing that succession can be con-trolled or altered dramatically by chronic herbivory (Augustine and McNaughton 1998,Hobbs 1996, Jenkins and Starkey 1996, Peek et al. 1978, Riggs et al. 2000, Schreineret al. 1996). Variation in the herbivory regime (i.e., variation in the herbivore species, andtiming, duration, or intensity of grazing) can vary the pattern and rate of successionalchange, and even vary the apparent endpoint (i.e., trajectory) of succession. Thus, to
Herbivory Effects onForest and Range
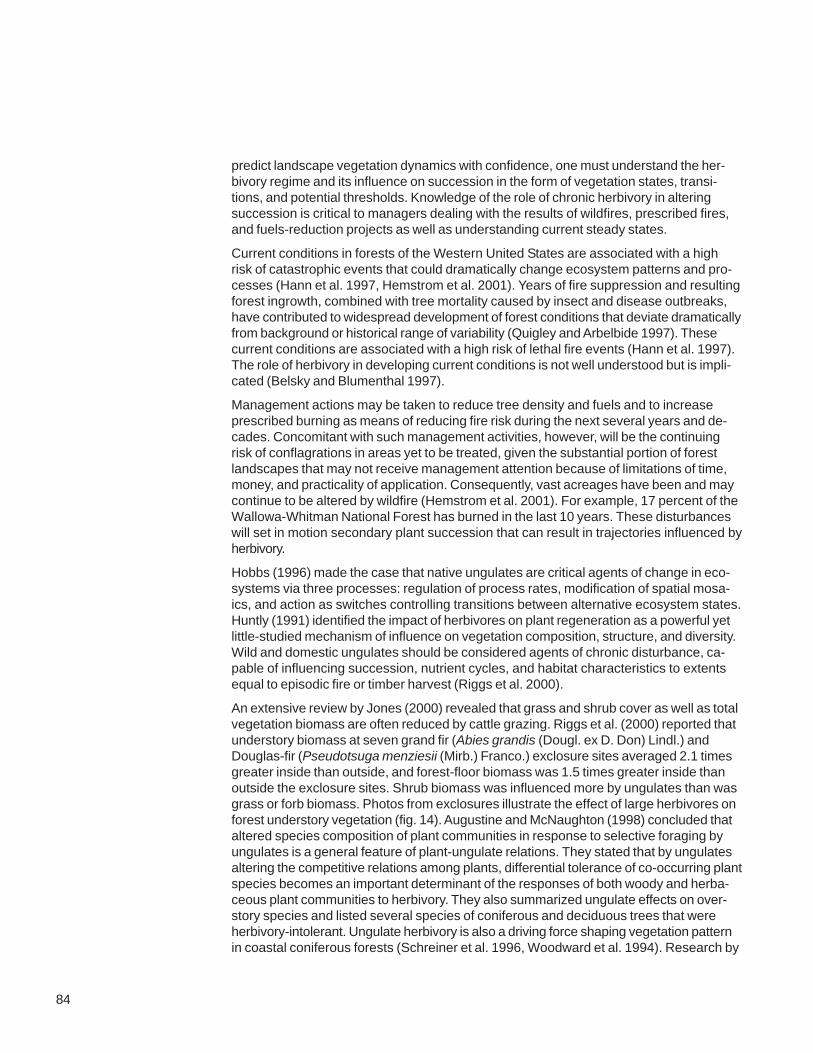
84
predict landscape vegetation dynamics with confidence, one must understand the her-bivory regime and its influence on succession in the form of vegetation states, transi-tions, and potential thresholds. Knowledge of the role of chronic herbivory in alteringsuccession is critical to managers dealing with the results of wildfires, prescribed fires,and fuels-reduction projects as well as understanding current steady states.
Current conditions in forests of the Western United States are associated with a highrisk of catastrophic events that could dramatically change ecosystem patterns and pro-cesses (Hann et al. 1997, Hemstrom et al. 2001). Years of fire suppression and resultingforest ingrowth, combined with tree mortality caused by insect and disease outbreaks,have contributed to widespread development of forest conditions that deviate dramaticallyfrom background or historical range of variability (Quigley and Arbelbide 1997). Thesecurrent conditions are associated with a high risk of lethal fire events (Hann et al. 1997).The role of herbivory in developing current conditions is not well understood but is impli-cated (Belsky and Blumenthal 1997).
Management actions may be taken to reduce tree density and fuels and to increaseprescribed burning as means of reducing fire risk during the next several years and de-cades. Concomitant with such management activities, however, will be the continuingrisk of conflagrations in areas yet to be treated, given the substantial portion of forestlandscapes that may not receive management attention because of limitations of time,money, and practicality of application. Consequently, vast acreages have been and maycontinue to be altered by wildfire (Hemstrom et al. 2001). For example, 17 percent of theWallowa-Whitman National Forest has burned in the last 10 years. These disturbanceswill set in motion secondary plant succession that can result in trajectories influenced byherbivory.
Hobbs (1996) made the case that native ungulates are critical agents of change in eco-systems via three processes: regulation of process rates, modification of spatial mosa-ics, and action as switches controlling transitions between alternative ecosystem states.Huntly (1991) identified the impact of herbivores on plant regeneration as a powerful yetlittle-studied mechanism of influence on vegetation composition, structure, and diversity.Wild and domestic ungulates should be considered agents of chronic disturbance, ca-pable of influencing succession, nutrient cycles, and habitat characteristics to extentsequal to episodic fire or timber harvest (Riggs et al. 2000).
An extensive review by Jones (2000) revealed that grass and shrub cover as well as totalvegetation biomass are often reduced by cattle grazing. Riggs et al. (2000) reported thatunderstory biomass at seven grand fir (Abies grandis (Dougl. ex D. Don) Lindl.) andDouglas-fir (Pseudotsuga menziesii (Mirb.) Franco.) exclosure sites averaged 2.1 timesgreater inside than outside, and forest-floor biomass was 1.5 times greater inside thanoutside the exclosure sites. Shrub biomass was influenced more by ungulates than wasgrass or forb biomass. Photos from exclosures illustrate the effect of large herbivores onforest understory vegetation (fig. 14). Augustine and McNaughton (1998) concluded thataltered species composition of plant communities in response to selective foraging byungulates is a general feature of plant-ungulate relations. They stated that by ungulatesaltering the competitive relations among plants, differential tolerance of co-occurring plantspecies becomes an important determinant of the responses of both woody and herba-ceous plant communities to herbivory. They also summarized ungulate effects on over-story species and listed several species of coniferous and deciduous trees that wereherbivory-intolerant. Ungulate herbivory is also a driving force shaping vegetation patternin coastal coniferous forests (Schreiner et al. 1996, Woodward et al. 1994). Research by
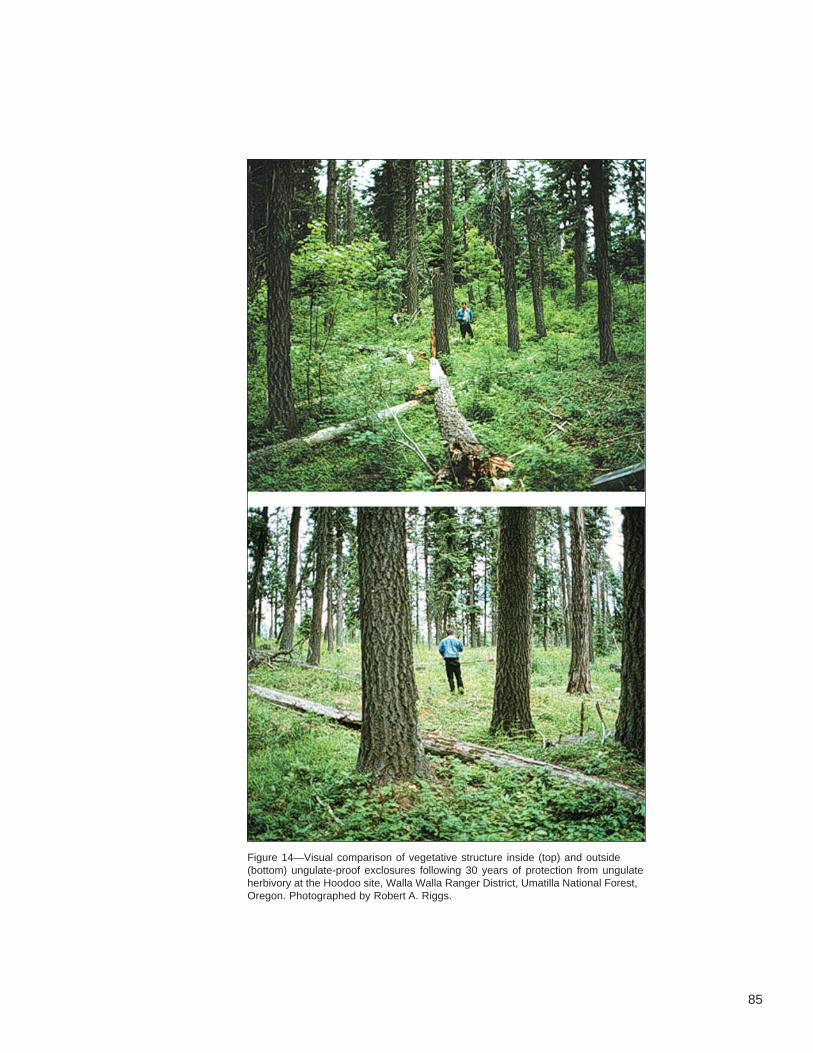
85
Figure 14—Visual comparison of vegetative structure inside (top) and outside(bottom) ungulate-proof exclosures following 30 years of protection from ungulateherbivory at the Hoodoo site, Walla Walla Ranger District, Umatilla National Forest,Oregon. Photographed by Robert A. Riggs.

86
these authors indicated that ungulates maintain a reduced standing crop, increase forbspecies richness, and determine the distribution, morphology, and reproductive perfor-mance of several shrub species. Woodward et al. (1994) further stated that the extent towhich herbivores can change ecosystem processes in forests likely depends on thescales of other disturbances. However, we hope to demonstrate that it is the balancebetween the scale of episodic disturbance and the density of ungulates that is the pri-mary driver of change.
Of particular interest in areas like the Blue Mountains are the interactions between graz-ing and conifer stand density (Belsky and Blumenthal 1997, Karl and Doescher 1993,Krusi et al. 1996, Madany and West 1983, Rummell 1951, Savage and Swetnam 1990,Zimmerman and Neueschwander 1984). There is increasing evidence that under certainconditions, the net effect of long-term cattle grazing is higher conifer density (Belsky andBlumenthal 1997) and concomitant increase in the risk of large-scale crown fires andinsect epidemics. The role of other ungulates (deer, elk) has not been demonstrated butcan be implicated (Augustine and McNaughton 1998, Hobbs 1996, Riggs et al. 2000).Higher rates of conifer seedling survival associated with some large herbivore grazingregimes probably result from the combined impacts of selective avoidance of coniferfoliage by herbivores and decreased ground-fire frequency as a consequence of reductionin understory fine fuels (i.e., grass, see Zimmerman and Neuenschwander 1984) andless seedling competition from preferred forage species. It is interesting to note that ifgrazing does indeed promote short-term overstocking of conifer stands that, without in-tervention management such as precommercial or commercial thinning, such stands arelikely to be ultimately predisposed to disease and insect epidemics and crown fires. Asa result, ecosystems subjected to intensely chronic herbivory may be predisposed tomore marked oscillations in the amount and distribution of transitory range, although thisis arguably influenced by the fuels mosaic and ignition rate as well as the herbivory re-gime. Along with potential for periodic instability of the plant-animal equilibrium are insta-bilities in forest structure.
With the potential for herbivory-induced changes in plant composition of forest understo-ries and overstories, important habitat ramifications for a number of plant and animalspecies occur. Changes in understory structure and litter accumulations may be impor-tant to bird and small mammal populations (DeCalesta 1994, Fagerstone and Ramey1996). Individual species of plants and entire plant communities may be at risk underintensive herbivory. Native steppe species in the interior Northwest are not adapted tofrequent and close grazing (Mack and Thompson 1982). Examples of plant species inthe Blue Mountains that are at risk of elimination or severe decline under intensive her-bivory include aspen (Populus tremuloides Michx.), Pacific yew (Taxus brevifolia Nutt.),bitterbrush (Purshia tridentata (Pursh) DC.), and mountain mahogany (Cercocarpus spp.Kunth) (Parks et al. 1998). Negative effects on vertebrate species that depend on theseplants (e.g., cavity nesters in aspen stands) are implied (Wisdom et al. 2000).
We identified two modeling approaches that could be useful to address research andmanagement questions related to herbivory in the Blue Mountains province. The firstuses a state and transition approach (Laycock 1991, Westoby et al. 1989) and builds onan existing model of succession and disturbance in the Blue Mountains (Hemstrom etal. Chapter 2). The second is a fine-scale individual animal foraging model that bringstogether previous work on foraging behavior of ungulates with data from Starkey on forageproduction and animal distributions (Johnson et al. 1996, 2000). These two approachesare described in more detail below.
Herbivory Models

87
Plant succession in forests likely operates as a set of states and transitions, much likethe models developed and validated for rangeland ecosystems (Laycock 1991, Westobyet al. 1989). Indeed, it now seems possible that the veracity of many “climax” associa-tions is questionable on this basis (Peek et al. 1978, Riggs et al. 2000, Schreiner et al.1996).
State and transition models (Laycock 1991, Westoby et al. 1989) for specific forest plantcommunities can be built from the succession-disturbance regime models that weredeveloped and applied to forest landscapes of the interior Columbia basin (Hann et al.1997; Hemstrom et al. 2001, in press). These models were designed as state and transi-tion models. The models projected successional change for each potential vegetationtype and management prescription that was associated with each unique combinationof disturbance regimes of herbivory, fire, disease, insects, and human activities. Themodels were built and parameterized with the use of the Vegetation Dynamics Develop-ment Tool (VDDT) (Beukema and Kurz 1995, as cited and used by Hann et al. 1997;Hemstrom et al. 2001, in press) and projected through time in a spatially explicit mannerby using the Columbia River Basin Succession Model (CRBSUM) (Keane et al. 1996)and corollary rule sets (Hann et al. 1997).
An example state and transition model of ponderosa pine (Pinus ponderosa Dougl. exLaws.) forests in the Blue Mountains is shown in figure 15. This model was built by usingthe VDDT program (Beukema and Kurz 1995). This is the type of model that we willmodify to construct herbivory-disturbance-regime models that integrate the effects ofherbivory on succession after episodic disturbances of fire, insects, disease, and humanactivities. This type of model provides the greatest utility for multiscale managementinferences. This modeling approach has several advantages: (1) effects of all disturbanceregimes and management prescriptions for all vegetation types can be accounted for atany spatial and temporal scale desired, provided sufficient empirical data exist for theirsubstantiation; (2) the role of herbivory can be explicitly modeled in relation to all poten-tial interactions with other disturbance regimes and management; (3) sensitivity andvalidation of herbivory effects relative to the interactive effects with other disturbance re-gimes can be tested; and (4) spatial and temporal scales of herbivory/disturbance effectscan be modeled. Ultimately, these models could be applied at the stand, watershed, andbasin scales for the entire Blue Mountains province provided that their predictions can besubstantiated empirically. The models should have some general application throughoutthe Rocky Mountain West.
A second approach to modeling the effects of herbivory involves building on earlier workat Starkey to simulate forage consumption and performance of ungulates on summerrange conditions (Johnson et al. 1996). In contrast to the state and transition approach,this work is built on basic processes of herbivores moving across landscapes andforaging for preferred plants in preferred habitats. This modeling approach uses empir-ical models of animal distributions, forage production, and animal energetics, coupledwith process-based models of foraging behavior to simulate foraging by cattle, elk(C.elepnas), and deer (Odocoileus spp.) at the landscape scale (5000 to 50 000 ha). Theoriginal formulation of the Starkey Foraging Model (SFM) was completed within a linearprogramming framework (Johnson et al. 1996) and later refined within a simulation frame-work that modeled individual animals, their movements, and foraging behavior at the bitelevel (fig. 16). Much of this work is based on previous models of movement and foragingbehavior (Cooperrider and Bailey 1984; Kueffer 2000; Seagle and McNaughton 1992;Spalinger and Hobbs 1992; Van Dyne et al. 1984a, 1984b). The model considers foragingsite selection, forage consumption, energy balance, and forage regrowth on a daily time
Starkey Foraging Model
State and TransitionModels
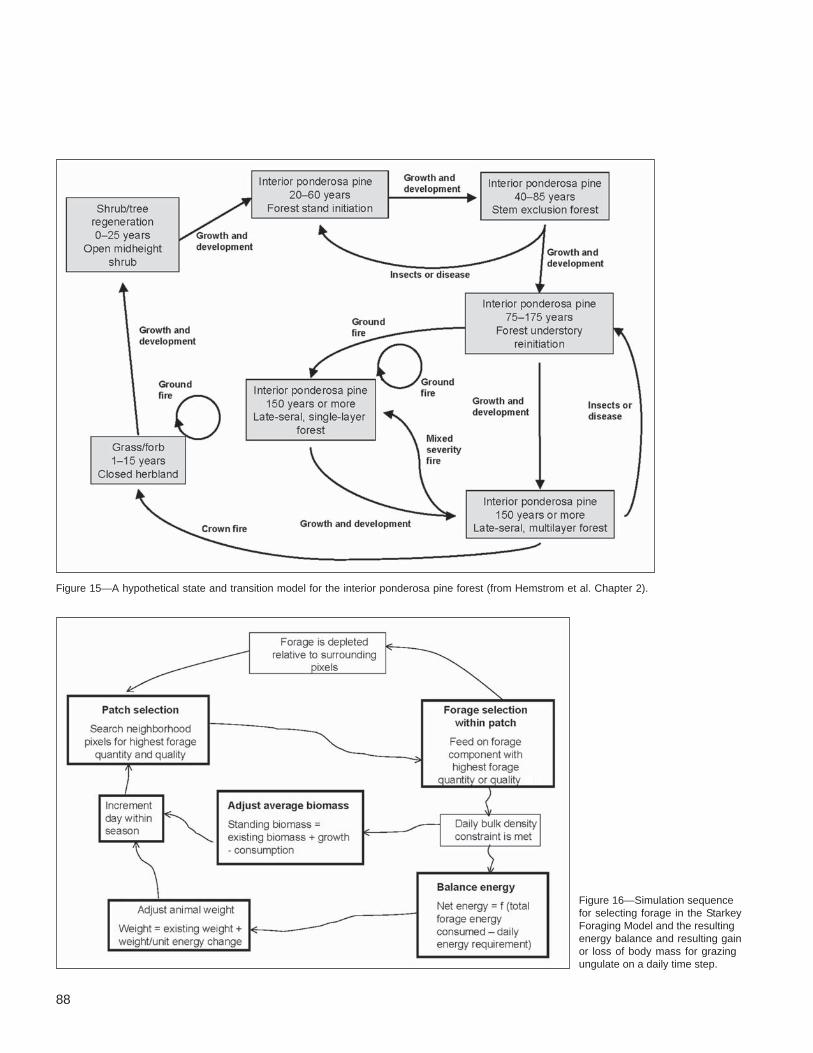
88
Figure 15—A hypothetical state and transition model for the interior ponderosa pine forest (from Hemstrom et al. Chapter 2).
Figure 16—Simulation sequencefor selecting forage in the StarkeyForaging Model and the resultingenergy balance and resulting gainor loss of body mass for grazingungulate on a daily time step.
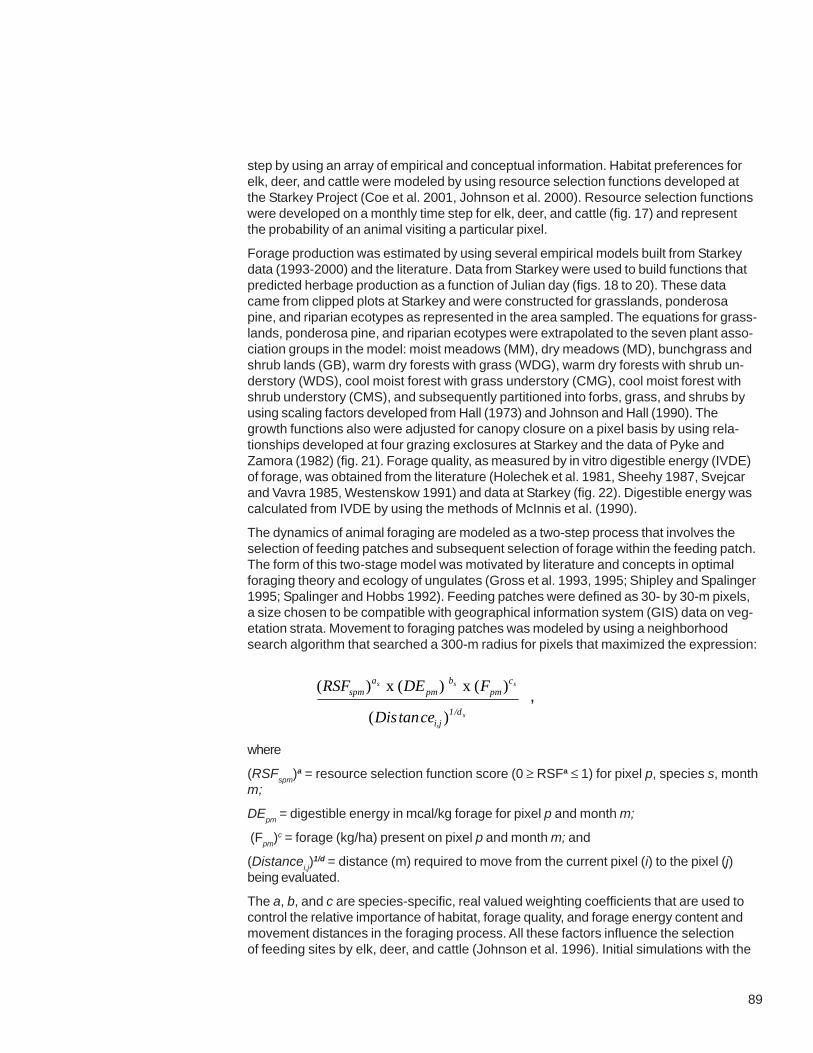
89
step by using an array of empirical and conceptual information. Habitat preferences forelk, deer, and cattle were modeled by using resource selection functions developed atthe Starkey Project (Coe et al. 2001, Johnson et al. 2000). Resource selection functionswere developed on a monthly time step for elk, deer, and cattle (fig. 17) and representthe probability of an animal visiting a particular pixel.
Forage production was estimated by using several empirical models built from Starkeydata (1993-2000) and the literature. Data from Starkey were used to build functions thatpredicted herbage production as a function of Julian day (figs. 18 to 20). These datacame from clipped plots at Starkey and were constructed for grasslands, ponderosapine, and riparian ecotypes as represented in the area sampled. The equations for grass-lands, ponderosa pine, and riparian ecotypes were extrapolated to the seven plant asso-ciation groups in the model: moist meadows (MM), dry meadows (MD), bunchgrass andshrub lands (GB), warm dry forests with grass (WDG), warm dry forests with shrub un-derstory (WDS), cool moist forest with grass understory (CMG), cool moist forest withshrub understory (CMS), and subsequently partitioned into forbs, grass, and shrubs byusing scaling factors developed from Hall (1973) and Johnson and Hall (1990). Thegrowth functions also were adjusted for canopy closure on a pixel basis by using rela-tionships developed at four grazing exclosures at Starkey and the data of Pyke andZamora (1982) (fig. 21). Forage quality, as measured by in vitro digestible energy (IVDE)of forage, was obtained from the literature (Holechek et al. 1981, Sheehy 1987, Svejcarand Vavra 1985, Westenskow 1991) and data at Starkey (fig. 22). Digestible energy wascalculated from IVDE by using the methods of McInnis et al. (1990).
The dynamics of animal foraging are modeled as a two-step process that involves theselection of feeding patches and subsequent selection of forage within the feeding patch.The form of this two-stage model was motivated by literature and concepts in optimalforaging theory and ecology of ungulates (Gross et al. 1993, 1995; Shipley and Spalinger1995; Spalinger and Hobbs 1992). Feeding patches were defined as 30- by 30-m pixels,a size chosen to be compatible with geographical information system (GIS) data on veg-etation strata. Movement to foraging patches was modeled by using a neighborhoodsearch algorithm that searched a 300-m radius for pixels that maximized the expression:
where
(RSFspm
)a = resource selection function score (0 ≥ RSFa ≤ 1) for pixel p, species s, monthm;
DEpm
= digestible energy in mcal/kg forage for pixel p and month m;
(Fpm
)c = forage (kg/ha) present on pixel p and month m; and
(Distancei,j)1/d = distance (m) required to move from the current pixel (i) to the pixel (j)
being evaluated.
The a, b, and c are species-specific, real valued weighting coefficients that are used tocontrol the relative importance of habitat, forage quality, and forage energy content andmovement distances in the foraging process. All these factors influence the selectionof feeding sites by elk, deer, and cattle (Johnson et al. 1996). Initial simulations with the
s
sss
/d1i,j
cpm
bpm
aspm
cetanDis
FDERSF
)(
)( x )( x )(,
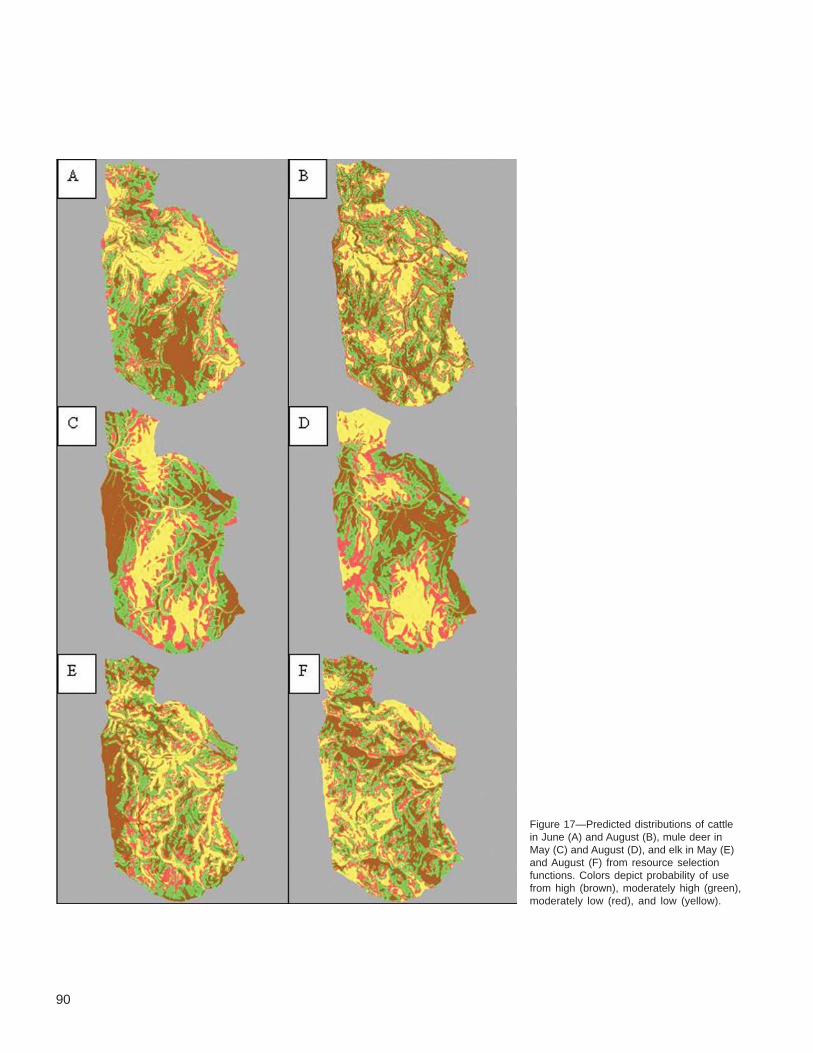
90
,
Figure 17—Predicted distributions of cattlein June (A) and August (B), mule deer inMay (C) and August (D), and elk in May (E)and August (F) from resource selectionfunctions. Colors depict probability of usefrom high (brown), moderately high (green),moderately low (red), and low (yellow).
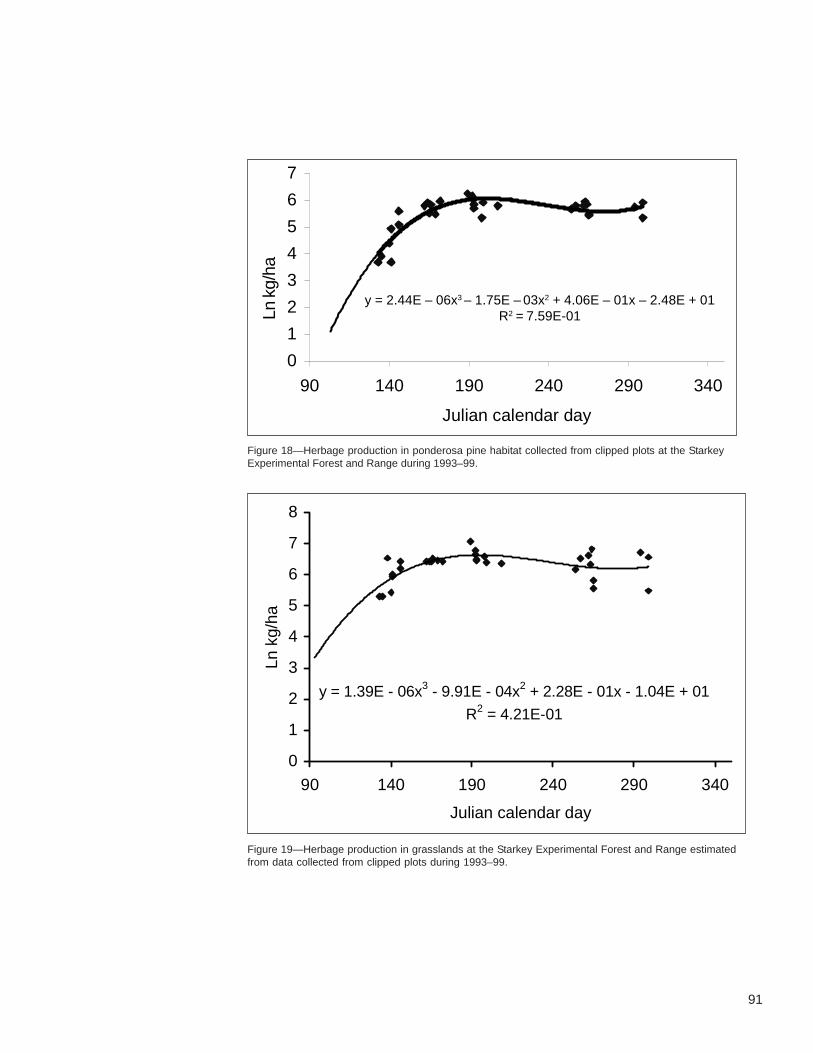
91
Figure 18—Herbage production in ponderosa pine habitat collected from clipped plots at the StarkeyExperimental Forest and Range during 1993–99.
Figure 19—Herbage production in grasslands at the Starkey Experimental Forest and Range estimatedfrom data collected from clipped plots during 1993–99.
y = 1.39E - 06x3 - 9.91E - 04x2 + 2.28E - 01x - 1.04E + 01
R2 = 4.21E-01
0
1
2
3
4
5
6
7
8
90 140 190 240 290 340
Julian calendar day
Ln k
g/ha
0
1
2
3
4
5
6
7
90 140 190 240 290 340
Julian calendar day
Ln K
g/ha
y = 2.44E – 06x3 – 1.75E – 03x2 + 4.06E – 01x – 2.48E + 01R2 = 7.59E-01Ln
kg/
ha
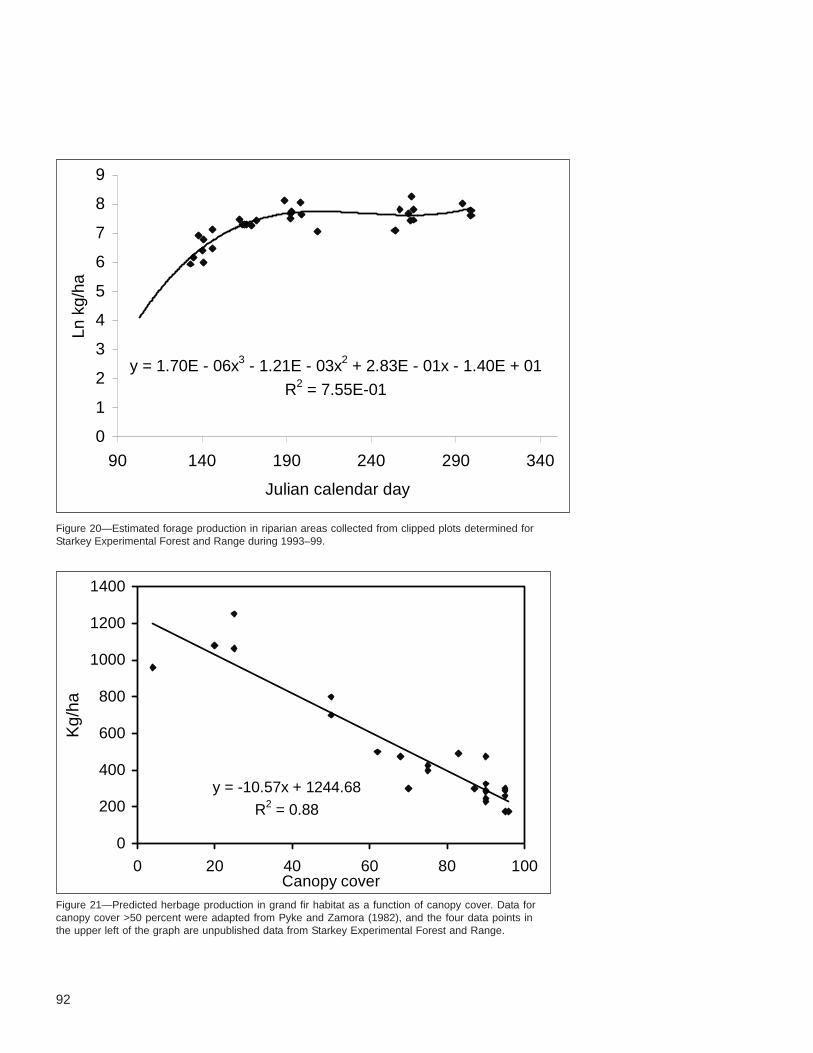
92
Figure 21—Predicted herbage production in grand fir habitat as a function of canopy cover. Data forcanopy cover >50 percent were adapted from Pyke and Zamora (1982), and the four data points inthe upper left of the graph are unpublished data from Starkey Experimental Forest and Range.
y = 1.70E - 06x3 - 1.21E - 03x2 + 2.83E - 01x - 1.40E + 01
R2 = 7.55E-01
0
1
2
3
4
5
6
7
8
9
90 140 190 240 290 340
Julian calendar day
Ln k
g/ha
Figure 20—Estimated forage production in riparian areas collected from clipped plots determined forStarkey Experimental Forest and Range during 1993–99.
y = -10.57x + 1244.68
R2 = 0.88
0
200
400
600
800
1000
1200
1400
0 20 40 60 80 100Canopy cover
Kg/
ha

93
SFM used coefficients of 1.0 for all species. Once a foraging pixel was selected, con-sumption of forage (grass, forbs, and shrubs) was modeled as a Monte Carlo processthat simulated successive bites that removed forage types in proportion to the productof total forage available times forage digestible energy. Specifically,
where
Pts = probability of removing forage type t for species s (0 ≥ P
ts ≤ 1);
F = forage on pixel p at month m;
DEptm
= digestible energy in mcal/kg for forage type t, pixel p, and month m; and
Ws = species-specific weighting factor.
The initial simulations used Ws = (body weight)0.75 . This resulted in deer emphasizing
forage quality versus cattle emphasizing forage bulk. Elk, with their intermediate bodyweight, were simulated as having a foraging behavior in between that of deer and cattle.Bite size was held constant for each species (elk = 0.22 g, deer = 0.06 g, cattle = 0.53g), although in future work, the type II functional response between bite size and plant
Figure 22—Hypothetical example of in vitro digestibility of grasses (dashed line), forbs(solid line), and shrubs (dotted line) in cool moist forests at Starkey Experimental For-est and Range. Forage digestibility estimates were from unpublished data collected atStarkey Experimental Forest and Range (Holechek et al. 1981, Krueger and Bedunah1988, Skovlin 1967, Svejcar and Vavra 1985, Urness 1984, and Walton (1962).
(2),
=tsP ∑t
1ptm
w
ptmw
pm
DEF
)DEF
s
s
)]( )[(
( )(
pm
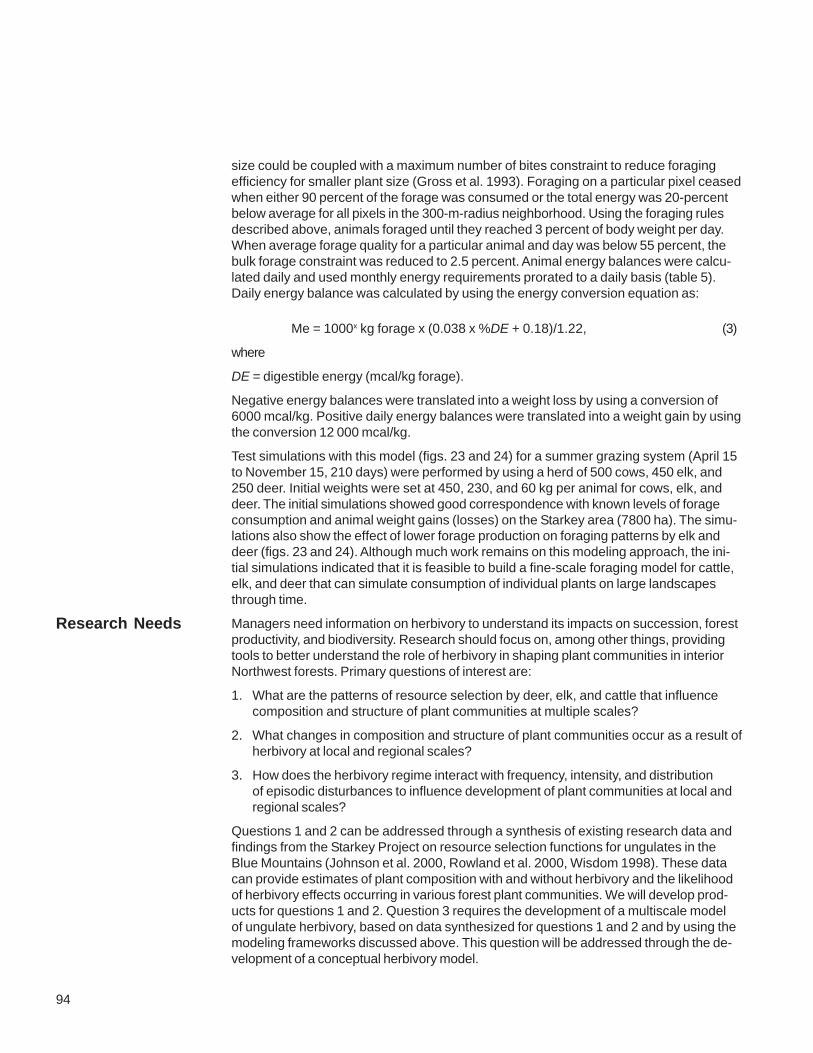
94
size could be coupled with a maximum number of bites constraint to reduce foragingefficiency for smaller plant size (Gross et al. 1993). Foraging on a particular pixel ceasedwhen either 90 percent of the forage was consumed or the total energy was 20-percentbelow average for all pixels in the 300-m-radius neighborhood. Using the foraging rulesdescribed above, animals foraged until they reached 3 percent of body weight per day.When average forage quality for a particular animal and day was below 55 percent, thebulk forage constraint was reduced to 2.5 percent. Animal energy balances were calcu-lated daily and used monthly energy requirements prorated to a daily basis (table 5).Daily energy balance was calculated by using the energy conversion equation as:
Me = 1000x kg forage x (0.038 x %DE + 0.18)/1.22, (3)
where
DE = digestible energy (mcal/kg forage).
Negative energy balances were translated into a weight loss by using a conversion of6000 mcal/kg. Positive daily energy balances were translated into a weight gain by usingthe conversion 12 000 mcal/kg.
Test simulations with this model (figs. 23 and 24) for a summer grazing system (April 15to November 15, 210 days) were performed by using a herd of 500 cows, 450 elk, and250 deer. Initial weights were set at 450, 230, and 60 kg per animal for cows, elk, anddeer. The initial simulations showed good correspondence with known levels of forageconsumption and animal weight gains (losses) on the Starkey area (7800 ha). The simu-lations also show the effect of lower forage production on foraging patterns by elk anddeer (figs. 23 and 24). Although much work remains on this modeling approach, the ini-tial simulations indicated that it is feasible to build a fine-scale foraging model for cattle,elk, and deer that can simulate consumption of individual plants on large landscapesthrough time.
Managers need information on herbivory to understand its impacts on succession, forestproductivity, and biodiversity. Research should focus on, among other things, providingtools to better understand the role of herbivory in shaping plant communities in interiorNorthwest forests. Primary questions of interest are:
1. What are the patterns of resource selection by deer, elk, and cattle that influencecomposition and structure of plant communities at multiple scales?
2. What changes in composition and structure of plant communities occur as a result ofherbivory at local and regional scales?
3. How does the herbivory regime interact with frequency, intensity, and distributionof episodic disturbances to influence development of plant communities at local andregional scales?
Questions 1 and 2 can be addressed through a synthesis of existing research data andfindings from the Starkey Project on resource selection functions for ungulates in theBlue Mountains (Johnson et al. 2000, Rowland et al. 2000, Wisdom 1998). These datacan provide estimates of plant composition with and without herbivory and the likelihoodof herbivory effects occurring in various forest plant communities. We will develop prod-ucts for questions 1 and 2. Question 3 requires the development of a multiscale modelof ungulate herbivory, based on data synthesized for questions 1 and 2 and by using themodeling frameworks discussed above. This question will be addressed through the de-velopment of a conceptual herbivory model.
Research Needs
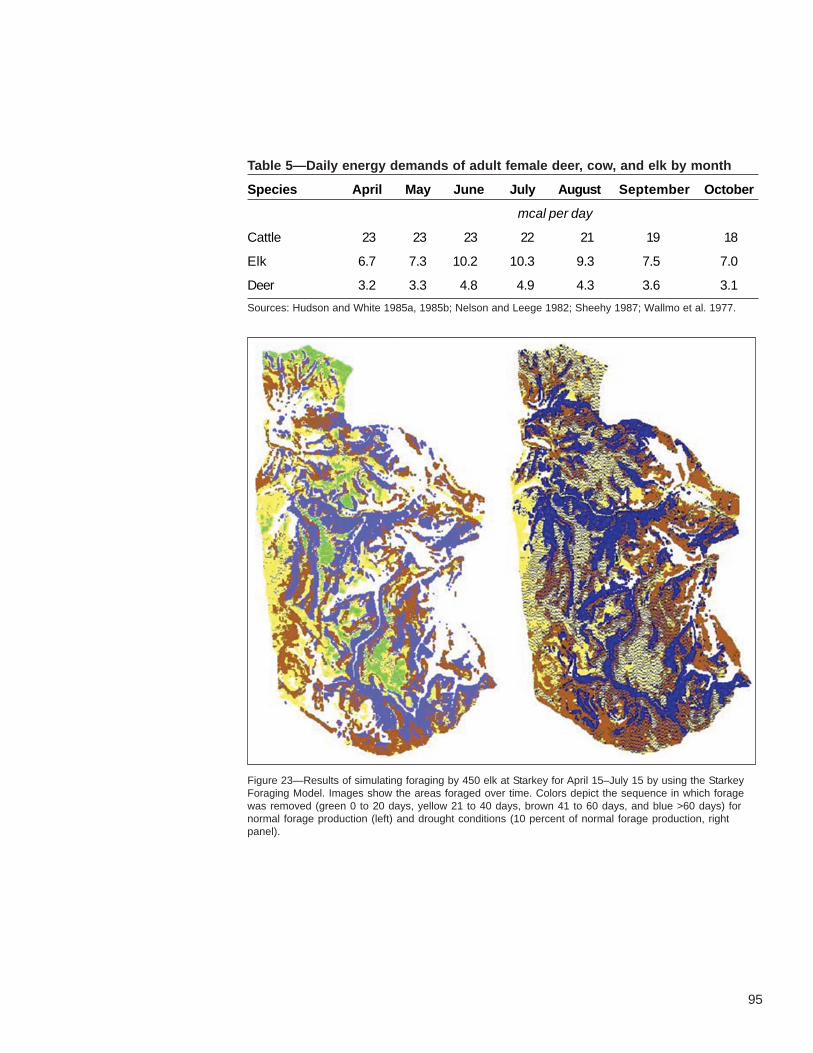
95
Table 5—Daily energy demands of adult female deer, cow, and elk by month
Species April May June July August September October
mcal per day
Cattle 23 23 23 22 21 19 18
Elk 6.7 7.3 10.2 10.3 9.3 7.5 7.0
Deer 3.2 3.3 4.8 4.9 4.3 3.6 3.1
Sources: Hudson and White 1985a, 1985b; Nelson and Leege 1982; Sheehy 1987; Wallmo et al. 1977.
Figure 23—Results of simulating foraging by 450 elk at Starkey for April 15–July 15 by using the StarkeyForaging Model. Images show the areas foraged over time. Colors depict the sequence in which foragewas removed (green 0 to 20 days, yellow 21 to 40 days, brown 41 to 60 days, and blue >60 days) fornormal forage production (left) and drought conditions (10 percent of normal forage production, rightpanel).
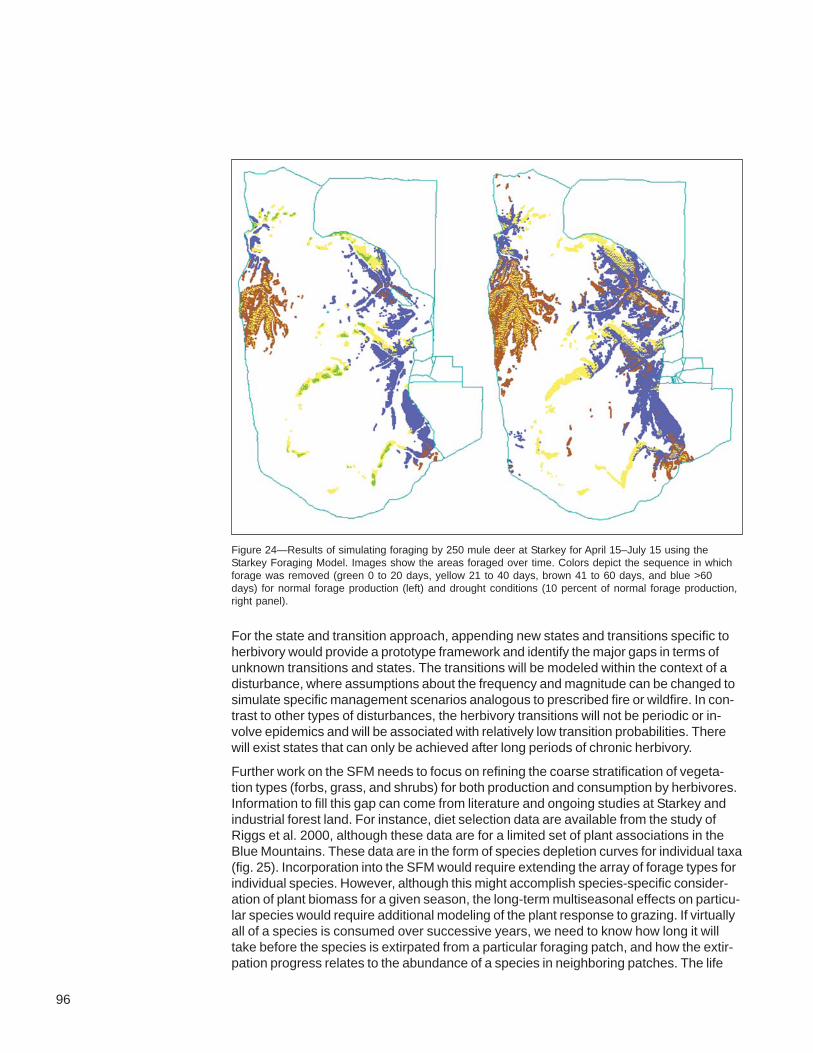
96
For the state and transition approach, appending new states and transitions specific toherbivory would provide a prototype framework and identify the major gaps in terms ofunknown transitions and states. The transitions will be modeled within the context of adisturbance, where assumptions about the frequency and magnitude can be changed tosimulate specific management scenarios analogous to prescribed fire or wildfire. In con-trast to other types of disturbances, the herbivory transitions will not be periodic or in-volve epidemics and will be associated with relatively low transition probabilities. Therewill exist states that can only be achieved after long periods of chronic herbivory.
Further work on the SFM needs to focus on refining the coarse stratification of vegeta-tion types (forbs, grass, and shrubs) for both production and consumption by herbivores.Information to fill this gap can come from literature and ongoing studies at Starkey andindustrial forest land. For instance, diet selection data are available from the study ofRiggs et al. 2000, although these data are for a limited set of plant associations in theBlue Mountains. These data are in the form of species depletion curves for individual taxa(fig. 25). Incorporation into the SFM would require extending the array of forage types forindividual species. However, although this might accomplish species-specific consider-ation of plant biomass for a given season, the long-term multiseasonal effects on particu-lar species would require additional modeling of the plant response to grazing. If virtuallyall of a species is consumed over successive years, we need to know how long it willtake before the species is extirpated from a particular foraging patch, and how the extir-pation progress relates to the abundance of a species in neighboring patches. The life
Figure 24—Results of simulating foraging by 250 mule deer at Starkey for April 15–July 15 using theStarkey Foraging Model. Images show the areas foraged over time. Colors depict the sequence in whichforage was removed (green 0 to 20 days, yellow 21 to 40 days, brown 41 to 60 days, and blue >60days) for normal forage production (left) and drought conditions (10 percent of normal forage production,right panel).
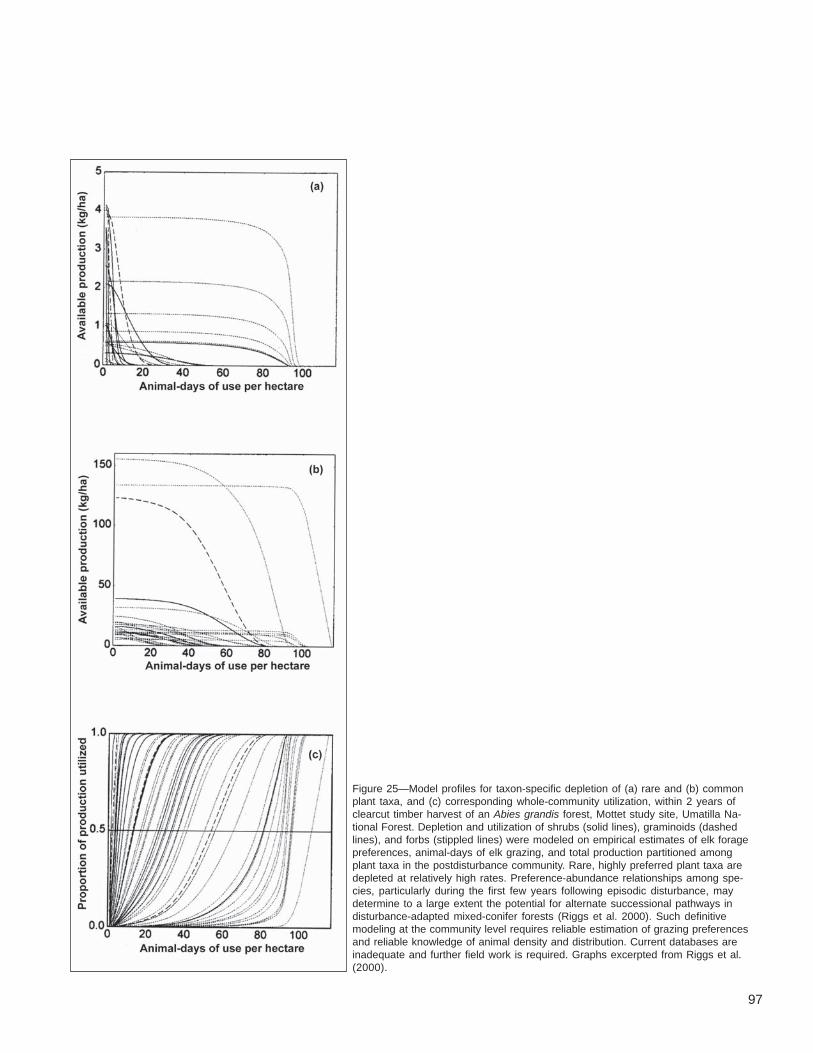
97
Figure 25—Model profiles for taxon-specific depletion of (a) rare and (b) commonplant taxa, and (c) corresponding whole-community utilization, within 2 years ofclearcut timber harvest of an Abies grandis forest, Mottet study site, Umatilla Na-tional Forest. Depletion and utilization of shrubs (solid lines), graminoids (dashedlines), and forbs (stippled lines) were modeled on empirical estimates of elk foragepreferences, animal-days of elk grazing, and total production partitioned amongplant taxa in the postdisturbance community. Rare, highly preferred plant taxa aredepleted at relatively high rates. Preference-abundance relationships among spe-cies, particularly during the first few years following episodic disturbance, maydetermine to a large extent the potential for alternate successional pathways indisturbance-adapted mixed-conifer forests (Riggs et al. 2000). Such definitivemodeling at the community level requires reliable estimation of grazing preferencesand reliable knowledge of animal density and distribution. Current databases areinadequate and further field work is required. Graphs excerpted from Riggs et al.(2000).

98
history of each shrub needs to be considered to model response to grazing. Qualitativeinformation on species response to grazing is included in plant association guides for theBlue Mountains in terms of whether species increase or decrease when subjected tograzing pressure. Forage production data also need refinements in terms of modeling thegrowth of the major plant species. These data also are limited but available in plant asso-ciation guides (e.g., Hall 1973). In addition, studies are underway at Boise Cascade tobuild empirical models of nonconifer plant production and composition for a subset of theplant communities in the Blue Mountains.
Linking a spatial foraging model like that developed at Starkey with tree growth simula-tors (e.g., the Forest Vegetation Simulator [FVS]) is a complex problem. The simulationof herbivory as a spatial disturbance within a stand-level simulation model will require thekind of formulation described by Bettinger et al. (Chapter 4) to simulate wildfire within avegetation growth model like FVS. Integration of herbivory models into vegetation growthmodels presents a significant challenge for future work.
Forest, rangeland, and wildlife managers in the Blue Mountains province are the targetedusers of the research findings and management tools produced from the activities out-lined in this paper. Clients include managers of public, private, and tribal lands in theBlue Mountains province, encompassing economic and social interests related to man-agement of timber, livestock, wild ungulates, salmon, and vertebrates and plants of con-servation concern. Technical users of the research findings and products outlined hereinclude spatial analysts, planners, and resource specialists of public, private, and triballands in the Blue Mountains. Application of the concepts and relations developed as partof this research and associated management tools also will extend beyond the BlueMountains to similar environments in other provinces of the Pacific Northwest and inter-mountain West. These extensions will target the above-named clients in these similarenvironments.
When you know: Multiply by: To get:
Hectares (ha) 2.47 Acres
Meters (m) 3.28 Feet
Grams (g) .0352 Ounces
Grams (g) .0022 Pounds
Kilogram (kg) 2.205 Pounds
Augustine, D.J.; McNaughton, S.J. 1998. Ungulate effects on the functional speciescomposition of plant communities: herbivore selectivity and plant tolerance. Journalof Wildlife Management. 62: 1165-1183.
Belsky, A.J.; Blumenthal, D.M. 1997. Effects of livestock grazing on stand dynamicsand soils in upland forests of the interior. Western Conservation Biology. 11: 315-327.
Bettinger, P.; Graetz, D.; Ager, A.A.; Sessions, J. 2004. The SafeD forest landscapeplanning model. In: Hayes, J.L.; Ager, A.A.; Barbour, R.J., tech. eds. Methods forintegrating modeling of landscape change: Interior Northwest Landscape AnalysisSystem. Gen. Tech. Rep. PNW-GTR-610. Portland, OR: U.S. Department of Agricul-ture, Forest Service, Pacific Northwest Research Station: 41-63. Chapter 4.
Products andAudience
English Equivalents
Literature Cited
99
Beukema, S.J.; Kurz, W.A. 1995. Vegetation dynamics development tool user’s guide,version 2.0 beta. 76 p. Unpublished report. On file with: ESSA Technologies Ltd.,No. 300-1765 West 8th Avenue, Vancouver, BC, Canada V6J 5C6.
Clements, F.E. 1936. Nature and structure of the climax. Journal of Ecology.24: 252-284.
Coe, P.K.; Johnson, B.K.; Kern, J.W. [et al.]. 2001. Responses of elk and mule deerto cattle in summer. Journal of Range Management. 54: A51-A76.
Cooperrider, A.Y.; Bailey, J.A. 1984. A simulation approach to forage allocation. In:National Research Council/National Academy of Sciences, eds. Developing strategiesfor rangeland management. Boulder, CO: Westview Press: 525-560.
DeCalesta, D.S. 1994. Effect of white-tailed deer on songbirds within managed forestsin Pennsylvania. Journal of Wildlife Management. 58: 711-718.
Endangered Species Act of 1973 [ESA]; 16 U.S.C. 1531-1536, 1538-1540.
Fagerstone, K.A.; Ramey, C.A. 1996. Rodents and lagomorphs. In: Krausman, P.R.,ed. Rangeland wildlife. Denver, CO: Society of Range Management: 83-132.
Gross, J.E.; Shipley, L.A.; Hobbs, T.N. [et al.]. 1993. Functional response ofherbivores in food-concentration patches: tests of a mechanistic model. Ecology.74(3): 778-791.
Gross, J.E.; Zank, C.; Hobbs, N.T.; Spalinger, D.E. 1995. Movement rules for herbi-vores in spatially heterogeneous environments: responses to small scale patterns.Landscape Ecology. 10(4): 209-217.
Hall, F.C. 1973. Plant communities of the Blue Mountains in eastern Oregon and south-eastern Washington. R-6 Area Guide 3-1. Portland, OR: U.S. Department of Agricul-ture, Forest Service, Pacific Northwest Region. 62 p.
Hann, W.J.; Jones, J.L.; Karl, M.G. [et al.]. 1997. Landscape dynamics of the basin.In: Quigley, T.M.; Arbelbide, S.J., tech. eds. An assessment of ecosystem compo-nents in the interior Columbia basin and portions of the Klamath and Great Basins.Gen. Tech. Rep. PNW-GTR-405. Portland, OR: U.S. Department of Agriculture, For-est Service, Pacific Northwest Research Station: 337-1055. Vol 2. (Quigley, T.M., teched.; Interior Columbia Basin Ecosystem Management Project: scientific assessment).
Hemstrom, M.; Ager, A.A.; Vavra, M. [et al.]. 2003. State and transition approach forintegrating landscape models. In: Hayes, J.L.; Ager, A.A.; Barbour, R.J., tech. eds.Methods for integrating modeling of landscape change: Interior Northwest LandscapeAnalysis System. Gen. Tech. Rep. PNW-GTR-610. Portland, OR: U.S. Departmentof Agriculture, Forest Service, Pacific Northwest Research Station: 17-32. Chapter 2.
Hemstrom, M.A.; Korol, J.J.; Hann, W.J. 2001. Trends in terrestrial plant communitiesand landscape health indicate the effects of alternative management strategies in theinterior Columbia River basin. Forest Ecology and Management. 153: 105-126.
100
Hemstrom, M.A.; Wisdom, M.J.; Rowland, M.M. [et al.]. [In press]. Sagebrush-steppe vegetation dynamics and potential for restoration in the interior Columbiabasin, USA. Conservation Biology.
Hobbs, N.T. 1996. Modification of ecosystems by ungulates. Journal of Wildlife Manage-ment. 60: 695-713.
Holechek, J.L.; Vavra, M.; Skovlin, J. 1981. Diet quality and performance of cattle onforest and grassland range. Journal of Animal Science. 53: 291-298.
Hudson, R.J.; White, R.G. 1985a. Computer simulation of energy budgets. In: Hudson,R.J.; White, R.G., eds. Bioenergetics of wild herbivores. Boca Raton, FL: CRC Press:261-290.
Hudson, R.J.; White, R.G. 1985b. Bioenergetics of wild herbivores. Boca Raton, FL:CRC Press. 314 p.
Huntly, N. 1991. Herbivores and the dynamics of communities and ecosystems. AnnualReview of Ecology and Systematics. 22: 477-503.
Jenkins, K.; Starkey, E. 1996. Simulating secondary succession of elk forage valuesin a managed forest landscape, western Washington. Environmental Management.20: 715-724.
Johnson, B.K.; Ager, A.A.; Crim, S. [et al.]. 1996. Allocating forage among wild anddomestic ungulates—a new approach. In: Edge, W.D.; Olson-Edge, S.L., eds.Proceedings of the sustaining rangeland ecosystems symposium. SR953. Corvallis,OR: Oregon State University: 166-168.
Johnson, B.K.; Kern, J.W.; Wisdom, M.J. [et al.]. 2000. Resource selection andspatial separation of mule deer and elk in spring. Journal of Wildlife Management.64: 685-697.
Johnson, C.G., Jr.; Hall, F.C. 1990. Plant associations of the Blue Mountains. R6 Ecol.Area 3. Portland, OR: U.S. Department of Agriculture, Forest Service, Pacific North-west Region. 116 p.
Jones, A. 2000. Effects of cattle grazing on North American arid ecosystems: a quanti-tative review. Western North American Naturalist. 60: 155-164.
Karl, M.G.; Doescher, P.S. 1993. Regulating competition on conifer plantations withprescribed cattle grazing. Forest Science. 39: 405-418.
Keane, R.E.; Long, D.G.; Menakis, J.P. [et al.]. 1996. Simulating course-scale vegeta-tion dynamics using the Columbia River Basin Succession Model–CRBSUM. Gen.Tech. Rep. INT-GTR-340. Ogden, UT: U.S. Department of Agriculture, Forest Service,Intermountain Research Station. 50 p.
Krueger, J.K.; Bedunah, D.J. 1988. Influence of forest site on total nonstructural carbo-hydrate levels of pinegrass, elk sedge, and snowberry. Journal of Range Management.41: 144-149.
101
Krusi, B.O.; Schutz, M.; Gramiger, H.; Achermann, G. 1996. Was bedeuten Huftierefur den Lebensraum National Park. Cratschla. 4: 51-64.
Kueffer, C. 2000. Modellierung der Habitatsnutzung des Rothirsches Cervus elaphus L.im Gebiet des Schweizerischen Nationalparkes—Ein individuenbasierter Ansatz. ETHZurich: Institute of Terrestrial Ecology. 230 p. M.S. thesis.
Laycock, W.A. 1991. Stable states and thresholds of range condition on North Americanrangelands: a viewpoint. Journal of Range Management. 44: 427-434.
Mack, R.; Thompson, J. 1982. Evolution in steppe with few large, hooved mammals.American Naturalist. 119: 757-773.
Madany, M.H.; West, N.E. 1983. Livestock grazing-fire regime interactions within mon-tane forests of Zion National Park, UT. Ecology. 64(4): 661-667.
McInnis, M.L.; Quigley, T.M.; Vavra, M.; Sanderson, H.R. 1990. Predicting beef cattlestocking rates and live weight gains on eastern Oregon rangelands: description of amodel. Simulation: 137-145.
National Forest Management Act of 1976 [NFMA]; Act of October 22, 1976; 16U.S.C. 1600.
Nelson, J.R.; Leege, T.A. 1982. Nutritional requirements and food habitats. In: Thomas,J.W.; Toweill, D.E., eds. Elk of North America: ecology and management. Harrisburg,PA: Stockdale Press: 323-368.
Parks, C.G.; Bednar, L.; Tiedemann, A.R. 1998. Browsing ungulates–an importantconsideration in dieback and mortality of Pacific yew (Taxus brevifolia) in a north-eastern Oregon stand. Northwest Science. 72: 190-197.
Peek, J.M.; Johnson, F.D.; Pence, N.N. 1978. Successional trends in a ponderosapine/bitterbrush community related to grazing by livestock, wildlife, and to fire. Journalof Range Management. 31: 49-53.
Pyke, D.A.; Zamora, B.A. 1982. Relationships between overstory structure and under-story production in the grand fir/myrtle boxwood habitat type of northcentral Idaho.Journal of Range Management. 35: 769-773.
Quigley, T.M.; Arbelbide, S.J., tech. eds. 1997. An assessment of ecosystem compo-nents in the interior Columbia basin and portions of the Klamath and Great Basins.Gen. Tech. Rep. PNW-GTR-405. Portland, OR: U.S. Department of Agriculture, ForestService, Pacific Northwest Research Station. 335 p. Vol 1. (Quigley, T.M., tech. ed.;Interior Columbia Basin Ecosystem Management Project: scientific assessment).
Riggs, R.; Tiedemann, A.R.; Cook, J.G. [et al.]. 2000. Modification of mixed-coniferforests by ruminant herbivores in the Blue Mountains ecological province. Res. Pap.PNW-RP-527. Portland, OR: U.S. Department of Agriculture, Forest Service, PacificNorthwest Research Station. 77 p.
Rowland, M.M.; Wisdom, M.J.; Johnson, B.K.; Kie, J.G. 2000. Elk distribution andmodeling in relation to roads. Journal of Wildlife Management. 64: 672-684.
Rummell, R.S. 1951. Some effects of livestock grazing on ponderosa pine forest andrange in central Washington. Ecology. 32(4): 594-607.

102
Savage, M.; Swetnam, T.W. 1990. Early 19th century fire decline following sheeppasturing in Navajo ponderosa pine forest. Ecology. 71(6): 2374-2378.
Schreiner, E.G.; Krueger, K.A.; Happe, P.J.; Houston, D.B. 1996. Understory patchdynamics and ungulate herbivory in old-growth forests of Olympic National Park,Washington. Canadian Journal of Forest Research. 26: 255-265.
Seagle, S.W.; McNaughton, S.J. 1992. Spatial variation in forage nutrient concentra-tions and the distribution of Serengeti grazing ungulates. Landscape Ecology.7: 229-241.
Sheehy, D.P. 1987. Grazing relationships of elk, deer, and cattle on seasonal range-lands in northeastern Oregon. Corvallis, OR: Oregon State University. 269 p. Ph.D.dissertation.
Shipley, L.A.; Spalinger, D.E. 1995. Influence of size and density of browse patcheson intake rates and foraging decisions of young moose and white-tailed deer.Oecologia. 104: 112-121.
Skovlin, J.M. 1967. Fluctuations in forage quality on summer range in the Blue Moun-tains. Res. Pap. PNW-44. Portland, OR: U.S. Department of Agriculture, Forest Ser-vice, Pacific Northwest Forest and Range Experiment Station. 20 p.
Spalinger, D.E.; Hobbs, N.T. 1992. Mechanisms of foraging in mammalian herbivores:new models of functional response. American Naturalist. 140: 325-348.
Svejcar, T.; Vavra, M. 1985. Seasonal forage production and quality on four native andimproved plant communities. Tech. Bull. 149. Corvallis, OR: Oregon State University,Agricultural Experiment Station. 24 p.
Urness, P.J. 1984. Managing lodgepole pine ecosystems for game and range values.In: Baumgartner, D.M.; Krebill, R.G.; Arnott, J.T.; Westman, G.F., eds. Lodgepolepine: the species and its management. Pullman, WA: Washington State University:297-304.
Van Dyne, G.M.; Burch, W.; Fairfax, S.K.; Huey, W. 1984a. Forage allocation on aridand semiarid public grazing lands: summary and recommendations. In: National Re-search Council/National Academy of Sciences, eds. Developing strategies for range-land management. Boulder, CO: Westview Press: 1-26.
Van Dyne, G.M.; Kortopates, P.T.; Smith, F.M. 1984b. Quantitative frameworks forforage allocation. In: National Research Council/National Academy of Sciences,eds. Developing strategies for rangeland management. Boulder, CO: WestviewPress: 289-416.
Wallmo, O.C.; Carpenter, L.H.; Regelin, W.L. [et al.]. 1977. Evaluation of deerhabitat on a nutritional basis. Journal of Range Management. 30: 122-127.
Walton, R.L. 1962. The seasonal yield and nutrient content of native forage species inrelation to their synecology. Corvallis, OR: Oregon State University. 92 p. M.S. thesis.
Westenskow, K.J. 1991. Conditioning bunchgrass on elk winter range. Corvallis, OR:Oregon State University. 109 p. M.S. thesis.

103
Westoby, M.; Walker, B.; Noy-Meir, I. 1989. Opportunistic management for rangelandsnot at equilibrium. Journal of Range Management. 42: 266-276.
Wisdom, M.J. 1998. Assessing life-stage importance and resource selection for con-servation of selected vertebrates. Moscow, ID: University of Idaho. 118 p. Ph.D.dissertation.
Wisdom, M.J.; Holthausen, R.S.; Wales, B.C. [et al.]. 2000. Source habitats for ter-restrial vertebrates of focus in the interior Columbia basin: broad-scale trends andmanagement implications. Gen. Tech. Rep. PNW-GTR-485. Portland, OR: U.S. De-partment of Agriculture, Forest Service, Pacific Northwest Research Station. 156 p.Vol. 1. (Quigley, T.M., tech ed.; Interior Columbia Basin Ecosystem ManagementProject: scientific assessment).
Woodward, A.; Schreiner, E.G.; Houston, D.B.; Moorhead, B.B. 1994. Ungulate-forest relationships in Olympic National Park: retrospective exclosure studies.Northwest Science. 68: 97-110.
Zimmerman, G.T.; Neueschwander, L.F. 1984.Livestock grazing influences oncommunity structure, fire intensity, and fire frequency within the Douglas-fir/ninebarkhabitat type. Journal of Range Management. 37: 104-110.
Click to continue