methodologies and preliminary results of the … · methodologies and preliminary results of the...
TRANSCRIPT
Northeast Fisheries Science Center Reference Document 07-02
Methodologies and Preliminary Resultsof the NOAA National Marine Fisheries Service
Aerial Survey Programfor Right Whales (Eubalaena glacialis)
in the Northeast U.S., 1998-2006
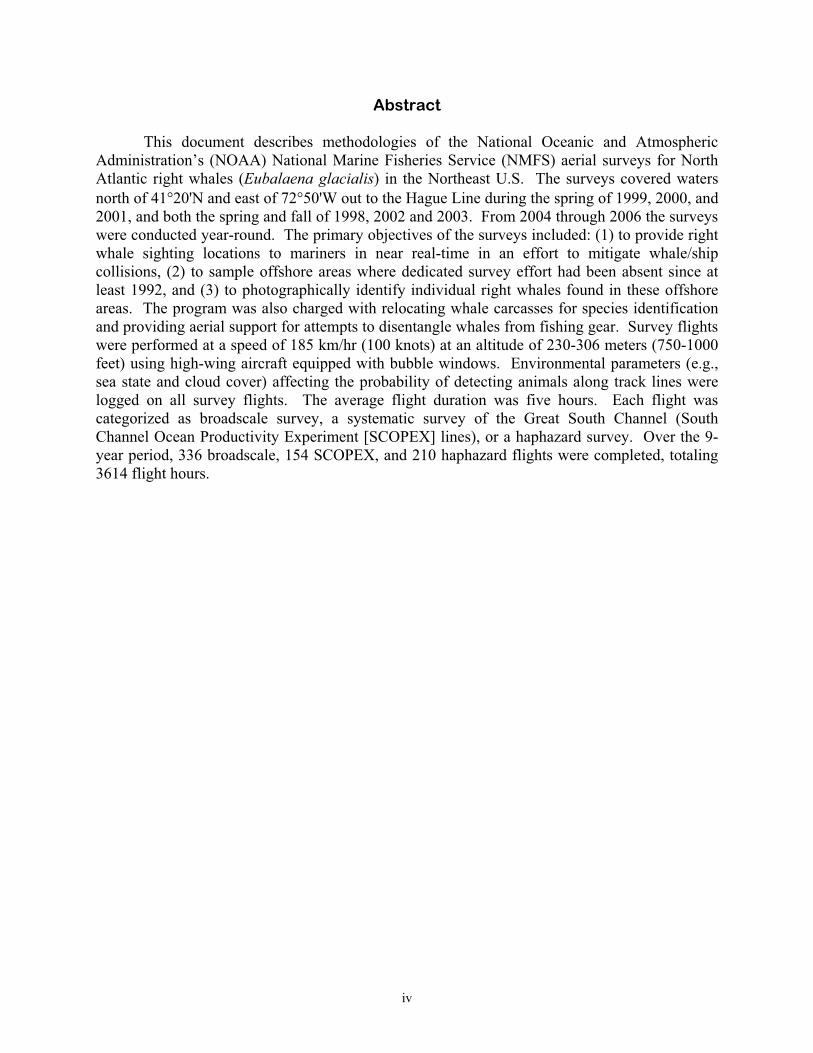
Right whale surface active group. Photo credit: NOAA Fisheries/NEFSC/Protected Species Branch.
by Timothy V.N. Cole, Patricia Gerrior, and Richard L. Merrick
January 2007


Northeast Fisheries Science Center Reference Document 07-02
U.S. DEPARTMENT OF COMMERCENational Oceanic and Atmospheric Administration
National Marine Fisheries ServiceNortheast Fisheries Science Center
Woods Hole, Massachusetts
January 2007
Methodologies and Preliminary Resultsof the NOAA National Marine Fisheries Service
Aerial Survey Programfor Right Whales (Eubalaena glacialis)
in the Northeast U.S., 1998-2006
by Timothy V.N. Cole, Patricia Gerrior, and Richard L. Merrick
National Marine Fisheries Serv., Woods Hole Lab., 166 Water St., Woods Hole MA 02543-1026

Northeast Fisheries Science Center Reference Documents
This series is a secondary scientific series designed to assure the long-term documentation and to enable the timely transmission of research results by Center and/or non-Center researchers, where such results bear upon the research mission of the Center (see the outside back cover for the mission statement). These documents receive internal scientific review, and most receive copy editing. The National Marine Fisheries Service does not endorse any proprietary material, process, or product mentioned in these documents. All documents issued in this series since April 2001, and several documents issued prior to that date, have been copublished in both paper and electronic versions. To access the electronic version of a document in this series, go to http://www.nefsc.noaa.gov/nefsc/publications/. The electronic version is available in PDF format to permit printing of a paper copy directly from the Internet. If you do not have Internet access, or if a desired document is one of the pre-April 2001 documents available only in the paper version, you can obtain a paper copy by contacting the senior Center author of the desired document. Refer to the title page of the document for the senior Center author’s name and mailing address. If there is no Center author, or if there is corporate (i.e., non-individualized) authorship, then contact the Center’s Woods Hole Labora-tory Library (166 Water St., Woods Hole, MA 02543-1026).
This document’s publication history is as follows: manuscript submitted for review September 15, 2006; manuscript accepted through technical review September 29, 2006; manuscript ac-cepted through policy review January 3, 2007; and final copy submitted for publication January 3, 2007. This document may be cited as:
Cole TVN, Gerrior P, Merrick RL. 2007. Methodologies and preliminary results of the NOAA National Marine Fisheries Service aerial survey program for right whales (Eubalaena glacialis) in the northeast U.S., 1998-2006. U.S. Dep. Commer., North-east Fish. Sci. Cent. Ref. Doc. 07-02; 11 p. Available from: National Marine Fisheries Service, 166 Water Street, Woods Hole, MA 02543-1026.

iii
Table of Contents
Abstract .......................................................................................................................................... iv Introduction......................................................................................................................................1 Platform and Survey Teams.............................................................................................................1 Survey Design..................................................................................................................................2 Effort and Sighting Data Collection ................................................................................................3 Data Processing................................................................................................................................7 Individual Identification of Right Whales .......................................................................................7 Results and Discussion ....................................................................................................................7 Acknowledgments..........................................................................................................................10 Literature Cited ..............................................................................................................................10
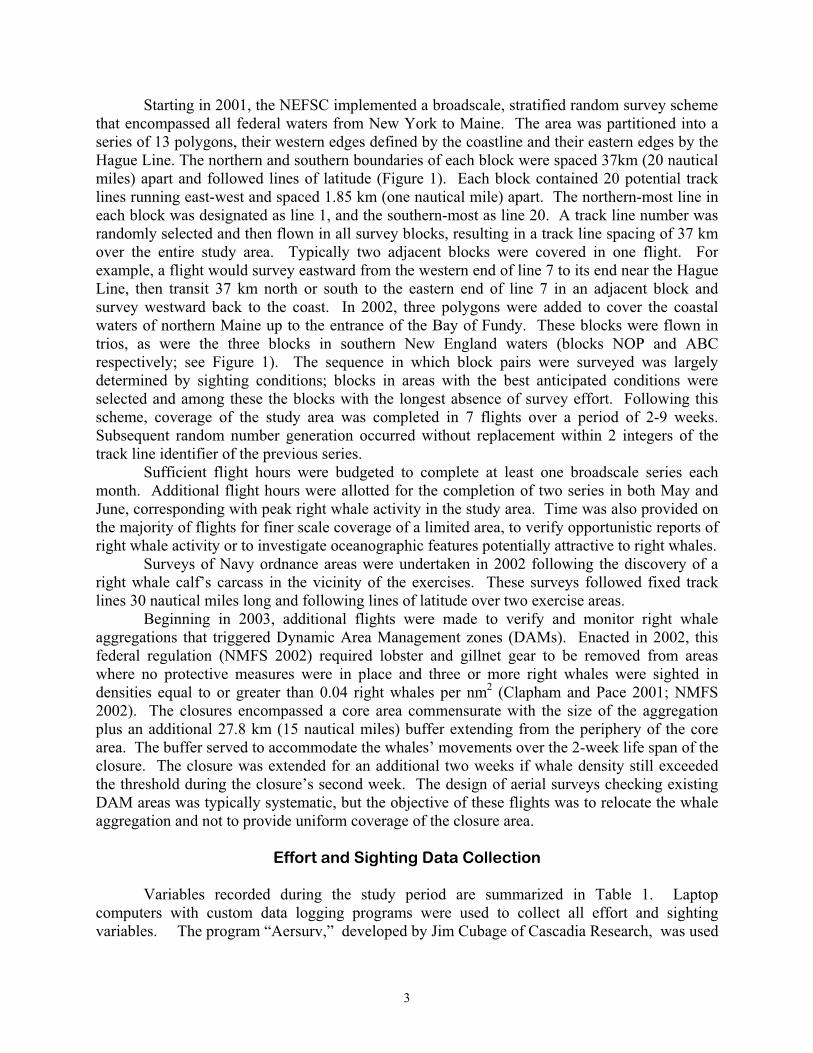
Tables Table 1. Summary of NOAA right whale aerial survey effort and data collection from 1998
through 2006 ..................................................................................................................4
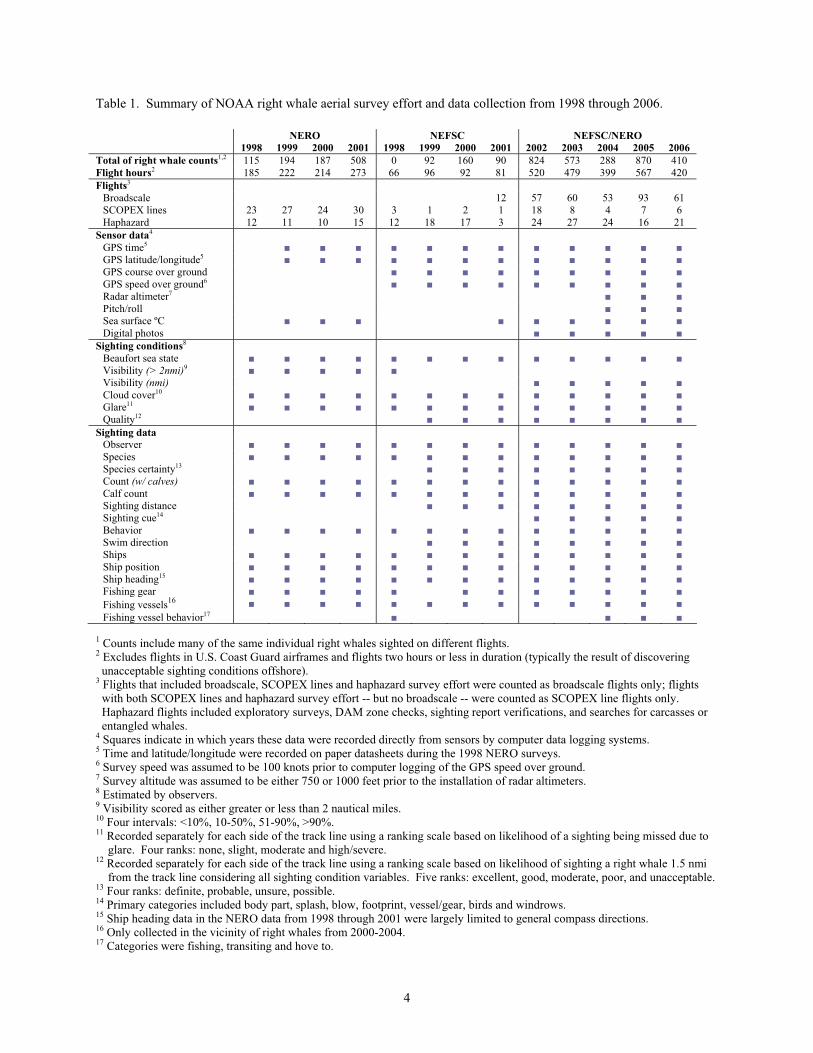
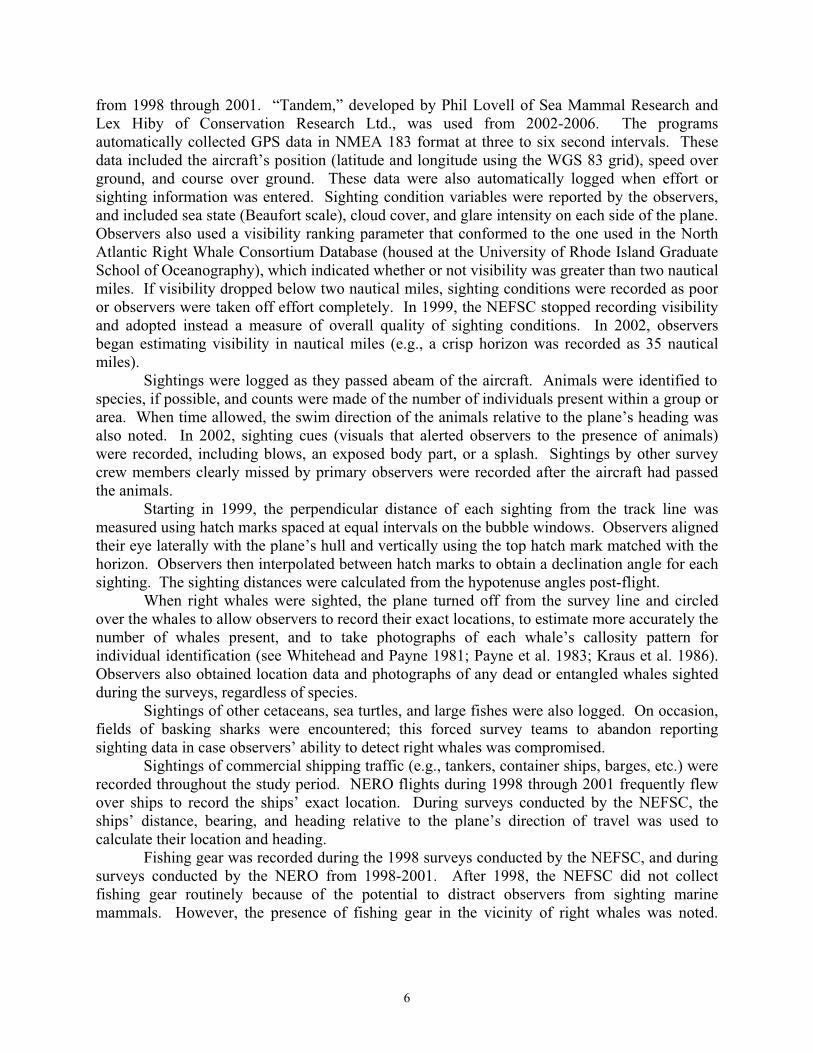
Figures Figure 1. The study area and geographic features.........................................................................2 Figure 2. NOAA aerial survey effort and right whale sightings 1998-2006.................................5
iv
Abstract This document describes methodologies of the National Oceanic and Atmospheric
Administration’s (NOAA) National Marine Fisheries Service (NMFS) aerial surveys for North Atlantic right whales (Eubalaena glacialis) in the Northeast U.S. The surveys covered waters north of 41�20'N and east of 72�50'W out to the Hague Line during the spring of 1999, 2000, and 2001, and both the spring and fall of 1998, 2002 and 2003. From 2004 through 2006 the surveys were conducted year-round. The primary objectives of the surveys included: (1) to provide right whale sighting locations to mariners in near real-time in an effort to mitigate whale/ship collisions, (2) to sample offshore areas where dedicated survey effort had been absent since at least 1992, and (3) to photographically identify individual right whales found in these offshore areas. The program was also charged with relocating whale carcasses for species identification and providing aerial support for attempts to disentangle whales from fishing gear. Survey flights were performed at a speed of 185 km/hr (100 knots) at an altitude of 230-306 meters (750-1000 feet) using high-wing aircraft equipped with bubble windows. Environmental parameters (e.g., sea state and cloud cover) affecting the probability of detecting animals along track lines were logged on all survey flights. The average flight duration was five hours. Each flight was categorized as broadscale survey, a systematic survey of the Great South Channel (South Channel Ocean Productivity Experiment [SCOPEX] lines), or a haphazard survey. Over the 9-year period, 336 broadscale, 154 SCOPEX, and 210 haphazard flights were completed, totaling 3614 flight hours.
1
Introduction
Ship strikes are a major source of mortality for the highly endangered North Atlantic right whale (Eubalaena glacialis) (Knowlton and Kraus 2001; Moore et al. 2004; NMFS 2005; Cole et al. 2005, 2006). To prevent collisions between ships and right whales, the NOAA National Marine Fisheries Service’s Northeast Regional Office (NERO) began the Right Whale Sighting Advisory System in 1997. The system alerted mariners of reported locations of right whales and requested that caution be used when transiting areas where the sightings occurred. Reports were received from a variety of sources including whale watches, Coast Guard patrols, fishing vessels, commercial ships, and the general public. Alerts were distributed by email, fax, NOAA Weather Radio, and Coast Guard Broadcast Notice to Mariners. In 2001, alert distribution was expanded to include the Mandatory Ship Reporting system (USCG 2001), which relayed sighting locations to ships that were transiting through, or adjacent to, right whale critical habitat areas (NMFS 1997).
To augment the sighting reports to the advisory system, in December 1997 the NERO began conducting aerial surveys for right whales in Cape Cod Bay and along the western side of the Great South Channel with a NOAA observer aboard U.S. Coast Guard helicopters. In 1998 the effort was expanded, using a dedicated plane to cover a greater portion of the Great South Channel where commercial shipping traffic frequently bisects designated critical habitat for the whales. In the same year, the NOAA Northeast Fisheries Science Center (NEFSC) began a companion aerial survey program with a second plane to provide comprehensive right whale photographic mark-recapture data from the Great South Channel. Despite this region’s importance to the species (see Kenney et al. 1995), survey effort had been largely absent there since the early 1990s.
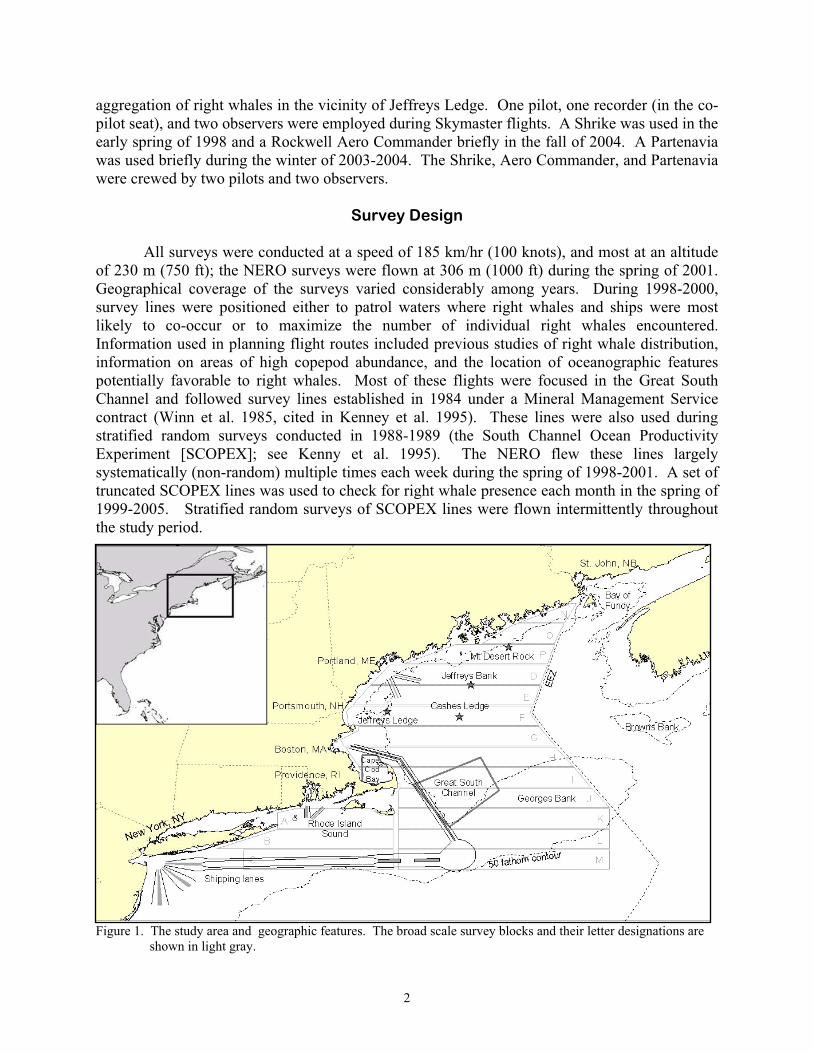
The NOAA surveys also covered other offshore areas that had previously received little effort but were potentially of secondary importance to right whales. These areas included several offshore banks and ledges in the Gulf of Maine, regions around the periphery of Georges Bank, and the waters south of Massachusetts, Rhode Island, and Long Island NY (Figure 1).
Prior to 2001 the NOAA surveys were often directed by reports of right whales from other sources (e.g., Coast Guard and private boaters). Many flights were speculative, searching areas with features frequently associated with right whales such as 50-fathom contours, strong sea surface temperature fronts, or reports of high concentrations of late stage Calanusfinmarchicus copepodites (the right whale’s primary prey).
Although right whales were frequently found and photographed during these flights, such haphazard surveys provided a poor basis for quantifying right whale distribution. To provide more robust distribution data, the NEFSC implemented a systematic, broadscale survey of the entire Gulf of Maine-Georges Bank study area in 2001. In 2002, the NERO and NEFSC surveys were combined into a single program, and the broadscale survey effort was expanded.
Platforms and Survey Teams
High-wing aircraft were used, primarily DeHavilland Twin Otters, a Grumman Widgeon, and a Grumman Goose. The planes were equipped with bubble windows on each side to provide observers a good view both ahead and abeam of the aircraft. The crew consisted of two pilots, a data recorder, and two observers (one positioned on either side of the plane). A Cessna Skymaster 337 without bubble windows was used briefly late in 2002 for monitoring an
2
aggregation of right whales in the vicinity of Jeffreys Ledge. One pilot, one recorder (in the co-pilot seat), and two observers were employed during Skymaster flights. A Shrike was used in the early spring of 1998 and a Rockwell Aero Commander briefly in the fall of 2004. A Partenavia was used briefly during the winter of 2003-2004. The Shrike, Aero Commander, and Partenavia were crewed by two pilots and two observers.
Survey Design All surveys were conducted at a speed of 185 km/hr (100 knots), and most at an altitude
of 230 m (750 ft); the NERO surveys were flown at 306 m (1000 ft) during the spring of 2001. Geographical coverage of the surveys varied considerably among years. During 1998-2000, survey lines were positioned either to patrol waters where right whales and ships were most likely to co-occur or to maximize the number of individual right whales encountered. Information used in planning flight routes included previous studies of right whale distribution, information on areas of high copepod abundance, and the location of oceanographic features potentially favorable to right whales. Most of these flights were focused in the Great South Channel and followed survey lines established in 1984 under a Mineral Management Service contract (Winn et al. 1985, cited in Kenney et al. 1995). These lines were also used during stratified random surveys conducted in 1988-1989 (the South Channel Ocean Productivity Experiment [SCOPEX]; see Kenny et al. 1995). The NERO flew these lines largely systematically (non-random) multiple times each week during the spring of 1998-2001. A set of truncated SCOPEX lines was used to check for right whale presence each month in the spring of 1999-2005. Stratified random surveys of SCOPEX lines were flown intermittently throughout the study period.
Figure 1. The study area and geographic features. The broad scale survey blocks and their letter designations are shown in light gray.
3
Starting in 2001, the NEFSC implemented a broadscale, stratified random survey scheme that encompassed all federal waters from New York to Maine. The area was partitioned into a series of 13 polygons, their western edges defined by the coastline and their eastern edges by the Hague Line. The northern and southern boundaries of each block were spaced 37km (20 nautical miles) apart and followed lines of latitude (Figure 1). Each block contained 20 potential track lines running east-west and spaced 1.85 km (one nautical mile) apart. The northern-most line in each block was designated as line 1, and the southern-most as line 20. A track line number was randomly selected and then flown in all survey blocks, resulting in a track line spacing of 37 km over the entire study area. Typically two adjacent blocks were covered in one flight. For example, a flight would survey eastward from the western end of line 7 to its end near the Hague Line, then transit 37 km north or south to the eastern end of line 7 in an adjacent block and survey westward back to the coast. In 2002, three polygons were added to cover the coastal waters of northern Maine up to the entrance of the Bay of Fundy. These blocks were flown in trios, as were the three blocks in southern New England waters (blocks NOP and ABC respectively; see Figure 1). The sequence in which block pairs were surveyed was largely determined by sighting conditions; blocks in areas with the best anticipated conditions were selected and among these the blocks with the longest absence of survey effort. Following this scheme, coverage of the study area was completed in 7 flights over a period of 2-9 weeks. Subsequent random number generation occurred without replacement within 2 integers of the track line identifier of the previous series.
Sufficient flight hours were budgeted to complete at least one broadscale series each month. Additional flight hours were allotted for the completion of two series in both May and June, corresponding with peak right whale activity in the study area. Time was also provided on the majority of flights for finer scale coverage of a limited area, to verify opportunistic reports of right whale activity or to investigate oceanographic features potentially attractive to right whales.
Surveys of Navy ordnance areas were undertaken in 2002 following the discovery of a right whale calf’s carcass in the vicinity of the exercises. These surveys followed fixed track lines 30 nautical miles long and following lines of latitude over two exercise areas.
Beginning in 2003, additional flights were made to verify and monitor right whale aggregations that triggered Dynamic Area Management zones (DAMs). Enacted in 2002, this federal regulation (NMFS 2002) required lobster and gillnet gear to be removed from areas where no protective measures were in place and three or more right whales were sighted in densities equal to or greater than 0.04 right whales per nm2 (Clapham and Pace 2001; NMFS 2002). The closures encompassed a core area commensurate with the size of the aggregation plus an additional 27.8 km (15 nautical miles) buffer extending from the periphery of the core area. The buffer served to accommodate the whales’ movements over the 2-week life span of the closure. The closure was extended for an additional two weeks if whale density still exceeded the threshold during the closure’s second week. The design of aerial surveys checking existing DAM areas was typically systematic, but the objective of these flights was to relocate the whale aggregation and not to provide uniform coverage of the closure area.
Effort and Sighting Data Collection
Variables recorded during the study period are summarized in Table 1. Laptop computers with custom data logging programs were used to collect all effort and sighting variables. The program “Aersurv,” developed by Jim Cubage of Cascadia Research, was used
4
Table 1. Summary of NOAA right whale aerial survey effort and data collection from 1998 through 2006. NERO NEFSC NEFSC/NERO 1998 1999 2000 2001 1998 1999 2000 2001 2002 2003 2004 2005 2006 Total of right whale counts1,2 115 194 187 508 0 92 160 90 824 573 288 870 410 Flight hours2 185 222 214 273 66 96 92 81 520 479 399 567 420 Flights3
Broadscale 12 57 60 53 93 61 SCOPEX lines 23 27 24 30 3 1 2 1 18 8 4 7 6 Haphazard 12 11 10 15 12 18 17 3 24 27 24 16 21
Sensor data4 GPS time5 ■ ■ ■ ■ ■ ■ ■ ■ ■ ■ ■ ■ GPS latitude/longitude5 ■ ■ ■ ■ ■ ■ ■ ■ ■ ■ ■ ■ GPS course over ground ■ ■ ■ ■ ■ ■ ■ ■ ■ GPS speed over ground6 ■ ■ ■ ■ ■ ■ ■ ■ ■ Radar altimeter7 ■ ■ ■ Pitch/roll ■ ■ ■ Sea surface ºC ■ ■ ■ ■ ■ ■ ■ ■ ■ Digital photos ■ ■ ■ ■ ■
Sighting conditions8 Beaufort sea state ■ ■ ■ ■ ■ ■ ■ ■ ■ ■ ■ ■ ■ Visibility (> 2nmi)9 ■ ■ ■ ■ ■ Visibility (nmi) ■ ■ ■ ■ ■ Cloud cover10 ■ ■ ■ ■ ■ ■ ■ ■ ■ ■ ■ ■ ■ Glare11 ■ ■ ■ ■ ■ ■ ■ ■ ■ ■ ■ ■ ■ Quality12 ■ ■ ■ ■ ■ ■ ■ ■
Sighting data Observer ■ ■ ■ ■ ■ ■ ■ ■ ■ ■ ■ ■ ■ Species ■ ■ ■ ■ ■ ■ ■ ■ ■ ■ ■ ■ ■ Species certainty13 ■ ■ ■ ■ ■ ■ ■ ■ Count (w/ calves) ■ ■ ■ ■ ■ ■ ■ ■ ■ ■ ■ ■ ■ Calf count ■ ■ ■ ■ ■ ■ ■ ■ ■ ■ ■ ■ ■ Sighting distance ■ ■ ■ ■ ■ ■ ■ ■ Sighting cue14 ■ ■ ■ ■ ■ Behavior ■ ■ ■ ■ ■ ■ ■ ■ ■ ■ ■ ■ ■ Swim direction ■ ■ ■ ■ ■ ■ ■ ■ Ships ■ ■ ■ ■ ■ ■ ■ ■ ■ ■ ■ ■ ■ Ship position ■ ■ ■ ■ ■ ■ ■ ■ ■ ■ ■ ■ ■ Ship heading15 ■ ■ ■ ■ ■ ■ ■ ■ ■ ■ ■ ■ ■ Fishing gear ■ ■ ■ ■ ■ ■ ■ ■ ■ ■ ■ ■ Fishing vessels16 ■ ■ ■ ■ ■ ■ ■ ■ ■ ■ ■ ■ ■ Fishing vessel behavior17 ■ ■ ■ ■
1 Counts include many of the same individual right whales sighted on different flights. 2 Excludes flights in U.S. Coast Guard airframes and flights two hours or less in duration (typically the result of discovering unacceptable sighting conditions offshore). 3 Flights that included broadscale, SCOPEX lines and haphazard survey effort were counted as broadscale flights only; flights with both SCOPEX lines and haphazard survey effort -- but no broadscale -- were counted as SCOPEX line flights only. Haphazard flights included exploratory surveys, DAM zone checks, sighting report verifications, and searches for carcasses or entangled whales. 4 Squares indicate in which years these data were recorded directly from sensors by computer data logging systems. 5 Time and latitude/longitude were recorded on paper datasheets during the 1998 NERO surveys. 6 Survey speed was assumed to be 100 knots prior to computer logging of the GPS speed over ground. 7 Survey altitude was assumed to be either 750 or 1000 feet prior to the installation of radar altimeters. 8 Estimated by observers. 9 Visibility scored as either greater or less than 2 nautical miles. 10 Four intervals: <10%, 10-50%, 51-90%, >90%. 11 Recorded separately for each side of the track line using a ranking scale based on likelihood of a sighting being missed due to glare. Four ranks: none, slight, moderate and high/severe. 12 Recorded separately for each side of the track line using a ranking scale based on likelihood of sighting a right whale 1.5 nmi from the track line considering all sighting condition variables. Five ranks: excellent, good, moderate, poor, and unacceptable. 13 Four ranks: definite, probable, unsure, possible. 14 Primary categories included body part, splash, blow, footprint, vessel/gear, birds and windrows. 15 Ship heading data in the NERO data from 1998 through 2001 were largely limited to general compass directions. 16 Only collected in the vicinity of right whales from 2000-2004. 17 Categories were fishing, transiting and hove to.

5
1998Mar – JunOct - Nov
2002Mar – JulSep - Dec
1999Mar – Jun
2003Apr – JulSep - Nov
2000Mar - Jun
2004Mar – JunSep - Dec
2001Mar - Jul
2005Jan - Dec
KEY g = Right whale sightings Jan, Feb, Sep-Dec Y = Right whale sightings Mar-Aug Note: Observers were not on effort during some transits (diagonal lines) shown in these plots.
2006Jan – JulSep - Dec
Figure 2. NOAA aerial survey effort and right whale sightings 1998-2006. The months noted on the plots for
each year include only those months in which 3 or more flights were made.
6
from 1998 through 2001. “Tandem,” developed by Phil Lovell of Sea Mammal Research and Lex Hiby of Conservation Research Ltd., was used from 2002-2006. The programs automatically collected GPS data in NMEA 183 format at three to six second intervals. These data included the aircraft’s position (latitude and longitude using the WGS 83 grid), speed over ground, and course over ground. These data were also automatically logged when effort or sighting information was entered. Sighting condition variables were reported by the observers, and included sea state (Beaufort scale), cloud cover, and glare intensity on each side of the plane. Observers also used a visibility ranking parameter that conformed to the one used in the North Atlantic Right Whale Consortium Database (housed at the University of Rhode Island Graduate School of Oceanography), which indicated whether or not visibility was greater than two nautical miles. If visibility dropped below two nautical miles, sighting conditions were recorded as poor or observers were taken off effort completely. In 1999, the NEFSC stopped recording visibility and adopted instead a measure of overall quality of sighting conditions. In 2002, observers began estimating visibility in nautical miles (e.g., a crisp horizon was recorded as 35 nautical miles).
Sightings were logged as they passed abeam of the aircraft. Animals were identified to species, if possible, and counts were made of the number of individuals present within a group or area. When time allowed, the swim direction of the animals relative to the plane’s heading was also noted. In 2002, sighting cues (visuals that alerted observers to the presence of animals) were recorded, including blows, an exposed body part, or a splash. Sightings by other survey crew members clearly missed by primary observers were recorded after the aircraft had passed the animals.
Starting in 1999, the perpendicular distance of each sighting from the track line was measured using hatch marks spaced at equal intervals on the bubble windows. Observers aligned their eye laterally with the plane’s hull and vertically using the top hatch mark matched with the horizon. Observers then interpolated between hatch marks to obtain a declination angle for each sighting. The sighting distances were calculated from the hypotenuse angles post-flight.
When right whales were sighted, the plane turned off from the survey line and circled over the whales to allow observers to record their exact locations, to estimate more accurately the number of whales present, and to take photographs of each whale’s callosity pattern for individual identification (see Whitehead and Payne 1981; Payne et al. 1983; Kraus et al. 1986). Observers also obtained location data and photographs of any dead or entangled whales sighted during the surveys, regardless of species.
Sightings of other cetaceans, sea turtles, and large fishes were also logged. On occasion, fields of basking sharks were encountered; this forced survey teams to abandon reporting sighting data in case observers’ ability to detect right whales was compromised.
Sightings of commercial shipping traffic (e.g., tankers, container ships, barges, etc.) were recorded throughout the study period. NERO flights during 1998 through 2001 frequently flew over ships to record the ships’ exact location. During surveys conducted by the NEFSC, the ships’ distance, bearing, and heading relative to the plane’s direction of travel was used to calculate their location and heading.
Fishing gear was recorded during the 1998 surveys conducted by the NEFSC, and during surveys conducted by the NERO from 1998-2001. After 1998, the NEFSC did not collect fishing gear routinely because of the potential to distract observers from sighting marine mammals. However, the presence of fishing gear in the vicinity of right whales was noted.
7
Starting in 2005, fishing gear was collected as gear fields when individual pieces became too numerous to count. From 2004-2006 fishing vessels were recorded as a proxy of fishing effort.
From 1999-2003, sea surface temperature (SST) was recorded somewhat routinely using an MS Visual Basic program to query a Linear Laboratories MX6 (0-5 VDC) infrared sensor. The program queried the sensor every two seconds and recorded an average value for each minute. These SST data were merged with the sighting and effort data by time using a Statistical Analysis Software© script. From 2004 through 2006 a program written by Ken Prada of Upper Cape Systems was used; this program simultaneously collected and merged all GPS, SST, and plane pitch and roll data. Pitch and roll measurements were recorded from an HL Planartechnik NS-15/E2 dual axis digital inclinometer.
Data Processing
Each flight’s effort, sightings, and GPS data were merged and downloaded into Microsoft Excel spreadsheets. Observers reviewed each flight’s data for errors and made corrections. The audited data from each flight were concatenated into a single database and submitted to the Consortium database at the end of each survey season. All data were also loaded into an Oracle database at the NEFSC.
Individual Identification of Right Whales
Prior to fall 2002, slide film was used to collect images of right whales. The date, time, and latitude and longitude of each image were written on the slide’s cardboard frame. Beginning in fall 2002, the teams switched to digital cameras and merged image file data with GPS files to identify the location of each image. All images of right whales were submitted to the New England Aquarium (NEAq) in Boston, Massachusetts, for matching to the North Atlantic Right Whale Catalog. NEAq staff returned the matching status and identification of the right whales photographed by the NOAA survey teams upon request.
Results and Discussion Table 1 summarizes the NOAA right whale aerial survey effort in the Northeast U.S. From spring 1998 to the end of 2006, 3614 hours were logged over 700 flights. The total of right whale counts from these flights was 4311. These counts include many of the same individual right whales sighted on different flights. Figure 2 depicts the survey effort and right whale sighting locations and illustrates the progression from haphazard surveys to more systematic coverage of the region over the period. Flights two hours or less in duration were excluded; these short flights were typically the result of encountering unacceptable sighting conditions offshore. Totals of right whale counts from each year are not directly comparable due to differences in survey objectives and recording protocols. The majority of surveys conducted during 1998-2001 focused on surveying SCOPEX lines, locating right whales, and surveying areas where right whales or high densities of copepods had been reported. Comparison to and between haphazard surveys is further complicated by differences in the level of pre-flight knowledge of whale presence, which varied from reliable reports received the day before a flight to historical accounts of right whale sightings. Any comparison of sightings per unit effort

8
(SPUE) is unbiased only when systematic survey data are used, such as those from the SCOPEX and broadscale survey lines. The broadscale surveys also provide the best indication of relative vessel collision and entanglement risks within the region. Although the coarse coverage of the broadscale surveys undoubtedly missed some areas where whales were present for short periods or dispersed in small groups, larger aggregations of right whales were more likely to be detected. Larger groups of whales increase the likelihood of a whale being at the surface and available for detection, and right whale aggregations tend to persist within small (18-35 km) geographic areas for periods of weeks (Clapham and Pace 2001), extending their availability for detection in time. Collision and entanglement risk is proportional to the density of whales present and the duration of their residency; the longer whales remain in an area the more likely a vessel will transit through the area or a whale will encounter fishing gear set within it. Lessons Learned
Surveys were crafted to meet multiple objectives that accumulated over a nine year period. Data collection became more sophisticated and comprehensive in efforts to use the aerial platforms to the fullest extent. Survey protocols changed considerably during the program’s first four years, which led to a cascade of changes in data audit and storage methods. In general, refinements to protocols were engineered to reduce in-flight interpretation of observed events such as re-sightings of individual right whales or the distribution and size of a right whale aggregation. Post-flight data processing was increasingly automated to reduce the potential of human error being introduced. Making these protocol changes was time-intensive as new terms often required discussion and refinement before, during, and after incorporation into the routine. Anyone considering an aerial survey program is encouraged to adopt these protocols, or those of another well-established survey program, in their entirety.
Several different airframes were used over the study period. The DeHavilland Twin Otters alone met the requirements for all operations. In addition to the Widgeon, Goose, and Otters, the teams occasionally made use of Skymasters, an Aero Commander and a Partenavia. However, these smaller airframes could not truly accommodate two pilots and three science crew; although room could be made in the back where a recorder might sit, emergency egress would be difficult. These smaller airframes were used only during periods when larger airframes were not available, to confirm that right whales were still present in closure areas. Data recording was greatly simplified on these flights so that only two science crew members were needed and a two-pilot safety measure was maintained. For track line surveys, the Otters afforded both an unobstructed view perpendicular to the track line as well as ahead of the plane through 24 x 18” bubble windows. The Widgeon and Goose were also equipped with bubble windows, but these were too small to allow a clear view forward. Both the Skymaster and the Partenavia had flat windows where observers were stationed, making forward viewing difficult. The Shrike and Aero Commander had flat windows as well, and an added detraction of engine nacelles that limited the observers’ view perpendicular to the track line during flat and level flying. The Otters, Goose, and Widgeon were equipped with opening windows aft to allow the science crew to obtain clear photographs of right whales for photo identification. The Partenavia had only one opening window at the co-pilot seat, but the team opted to shoot through a flat window in the back (with poor results) rather than have the co-pilot abandon monitoring the flight instrumentation while circling over whales. The Skymaster had opening windows for the
9
pilots, but concern of any debris reaching the aft propeller required they stay shut. The back windows were of decent optical quality and introduced little distortion to images taken through them. The Aero Commander had only fixed windows and their properties created too much distortion to obtain useful photographs. The Skymaster’s tight circling ability facilitated positioning for obtaining good photographs of whales. The Shrike and Partenavia were likely a close second in maneuverability (their pilots didn’t have whale circling experience), and the Otters a somewhat distant third. The Widgeon and Goose could not circle tightly, and getting good whale images was difficult even with their opening windows and the use of very good camera equipment. Using a handheld camera from an open side window was the preferred method for photographic capture of individual right whales, as photographers could track a whale through the viewfinder while waiting for it to surface. Using a 300mm lens to increase the subject whale’s size within the frame provided greater resolution for photo identification and scarring rate analyses. Photogrammetric data collection was conducted following thorough photographic capture of individual right whales using handheld cameras. A successful capture using the photogrammetric system depended on the whale surfacing nearly simultaneous to the plane passing overhead. To increase the likelihood of capture and avoid lens distortion, an 85mm lens was used, which yielded a much smaller image of the whale within the frame. Flights to relocate carcasses were typically flown at an altitude of 457 m (1500 ft) to increase observers’ oblique visual range for oil slicks generated by whale carcasses. Setting up search patterns for whale carcasses perpendicular to the wind was considered because a windblown slick becomes more detectable when its greatest extent is parallel, rather than perpendicular, to an observer’s line of sight. However, the team felt it was more important to have a means of easily tracking the area covered to avoid duplicating effort, as carcasses often drifted tens of miles over a 24-hour period. An expanding box following lines of latitude and longitude was the easiest search pattern logistically, but expanding arcs were also used with one or two reference points to maintain spacing between survey lines. Various drift models were used to help direct carcass relocation efforts. Relocating active whales entangled in line or netting was much more difficult. Flights to relocate whales for disentanglement attempts were typically unsuccessful. Even if located, observers usually lost track of an entangled whale within a few hours, and once lost they were rarely resighted the same day. It was extremely difficult to successfully hand off an entangled whale to a disentanglement team if their vessel was more than 40 miles away. Tracking an entangled whale was most often successful if it had a telemetry beacon attached to the trailing gear. The directional antenna system installed in the Otters that could detect VHF signals at distances of greater than 20 nautical miles was vital to several disentanglement attempts. The VHF beacons, coupled with satellite position beacons, allowed rescuers to pick when and where a disentanglement attempt might be made successfully. Aerial support provided the assurance that the whale would be found once the disentanglement team was positioned nearby. The most valuable asset to this survey effort was experienced aerial observers. The pace of data collection during aerial surveys and the distance at which whales were observed required a keen ability to both detect whales and identify them to species. Observers with only boat-based survey experience required a few flights with sightings of various whale species to develop the search images to effectively identify whales from the plane. Familiarity with wildlife photography and whale behavior (and a strong stomach) were especially important for

10
photographic capture of individual right whales, disentanglement support and photo documentation of carcasses.
Acknowledgments We are indebted to the observers who spent many hours over the water and many more in the office double checking the data, including Cynthia Christman, Lisa Conger, Rob DiGiovanni, Peter Duley, Holly Fearnbach, Allison Glass, Brett Hayward, Kelly Houle, Brendan Hurley, Amy Knowlton, Brenna Kraus, Keri Lodge, Regina Campbell-Malone, Marilyn Marx, Misty Nelson, Misty Niemeyer, Liz Pomfret, Cathy Quinn, Sara Quinn, Amy Renner, Brenda Rone, Cheryl Ryder, Kent Smedbol, Alison Stimpert, Christopher Tremblay, Peter Trull, Fred Wenzel, and Monica Zani. We also had the observer services of Jon Alberts, Allison Chaillet, G. Childreth, Jason Conner, A. Farak, Tom Fetherston, Andrea Hallett, Brian Hopper, Nate Johnson, Juliette Finzi, Glenn Mitchell, Mia Morete, Dave Potter, Janeen Quintal, Marjorie Rossman, Owen Nichols, Rebecca Scott, Amber Sobrosky, Rob Stephenson, Jonathan Wendland, and Dave Wiley. Expert piloting was provided by Nancy Ash, Chris Barton, Eric Berkowitz, John Bidwell, Nicole Cabana, Bill Clark, B. Cooper, Adam Dunbar, Phil Eastman, Brad Fritzler, Jeff Hagan, Phil Hall, T. Hinds, Nickie Lambert, Gregg LaMontagne, Doug MacIntyre, Jason Mansour, Cathy Martin, Kirk McQuown, Mark Moran, Mark B. Nelson, Jon Neuhaus, Carl Newman, Wally Pierce, Scott Sandorf, Charlie Smith, Tom Strong, Mark Sweeney, Brian Taggart, Bob Thistle, Nick Toth, Kristie Twining, Bob Wallace, Fred Weir, and James Wortham. Thanks also to Richard Pace for providing biometric oversight on survey design and valuable input on this manuscript, Debra Palka for sharing her survey and programming expertise, and Phil Clapham. We are especially indebted to the U.S. Coast Guard Air Station on Cape Cod for the use of their facilities and airframes, as well as their whale sighting and weather reports. This work was funded in part by the US Coast Guard under a Memorandum of Agreement (NEC 2003-021), and was conducted using MMPA/ESA Permits 775-1600, 1295, and 917.
References Clapham PJ, Pace RM III. 2001. Defining triggers for temporary area closures to protect right
whales from entanglement: issues and options. Northeast Fish Sci Cent Ref Doc. 01-06; 39 p. Available at: www.nefsc.noaa.gov/publications.
Cole TVN, Hartley DL, Merrick RL. 2005. Mortality and serious injury determinations for large whale stocks along the eastern seaboard of the United States, 1999-2003. Northeast Fish Sci Cent Ref Doc. 05-08; 20 p. Available at: www.nefsc.noaa.gov/publications.
Cole TVN, Hartley DL, Garron M. 2006. Mortality and serious injury determinations for large whale stocks along the eastern seaboard of the United States, 2000-2004. Northeast Fish Sci Cent Ref Doc. 06-04. Available at: www.nefsc.noaa.gov/publications.
Kenny RD, Winn HE, Macaulay MC. 1995. Cetaceans in the Great South Channel, 1979-1989: Right whales (Eubalaena glacialis). Continent Shelf Res. 15:385-414.
11
Knowlton AR, Kraus SD. 2001. Mortality and serious injury of northern right whales (Eubalaena glacialis) in the western North Atlantic Ocean. J Cetacean Res Manage. (Spec Issue) 2:193-201.
Kraus SD, Prescott JH, Knowlton AR, Stone GS. 1986. Migration and calving of right whales (Eubalaena glacialis) in the western North Atlantic. In: Brownell RK Jr, Best PB, Prescott JH, editors. Right Whales: Past and Present Status, Special Issue 10. Cambridge (UK): International Whaling Commission, p. 139-144
Moore MJ, Knowlton AR, Kraus SD, McLellan WA, Bonde RJ. 2004. Morphometry, gross morphology and available histopathology in North Atlantic right whale (Eubalaenaglacialis) mortalities (1970–2002). J Cetacean Res Manage 6(3):199-214.
National Marine Fisheries Service (NMFS). 1997. Taking of marine mammals incidental to commercial fishing operations; Atlantic Large Whale Take Reduction Plan regulations. Interim rule. Fed Regis. 62(140):39157-39188.
NMFS. 2002. Taking of marine mammals incidental to commercial fishing operations; Atlantic Large Whale Take Reduction Plan regulations. Final Rule. Fed Regis. 67(6):1133-1142.
NMFS. 2005. Recovery plan for the northern right whale (Eubalaena glacialis). Available from: National Marine Fisheries Service, Silver Spring MD.
Payne R, Brazier O, Dorsey EM, Perkins JS, Rowntree VJ, Titus A. 1983. External features in southern right whales (Eubalaena australis) and their use in identifying individuals. In: Payne R, editor. Communication and Behavior of Whales. Boulder (CO): Westview Press, p. 371-445.
United States Coast Guard (USCG). 2001. Mandatory ship reporting systems. Final rule. Fed Regis. 66(224):58066-58070.
Whitehead H, Payne R. 1981. New techniques for assessing populations of right whales without killing them. Contract No. MM6aC017. Final report. Washington (DC): US Marine Mammal Commission; 36 p.
Winn HE, Scott EA, Kenney RD. 1985. Aerial surveys for right whales in the Great South Channel, spring 1984. Report No. MMC-84/04. Washington (DC): US Marine Mammal Commission; 18 p.


Procedures for Issuing Manuscriptsin the
Northeast Fisheries Science Center Reference Document (CRD) Series
Clearance All manuscripts submitted for issuance as CRDs must have cleared the NEFSC’s manuscript/abstract/webpage review process. If any author is not a federal employee, he/she will be required to sign an “NEFSC Release-of-Copyright Form.” If your manuscript includes material from another work which has been copyrighted, then you will need to work with the NEFSC’s Editorial Office to arrange for permission to use that material by securing release signatures on the “NEFSC Use-of-Copyrighted-Work Permission Form.” For more information, NEFSC authors should see the NEFSC’s online publication policy manual, “Manu-script/abstract/webpage preparation, review, and dis-semination: NEFSC author’s guide to policy, process, and procedure,” located in the Publications/Manuscript Review section of the NEFSC intranet page.
Organization Manuscripts must have an abstract and table of contents, and (if applicable) lists of figures and tables. As much as possible, use traditional scientific manu-script organization for sections: “Introduction,” “Study Area” and/or ”Experimental Apparatus,” “Methods,” “Results,” “Discussion,” “Conclusions,” “Acknowl-edgments,” and “Literature/References Cited.”
Style The CRD series is obligated to conform with the style contained in the current edition of the United States Government Printing Office Style Manual. That style manual is silent on many aspects of scientific manuscripts. The CRD series relies more on the CSE Style Manual. Manuscripts should be prepared to conform with these style manuals. The CRD series uses the American Fisheries Soci-ety’s guides to names of fishes, mollusks, and decapod
crustaceans, the Society for Marine Mammalogy’s guide to names of marine mammals, the Biosciences Information Service’s guide to serial title abbreviations, and the ISO’s (International Standardization Organiza-tion) guide to statistical terms. For in-text citation, use the name-date system. A special effort should be made to ensure that all neces-sary bibliographic information is included in the list of cited works. Personal communications must include date, full name, and full mailing address of the con-tact.
Preparation Once your document has cleared the review pro-cess, the Editorial Office will contact you with publica-tion needs – for example, revised text (if necessary) and separate digital figures and tables if they are embedded in the document. Materials may be submitted to the Editorial Office as files on zip disks or CDs, email attachments, or intranet downloads. Text files should be in Microsoft Word, tables may be in Word or Excel, and graphics files may be in a variety of formats (JPG, GIF, Excel, PowerPoint, etc.).
Production and Distribution The Editorial Office will perform a copy-edit of the document and may request further revisions. The Editorial Office will develop the inside and outside front covers, the inside and outside back covers, and the title and bibliographic control pages of the docu-ment. Once both the PDF (print) and Web versions of the CRD are ready, the Editorial Office will contact you to review both versions and submit corrections or changes before the document is posted online. A number of organizations and individuals in the Northeast Region will be notified by e-mail of the availability of the document online.

Research Communications BranchNortheast Fisheries Science Center
National Marine Fisheries Service, NOAA166 Water St.
Woods Hole, MA 02543-1026
Publications and Reportsof the
Northeast Fisheries Science CenterThe mission of NOAA’s National Marine Fisheries Service (NMFS) is “stewardship of living marine resources for the benefit of the nation through their science-based conservation and management and promotion of the health of their environment.” As the research arm of the NMFS’s Northeast Region, the Northeast Fisheries Science Center (NEFSC) supports the NMFS mission by “conducting ecosystem-based research and assess-ments of living marine resources, with a focus on the Northeast Shelf, to promote the recovery and long-term sustainability of these resources and to generate social and economic opportunities and benefits from their use.” Results of NEFSC research are largely reported in primary scientific media (e.g., anonymously-peer-reviewed scientific journals). However, to assist itself in providing data, information, and advice to its constituents, the NEFSC occasionally releases its results in its own media. Currently, there are three such media:
NOAA Technical Memorandum NMFS-NE -- This series is issued irregularly. The series typically includes: data reports of long-term field or lab studies of important species or habitats; synthesis reports for important species or habitats; annual reports of overall assessment or monitoring programs; manuals describing program-wide surveying or experimental techniques; literature surveys of important species or habitat topics; proceedings and collected papers of scientific meetings; and indexed and/or annotated bibliographies. All issues receive internal scientific review and most issues receive technical and copy editing.
Northeast Fisheries Science Center Reference Document -- This series is issued irregularly. The series typically includes: data reports on field and lab studies; progress reports on experiments, monitoring, and assessments; background papers for, collected abstracts of, and/or summary reports of scientific meetings; and simple bibliographies. Issues receive internal scientific review and most issues receive copy editing.
Resource Survey Report (formerly Fishermen’s Report) -- This information report is a regularly-issued, quick-turnaround report on the distribution and relative abundance of selected living marine resources as derived from each of the NEFSC’s periodic research ves-sel surveys of the Northeast’s continental shelf. This report undergoes internal review, but receives no technical or copy editing.
TO OBTAIN A COPY of a NOAA Technical Memorandum NMFS-NE or a Northeast Fisheries Science Center Reference Document, either contact the NEFSC Editorial Office (166 Water St., Woods Hole, MA 02543-1026; 508-495-2350) or consult the NEFSC webpage on “Reports and Publications” (http://www.nefsc.noaa.gov/nefsc/publications/). To access Resource Survey Report, consult the Ecosystem Surveys Branch webpage (http://www.nefsc.noaa.gov/femad/ecosurvey/mainpage/).
ANY USE OF TRADE OR BRAND NAMES IN ANY NEFSC PUBLICATION OR REPORT DOES NOT IMPLY ENDORSE-MENT.
MEDIA MAIL