methodological guidelines on net energy analysis of
TRANSCRIPT

➢
Methodological Guidelines on Net Energy Analysis of Photovoltaic Electricity, 2nd Edition 2021
PV
PS
Report IEA-PVPS T12-20:2021
Task 12 Sustainability

Task 12 Sustainability – Methodological Guidelines on Net Energy Analysis of Photovoltaic Electricity
What is IEA PVPS TCP?
The International Energy Agency (IEA), founded in 1974, is an autonomous body within the framework of the Organization for Economic
Cooperation and Development (OECD). The Technology Collaboration Programme (TCP) was created with a belief that the future of
energy security and sustainability starts with global collaboration. The programme is made up of 6.000 experts across government,
academia, and industry dedicated to advancing common research and the application of specific energy technologies.
The IEA Photovoltaic Power Systems Programme (IEA PVPS) is one of the TCP’s within the IEA and was established in 1993. The mission
of the programme is to “enhance the international collaborative efforts which facilitate the role of photovoltaic solar energy as a cornerstone
in the transition to sustainable energy systems.” In order to achieve this, the Programme’s participants have undertaken a va riety of joint
research projects in PV power systems applications. The overall programme is headed by an Executive Committee, comprised of one
delegate from each country or organisation member, which designates distinct ‘Tasks,’ that may be research projects or activi ty areas.
The IEA PVPS participating countries are Australia, Austria, Belgium, Canada, Chile, China, Denmark, Finland, France, Germany, Israel,
Italy, Japan, Korea, Malaysia, Mexico, Morocco, the Netherlands, Norway, Portugal, South Africa, Spain, Sweden, Switzerland, Thailand,
Turkey, and the United States of America. The European Commission, Solar Power Europe, the Smart Electric Power Alliance (SEPA), the
Solar Energy Industries Association and the Cop- per Alliance are also members.
Visit us at: www.iea-pvps.org
What is IEA PVPS Task 12?
Task 12 aims at fostering international collaboration in safety and sustainability that are crucial for assuring that PV grows to levels
enabling it to make a major contribution to the needs of the member countries and the world. The overall objectives of Task 12 are to 1.
Quantify the environmental profile of PV in comparison to other energy technologies; 2. Investigate end of life management options for PV
systems as deployment increases and older systems are decommissioned; 3. Define and address environmental health & safety and other
sustainability issues that are important for market growth. The first objective of this task is well served by life cycle assessments (LCAs)
that describe the energy-, material-, and emission-flows in all the stages of the life of PV. The second objective is addressed through
analysis of including recycling and other circular economy pathways. For the third objective, Task 12 develops methods to quantify risks
and opportunities on topics of stakeholder interest. Task 12 is operated jointly by the National Renewable Energy Laboratory (NREL) and
University of New South Wales (UNSW). Support from the United States Department of Energy (DOE) and UNSW are gratefully
acknowledged.
This report addresses the issue of how to perform a Net Energy Analysis (NEA) of PV electricity using a robust and sound methodology,
and how to interpret the ensuing Energy Return On Investment (EROI) metric both in isolation and vis-à-vis those energy metrics that are
commonly employed in Life Cycle Assessment (LCA). NEA is an independent method for obtaining further valuable information on the
energy performance of PV systems that is complementary to LCA because it provides answers to distinctly different questions. Task 12
has produced and will continue to update methodological guidelines for PV LCA and now, with this document, it is doing the same for PV
NEA.
Authors
➢ Main Content: Marco Raugei
➢ Editor: Garvin Heath
DISCLAIMER
The IEA PVPS TCP is organised under the auspices of the International Energy Agency (IEA) but is functionally and legally autonomous.
Views, findings and publications of the IEA PVPS TCP do not necessarily represent the views or policies of the IEA Secretariat or its
individual member countries
COVER PICTURE
The cover picture shows a streamlined energy systems diagram of a PV power system and the system boundary used in a Net Energy
Analysis. Courtesy of Marco Raugei.
ISBN 978-3-907281-18-5 Methodological Guidelines on Net Energy Analysis of Photovoltaic Electricity

INTERNATIONAL ENERGY AGENCY
PHOTOVOLTAIC POWER SYSTEMS PROGRAMME
Methodological Guidelines on Net Energy Analysis
of Photovoltaic Electricity 2nd Edition
IEA PVPS Task 12
Sustainability
Report IEA-PVPS T12-20:2021 June 2021
Operating agents: Garvin Heath, National Renewable Energy Laboratory, Golden, CO, USA
Jose Bilbao, University of New South Wales, Sydney, Australia
Author: Marco Raugei
Previous Version Published in 2015:
Contributors: Rolf Frischknecht, Carol Olson, Parikhit Sinha, Garvin Heath
Citation: M. Raugei, R. Frischknecht, C. Olson, P. Sinha, G. Heath, 2021. Methodological guidelines on Net Energy Analysis of Photovoltaic Electricity, 2nd Edition, IEA-PVPS Task 12, Report T12-20:2021, ISBN 978-3-907281-18-5.

Task 12 Sustainability – Methodological Guidelines on Net Energy Analysis of Photovoltaic Electricity
1
TABLE OF CONTENTS
Acknowledgements ........................................................................................................... 2
List of acronyms and symbols ........................................................................................... 3
Executive summary ........................................................................................................... 4
1 Motivation for the present document ...................................................................... 7
2 Net Energy Analysis (NEA) .................................................................................... 8
2.1 Brief historical outline ................................................................................. 8
2.2 Energy Return on (Energy) Investment (EROI) .......................................... 8
3 Methodological guidelines ..................................................................................... 12
3.1 NEA of PV electricity production ................................................................. 12
3.2 Interpretation of EROI (vis-á-vis CED and nr-CED) .................................... 16
3.3 Photovoltaics-specific aspects .................................................................... 19
3.4 Modelling aspects ...................................................................................... 19
3.5 Reporting and communication .................................................................... 25
References ....................................................................................................................... 27

Task 12 Sustainability – Methodological Guidelines on Net Energy Analysis of Photovoltaic Electricity
2
ACKNOWLEDGEMENTS
The authors gratefully acknowledge the many valuable comments and suggestions made by two independent experts who acted as external reviewers of a draft version of these guidelines.

Task 12 Sustainability – Methodological Guidelines on Net Energy Analysis of Photovoltaic Electricity
3
LIST OF ACRONYMS AND SYMBOLS
AC Alternated Current
BOS Balance Of System
CdTe Cadmium Telluride
CIGS Copper Indium Gallium di-Selenide
CED Cumulative Energy Demand
DC Direct Current
EC Energy Carrier
EPBT Energy Pay-Back Time
EROI Energy Return On (Energy) Investment
Inv Energy Investment
Invnr non-renewable energy Investment
LCA Life Cycle Assessment
LCI Life Cycle Inventory
mc-Si multi-crystalline Silicon
MJ Mega Joules
NEA Net Energy Analysis
nr-CED non-renewable Cumulative Energy Demand
Out Energy output
PE Primary Energy
PEnr non-renewable Primary Energy
PES Primary Energy Source
PR Performance Ratio
PROI Power Return On Investment
PV Photovoltaic

Task 12 Sustainability – Methodological Guidelines on Net Energy Analysis of Photovoltaic Electricity
4
EXECUTIVE SUMMARY
Net Energy Analysis (NEA) is a structured, comprehensive method of quantifying the extent to which a given energy source is able to provide a net energy gain (i.e., an energy surplus) to the end user, after accounting for all the energy losses occurring along the chain of processes that are required to exploit it (i.e., for its extraction, processing and transformation into a usable energy carrier, and delivery to the end user), as well as for all the additional energy ‘investments’ that are required in order to carry out the same chain of processes. However, this general framework leaves the individual practitioner with a range of choices that can affect the results and thus, the conclusions of a NEA study. The current IEA PVPS guidelines were developed to provide guidance on assuring consistency, balance, and quality to enhance the credibility and reliability of the results from photovoltaic (PV) NEAs. The guidelines represent a consensus among the authors - PV NEA experts in North America and Europe - for assumptions made on PV performance, process inputs and outputs, methods of analysis, and reporting of the results.
Guidance is given on photovoltaic-specific parameters used as inputs in NEA and on choices and assumptions in inventory data analysis and on implementation of modelling approaches. A consistent approach towards system modelling, the functional unit, the system boundaries and allocation aspects enhance the credibility of PV electricity NEA studies and enables balanced NEA-based comparisons. Specifically, “apples-to-oranges” comparisons of different energy carriers (e.g., fuels vs. electricity) are not methodologically sound and are to be avoided in all cases; also, any comparison across renewable and non-renewable electricity generation technologies must clearly point out the intrinsically short-term nature of the NEA viewpoint, which does not capture the long-term sustainability implications of renewable vs. non-renewable primary energy harvesting and use: non-renewable primary energy resources are depleted and finally exhausted (irrespective of the size of the EROI), while renewable primary energy resources are not.
This document provides an in-depth discussion of a common metric of NEA, namely the energy return on investment (EROI), and how this is to be interpreted vis-à-vis the deceptively similar-sounding metrics in the field of Life Cycle Assessment (LCA): cumulative energy demand (CED) and non-renewable cumulative energy demand (nr-CED) per unit output. Specifically, a number of key differences are highlighted between these metrics as applied to electricity production systems, which are listed in Table S-1.
Transparency in reporting is of the utmost importance as parameters vary with geographical zones, and a system’s boundary conditions and modelling approach can affect the findings significantly. Reporting of items 1 to 16 below is considered mandatory. The list of items is separated into key parameters required in both the captions of figures and tables showing the results of the NEA and in the NEA report (items 1 to 6), and further important aspects which should be documented elsewhere in the NEA report. Key parameters that should be documented in captions of figures and tables:
1. PV technology (e.g., single and multi-crystalline silicon, cadmium telluride (CdTe), copper indium gallium diselenide (CIGS), amorphous silicon, micromorphous silicon);
2. Type of system (e.g., rooftop, ground mount, fixed tilt or tracker);
3. Module-rated efficiency and degradation rate (if not included in performance ratio);
4. Lifetime for both PV modules and balance of system (BOS);
Task 12 Sustainability – Methodological Guidelines on Net Energy Analysis of Photovoltaic Electricity
5
5. Location of installation; and
6. Annual irradiation level and the system’s performance ratio (PR), and the expected annual electricity production at the given orientation and inclination.
Other important aspects that should be documented in an NEA report:
7. Place/country/region of electricity production modelled;
8. Time-frame of data used in the analysis;
9. Whether EROIel (EROI in terms of electricity) or EROIPE-eq (EROI in terms of equivalent primary energy) is calculated, and if the latter, the assumed electricity mix or technology/-ies and thus resulting grid mix’s or technology’s/-ies’ efficiency;
10. Goal of the study;
11. System boundary;
12. Approach used if not process-based (e.g., environmentally extended input-output tables, hybrid analysis);
13. LCA database(s) (e.g., Ecoinvent, GaBi, ELCD, etc.) and version used (if applicable);
14. LCA software tool (e.g., SimaPro, GaBi, OpenLCA, etc.) and version used (if applicable);
15. Primary energy factors applied and approach used; and
16. Any major assumptions made about the production of input materials.

Task 12 Sustainability – Methodological Guidelines on Net Energy Analysis of Photovoltaic Electricity
6
Metric EROIel EROIPE-eq CED nr-CED
Formula OutelInv OutPE-eq
Inv =(Outel G
⁄ )Inv
(PE+Inv)
Outel
(PEnr+Invnr)Outel
Units [MJ/MJoil-eq] [MJoil-eq/MJoil-eq] [MJoil-eq/MJ] [MJoil-eq/MJ]
Meaning of the numerator
Energy delivered (‘returned’) to society, in units of electricity
Energy delivered (‘returned’) to society, in units of equivalent primary energy
Total primary energy harvested from nature
Non-renewable primary energy harvested from nature
Meaning of the denominator
Sum of energy carriers diverted from other societal uses (excluding energy delivered to society), in terms of their total primary energy demand
Energy delivered (‘returned’) to society, in units of electricity
Distinction between renewable and non-renewable energy?
No, not normally made Yes, generally recommended
Main purpose
Economical/effective use of available energy carriers
Efficient use of primary energy resources
Sustainable/ efficient use of non-renewable primary energy resources
Temporal perspective
Short term Long term
Table S-1 - Key differences between EROIel / EROIPE-eq and CED / nr-CED per unit output. (Acronyms, abbreviations and symbols: PE = primary energy; PE-eq = equivalent primary energy; Out = energy output; Inv = energy investment; el = electricity; G = life cycle energy efficiency of the electric grid (G); nr = non-renewable.)
Task 12 Sustainability – Methodological Guidelines on Net Energy Analysis of Photovoltaic Electricity
7
1 MOTIVATION FOR THE PRESENT DOCUMENT
The quantification of the energy performance of photovoltaic (PV) electricity is critical information for decision makers to make sound choices in the crowded arena of competing energy alternatives.
With the multitude of available energy performance metrics and methods, it is crucial to critically review them to see A) what information is conveyed by each metric, B) whether it adequately informs about the efficiency or effectiveness of the PV system, C) whether the metric is suitable for the purpose to which it is applied (e.g., comparison with other electricity generation technologies, or as a policy tool, from a short- or long-term perspective) and D) which, if any, are its lingering methodological issues.
This document critically assesses the discipline of Net Energy Analysis (NEA), and specifically aims to provide clear recommendations on how to perform a NEA of PV electricity, and interpret its principal energy performance metric - Energy Return On Investment (EROI) - vis-á-vis the deceptively similar-sounding metrics in the field of Life Cycle Assessment (LCA) - Cumulative Energy Demand (CED) and Non-renewable Cumulative Energy Demand (nr-CED).
Specifically, the EROI of PV systems has been the focus of much controversy [Prieto and Hall, 2013; Raugei, 2013b; Raugei et al., 2015; Brandt et al., 2013; Pickard, 2014; Carbajales-Dale et al., 2015; Bhandari et al., 2015; Raugei et al., 2017], especially with regards to how it compares to that of more conventional (e.g., thermal) electricity production pathways. If such comparisons are performed, the strict limitations of such comparisons should be highlighted as described in this document.

Task 12 Sustainability – Methodological Guidelines on Net Energy Analysis of Photovoltaic Electricity
8
2 NET ENERGY ANALYSIS (NEA)
2.1 Brief historical outline
The first proposals to complement the economic analysis of societal processes with information on material and energy flows (accounted for in physical units) date back to the late nineteenth century [Sacher, 1881; Geddes, 1884; Clausius, 1885]. An ‘energy theory of value’ was also advocated by the Technocracy movement in the United States of America beginning in the 1920s [Berndt, 1982], when, in the years up to and during the Great Depression, there was a call for replacing monetary currency (which is subject to value fluctuations) with an energy-based currency. The same fundamental idea then received further credit and general attention during the 1973-1974 oil crisis, when U.S. legislation, sponsored by Sen. Mark Hatfield, was incorporated into law requiring that all prospective energy supply technologies considered for commercial application be assessed and evaluated in terms of their "potential for production of net energy". Hatfield [1974] argued that "energy is the currency around which we should be basing our economic forecasts, not money supply".
As a scientific discipline, Net Energy Analysis (NEA) was thus developed to evaluate the extent to which a given energy resource flow is able to provide a net energy gain (i.e., an energy surplus) to the end user, after accounting for all the energy losses occurring along the chain of processes that are required to exploit it (i.e., for its extraction, processing and transformation into a usable energy carrier, and then delivery to the end user), as well as for all the additional energy ‘investments’ (i.e., those energy inputs that are diverted from other societal uses, and which do not form part of the original flow of energy resource that is being exploited) that are required in order to carry out the same chain of processes [Slesser 1974; Leach 1975; Chambers, 1979; Herendeen, 1988; Cleveland 1992; Herendeen, 2004; Arvesen and Hertwich, 2015].
It has been claimed that “net energy analysis … is immune to the effects of market imperfections that distort monetary data” [Cleveland, 2013], with examples of such “market imperfections” being subsidies, government policies, etc. However, some NEAs have in fact included the use of economic factors translated into energy units (cf. Section 3.4.4), and in these cases, they may therefore no longer be claimed to be immune to market imperfections.
2.2 Energy Return on (Energy) Investment (EROI)
A principal indicator of NEA is the Energy Return On (Energy) Investment (EROI, sometimes alternatively spelled EROEI or ERoEI), which is defined as the ratio of the amount of energy delivered (also referred to as ‘returned’) to society in the form of a useful energy carrier (EC)1 by a chain of processes exploiting a primary energy source (PES) to the total energy ‘invested’ in finding, extracting, processing, and delivering that energy [Cleveland et al., 1984; Murphy and Hall, 2010].
Referring to the generalized Figure 1 below, we have:
1 “A primary energy source is an energy source that exists in nature and can be used to generate
energy carriers (e.g., solar radiation, fossil fuels, or waterfalls). An energy carrier is a vector derived
from a primary energy source (e.g., electricity, gasoline, or steam)” [Murphy and Hall, 2011].

Task 12 Sustainability – Methodological Guidelines on Net Energy Analysis of Photovoltaic Electricity
9
• PE = primary energy directly harvested from the primary energy source (PES)
• Inv = energy ‘investment’ for the chain of energy harvesting and transformation processes
• Out = energy ‘return’ (i.e., gross amount of usable energy carrier delivered to society)
• S = energy dissipated to the environment (e.g., as heat, as fugitive emissions, etc.)
Figure 1 - Streamlined energy systems diagram of the exploitation of a primary energy source
(PES) for the production of a useful energy carrier (Out), with concomitant primary energy
directly harvested from the PES (PE), additional external energy investment (Inv) and energy
dissipated to the environment (S). (This and all subsequent energy system diagrams in this
document follow the symbolic conventions introduced by Odum [1983])
The Energy Return On Investment (EROI) is defined as:
Eq. 1) 𝐄𝐑𝐎𝐈 = 𝐎𝐮𝐭𝐈𝐧𝐯 The fundamental idea underpinning EROI is that, in order for an energy production system to provide a positive net energy ‘return’ to the end user (OutNET = Out – Inv), the gross energy return (Out) must be larger than the available energy ‘invested’ in the chain of energy harvesting and transformation processes that make up the system itself (Inv).
It is straightforward to verify that OutNET > 0 implies Out > Inv, and hence EROI > 1.
However, several caveats apply.
• PE is in units of primary energy2, and includes both the primary energy actually harvested and subsequently converted into the delivered energy carrier and the primary energy co-extracted but then ‘lost’ to the environment (which forms part of S).
• Inv is the readily available energy diverted from other possible societal uses, and as such it is provided to the system as a combination of usable energy carriers. However, accounting for the range of different energy carriers contributing to the
2 A common practice is to express all units of primary energy on a Higher Heating Value (HHV) basis,
thereby including, when applicable, the latent heat of the water vapour generated during combustion
[Frischknecht et al. 2007]. Such convention is assumed here throughout, unless otherwise specified.

Task 12 Sustainability – Methodological Guidelines on Net Energy Analysis of Photovoltaic Electricity
10
denominator (Inv) in terms of their individual amounts measured in direct units of, e.g., thermal energy for fuels and electrical energy for electricity, would lead to an inconsistent sum of non-directly comparable energy flows. To overcome this issue, we recommend expressing all contributions to the energy investment (Inv) in terms of their life cycle primary energy demand, calculated as the total primary energy harvested from the environment in order to produce and deliver them (i.e. on the basis of their Cumulative Energy Demand [Frischknecht et al., 2007; Frischknecht et al., 2015]).
• Out may either be accounted for in direct energy units of the delivered energy carrier (i.e., Outth measured in units of thermal energy in the case of a fuel, or in Outel measured in units of electrical energy in the case of electricity), or, like Inv, in terms of its equivalent primary energy (OutPE-eq measured in units of primary energy). Adopting the latter protocol requires the definition and use of a suitable conversion factor between one unit of delivered energy carrier and X units of primary energy. As discussed elsewhere [Murphy et al., 2011; Arvesen and Hertwich, 2015], a number of different approaches have been used in the NEA literature to perform this conversion, e.g., based on the concept of exergy, or on economic price. Many such approaches, however, lead to a lack of methodological consistency when the results of the NEA are discussed in the same light as those ensuing from LCA, and they are therefore hereby discouraged. Instead, the approach that is recommended here follows a replacement logic akin to that used in LCA, whereby one unit of energy carrier delivered by any one technology is assumed to be equivalent to the primary energy that is cumulatively harvested from the environment by the current mix of technologies deployed in a given country or region in order to produce the exact same unit of energy carrier (e.g., that country’s or region’s grid mix in the case of electricity)3. In other words, the conversion factor between one unit of delivered energy carrier (e.g., thermal or electrical energy) and its equivalent primary energy is taken to be the Cumulative Energy Demand of the mix of technologies that is being replaced.
From points (2) and (3) above, it follows that, unless the numerator (Out) and the denominator (Inv) of the EROI ratio are both expressed in terms of units of primary energy, their difference (OutNET) is no longer strictly consistently defined, and the “intuitively appealing interpretation that EROI > 1 is the absolute minimum requirement a resource must meet in order to constitute a net energy source” is lost [Arvesen and Hertwich, 2015].
On the other hand, if the energy return is expressed in units of equivalent primary energy (OutPE-eq), then the resulting EROI is no longer an absolute indicator of the energy performance of the analysed system, but it becomes a relative indicator of its performance which may only be interpreted in the context of the technology mix that it is assumed to replace.
3 In LCA, energy equivalency may alternatively be defined on the basis of the current mix of non-renewable technologies, such as a country’s non-renewable share of its grid mix. For example, such
distinction leads to the alternative definition of, respectively, either Energy Pay-Back Time (EPBT), or
Non-Renewable Energy Pay-Back Time (NREPBT) [Frischknecht et al., 2020b]. However, given that
NEA does not generally distinguish between renewable and non-renewable energy flows (cf. Section
3.2), the use of the total mix of renewable and non-renewable technologies is recommended for the
purposes of calculating the equivalent primary energy at the numerator of the EROI ratio.

Task 12 Sustainability – Methodological Guidelines on Net Energy Analysis of Photovoltaic Electricity
11
In either case, according to its definition (Eq. 1), EROI is essentially a user-centric ratio of energy ‘benefits’ (the ‘return’) to energy ‘costs’ (the ‘investment’), which has been interpreted as having inherent implications for the economy [Murphy et al., 2011; Carbajales-Dale et al., 2014]. It has also been argued that it may be regarded as an indicator of the ‘quality’ of an energy resource, where the word ‘quality’ is meant as “ability to generate economic output” [Murphy et al., 2011] (the reasoning being that a larger amount of net energy being made available to the economy allows more work to be carried out per unit of energy invested).
The following three important aspects further complicate the interpretation of the EROI:
• It has been observed that by analysing a time series where a progressive change in EROI is observed for a specific energy resource, a useful indication may be derived of the comparative ease with which such energy resource has been exploited over time, and therefore of its changing overall net energy contribution to the economy. For instance, Hall et al. [2014] have reviewed calculations which indicate a declining trend for EROI values of crude oil over the past decades, which appears to indicate that, in general terms, more energy is required today to find and extract oil from crude reserves that are less accessible, or of lower quality, than those that were being exploited, for instance, a half century ago. Hence, the declining EROI of crude oil over time may indirectly indicate the encroaching physical scarcity of global petroleum resources.
However, a range of recent studies [Brandt, 2011; Raugei, 2019a,b; Brockway et al., 2019] have pointed out that when the focus is shifted from the crude resource at point of extraction to the final energy carriers delivered at point of use, the additional energy investments required along the successive steps of the supply chain can drastically alter the observed trend over time. Specifically, a recent study of the global fossil fuel industry, based on national-level International Energy Agency (IEA) data, has proven beyond doubt that while the average global EROI of fossil fuels at point of extraction has shrunk over the last twenty years from approximately 50 to 30 [Brockway et al., 2019, Figure 3], the corresponding average EROI ratios for: (i) refined fossil fuels delivered at point of use, and (ii) electricity generated by burning those same fuels in thermal power plants, have remained remarkably constant over the same time period, at around EROIth = 8 and EROIel = 3, respectively [Brockway et al., 2019, Figure 4].
These findings highlight the fundamental importance of always clearly stating the specific end product for which the NEA calculations are performed, and of never inconsistently comparing results for different and not functionally equivalent energy carriers (e.g., crude resources at point of extraction, refined thermal fuels at point of use, or electricity) [Raugei, 2019a].
• A second important distinction is to be made between an overall ‘life-cycle’ EROI calculated over the entire lifetime of a technology or process (i.e., adopting an ‘integrative’ modelling approach) vs. a time-dependent EROI(t) calculated on a year-to-year basis (i.e., adopting a ‘dynamic’ modelling approach) [Murphy et al., 2016; Raugei et al., 2018; Carbajales-Dale, 2019]. The implications of this methodological choice are profound and are discussed in detail in Section 3.4.1.
• Finally, EROI has been presented as a family of possible calculations with a widening circle of methodological boundaries [Mulder and Hagens, 2008; Murphy and Hall, 2010; Murphy et al., 2011]. The implications of adopting three alterative levels of progressively wider system boundaries are discussed in detail in Section 3.4.4.

Task 12 Sustainability – Methodological Guidelines on Net Energy Analysis of Photovoltaic Electricity
12
3 METHODOLOGICAL GUIDELINES
3.1 NEA of PV electricity production
Figure 2 below schematically illustrates a photovoltaic (PV) electricity production system.
Figure 2 - Streamlined energy systems diagram of a PV power system.
The following basic definitions apply (units are reported per m2 of PV system over the full system’s lifetime):
• Irr = total solar irradiation over system’s lifetime [MJ/m2]
• PV = PV module energy harvesting efficiency [MJ/MJ]
• PE = primary energy directly harvested over system’s lifetime = Irr × PV [MJ/m2]
• Inv = energy ‘investment’ to build, operate, dismantle, and recycle (at end of life) the PV system, in terms of its primary energy demand [MJ (oil eq)/m2]
• PR = performance ratio4 [MJ/MJ]
• Outel = total electricity produced over system’s lifetime = PE × PR [MJ/m2]
• S = energy dissipated to the environment (e.g., as heat) [MJ/m2]
Based on these definitions, and as discussed in Section 2.2, the EROI of PV electricity may be calculated according to either Eq. 2 or Eq. 3 below:
Eq. 2) 𝐄𝐑𝐎𝐈𝐞𝐥 = 𝐎𝐮𝐭𝐞𝐥𝐈𝐧𝐯 [MJ/MJ (oil-eq)]
Eq. 3) 𝐄𝐑𝐎𝐈𝐏𝐄−𝐞𝐪 = 𝐎𝐮𝐭𝐏𝐄−𝐞𝐪𝐈𝐧𝐯 = (𝐎𝐮𝐭𝐞𝐥𝛈𝐆 )𝐈𝐧𝐯 = 𝐄𝐑𝐎𝐈𝐞𝐥𝛈𝐆 [MJ (oil-eq)/MJ (oil-eq)]
4 The performance ratio (PR) describes the difference between the modules’ (DC) rated performance (the product of irradiation and module efficiency) and the actual (AC) electricity generation (IEC
61724). It is here assumed to include age-related degradation.

Task 12 Sustainability – Methodological Guidelines on Net Energy Analysis of Photovoltaic Electricity
13
where:
• G = typical life cycle energy efficiency of the electric grid (G) of the country or region where the analysed PV system is deployed, calculated as the ratio of the yearly electricity output of the entire grid to the total primary energy harvested from the environment for the operation of the grid in the same year, i.e.: G = 1/CEDG [MJ/MJ].
Example EROI calculations for electricity generated by a typical recent ground-mounted mc-Si PV system operated in regions of average irradiation (1,700 kWh/(m2*yr)). Data after Leccisi et al. [2016], including BOS; PV updated to latest value in accordance with Frischknecht et al. [2020a]
• Irr = 1,700 [kWh/(m2*yr)] × 3.6 [MJ/kWh] × 30 [yr] = 183,600 [MJ/m2]
• PV = 18 %
• PE = 33,000 [MJ/m2] = Irr × PV
• Inv = 3,130 [MJ/m2]
• PR = 0.8 [MJ/MJ]
• Outel = 26,400 [MJ/m2] = PE × PR
• EROIel = 8.5 [MJ/MJ (oil-eq)] = Outel / Inv
• G = 0.3 [MJ/MJ (oil-eq)] (typical for grid mixes relying heavily on thermal technologies)
• EROIPE-eq = 28 [MJ (oil-eq)/MJ (oil-eq)] = EROIel / G
The adoption of Eq. 3 allows the subsequent calculation of the net energy ‘returned’ to society in internally consistent units of primary energy:
Eq. 4) 𝐎𝐮𝐭𝐍𝐄𝐓 = 𝐎𝐮𝐭𝐏𝐄−𝐞𝐪 − 𝐈𝐧𝐯 [MJ (oil-eq)]
At the same time, though, it is also noteworthy that calculating the EROI of PV according to Eq. 3 results in a metric that is intrinsically comparative within PV electricity. In other words, the numerical value of EROIPE-eq depends not only on the actual energy performance of the system under study, but also on that of the electric grid that it is assumed to (partially) replace. Any observed change in the EROIPE-eq of a PV technology over time may therefore depend not (or at least not only) on a change in electricity output per unit of energy investment, but also on a change in the average life cycle efficiency of the electric grid.
Incidentally, as discussed elsewhere [Raugei, 2013a; Itten et al., 2014], a similar interpretational issue also applies to the Energy Pay-Back Time (EPBT) metric, whose definition also includes the same primary energy equivalency factor (1/G) [Frischknecht et al., 2020b]. In fact, the two metrics are related as indicated in Eq. 5:
Eq. 5) 𝐄𝐑𝐎𝐈𝐏𝐄−𝐞𝐪 = 𝐓𝐄𝐏𝐁𝐓 where:
• T = PV system’s lifetime [yr]
• EPBT = Energy Pay-Back Time = 𝐈𝐧𝐯 [(𝐎𝐮𝐭𝐞𝐥𝐓 )𝛈𝐆 ]⁄ [MJ (oil-eq)×yr/MJ] [yr]

Task 12 Sustainability – Methodological Guidelines on Net Energy Analysis of Photovoltaic Electricity
14
One key difference between EROIPE-eq and EPBT is that EROIPE-eq looks at the overall energy performance of the PV system as a whole over its entire lifetime, while EPBT is only concerned with how long it takes for the PV system to ‘return’ an amount of electricity that is deemed to be equivalent to the primary energy ‘invested’.
Since in practice the largest part of the energy ‘investment’ for PV is required up front before the system starts to produce any electricity, while the energy ‘return’ is spread over the years of operating phase (cf. Section 3.4.1), in first approximation EPBT measures the point in time (t) after which the system is able to provide a positive net energy ‘return’ (OutNET), i.e.:
Eq. 6) 𝐎𝐮𝐭𝐍𝐄𝐓 = 𝐎𝐮𝐭𝐏𝐄−𝐞𝐪(𝐭) − 𝐈𝐧𝐯(𝐭) > 𝟎 when 𝐭 > 𝐄𝐏𝐁𝐓
➢ To avoid potential confusion and maintain the transparency and traceability of the underlying calculations, it is considered mandatory to always specify the chosen approach to perform the EROI calculation (i.e., whether the energy output is expressed in terms of direct electricity – leading to EROIel as per Eq. 2 – or in terms of equivalent primary energy – leading to EROIPE-eq as per Eq. 3).
To provide a frame of reference for comparison, Figure 3 schematically illustrates a thermal electricity production system (whose feedstock may be a fossil fuel, a biofuel, or a nuclear fissile fuel).
Figure 3 - Streamlined energy systems diagram of a thermal power system.
A similar set of energy flows as already illustrated in the case of Figure 2 applies here too, with the notable difference of an additional ‘investment’ term (Inv1) to account for the extraction, processing and delivery of the feedstock from the exploited PES:
• PE = primary energy directly harvested from the PES over system’s lifetime [MJ]
• Inv1 = energy ‘investment’ to extract, refine and deliver the feedstock, in terms of its primary energy demand [MJ (oil-eq)]
• Inv2 = energy ‘investment’ to build, operate, and dismantle (at end of life) the power plant, in terms of its primary energy demand [MJ (oil-eq)]
• Outel = total electricity produced over system’s lifetime [MJ]
• S = energy dissipated to the environment (e.g., as heat, as fugitive emissions, etc.) [MJ]
Task 12 Sustainability – Methodological Guidelines on Net Energy Analysis of Photovoltaic Electricity
15
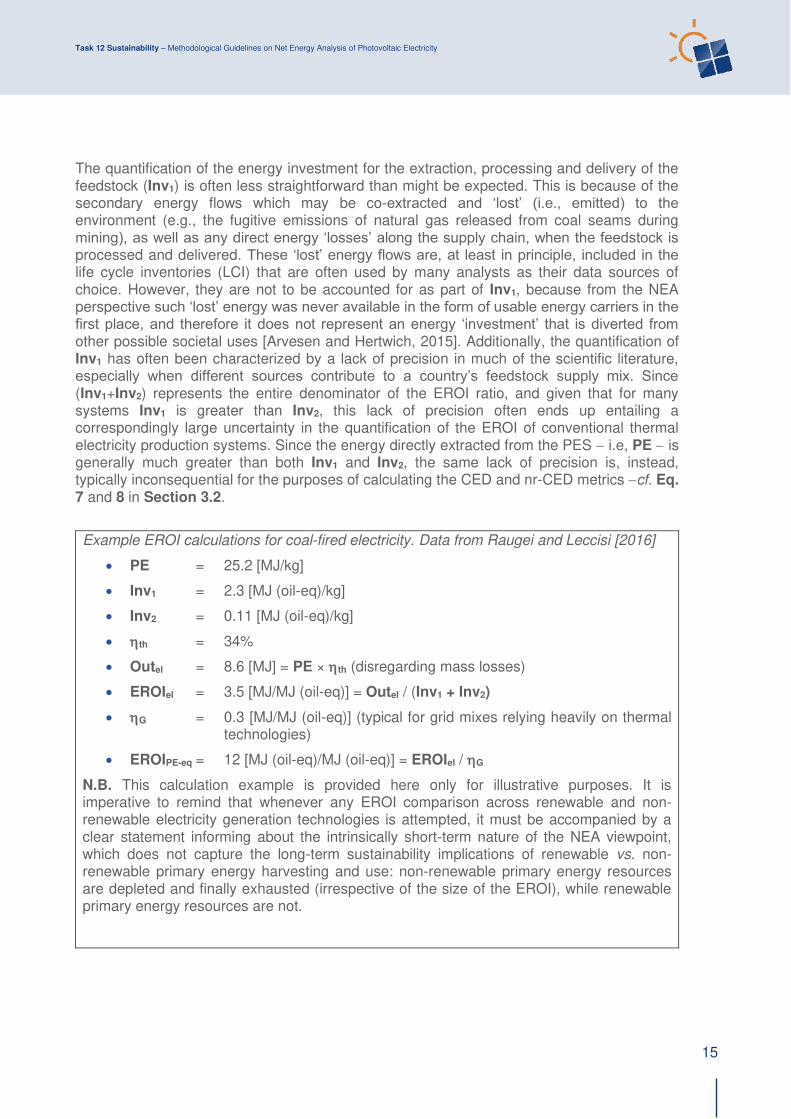
The quantification of the energy investment for the extraction, processing and delivery of the feedstock (Inv1) is often less straightforward than might be expected. This is because of the secondary energy flows which may be co-extracted and ‘lost’ (i.e., emitted) to the environment (e.g., the fugitive emissions of natural gas released from coal seams during mining), as well as any direct energy ‘losses’ along the supply chain, when the feedstock is processed and delivered. These ‘lost’ energy flows are, at least in principle, included in the life cycle inventories (LCI) that are often used by many analysts as their data sources of choice. However, they are not to be accounted for as part of Inv1, because from the NEA perspective such ‘lost’ energy was never available in the form of usable energy carriers in the first place, and therefore it does not represent an energy ‘investment’ that is diverted from other possible societal uses [Arvesen and Hertwich, 2015]. Additionally, the quantification of Inv1 has often been characterized by a lack of precision in much of the scientific literature, especially when different sources contribute to a country’s feedstock supply mix. Since (Inv1+Inv2) represents the entire denominator of the EROI ratio, and given that for many systems Inv1 is greater than Inv2, this lack of precision often ends up entailing a correspondingly large uncertainty in the quantification of the EROI of conventional thermal electricity production systems. Since the energy directly extracted from the PES − i.e, PE − is generally much greater than both Inv1 and Inv2, the same lack of precision is, instead, typically inconsequential for the purposes of calculating the CED and nr-CED metrics −cf. Eq. 7 and 8 in Section 3.2.
Example EROI calculations for coal-fired electricity. Data from Raugei and Leccisi [2016]
• PE = 25.2 [MJ/kg]
• Inv1 = 2.3 [MJ (oil-eq)/kg]
• Inv2 = 0.11 [MJ (oil-eq)/kg]
• th = 34%
• Outel = 8.6 [MJ] = PE × th (disregarding mass losses)
• EROIel = 3.5 [MJ/MJ (oil-eq)] = Outel / (Inv1 + Inv2)
• G = 0.3 [MJ/MJ (oil-eq)] (typical for grid mixes relying heavily on thermal technologies)
• EROIPE-eq = 12 [MJ (oil-eq)/MJ (oil-eq)] = EROIel / G
N.B. This calculation example is provided here only for illustrative purposes. It is imperative to remind that whenever any EROI comparison across renewable and non-renewable electricity generation technologies is attempted, it must be accompanied by a clear statement informing about the intrinsically short-term nature of the NEA viewpoint, which does not capture the long-term sustainability implications of renewable vs. non-renewable primary energy harvesting and use: non-renewable primary energy resources are depleted and finally exhausted (irrespective of the size of the EROI), while renewable primary energy resources are not.

Task 12 Sustainability – Methodological Guidelines on Net Energy Analysis of Photovoltaic Electricity
16
3.2 Interpretation of EROI (vis-á-vis CED and nr-CED)
In Life Cycle Assessment (LCA) [ISO, 2006a], the ‘Cumulative Energy Demand’ (CED) metric describes the total primary energy that must be harvested from the environment to produce a given amount of usable energy carrier [Frischknecht et al., 2007; Frischknecht et al., 2015].
Referring back to the general case illustrated in Figure 1, CED per unit output may be operationally defined as:
Eq. 7) 𝐂𝐄𝐃 = (𝐏𝐄+𝐈𝐧𝐯)𝐎𝐮𝐭 [MJ (oil-eq)/MJ]
where both PE and Inv are expressed in terms of primary energy, while Out is expressed in direct energy units of the delivered energy carrier (e.g., electricity).
Additionally, LCA keeps separate track of all the renewable and non-renewable energy flows, leading to the possibility to compute the ‘non-renewable Cumulative Energy Demand’ (nr-CED) per unit output as well:
Eq. 8) 𝐧𝐫 𝐂𝐄𝐃 = (𝐏𝐄𝐧𝐫+𝐈𝐧𝐯𝐧𝐫)𝐎𝐮𝐭 [MJ (oil-eq)/MJ]
where:
• PEnr = non-renewable share of the primary energy directly harvested from the PES [MJ]
• Invnr = non-renewable share of the energy ‘investment’ for the chain of energy harvesting and transformation processes, in terms of its non-renewable primary energy demand [MJ (oil-eq)]
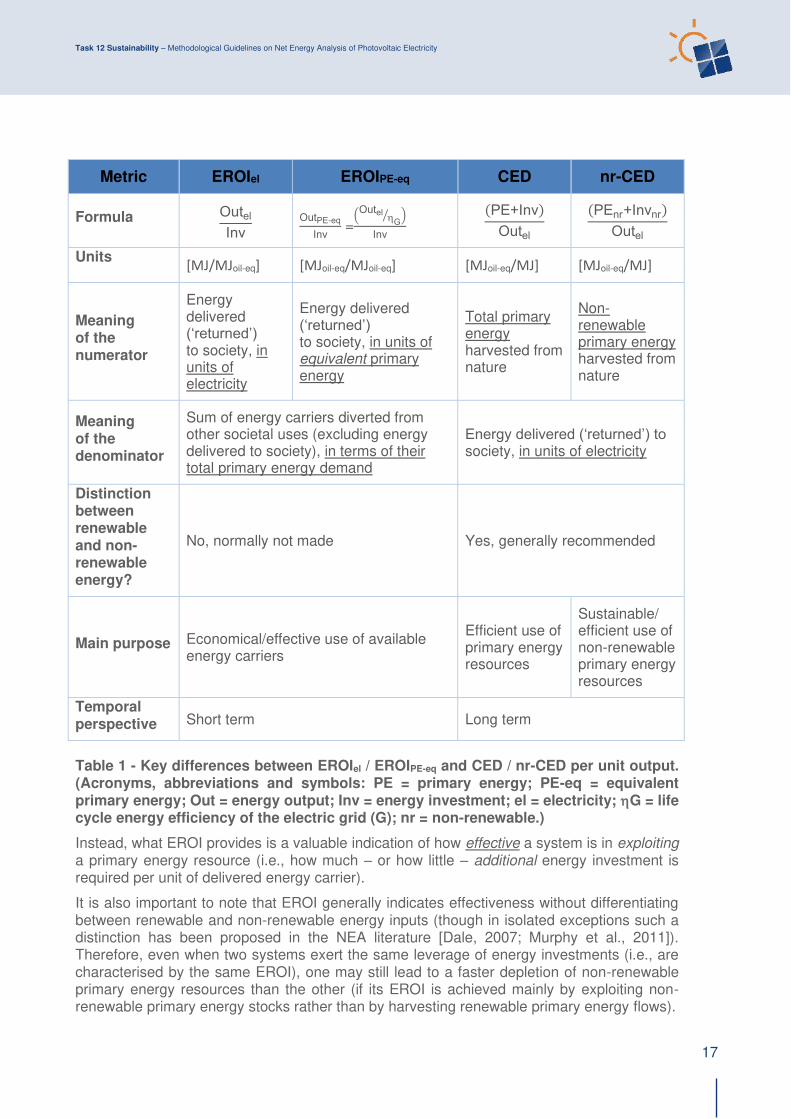
Table 1 summarizes the main differences between the EROI metrics as discussed in Sections 2.2 and 3.1 and the CED and nr-CED metrics as used in LCA, specifically in the case of electricity production.
First and foremost, it is essential to note that, unlike in CED (and nr-CED), the primary energy directly harvested from the PES (i.e., PE) plays no part in the definition of EROI. This has the direct consequence that while two systems may have the exact same EROI (Out/Inv), one may at the same time require a much larger amount of total primary energy in input (PE+Inv) per unit of delivered output (Out). In other words, one of the two systems having the same EROI may in fact be far less efficient than the other, when considering their respective total usage of primary energy. Thus, despite the sometimes liberal use of the word “efficiency” when referring to the information provided by the EROI ratio in the existing literature (e.g., [Hall et al., 1979]), it should in fact be self-explanatory that the EROI metric is not to be interpreted as an overall measure of primary energy demand per unit of energy output, or a sort of ‘life cycle energy conversion efficiency’. As discussed elsewhere [Raugei, 2013b; Raugei et al., 2015], this point is of crucial importance, and regrettably it has sometimes been the object of misguided interpretation in the existing literature.
When all primary energy flows are duly considered, CED and nr-CED are the appropriate metrics to inform on how efficient a system is, on the full life cycle scale, in converting the (respectively, total or non-renewable) primary energy harvested into a usable energy carrier (i.e., how much – or how little – energy, from the exploited resource(s) plus from the additional energy investment, is required per unit of delivered energy carrier).
Task 12 Sustainability – Methodological Guidelines on Net Energy Analysis of Photovoltaic Electricity
17
Metric EROIel EROIPE-eq CED nr-CED
Formula OutelInv OutPE-eq
Inv =(Outel G
⁄ )Inv
(PE+Inv)
Outel
(PEnr+Invnr)Outel
Units [MJ/MJoil-eq] [MJoil-eq/MJoil-eq] [MJoil-eq/MJ] [MJoil-eq/MJ]
Meaning of the numerator
Energy delivered (‘returned’) to society, in units of electricity
Energy delivered (‘returned’) to society, in units of equivalent primary energy
Total primary energy harvested from nature
Non-renewable primary energy harvested from nature
Meaning of the denominator
Sum of energy carriers diverted from other societal uses (excluding energy delivered to society), in terms of their total primary energy demand
Energy delivered (‘returned’) to society, in units of electricity
Distinction between renewable and non-renewable energy?
No, normally not made Yes, generally recommended
Main purpose Economical/effective use of available energy carriers
Efficient use of primary energy resources
Sustainable/ efficient use of non-renewable primary energy resources
Temporal perspective Short term Long term
Table 1 - Key differences between EROIel / EROIPE-eq and CED / nr-CED per unit output. (Acronyms, abbreviations and symbols: PE = primary energy; PE-eq = equivalent primary energy; Out = energy output; Inv = energy investment; el = electricity; G = life cycle energy efficiency of the electric grid (G); nr = non-renewable.)
Instead, what EROI provides is a valuable indication of how effective a system is in exploiting a primary energy resource (i.e., how much – or how little – additional energy investment is required per unit of delivered energy carrier).
It is also important to note that EROI generally indicates effectiveness without differentiating between renewable and non-renewable energy inputs (though in isolated exceptions such a distinction has been proposed in the NEA literature [Dale, 2007; Murphy et al., 2011]). Therefore, even when two systems exert the same leverage of energy investments (i.e., are characterised by the same EROI), one may still lead to a faster depletion of non-renewable primary energy resources than the other (if its EROI is achieved mainly by exploiting non-renewable primary energy stocks rather than by harvesting renewable primary energy flows).

Task 12 Sustainability – Methodological Guidelines on Net Energy Analysis of Photovoltaic Electricity
18
These differences are consequential in terms of the relevance of the two families of metrics on different time scales and for different societal purposes.
The EROI metric is devised to inform how much energy can be harvested and transformed into a usable energy carrier by a given technology (or mix of technologies), per unit of energy already available at one’s disposal, with the underlying goal of achieving the most effective use of the available energy carriers in the short term. The rationale for this lies in the assumption that if major, large-scale changes were made to the whole energy sector, which quickly resulted in drastically reduced energy output per unit of energy investment (i.e., lower EROI), then, given the current societal energy consumption patterns, there would be little available energy left to devote to other societal uses (notably including the development and deployment of alternative, and potentially more efficient, energy production systems).
On the other hand, the perspective offered by the CED and nr-CED metrics (when renewable and non-renewable energy use is differentiated, as recommended here) is intrinsically long-term, and specifically, the underlying goal of calculating the nr-CED of a range of energy technologies is to identify those which minimize the overall squandering of non-renewable primary energy resources per unit of usable energy delivered to society.
EROI and CED / nr-CED, the latter based on LCA, are thus suited for different scopes. They both have their strengths and either of them is useful in a particular context and for answering specific questions.
A useful analogy to further illustrate the differences and complementarity of the NEA and LCA viewpoints is that of a system composed of a predator and its prey. Such a predator-prey interaction results in a net energy ‘return’ only if the energy obtained by eating the prey (i.e., the energy ‘return’) is larger than the energy expended by the predator to hunt it and kill it (the energy ‘investment’). However, there is one important caveat in this seemingly simple state of matters. If the predator animal is very effective in hunting (i.e., if the energy invested in hunting is much lower than the energy ‘returned’ by the prey), but the prey animals become extinct within one season (i.e., if they are not ‘renewable’ within the time frame of interest for the predator), then such hunting effectiveness ends up being of little help in ensuring the long-term survival of the predator. On the other hand, a different predator species that hunts less effectively (i.e., which expends more energy per unit of energy ‘returned’ by its prey) and which does not grow as quickly in population, may allow the population of its prey animals to also be more resilient and avoid collapse (i.e., such prey animals may, for all intents and purposes, be a ‘renewable’ resource for their predator). Thus, while in the short term the more effective predator appears to win out, in the long term the less effective hunting strategy of the second predator is more sustainable.
Similarly, if a society strives to obtain the high net energy ‘return’ that it needs to flourish in the short term from non-renewable (instead of renewable) energy sources, then it is arguably rather short-sighted. Ultimately, a fundamental choice may need to be made between seeking “a short life in affluence” (as one based on high-EROI systems feeding on non-renewable energy sources would be) or “a long life in sufficiency” (i.e., one based on energy supply systems with a low nr-CED). Interestingly, this highly decisive and normative choice was already lucidly described in Clausius [1885] and Jevons [1965].
Task 12 Sustainability – Methodological Guidelines on Net Energy Analysis of Photovoltaic Electricity
19
3.3 Photovoltaics-specific aspects
Regarding life expectancy, irradiation, performance ratio, and degradation specific to PV, the following general recommended figures may be used in most common cases:
• Life expectancy = 30 years (PV modules, supporting structure, transformers, cabling, large inverters); 15 years (small inverters)
• Irradiation = use average actual orientation, shading, and irradiation (country-specific estimates for the latter are available in the literature)
• Performance ratio = 0.75 (rooftop-mounted PV); 0.80 (ground-mounted PV)
• Degradation = assume linear yearly degradation rates of 0.7% (default) and 0.5% (sensitivity analysis)
For further details, the reader is referred to the companion document “Methodology Guidelines on Life Cycle Assessment of Photovoltaic Electricity” [Frischknecht et al., 2020b], Sections 3.1.1 – 3.1.4. The same methodological guidelines apply here too.
3.4 Modelling aspects
3.4.1 ‘Integrative’ vs ‘dynamic’ modelling
Most conventional NEAs adopt an integrative modelling approach over the full life cycle of the system, which considers all the energy inputs and outputs to/from the system at once. Accordingly, an overall EROI value is computed which applies to the full life cycle of the system, and the calculations are performed in the same way, irrespective of when, along the timeline of the life cycle of the system, the individual contributions to the total energy ‘investment’, and to the total energy ‘return’ actually take place.
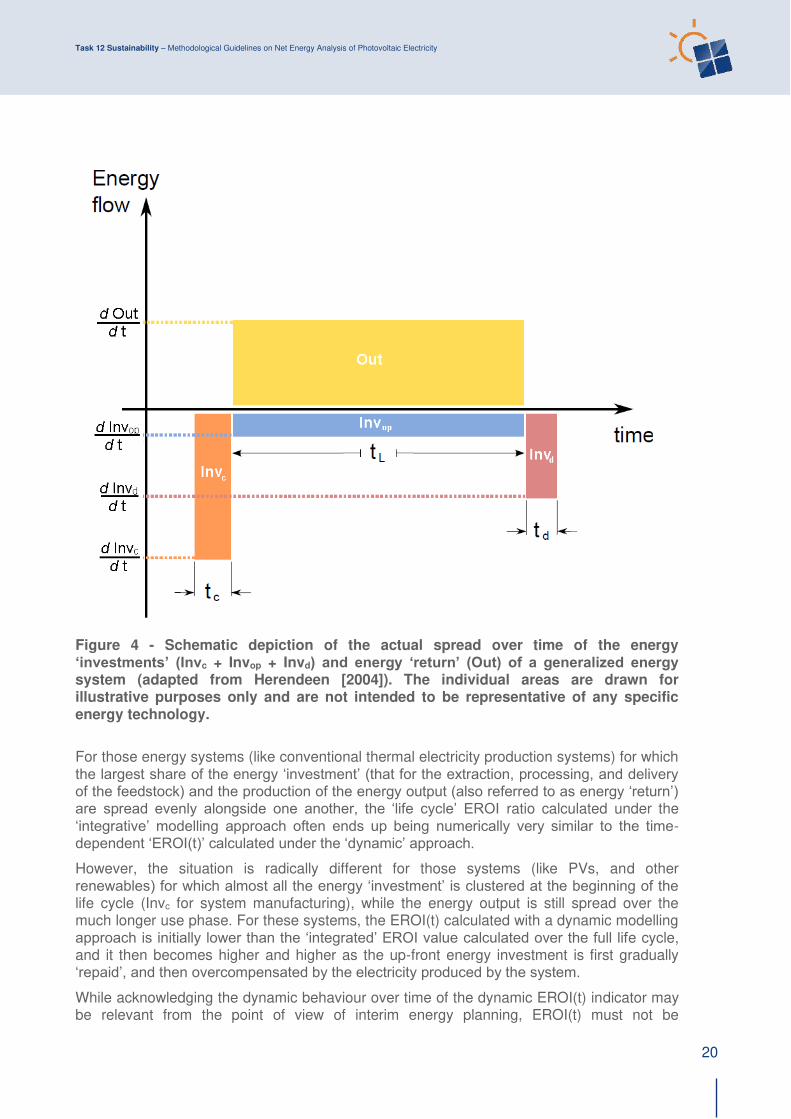
A more realistic (albeit still streamlined) depiction of the dynamic reality of a generalised energy system is illustrated in Figure 4 (adapted from Herendeen [2004]), in which the following terminology is used:
• Invc = up-front energy ‘investment’ for system construction (over time tc)
• Invop = energy ‘investment’ for system operation, maintenance and treatment of waste generated during use phase (over time tL)
• Invd = energy ‘investment’ for system decommissioning at end of life (over time td)
• Out = energy ‘return’ during use phase (over time tL)
In terms of the full ‘life cycle’ models previously illustrated in Figures 2 and 3, we have that, respectively:
• Invc + Invop + Invd = Inv (Figure 2)
and
• Invc + Invop + Invd = Inv1 + Inv2 (Figure 3)
• where, in particular, Inv1 is part of Invop.
Task 12 Sustainability – Methodological Guidelines on Net Energy Analysis of Photovoltaic Electricity
20
Figure 4 - Schematic depiction of the actual spread over time of the energy ‘investments’ (Invc + Invop + Invd) and energy ‘return’ (Out) of a generalized energy system (adapted from Herendeen [2004]). The individual areas are drawn for illustrative purposes only and are not intended to be representative of any specific energy technology.
For those energy systems (like conventional thermal electricity production systems) for which the largest share of the energy ‘investment’ (that for the extraction, processing, and delivery of the feedstock) and the production of the energy output (also referred to as energy ‘return’) are spread evenly alongside one another, the ‘life cycle’ EROI ratio calculated under the ‘integrative’ modelling approach often ends up being numerically very similar to the time-dependent ‘EROI(t)’ calculated under the ‘dynamic’ approach.
However, the situation is radically different for those systems (like PVs, and other renewables) for which almost all the energy ‘investment’ is clustered at the beginning of the life cycle (Invc for system manufacturing), while the energy output is still spread over the much longer use phase. For these systems, the EROI(t) calculated with a dynamic modelling approach is initially lower than the ‘integrated’ EROI value calculated over the full life cycle, and it then becomes higher and higher as the up-front energy investment is first gradually ‘repaid’, and then overcompensated by the electricity produced by the system.
While acknowledging the dynamic behaviour over time of the dynamic EROI(t) indicator may be relevant from the point of view of interim energy planning, EROI(t) must not be

Task 12 Sustainability – Methodological Guidelines on Net Energy Analysis of Photovoltaic Electricity
21
misconstrued as an indication of the PV system’s intrinsic overall (i.e., lifecycle) net energy performance, which is instead properly captured by the ‘integrative’ definitions of EROIel and EROIPE-eq as given respectively by Eq. 2 and Eq. 3. In fact, it has been argued that an initial ‘dip’ in EROI(t) may interpreted as a case of “sower’s strategy”, whereby today’s energy “seeds” are planted to reap the energy “crops” of tomorrow [Sgouris et al., 2016].
Finally, in order to avoid the ambiguity that may arise from the use of the same acronym ‘EROI’ for what are essentially two different metrics, respectively those calculated using the ‘integrative’ vs. ‘dynamic’ modelling approaches as discussed above, it has been argued that in the latter case EROI(t) should more accurately be referred to as Power Return On Investment (PROI), because it in fact measures the ratio of two power flows (i.e., flows of energy per year) [Murphy et al., 2016; Raugei et al., 2018; Carbajales-Dale, 2019].
3.4.2 Goal definition
In the past, NEAs have been carried out with a range of different goals, which may be classified into three broad categories [Carbajales-Dale et al., 2015]:
• Short-term analysis of a specific energy system (e.g., PV electricity production);
• Comparative assessment of a range of energy systems (e.g., PV vs. other electricity production technologies);
• Calculation of the (minimum) EROI that a technology (or mix of technologies) must have to (either single-handedly or when combined) adequately support a given industrial society in the future.
Clearly, each of the goals enumerated above requires setting appropriate (and different) system boundaries (cf. Section 3.4.4).
Goal category (1) is the most straightforward of the three, and the one to which the guidelines of the present document most directly and comprehensively refer. It may be used to assess the development of the EROI of a given technology (e.g., PV) in the course of time. It is not suited for comparisons across technologies.
The goal category (2) is limited to a relatively short-term assessment of the most effective / economical5 use of the available energy carriers. This is because the EROI metric as defined in NEA does not account for the amount of primary energy resource that is directly exploited (PE), and it does not generally distinguish between renewable and non-renewable energy resources. Therefore, a comparison of EROI results does not help in identifying the technology that makes the most efficient overall use of the available stocks of energy resources, and which may therefore be the preferable option in the long term. For the latter, we recommend using CED and nr-CED as calculated in process-based LCA.
Also, the inclusion of energy storage devices within the system boundary is not fully justified under goal category (2), since the majority of electricity production technologies (including renewables like PV and wind electricity, as well as baseload technologies such as coal-fired and nuclear electricity) are, in fact, not able to single-handedly follow the pattern of electricity demand, and, if deployed on their own, they would all require some storage capacity (and/or complementary generation assets) in order to do so. That being the case, it is in fact considered preferable and more meaningful to only address the issue of energy storage at
5 “Economical” is not to be intended here in the monetary term, but in the more general sense of “giving good value or return in relation to the effort expended”.
Task 12 Sustainability – Methodological Guidelines on Net Energy Analysis of Photovoltaic Electricity
22
the level of a country’s or region’s or utility’s grid mix, rather than at the level of any individual electricity production technology [Carbajales-Dale et al., 2015].
Finally, addressing goal category (3) entails a further widening of the system boundary to also include a number of energy ‘investments’ that are indirectly required to perform the intended function at the societal level, i.e., provide a sufficient short-term net energy ‘return’ to society. As a bare minimum, attempting to assess what is the minimum “sufficient” net energy return must be restricted to the specific context of the country / region of interest, while ensuring the consistent use of suitable primary energy units in both numerator and denominator (cf. Sections 2.2 and 3.1). Even so, as discussed in Section 3.4.4, the quantitative determination of the minimum EROI that results in a “sufficient” net energy ‘return’ to support an industrial society remains the object of speculation [Hall et al., 2009; Lambert et al., 2014; Raugei et al., 2019a,b].
➢ It is therefore considered mandatory to explicitly state the intended goal of the study prior to presenting the results of any NEA of PVs.
3.4.3 Functional unit
We recommend the following functional unit for the NEA of PV electricity:
• 1 MJ (or alternatively 1 kWh) of AC electricity delivered to the grid at point of connection (suitable for comparing PV technologies, module technologies, and electricity generating technologies in general).
Aspects of dispatchability or intermittency of AC electricity produced with different technologies shall not be addressed on technology level but on the level of grid mixes provided by utilities (cf. Section 3.4.2).
For further details, the reader is referred to the companion document “Methodology Guidelines on Life Cycle Assessment of Photovoltaic Electricity” [Frischknecht et al., 2020b], Section 3.2.2. The same methodological guidelines apply here too.
3.4.4 System boundary
In spite of the deceptively simple definition of EROI as an energy ratio (cf. Section 2.2), its actual calculation is intimately dependent on the choice of system boundary, which affects what is included in both the numerator (the energy delivered – also referred to as ‘returned’ – by the system) and the denominator (the energy ‘invested’) [Zhang et al., 2013].
Effects on the numerator of the EROI ratio
The way in which the boundary affects the numerator is relatively straightforward: it defines the stage of the energy supply chain at which an energy carrier is identified as the system’s output (e.g., whether a NEA refers to a fossil fuel at the well or mine head, to a refined secondary fuel such as, for instance, heavy fuel oil or kerosene, to electricity at the power plant gate, or to electricity delivered at the point of use) [Hall et al., 2014].
➢ In comparative NEAs (cf. goal category (2) as defined in Section 3.4.2), it is considered mandatory to always explicitly state the energy carrier to which each calculated EROI applies (e.g., electricity at the power plant gate), and to refrain at all times from explicitly or implicitly (e.g., by presenting them alongside one another in the same table or figure) comparing EROI results that apply to different energy carriers (e.g., fuels vs. electricity) (Raugei, 2019a,b). Note that such comparisons have a short-term perspective (showing the economical/effective use of available energy
Task 12 Sustainability – Methodological Guidelines on Net Energy Analysis of Photovoltaic Electricity
23
carriers) and do not allow the identification of long-term optimal energy technologies (showing the sustainable/efficient use of primary energy resources) because the main primary energy resource being harvested is excluded from the calculation of EROI, and no distinction is made between renewable and non-renewable energy resources.
The quantification of the numerator also depends on the choice of allocation procedures for systems involving multiple products. This applies to both NEA and LCA, and it is hereby advised to adhere to the current ISO recommendations on allocation [ISO, 2006b].
Effects on the denominator of the EROI ratio
The dependence of the denominator on the system boundary is more complex, and requires a deeper discussion, as follows.
Level-1 (narrow boundary)
In the narrowest possible definition of the EROI ratio, only those energy ‘investments’ that are directly input as energy carriers on the scale of the energy transformation process(es) being considered would take part in the calculation of the denominator (in units of energy carrier, i.e., thermal energy or electrical energy). A reduced-scope analysis of this type would essentially correspond to only accounting for those direct energy ‘investments’ that would be characterized as ‘foreground’ inputs in LCA6. While unquestionably the easiest option, and the one often capable of producing the most precise results, adopting such a narrow system boundary would arguably be misguided since: (a) as already explained in Section 2.2, it would entail the inconsistent sum of a range of ‘investments’ which are supplied as different and not directly comparable energy carriers (e.g., liquid fuels and electricity); and (b) it would often result in the exclusion of a number of potentially significant energy ‘investments’ which take place in the system’s ‘background’. Adopting this narrowest approach is therefore not recommended.
Level-2 (intermediate boundary)
A wider − and arguably more methodologically correct − definition of system boundary entails including in the analysis not only the direct energy investments (those taking place at the foreground level), but also all the indirect (background) ‘investments’ which occur along the supply chains of the foreground inputs (i.e., also including the ‘embodied primary energy’ of the direct material and energy inputs), and expressing all investments in units of their primary energy demand (cf. Section 2.2). This is the system boundary that best matches the one typically adopted in most process- and product-oriented attributional LCAs, and it is the largest system boundary that can still be addressed in terms of purely physical units. It is also the boundary that ensures the maximum internal methodological consistency in comparative NEAs of different energy systems (cf. goal category (2) as defined in
6 The LCA definition of ‘foreground’ refers to those processes “…that are under direct control of the producer of the good or operator of the service, or user of the good or where he has decisive
influence…This covers firstly all in-house processes of the producer or service operator of the
analyzed system. Secondly…also all processes and suppliers of purchased made-to-order goods and
services, i.e., as far as the producer of service operator of the analyzed system can influence them by
choice or specification” [JRC, 2010, p.97]. By contrast, background data “…comprises those processes that are operated as part of the system, but that are not under direct control or decisive
influence of the producer of the good (or operator of the service, or user of the good). The background
processes and systems are hence outside the direct influence or choice of the producer or service
operator of the analyzed system” [JRC, 2010, p. 98].

Task 12 Sustainability – Methodological Guidelines on Net Energy Analysis of Photovoltaic Electricity
24
Section 3.4.2), as well as external methodological consistency with the largest number of published and peer-reviewed LCAs and NEAs to date. From a practical standpoint, in order to ensure that such consistency is indeed attained, the use of a coherent source of data (e.g., the same vetted and trustworthy LCI database) and calculation method (i.e., the CED method as described in [Frischknecht et al., 2007; Frischknecht et al., 2015] and implemented in selected LCA software packages) is recommended.
➢ The adoption of this intermediate (wider, but still based on purely physical units) system boundary that includes direct and indirect energy investments is therefore recommended here for the NEA of PV electricity (cf. goal category (1) as defined in Section 3.4.2), as well as for all NEAs aimed at comparing alternative electricity production technologies (cf. goal category (2) as defined in Section 3.4.2).
Level-3 (wide boundary)
Setting an even wider system boundary is possible in principle, and in fact, attempts at doing so are documented in the literature [Prieto and Hall, 2013; Lambert et al., 2014]. In general terms, the system boundary may be further expanded to also include those resources that are related to the life cycle (manufacturing, operation, and end-of-life) of the analysed system, but which are not directly quantifiable in terms of mass or energy, and which are only normally accounted for as monetary inputs (such as insurance, etc.).
Such a boundary expansion may be considered appropriate when the intended goal of the NEA is to investigate whether an energy technology is capable of meeting the minimum EROI that is required at the societal level (cf. goal category (3) as defined in Section 3.4.2). However, it should be acknowledged that setting any specific benchmark value for such ‘minimum’ EROI is intrinsically fraught with difficulties, for two important reasons.
Firstly, as discussed in Section 2.2, EROI values are only comparable when they are calculated for the same type of energy carrier (e.g., thermal fuels or electricity, but not a mix of the two); therefore, instead of a single ‘minimum’ EROI value, it would be more appropriate to consider a set of EROI ‘minima’, each specific to a well-defined energy carrier. Also, as already mentioned, EROI does not capture the long-term sustainability implications of renewable vs. non-renewable primary energy resources, so even such EROI ‘minima’ should be interpreted with caution if the mix of primary energy resources used is subject to change. Secondly, any assumed ‘minimum’ EROI threshold implicitly rests on an assumed average efficiency for the down-stream processes in which the various energy carriers are used and converted into useful work. Thus, the historical predominance of relatively inefficient thermal processes has led to the assumption that a relatively high ‘minimum’ EROI [Hall et al., 2009; Lambert et al., 2014] must be achieved to support modern societies. However, in the coming decades, “a massive cross-sector electrification and a concomitant shift away from thermal processes – the efficiency of all of which is severely constrained by the Carnot ratio (max = 1 - TC/TH) – may open the door to achieving the required services with much lower demand for primary energy, which in turn entails that a significantly lower EROI than previously assumed may suffice” [Raugei, 2019b].
Furthermore, opting for a ‘level-3’ system boundary inescapably calls for hybrid physical-and-economic approaches, ranging from the application of crude ‘energy-to-money’ ratios [Prieto and Hall, 2013] to the more elaborate use of economic Input-Output tables as done in hybrid Input-Output LCA (IO-LCA)7 [Joshi, 2000]. These approaches are not followed in this
7 It is noted, though, that human labour is excluded from classical Input-Output analysis [Leontief,
1985].

Task 12 Sustainability – Methodological Guidelines on Net Energy Analysis of Photovoltaic Electricity
25
subtask, as it is believed that more confidence in employing them is needed before their application may be recommended [Frischknecht et al., 2020b].
Finally, another insidious problem with such expanded system boundary is that the system’s behaviour at the societal level is always intrinsically dynamic (cf. Section 3.4.1), as there often is no readily identifiable ‘system lifetime’. For instance, if monetary investments made at the level of a country’s entire PV industry are converted into energy units and included in the calculation of the EROI denominator (as done for instance in [Prieto and Hall, 2013]), then the fundamental premise that the system is being analysed using an ‘integrative’ approach over its full life cycle no longer holds, especially during periods of heavy industry-level investment. If the temporal boundary of the analysis is then artificially constrained (e.g., to one year), and the calculations are performed as though they still referred to an ‘integrated cycle’ of the same duration, then an implicit mismatch is produced between the intended goal of the analysis and the adopted system boundary, and the results lose validity [Carbajales-Dale et al., 2015].
➢ In light of all the considerations above, it is considered mandatory to explicitly state the adopted system boundary (and to discuss the inherent methodological limitations) prior to presenting the results of any NEA of PVs.
3.4.5 Modelling allocation and recycling
Consistent allocation rules are demanded for all multifunction processes8, use of recycled material inputs, recycling of materials at end of life, and use of waste heat (e.g., heat recovery in municipal waste incinerators). We recommend following international standards regarding allocation, which is addressed in the ISO standard 14044, Clause 4.3.4 "Allocation" [ISO, 2006b].
3.5 Reporting and communication
Reporting of items 1 to 16 below is considered mandatory. The list of items is separated in key parameters required in both the captions of figures and tables showing the results of the NEA and in the NEA report (items 1 to 6), and further important aspects which should be documented elsewhere in the NEA report.
Key parameters that should be documented in captions of figures and tables:
1. PV technology (single and multi-crystalline silicon, CdTe, CIGS, amorphous silicon, micromorphous silicon, etc.);
2. Type of system (e.g., roof-top, ground mount, fixed tilt or tracker);
3. Module-rated efficiency and degradation rate (if not included in performance ratio);
4. Lifetime for both PV modules and balance of system (BOS);
5. Location of installation;
6. Annual irradiation level and expected annual electricity production with the given orientation and inclination or system’s performance ratio (PR).
8 Those processes simultaneously producing several different products, such as off-grade silicon
supply as a by-product of electronic-grade silicon.

Task 12 Sustainability – Methodological Guidelines on Net Energy Analysis of Photovoltaic Electricity
26
Other important aspects that should be documented in the NEA report:
7. Place/country/region of electricity production modelled;
8. Timeframe of data used in the analysis;
9. Whether EROIel or EROIPE-eq is calculated, and if the latter, the assumed electricity mix or technology/-ies and thus resulting grid mix’s or technology’s/-ies’ efficiency (cf. Section 3.1);
10. Goal of the study (cf. Section 3.4.2);
11. System boundary (cf. Section 3.4.4);
12. Approach used if not process-based (e.g. environmentally extended input-output tables, hybrid analysis);
13. LCA database(s) (e.g., Ecoinvent, GaBi, ELCD, etc.) and version used (if applicable);
14. LCA software tool (e.g., SimaPro, GaBi, OpenLCA, etc.) and version used (if applicable);
15. Primary energy factors applied and approach used;
16. Any major assumptions made on the production of input materials.

Task 12 Sustainability – Methodological Guidelines on Net Energy Analysis of Photovoltaic Electricity
27
REFERENCES
Arvesen A., Hertwich E.G., 2015. More caution is needed when using life cycle assessment to determine energy
return on investment (EROI). Energy Policy 76:1-6.
Bhandari K.P., Collier J.M., Ellingson R.J., Apul D.S., 2015. Energy Payback Time (EPBT) and energy return on
energy invested (EROI) of solar photovoltaic systems: A systematic review and meta-analysis. Renewable and
Sustainable Energy Reviews 47:133-141.
Berndt E.R., 1982. From Technocracy to Net Energy Analysis: Engineers, Economists and Recurring Energy
Theories of Value. Studies in Energy and the American Economy Discussion Paper No. 11, MIT-EL 81-065WP.
Retreived from: http://dspace.mit.edu/bitstream/handle/1721.1/2023/SWP-1353-09057784.pdf.
Brandt A.R., 2011. Oil depletion and the energy efficiency of oil production: The case of California. Sustainability
3(10): 1833-1854.
Brandt A.R., Carbajales-Dale M., Barnhart C.J., 2013. Calculating systems-scale energy efficiency and net energy
returns: A bottom-up matrix-based approach. Energy 62:235–247.
Brockway P.E., Owen A., Brand-Correa L.I., Hardt L., 2019. Estimation of global final-stage energy-return-on-
investment for fossil fuels with comparison to renewable energy sources. Nature Energy 4:612-621.
Carbajales-Dale M., Barnhart C.J., Brandt A.R., Benson S.M., 2014. A better currency for investing in a
sustainable future. Nature Climate Change 4:524-527.
Carbajales-Dale M., Raugei M., Barnhart C.J., Fthenakis V., 2015. Energy return on investment (EROI) of solar
PV: an attempt at reconciliation. Proceedings of the IEEE, DOI: 10.1109/JPROC.2015.2438471.
Carbajales-Dale M., 2019. When is EROI Not EROI? Biophysical Economics and Resource Quality 4,16.
Chambers, R.S., Herendeen, R.A., Joyce, J.J., Penner, P.S., 1979. Gasohol: Does it or doesn’t it produce positive net energy? Science 206:789–795.
Clausius R., 1885. Über die Energievorräthe der Natur und ihre Verwerthung zun Nutzen der Menschheit (On the
Energy Supplies of Nature and the Utilization of them for the Benefit of Mankind). Bonn: Verlag von Max Cohen &
Sohn.
Cleveland C., 1992. Energy quality and energy surplus in the extraction of fossil fuels in the U.S. Ecological
Economics 6:139–162.
Cleveland C., 2008. Ten fundamental principles of net energy. Retrieved from:
http://www.eoearth.org/view/article/51cbef057896bb431f69be35.
Cleveland C., 2013. Net energy analysis. Retreived from: http://www.eoearth.org/view/article/154821/.
Cleveland C.J., Costanza R., Hall C.A.S., Kaufmann R., 1984. Energy and the U.S. Economy: a biophysical
perspective. Science 225:890–897.
Dale B.E., 2007. Thinking clearly about biofuels: ending the irrelevant ‘net energy’ debate and developing better performance metrics for alternative fuels. Biofuels, Bioproducts & Biorefining 1:14-17.
Frischknecht R., Jungbluth N., Althaus H.-J., Bauer C., Doka G., Dones R., Hellweg S., Hischier R., Humbert S.,
Margni M., Nemecek T., 2007. Implementation of Life Cycle Impact Assessment Methods. ecoinvent report No. 3,
v2.0. Swiss Centre for Life Cycle Inventories, Dübendorf, CH. Retrieved from: www.ecoinvent.org.

Task 12 Sustainability – Methodological Guidelines on Net Energy Analysis of Photovoltaic Electricity
28
Frischknecht R., Wyss F., Büsser Knöpfel S., Lützkendorf T., Balouktsi M., 2015. Cumulative energy demand in
LCA: the energy harvested approach. The International Journal of Life Cycle Assessment 20: 957–969.
Frischknecht R., Stolz P., Krebs L., de Wild-Scholten M., Sinha P., Fthenakis V., Kim H. C., Raugei M., Stucki M.,
2020, Life Cycle Inventories and Life Cycle Assessment of Photovoltaic Systems, International Energy Agency
(IEA) PVPS Task 12, Report T12-19:2020.
Frischknecht R., Stolz P., Heath G., Raugei M., Sinha P., de Wild-Scholten M., 2020b. Methodology Guidelines
on Life Cycle Assessment of Photovoltaic Electricity, 4th edition. International Energy Agency (IEA), Paris. Report
IEA-PVPS T12-18:2020.
Geddes P., 1884. An analysis of the principles of economics. In: Proceedings of the Royal Society of Edinburgh,
XII, pp 943–980.
Hall C.A.S., Lavine M., Sloane, J., 1979. Efficiency of energy delivery systems: I. An economic and energy
analysis. Environmental Management 3:493-504.
Hall C.A.S., Balogh S., Murphy D.J.R., 2009. What is the Minimum EROI that a Sustainable Society Must Have?
Energies 2:25-47.
Hall C.A.S., Lambert J.G., Balogh S.B., 2014. EROI of different fuels and the implications for society. Energy
Policy 64:141-152.
Hatfield M., 1974. Net Energy. The U.S. Congressional Record, Vol. 120, Part 5, March 11, 1974, pp. 6053-6076.
Henshaw P.F., King C., Zarnikau J., 2011. System Energy Assessment (SEA), Defining a Standard Measure of
EROI for Energy Businesses as Whole Systems. Sustainability 3:1908-1943.
Herendeen R., 1988. Net energy considerations. In: West R., Kreith F. (Eds.), Economic Analysis of Solar
Thermal Energy Systems. MIT Press, pp. 255–273.
Herendeen R., 2004. Net energy analysis: concepts and methods. In: Cleveland C.J. (Ed.), Encyclopedia of
Energy. Elsevier, pp. 283–289.
International Organization for Standardization (ISO), 2006a. 14040 - Environmental Management. Life Cycle
Assessment. Principles and Framework.
International Organization for Standardization (ISO), 2006b. 14044 - Environmental Management. Life Cycle
Assessment. Requirements and Guidelines.
Itten R., Wyss F., Frischknecht R., Blanc I., Heath G., Raugei M., Sinha P., Wade A., 2014. Life cycle assessment
of future photovoltaic electricity production from residential-scale systems operated in Europe. IEA-PVPS Task
12, Report T12-05:2014.
Jevons W. S., 1965. The Coal Question. An Inquiry Concerning the Progress of the Nation and the Probable
Exhaustion of our Coal-Mines, 3rd revised edition, New York, USA.
Joint Research Centre (JRC) - Institute of Environment and Sustainability, European Commission, 2010. ILCD
Handbook: General guide for Life Cycle Assessment: detailed guidance. Retreived from:
http://lct.jrc.ec.europa.eu/pdf-directory/ILCD-Handbook-General-guide-for-LCA-DETAIL-online-12March2010.pdf.
Joshi S., 2000. Product Environmental Life-Cycle Assessment Using Input-Output Techniques. Journal of
Industrial Ecology 3(2&3):95-120.
King C., Hall C.A.S., 2011. Relating Financial and Energy Return on Investment. Sustainability 3:1810-1832.
Lambert J.G., Hall C.A.S., Balogh S., Gupta A., Arnold M., 2014. Energy, EROI and quality of life. Energy Policy
64:153-167.
Leach G., 1975. Net energy-is it any use? Energy Policy 3:332–344.

Task 12 Sustainability – Methodological Guidelines on Net Energy Analysis of Photovoltaic Electricity
29
Leccisi E., Raugei M., Fthenakis V., 2016. The energy and environmental performance of ground-mounted
photovoltaic systems – a timely update. Energies 9(8):622.
Leontief W., 1985. Input-Output Analysis. In: Bever M.B. (Ed.), Encyclopedia of Materials Science and
Engineering, Volume 3, F-I, Pergamon Press, Oxford and other locations, p. 2339-2349.
Lloyd, B., Forest, A.S., 2010. The transition to renewables: Can PV provide an answer to the peak oil and climate
change challenges? Energy Policy 38 (11):7378–7392.
Mulder K., Hagens N.J., 2008. Energy Return on Investment: Toward a Consistent Framework. AMBIO: A
Journal of the Human Environment 37(2):74-79.
Murphy D.J., Hall C.A.S., 2010. Year in review—EROI or energy return on (energy) invested. Annals of the New
York Academy of Sciences 1185:102–118.
Murphy D.J., Hall C.A.S., 2011. Energy return on investment, peak oil, and the end of economic growth. Annals of
the New York Academy of Sciences 1219:52-72.
Murphy D.J., Hall C.A.S., Dale M., Cleveland C., 2011. Order from Chaos: A Preliminary Protocol for Determining
the EROI of Fuels. Sustainability 3: 1888-1907.
Murphy D., Carbajales-Dale M., Moeller D., 2016. Comparing Apples to Apples: Why the Net Energy Analysis
community needs to adopt the LCA framework. Energies 9(11):917.
Odum H.T., 1983. Systems Ecology: An Introduction. John Wiley and Sons, Hoboken, NJ, USA.
Pickard W.F., 2014. Energy return on energy invested (EROI): a quintessential but possibly inadequate metric for
sustainability in a solar-powered world? Proceedings of the IEEE 102(8):1118–1122.
Prieto P., Hall C.A.S., 2013. Spain’s Photovoltaic Revolution. The Energy Return on Investment. Springer, ISBN
978-1-4419-9437-0.
Raugei M., 2013a. Energy Pay-Back Time: methodological caveats and future scenarios. Progress in
Photovoltaics: Research and Applications 21:797-801.
Raugei M., 2013b. Comments on "Energy intensities, EROIs (energy returned on invested), and energy payback
times of electricity generating power plants" - making clear of quite some confusion. Energy 59:781-782.
Raugei M., Leccisi E., 2016. A comprehensive assessment of the energy performance of the full range of
electricity generation technologies deployed in the United Kingdom. Energy Policy, 90:46-59
Raugei M., Leccisi E., Azzopardi B., Jones C., Gilbert P., Zhang L., Zhou Y., Mander S., Mancarella P., 2018. A
multi-disciplinary analysis of UK grid mix scenarios with large-scale PV deployment. Energy Policy 114:51-62
Raugei M., 2019a. Net Energy Analysis must not compare apples and oranges. Nature Energy 4:86-88.
Raugei M., 2019b. Energy Return On Investment – setting the record straight. Joule 3(8): 1810-1811.
Raugei M., Carbajales-Dale M., Barnhart C.J., Fthenakis V., 2015. Rebuttal: "Comments on 'Energy
intensities, EROIs (energy returned on invested), and energy payback times of electricity generating power plants'
- Making clear of quite some confusion". Energy 82(15):1088-1091.
Raugei M., Sgouridis S., Murphy D., Fthenakis V., Breyer C., Bardi U., Barnhart C., Brandt A., Buckley A.,
Carbajales-Dale M., Csala D., de Wild-Scholten M., Frischknecht R., Heath G., Jaeger-Waldau A., Jones C.,
Keller A., Leccisi E., Mancarella P., Pearsall N., Siegel A., Sinke W., Stolz P., 2017. Energy Return on Energy
Invested (ERoEI) for photovoltaic solar systems in regions of moderate insolation: A comprehensive response.
Energy Policy 102:377-384.
Sacher E., 1881. Grundzüge einer Mechanik der Gesellschaft, Theil I (Outlines of a Mechanics of Society, Part I).
Jena: Gustav Fischer.

Task 12 Sustainability – Methodological Guidelines on Net Energy Analysis of Photovoltaic Electricity
30
Sgouridis, S.; Csala, D.; Bardi, U., 2016. The sower’s way: Quantifying the narrowing net-energy pathways to a
global energy transition. Environmental Research Letters 11, 094009.
Slesser M. (Ed.), 1974. Energy Analysis Workshop on Methodology and Conventions, pp. 89. IFIAS, Stockholm,
Sweden.
Zhang Y., Colosi L.M., 2013. Practical ambiguities during calculation of energy ratios and their impacts on life
cycle assessment calculations. Energy Policy 57: 630-633.

Task 12 Sustainability – Methodological Guidelines on Net Energy Analysis of Photovoltaic Electricity
1