method validation and quality control procedures for ... pihlstrom.pdf · method validation and...
TRANSCRIPT

Method Validation and Quality ControlProcedures for Pesticide Residue Analysis in
Food and FeedSANCO/10684/2009
Tuija Pihlström
AQC coordinator
National Food Administration, Sweden
3 th LAPRW Montevideo _2011

Outline of the presentation
(A) Goal and background of the guidelines
(B) History of the EU QC guidelines
(C) Procedure for the revision (Advisory group, Questionnaire, National Reference Laboratories, Workshop)
(D) Previous revisions
3 th LAPRW Montevideo _2011

The guidance in this document is intended
• For laboratories involved in the official monitoring of pesticide residues in food and feed in the European Union.
• The document describes the analytical quality control (AQC) requirements and the method validation
3 th LAPRW Montevideo _2011

Legal basis
The document entails mutually acceptable scientific rules for official pesticide residue analysis within the EU as agreed by all Member States of the European Union and constitutes a technical guideline in the sense of article 28 of Regulation 396/2005. It should thus be consulted in audits and accreditations of official pesticide residue laboratories according to ISO/IEC 17025.
3 th LAPRW Montevideo _2011

Requirements for official laboratories
1. Implementation of ”Method validation and quality control procedures for pesticide residues analysis in food an feed”
2. Accredited according to the ISO/IEC 17 025 standard
3. Participation in EU Proficiency tests
3 th LAPRW Montevideo _2011

Why do we need the guidelines?
To harmonize cost effective AQC in the EU (to find an optimum between cost and output(efficiency/quality)
To help monitoring laboratories achieve an acceptable standard
The reported results are reliable and consistent with other similar results
To support compliance with ISO/IEC 17025 accreditation standard
3 th LAPRW Montevideo _2011

Introduction - history of the guidelines
Harmonised guidelines were discussed first at the EU Workshop on Coordinated Analytical Quality Control 1997
3 th LAPRW Montevideo _2011

Reviews:
2. Doc. SANCO/3103/2000
-discussed at 2nd EU AQC,1999, in Greece
3. Doc. SANCO/10476/2003
-discussed at 3rd EU AQC, 2003 in UK
4. Doc. SANCO/10232/2006
-discussed at 4th EU AQC, 2005 in Sweden
5. Doc. SANCO/3131/2007
-discussed at 5th EU AQC, 2007 in Spain (EU RL)
6. Doc. SANCO 10684/2009
-discussed at 6th EU AQC, 2009 in Copenhagen (EU RL)
7. Doc. SANCO xxxx/2011
-will be discussed at 7th EU AQC, 2011 in Freiburg (EU RL)
3 th LAPRW Montevideo _2011

Advisory group-AVG• Mette Erecius Poulsen EURL-CER
• Miquel Gamón EU RL-FV
• Amadeo Fernández R. Alba EU RL-FV
• Ralf Lippold EU RL-AO
• Michelangelo Anastassiades EU RL-SRM
• André de Kok NL
• Stewart Reynolds UK
• Antonio Valverde ES
• Arne Andersson (1997-2009) SE
• Sonja Messelter (2009) A
• Hans Mol (2009) NL
• Darinka Steinberger (2011) SV
• Magnus Juzkec (2011) D
• Luis Martin-Plaza COM
• Tuija Pihlström (Coordinator) SE3 th LAPRW Montevideo _2011

Mechanism for updating the guidelines
Selection of issues/topics in guidelines that need updating by the Advisory group
Questionnaire to be sent to the NRLs/official laboratories
Workshop –the draft document is discussed
Publication of the revised document (COM)
Since 2006 – EU Reference Laboratories are responsible for the revision
3 th LAPRW Montevideo _2011

Guidance in
The whole analytical chain (from sampling to reporting results)-quality control
To define minimum criteria for validation and analysis (allows free choice of method)
3 th LAPRW Montevideo _2011

Table of contents
• Accreditation
• Sampling, transport, processing and storage of samples
• Pesticide standards, calibration solutions, etc.
• Extraction and concentration
• Contamination and interference
• Analytical calibration, representative analytes
• Analytical methods and analytical performance
• Method validation
• Routine recovery determination
• Proficiency testing and analysis of reference materials
• Confirmation of results
• Reporting of results
3 th LAPRW Montevideo _2011
Revision in 2005:
Main topics in the previous revisions
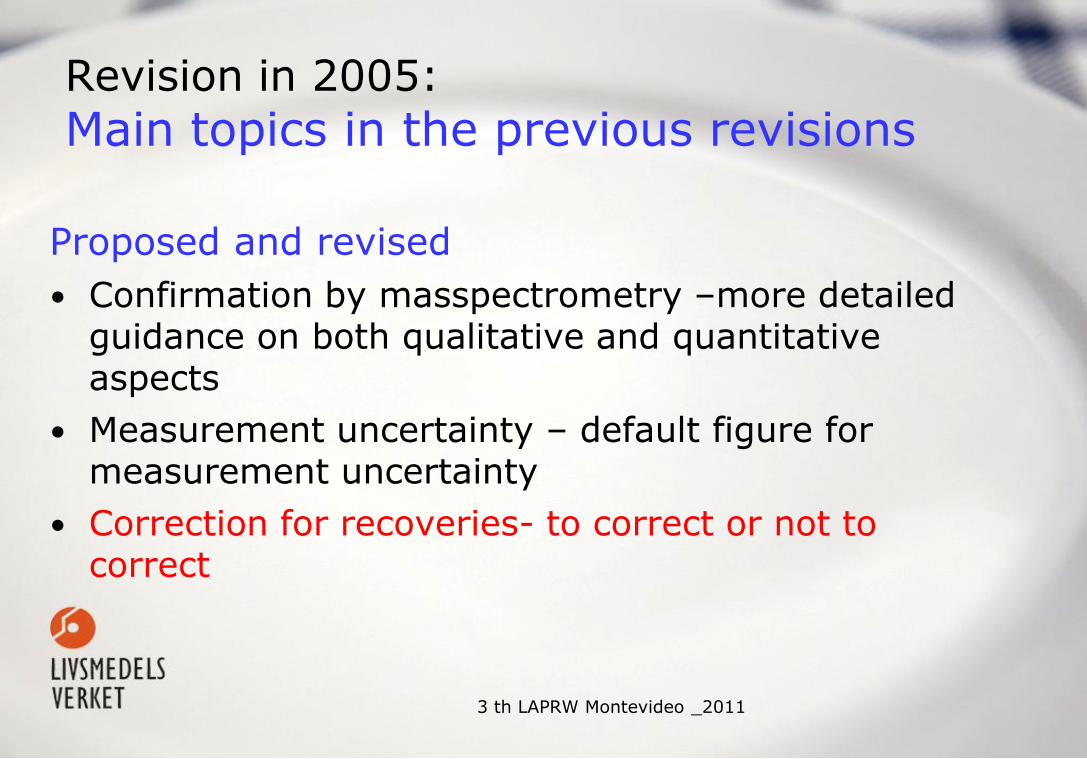
Proposed and revised
• Confirmation by masspectrometry –more detailed guidance on both qualitative and quantitative aspects
• Measurement uncertainty – default figure for measurement uncertainty
• Correction for recoveries- to correct or not to correct
3 th LAPRW Montevideo _2011

Revision in 2007:
Main topics in the previous revisions
Proposed and revised
• Frequencies and minimum number of analytes for calibration Table 1
• Frequencies and minimum number of analytes for routine recovery Table 2
• Validation – inclusion of animal products and cereals
• Common interpretation of results in respect of the correction of results for recovery
3 th LAPRW Montevideo _2011

Revision in 2009:
Main topics in the previous revisions
Proposed and revised
• Mass spectrometry-requirement for identification
• New definitions-identification /confirmation
• Appendix A :The Validation procedure and examples
• Appendix B : Examples of conversion factors
• Annex 1: Selection of representative matrices
• Qualiatative screening methods
• Reporting results - correction for recoveries
3 th LAPRW Montevideo _2011

Main topics in the previous revisionsMeasurement uncertainty
Purpose:
A general fixed figure for measurement uncertainty
In order to:
• unify the approaches of measurement uncertainty
• have onsistency in enforcement
3 th LAPRW Montevideo _2011

A default expanded uncertainty figure for enforcement authorities
Based on the results of the first 7 EU proficiency test on fruit and vegetables
As a result, for most pesticide/matrix combinations the inter-laboratory reproducibility is RSD wR<25%
3 th LAPRW Montevideo _2011

A default expanded uncertainty figure of 50%
• With 95% confidence within ±2SD (k=2), which leads to expanded uncertainty value of 50%
• An exceedence of the acute reference dose, an expanded uncertainty with a lower confidence level can be applied
• Provided that the laboratory proves its owncalculated expanded uncertainty to be less than 50%.
3 th LAPRW Montevideo _2011

Definitions
Ex. MRL =1 mg/kg
1) Found residue = 1.0 mg/kg
-> no exceedence of the MRL
2) Found residue = 1.1 mg/kg
-> exceedence of the MRL no enforcement
3) Found residue = 2.2mg/kg
-> exceedence of the MRL and enforcement taking account 50 % measurement uncertainty
3 th LAPRW Montevideo _2011

Main topics in the previous revisionsConfirmation of results
Regarding paragraphs “confirmation by mass
spectrometry” needs updating and expanding. More detailed guidance is required, particularly there are needs to provide guidance on both qualitative (detection/confirmation) and quantitative (determination) aspects.
3 th LAPRW Montevideo _2011
3 th LAPRW Montevideo _2011
“Confirmation by mass spectrometry”Requirements for mass spectrometry
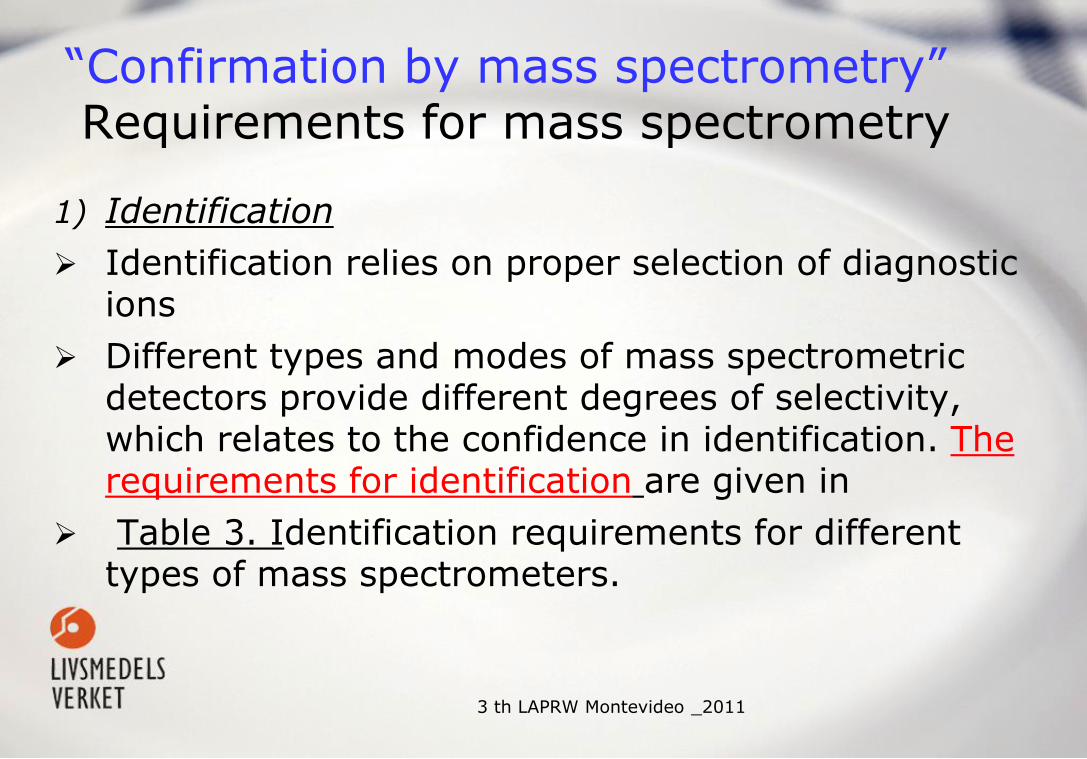
1) Identification
Identification relies on proper selection of diagnostic ions
Different types and modes of mass spectrometric detectors provide different degrees of selectivity, which relates to the confidence in identification. Therequirements for identification are given in
Table 3. Identification requirements for different types of mass spectrometers.

Table 3. Identification requirements for different types of mass spectrometers
MS mode: Single MS (standard
mass resolution)
Single MS (high
resolution/high mass
accuracy)
MS/MS
Typical systems
(examples)
quadrupole, ion trap,
time-of-flight (TOF)
TOF, Orbitrap, FTMS,
magnetic sector
Triple quadrupole ion trap,
hybride MS (e.g. Q-TOF, Q-
trap)
Acquisition: Full scan,
Limited m/z range,
Selected ion monitoring
(SIM)
Full scan,
Limited m/z range,
Selected ion monitoring
(SIM)
Selected/multiple reaction
monitoring (SRM/MRM),
full scan product-ion spectra
Requirements for
identification:
≥ 3 diagnostic ions,
(preferably including
quasi molecular ion)
≥ 2 diagnostic ions
(preferably including the
quasi molecular ion).
Mass accuracy < 5 ppm.
At least one fragment ion.
≥ 2 product ions
Ion ratio(s): according to Table 5
3 th LAPRW Montevideo _2011

“Confirmation by mass spectrometry”
2) Determination (= quantitative result according to the AQC criteria)
Mass spectrometric determination of residues is usually carried out in conjunction with a chromatographic separation technique to simultaneously provide
• i) retention time;
• ii) ion mass/charge ratio; and
• iii) abundance data
New definitions in the Glossary3 th LAPRW Montevideo _2011

Table 5 Recommended maximum permitted tolerances for
relative ion intensities using a range of spectrometrictechniques
Relative intensity(% of base peak)
EI-GC-MS(relative)
CI-GC-MS, GC-MSn,
LC-MS, LC-MSn
(relative)
> 50 % 10 % 20 %
> 20 % to 50 % 15 % 25 %
> 10 % to 20 % 20 % 30 %
≤ 10% 50 % 50 %
3 th LAPRW Montevideo _2011

“Confirmation by mass spectrometry”
3) Confirmation (= two or more analysis)
3 th LAPRW Montevideo _2011

Main topics in the previous revisionsCommon interpretation of results in respect of the correction of results for recovery
Purpose and an intended effect of the correction:
1. Correction should improve the results- closer to the “true value”
2. The result can be compensated for the incomplete extraction of the analyte from sample
3. Common interpretation in regulation of contaminants/VMPs takes account correction for recovery
3 th LAPRW Montevideo _2011

Main topics in the previous revisionsCommon interpretation of results in respect of the correction of results for recovery
SANCO 10232/2006
§83 Residue data exceeding an MRL must be corrected for
recovery. The adjustment should be stated based either using the mean value from three recoveries performed in same matrix and analysed in the same batch or using two standard additions e.g. at two and five times the residue in the sample. In general, residues below MRLs are not to be adjusted for recovery, when the batch recoveries fall within the acceptable range. If residue data are adjusted for recovery this should be done as described above and must be stated.
3 th LAPRW Montevideo _2011

Main topics in the previous revisionsCommon interpretation of results in respect of the correction of results for recovery
How to measure “recovery”:
1. The mean value of 3 recoveries analysed in the same matrix/batch as proposed. Too laborious and not normal praxis with 3 recovery tests in the same matrix.
2. At which level should the recoveries be measured?
3. Normal praxis one single (or two) recovery
4.
3 th LAPRW Montevideo _2011

Main topics in the previous revisionsCommon interpretation of results in respect of the correction of results for recovery
4. What is criteria for acceptable recovery? From validation?
5. Residue data to establish MRL are not corrected for recovery
6. To correct residues >MRL but not <MRL?
3 th LAPRW Montevideo _2011

3 th LAPRW Montevideo _2011
Reporting results
§83 In general, residues data do not have to be
adjusted for recovery, when the mean recovery is in the range of 70-120% . If they are adjusted for recovery, then this must be stated.

Reporting results
66. Data on numerical exceedences of the MRL residues must be supported by individual recovery results in the same batch within the range of the mean recovery (70-120 %) ± 2 x RSD, at least for the confirmatory analyses. If recovery within this range cannot be achieved, enforcement action is not necessarily precluded, but the risk of relatively poor accuracy must be taken into account. It is recommended to correct for recovery preferably by using standardaddition according to paragraph 47 or isotopically labelled standards in all cases of violation
3 th LAPRW Montevideo _2011

2008-11-12
2007 Analysis of regular samples
Calibration of the detection system QC
The detection system should be *calibrated (=checked) with all analytes for every batch of analyses.
*at one level =calibration
Purpose of the calibration:
To avoid false negatives
To test sensitivity of the detection system
3 th LAPRW Montevideo _2011

How to select representative analytesfor calibration?
Regularly found pesticides
Occasionally found pesticides
”Difficult” pesticides (unstable, most volatile, most polar, non-polar)
3 th LAPRW Montevideo _2011

Analysis QCRepresentative analytes
”The representative analytes to be calibrated in each batch must be at least 15 analytes plus 25% of the total number of analytes included in the analytical scope of each determination system.“
For example, if the analytical scope of an instrument method covers 40 analytes, the determination system must be calibrated with at least 25 representative analytes. If the scope of analysis in determination system is 20 or less, then all analytes should be calibrated.”
3 th LAPRW Montevideo _2011

Representative analytes
All other analytes
Minimum frequency of calibration
Calibration in each batch of analyses.
At least at the level corresponding to the reporting limit.
A rolling programme at least every third month
At least at the level corresponding to the reporting limit
Analysis of regular samplesTable 1. Minimum frequencies for calibration
3 th LAPRW Montevideo _2011

Analysis of regular samples QCFrequency for routine recovery
Purpose:
Acceptable screening and method at the time of analysis for all analytes searched
In a perfect world - recovery of all analytes measured with each batch.
If not possible the minimum of acceptable frequency of recovery and number of analytes is given.
3 th LAPRW Montevideo _2011

Table 2. Frequency for routine recovery and performance verification
Representative analytes All other analytes
Minimumfrequency of recovery
10% of representativeanalytes (at least 5 per detection system) in each batch of analyses
Within rolling programme to include all other analytes at least every 12 months, but preferably every 6 months
Within a rolling program covering all representative analytes as well as different types of commodities, at different concentration levels including the level corresponding to the reporting limit
At least at the level corresponding to the reporting limit.
3 th LAPRW Montevideo _2011

Appendix B.Examples of conversion factors
The MRL residue definitions for a number of pesticides include not only the parent pesticide, but also its metabolites or other transformation products.
3 th LAPRW Montevideo _2011

Appendix B: Examples of calculation of conversiong factors for residue definition
To types of ”SUM”
EX 1: Aldicarb ( sum of aldicarb + aldicarb sulfoxide + aldicarb sulfone expressed as aldicarb)
EX 2: Triadimefon and Triadimenol (sum of triadimefon and triadimenol
3 th LAPRW Montevideo _2011

Residue Definition
Fenthion, its sulfoxides and sulfones, and their oxygen analogues (oxons), all appear in the residue definition and all should be included in the analysis.
C Fenthion Sum =
1.00 x C Fenthion + 0.946 x C Fenthion SO +
0.897 x C Fenthion SO2 + 1.06 x C Fenthion oxon +
1.00x C Fenthion oxon SO +
0.946 x C Fenthion oxon SO2
3 th LAPRW Montevideo _2011

The validation procedureRepresentative matrices
Validation needs to be performed:
• for all analytes within the scope of the method
• for at least 1 commodity from each of the commodity groups (as far as they are within the claimed scope of the method or as far as applicable to samples analysed in the laboratory)
3 th LAPRW Montevideo _2011

2009-12-04
The validation procedureRepresentative matrices
Selection of representative matrices according to their biological or “analytical” properties
(water, sugar, lipid, pH)
3 th LAPRW Montevideo _2011

Example of representative commodities
Commodity Categories
Commodities included in this category
Typical representative commodities
High water content Pome fruit
Stone fruit
Apples, pears
Apricots, cherries, peaches,
High acid content
and high water content
Citrus fruit
Berries
Currants
Lemon, mandarin, orange
Strawberry, blueberry
3 th LAPRW Montevideo _2011

Example of representative commoditiesCommodity Categories
Commodities included in this category
Typical representative commodities
Meat Read meet
White meat
Fish
Offal
Beef, Pork, game, Chicken, duck
Cod, salmon
Liver , kidney
Milk and milk products
Milk
Cheese
Butter
Cow, buffalo, coat
Eggs Eggs Cicken, dick,quail
Honey Honey
3 th LAPRW Montevideo _2011

The validation procedure
We distinguish between initial validation of a quantitative analysis method to be applied in the laboratory for the first time and to extension of the scope of an existing validated method for new analytes and matrices.
3 th LAPRW Montevideo _2011

Multi residue method (MRM)Procedure of validation
Quantitative Initial full validation
Method fully validated
Quantitative extension of the scope
Extension of the scope to new analytes/matrices
Full validation for new analytes
Simplified validation for new matrices
Quantitative on going method verification (QC data)
Recovery study for other matrices which results will be reported
One level/one replicate
Qualitative validation of screening methods
Future topic?
3 th LAPRW Montevideo _2011

Examples of validation (NFA) in MRM
Initial full validation
Recoveries Level Two levels 0.01 and 0.05
mg/kg
Replicates 5 /level
MatrixOne from each group (mainly
analysed)
Quantification Matrix matched
RepeatabilityRSD
r 1) Calculate RSD
rat each
level/matrix
2) Overall RSDwR
n=30 (all matrices/levels) at each level

Validation of qualitative screening methods
• Focus on detectability
• The detection at the lowest at least in 95% of the samples (i.e. a false-negative rate of 5% is accepted)
• There are no requirements with regard to linearity and recovery.
3 th LAPRW Montevideo _2011

Conclusions
When the document is practical, flexible and general it makes it easier to apply by many more laboratories (=better for all)
Strict and general -more general guidelines are preferred since too specific requirements will lead to disagreements
Minimum criteria define which allows laboratories free choice of methods
Reviewed every second year keeping abreast with technical developments
3 th LAPRW Montevideo _2011

http://europa.eu.int/comm/food/plant/protection/
resources/qualcontrol_en.pdf
3 th LAPRW Montevideo _2011

3 th LAPRW Montevideo _2011
