method of images for the harmonic response of … et...method of images for the harmonic response of...
TRANSCRIPT

Journal of Sound and Vibration (1995) 185(5), 791–808
METHOD OF IMAGES FOR THE HARMONICRESPONSE OF BEAMS AND RECTANGULAR
PLATES
R. G, S. M. V R. S
Acoustics and Dynamics Laboratory, Department of Mechanical Engineering,The Ohio State University, Columbus, Ohio 43210-1107, U.S.A.
(Received 9 June 1994, and in final form 15 August 1994)
The feasibility of calculating the narrow band harmonic response of thin plates andbeams by using the method of images or the ray tracing technique is examined. Thefundamental solution of an infinite plate is employed, in conjunction with appropriatelyplaced images, to obtain the dynamic compliance spectra of simply supported rectangularplates over a wide range of frequencies. Predictions yielded by the method of images are inexcellent agreement with the normal mode expansion technique. Simply supported beamsare analyzed first by considering the fundamental solution of an infinite beam, and secondas a case of a narrow plate with simply supported and roller boundary conditions. Bothapproaches match well with the closed form solutions and with measurements conducted ontwo beams. Several issues including convergence characteristics and high frequency behaviorare discussed.
7 1995 Academic Press Limited
1. INTRODUCTION
Themethodof images or ray tracing techniques have been commonly employed in disciplinessuch as acoustics, optics and electro-magnetics [1, 2]. However, this method has not beenadequately extended to structural vibrations. The only exception seems to be the work onthe regions of enhanced responses on strings or thin plates when excited by random loads[3–7]. For instance, Crandall et al. [3–5] and Lee [6] have obtained the frequency responseof a finite string when excited by a point load whose time history was a wide-band randomprocess. Their image sum method was further extended to calculate the zones of intensifiedresponse on a simply supported rectangular plate that was excited by random point forces.Langley and Taylor [7] have analyzed the same problems by using the reverberant fieldmethod. Cremer and Heckl [8] have presented a wave cycle closure principle but it has beenapplied to satisfy the boundary conditions in the thickness direction of a plate. To the bestof our knowledge, no other researcher has attempted to calculate the narrow-band harmonicresponse of thin plates and beams using the method of images. This paper attempts to fillthis void.
As a second motivation for our work, we consider the issue of narrow-band harmonicanalysis at very high frequencies. We drew inspiration from work in optics and electro-magnetics [2] where researchers routinely work in the regime of wavelengths which areorders of magnitude smaller than the geometrical dimensions of the zone of interest.Consequently, the intent of the work described in this paper is to examine if the use of raytracing as an underlying mathematical model can conceptually lead to numerical methodscapable of predicting narrow-band behavior at very high frequencies which are robust,
791
0022–460X/95/350791+18 $12.00/0 7 1995 Academic Press Limited
. .792
accurate and efficient. Only simple geometries with a few classical boundary conditions areconsidered.
2. PROBLEM FORMULATION
2.1.
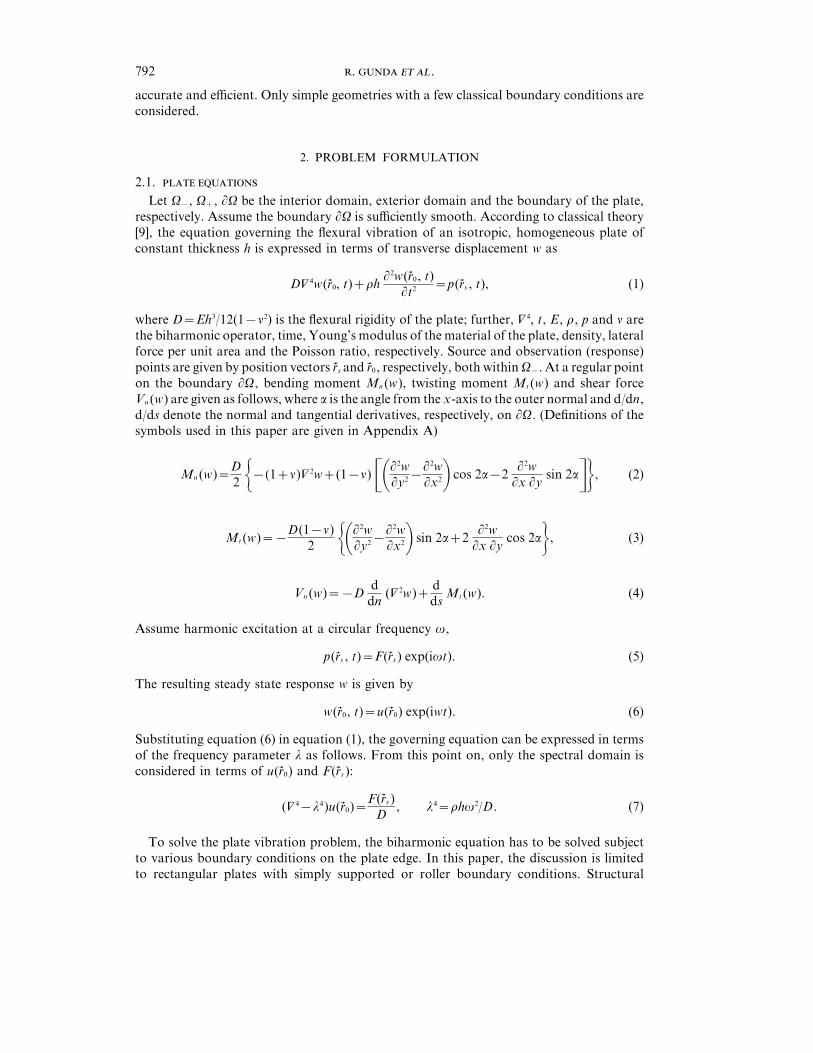
Let V−, V+, 1V be the interior domain, exterior domain and the boundary of the plate,respectively. Assume the boundary 1V is sufficiently smooth. According to classical theory[9], the equation governing the flexural vibration of an isotropic, homogeneous plate ofconstant thickness h is expressed in terms of transverse displacement w as
D94w(r� 0, t)+rh12w(r� 0, t)
1t2 =p(r� s , t), (1)
where D=Eh3/12(1−n2) is the flexural rigidity of the plate; further, 94, t, E, r, p and n arethe biharmonic operator, time, Young’s modulus of the material of the plate, density, lateralforce per unit area and the Poisson ratio, respectively. Source and observation (response)points are given by position vectors r� s and r� 0, respectively, both within V−. At a regular pointon the boundary 1V, bending moment Mn (w), twisting moment Mt (w) and shear forceVn (w) are given as follows, where a is the angle from the x-axis to the outer normal and d/dn,d/ds denote the normal and tangential derivatives, respectively, on 1V. (Definitions of thesymbols used in this paper are given in Appendix A)
Mn (w)=D2 6−(1+n)92w+(1−n) $012w
1y2−12w1x21 cos 2a−2
12w1x 1y
sin 2a%7, (2)
Mt (w)=−D(1−n)
2 6012w1y2−
12w1x21 sin 2a+2
12w1x 1y
cos 2a7, (3)
Vn (w)=−Dddn
(92w)+dds
Mt (w). (4)
Assume harmonic excitation at a circular frequency v,
p(r� s , t)=F(r� s ) exp(ivt). (5)
The resulting steady state response w is given by
w(r� 0, t)=u(r� 0) exp(iwt). (6)
Substituting equation (6) in equation (1), the governing equation can be expressed in termsof the frequency parameter l as follows. From this point on, only the spectral domain isconsidered in terms of u(r� 0) and F(r� s ):
(94−l4)u(r� 0)=F(r� s )D
, l4=rhv2/D. (7)
To solve the plate vibration problem, the biharmonic equation has to be solved subjectto various boundary conditions on the plate edge. In this paper, the discussion is limitedto rectangular plates with simply supported or roller boundary conditions. Structural

793
damping behavior will be considered by replacing D with D� =D(1+ih), where h is theloss factor.
2.2.
The following fundamental solution U(r� 0, r� s , l) to equation (7) represents the transversedeflection of an infinite plate at a point r� 0 due to a unit concentrated load at a point r� s offrequency v [10]:
U(r� 0, r� s , l)=−i
8l2D[H1
0 (lr)−H10 (ilr)], (8)
where r==r� 0−r� s = is the distance between the source point and the observation point and H10
is the zero order Hankel function of the first kind. It has been used by Niwa et al.[11] to develop a boundary element formulation for bending vibrations of plates. Thisfundamental solution satisfies the Sommerfeld radiation condition, which implies that onlythe waves travelling away from the source are considered [12].
2.3. -
The fundamental solution given by equation (8) is based on the assumption that the plateis infinite. To apply this to a finite plate, the boundary conditions on the plate edge haveto be satisfied. The method of images is essentially a scheme for satisfying the boundaryconditions for a finite plate.
Let us obtain the solution for a semi-infinite plate subjected to a point force F atpoint rs (xs , ys ), as shown in Figure 1. Along the edge of the plate, boundary conditions aresatisfied by placing a fictitious point force F' at a distance ys from the edge which is equalto the distance of F from the edge of the plate. Depending on the magnitude of F', certainboundary conditions can be satisfied along the edge of the plate. Let ra (x, 0) be any pointon the edge of the semi-infinite plate in accordance with Figure 1. The co-ordinates of thesource and image points are rs (xs , ys ) and ri (xi , yi ). Since these points are mirror images ofeach other about the edge line (y=0), xs=xi and yi=−ys . The distances of the source andimage locations from ra are rsa and ria , respectively:
rsa=ria=r=z(x−xs )2+(ys )2=z(x−xi )2+(yi )2. (9)
Figure 1. Imaging for semi-infinite plate.
. .794
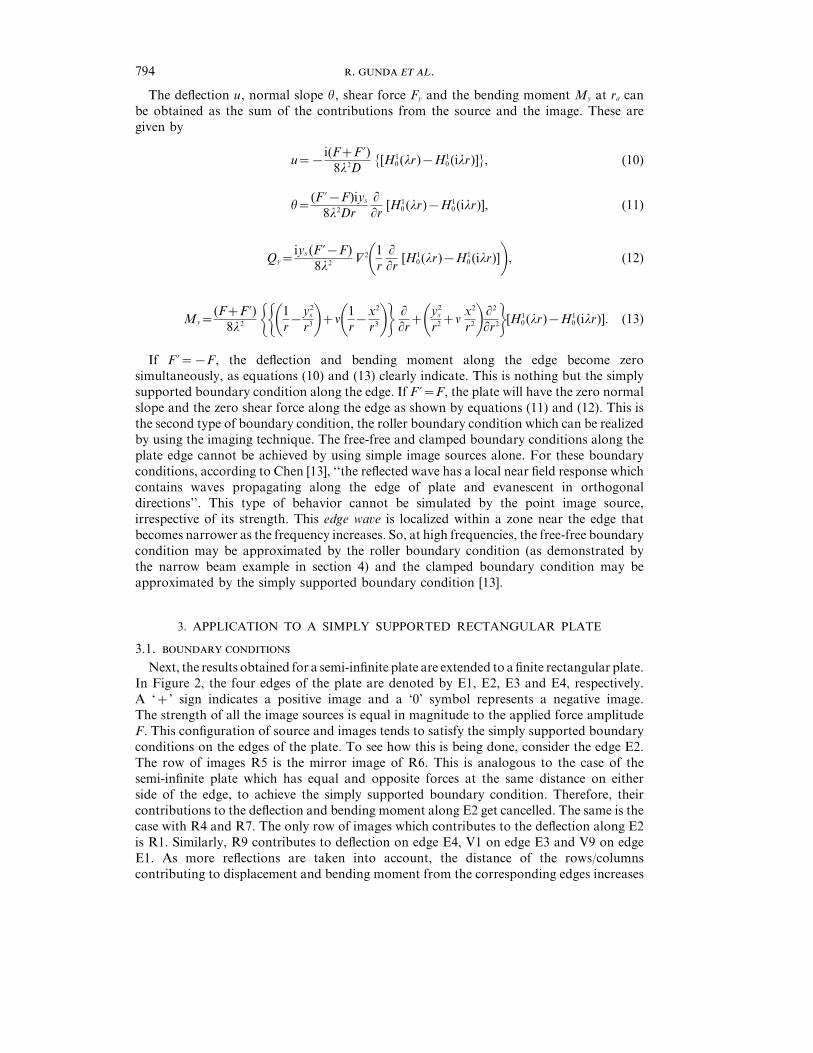
The deflection u, normal slope u, shear force Fy and the bending moment My at ra canbe obtained as the sum of the contributions from the source and the image. These aregiven by
u=−i(F+F')
8l2D{[H1
0 (lr)−H10 (ilr)]}, (10)
u=(F'−F)iys
8l2Dr1
1r[H1
0 (lr)−H10 (ilr)], (11)
Qy=iys (F'−F)
8l2 9201r 1
1r[H1
0 (lr)−H10 (ilr)]1, (12)
My=(F+F')
8l2 6601r−y2s
r31+n01r−x2
r317 1
1r+0y2
s
r2+nx2
r21 12
1r27[H10 (lr)−H1
0 (ilr)]. (13)
If F'=−F, the deflection and bending moment along the edge become zerosimultaneously, as equations (10) and (13) clearly indicate. This is nothing but the simplysupported boundary condition along the edge. If F'=F, the plate will have the zero normalslope and the zero shear force along the edge as shown by equations (11) and (12). This isthe second type of boundary condition, the roller boundary condition which can be realizedby using the imaging technique. The free-free and clamped boundary conditions along theplate edge cannot be achieved by using simple image sources alone. For these boundaryconditions, according to Chen [13], ‘‘the reflected wave has a local near field response whichcontains waves propagating along the edge of plate and evanescent in orthogonaldirections’’. This type of behavior cannot be simulated by the point image source,irrespective of its strength. This edge wave is localized within a zone near the edge thatbecomes narrower as the frequency increases. So, at high frequencies, the free-free boundarycondition may be approximated by the roller boundary condition (as demonstrated bythe narrow beam example in section 4) and the clamped boundary condition may beapproximated by the simply supported boundary condition [13].
3. APPLICATION TO A SIMPLY SUPPORTED RECTANGULAR PLATE
3.1.
Next, the results obtained for a semi-infinite plate are extended to a finite rectangular plate.In Figure 2, the four edges of the plate are denoted by E1, E2, E3 and E4, respectively.A ‘+’ sign indicates a positive image and a ‘0’ symbol represents a negative image.The strength of all the image sources is equal in magnitude to the applied force amplitudeF. This configuration of source and images tends to satisfy the simply supported boundaryconditions on the edges of the plate. To see how this is being done, consider the edge E2.The row of images R5 is the mirror image of R6. This is analogous to the case of thesemi-infinite plate which has equal and opposite forces at the same distance on eitherside of the edge, to achieve the simply supported boundary condition. Therefore, theircontributions to the deflection and bending moment along E2 get cancelled. The same is thecase with R4 and R7. The only row of images which contributes to the deflection along E2is R1. Similarly, R9 contributes to deflection on edge E4, V1 on edge E3 and V9 on edgeE1. As more reflections are taken into account, the distance of the rows/columnscontributing to displacement and bending moment from the corresponding edges increases

795
Figure 2. Infinite plate with positive (+) and negative (0) sources equivalent to simply supported plate with edgesE1, E2, E3 and E4 excited at (xs , ys ).
and the contribution decreases. In the limit, the boundary conditions on all the edges of theplate will be simply supported.
3.2.
For a concentrated harmonic load of amplitude F at the point r� s (xs , ys ), the steady statedeflection at r� 0(x, y) is known exactly from the conventional modal analysis technique as
u(x, y)= sa
m=1
sa
n=1
Bmn sin (mpx/a) sin (npy/b), (14)
where
Bmn=
4F sin 0mpxs
a 1 sin 0npys
b 1{ab[D�((mp/a)2+(np/b)2)2−rhv2]}
, D�=D(1+ih). (15)
Consider a rectangular steel plate example with simple supports on all four edges. Thedimensions of the example plate considered are length a=0·5842 m along x, widthb=0·7366 m along y and a thickness h of 0·762 mm. The loss factor for structural dampingh is taken to be 0·03.
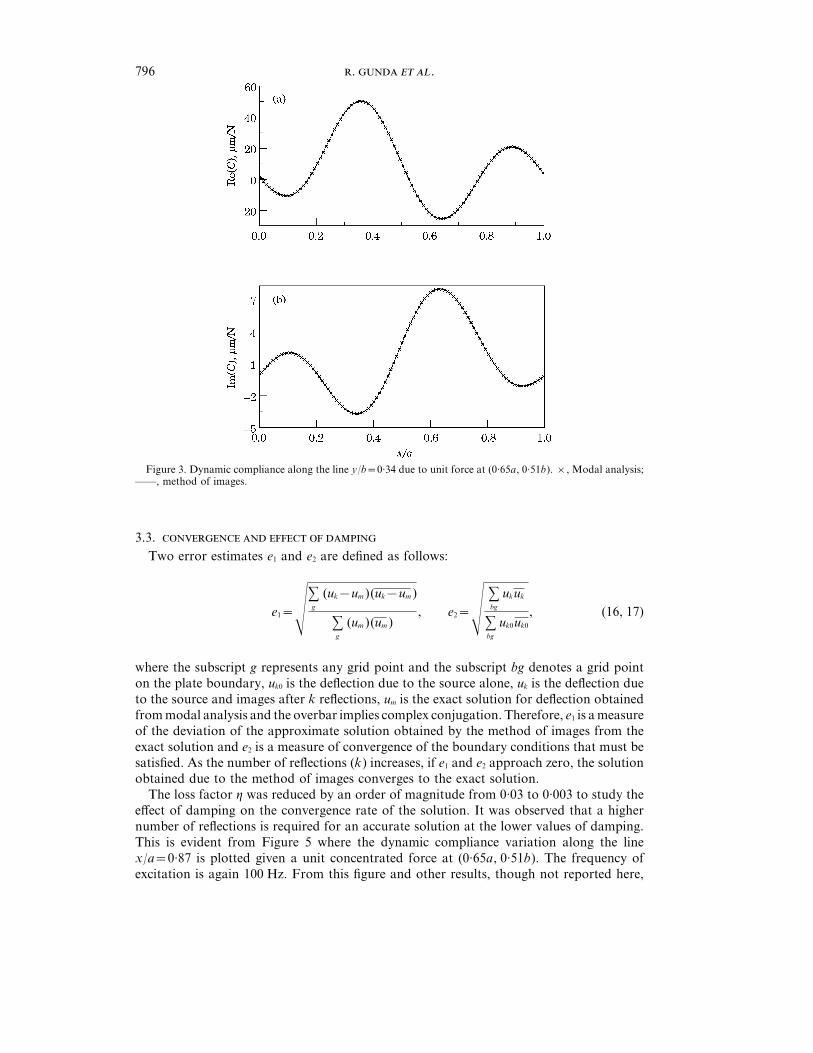
In Figure 3, the real (Re) and imaginary (Im) parts of the dynamic complianceC(v)=(u/F)(v) are plotted as a function of x/a along y/b=0·34, when the load is appliedat r� s (0·65a, 0·51b); the origin (0, 0) is at the bottom left corner of the plate. The frequencyof excitation is f=v/2p=100 Hz. The number of reflections (k) considered for the methodof images is 40. There is an excellent agreement between the solutions obtained from bothmethods.
The cross-point dynamic compliance spectrum given r� s at (0·65a, 0·51b) at r� 0 at(0·91a, 0·96b) is plotted in Figure 4. The results from modal analysis and method of imageswith (k=40) are identical.
. .796
Figure 3. Dynamic compliance along the line y/b=0·34 due to unit force at (0·65a, 0·51b). ×, Modal analysis;——, method of images.
3.3.
Two error estimates e1 and e2 are defined as follows:
e1=csg
(uk−um )(uk−um )
sg
(um )(um ), e2=c s
bg
ukuk
sbg
uk0uk0
, (16, 17)
where the subscript g represents any grid point and the subscript bg denotes a grid pointon the plate boundary, uk0 is the deflection due to the source alone, uk is the deflection dueto the source and images after k reflections, um is the exact solution for deflection obtainedfrom modal analysis and the overbar implies complex conjugation. Therefore, e1 is a measureof the deviation of the approximate solution obtained by the method of images from theexact solution and e2 is a measure of convergence of the boundary conditions that must besatisfied. As the number of reflections (k) increases, if e1 and e2 approach zero, the solutionobtained due to the method of images converges to the exact solution.
The loss factor h was reduced by an order of magnitude from 0·03 to 0·003 to study theeffect of damping on the convergence rate of the solution. It was observed that a highernumber of reflections is required for an accurate solution at the lower values of damping.This is evident from Figure 5 where the dynamic compliance variation along the linex/a=0·87 is plotted given a unit concentrated force at (0·65a, 0·51b). The frequency ofexcitation is again 100 Hz. From this figure and other results, though not reported here,

797
Figure 4. Dynamic compliance spectra between (0·91a, 0·96b) and (0·65a, 0·51b). ×, Modal analysis; ——,method of images.
it is clear that one must choose the k judiciously by considering various factors such as h
and the frequency range of interest.
3.4.
The expression for the response at r� 0 due to a point load excitation at r� s obtained frommodal superposition is given by equations (14) and (15). If we interchange the co-ordinatesof the observation and the excitation locations, i.e. (x, y) and (xs , ys ), we still obtain the sameexpression for the displacement. Hence, as expected, the reciprocity relationship holds.Similarly, the method of images also obeys reciprocity. But it is not transparent fromthe way the solution is obtained. If the source and the observation points are interchanged,the set of image locations obtained is completely different. It is interesting to find two entirelydifferent series of Hankel functions add up to the same dynamic response. For theplate example chosen with v=100 Hz, h=0·03 and k=50, the results obtained byinterchanging the source and the observation points are identical to nine decimal places asevident from Table 1.
3.5.
For the same example, consider the load F(r� s ) to be distributed over the surface of theplate. Assume it to be given by F(x, ys )=Fx/a. For the method of images, the distributedforce is replaced by an equivalent set of concentrated loads. The solution obtained iscompared with the exact solution obtained from modal superposition which is still given byequation (14). But now
Bmn=4F(−1)m+1 sin(npys /b)
{bmp[D�((mp/a)2+(np/b)2)2−rhv2]}. (18)

. .798
Figure 5. Dynamic compliance along x/a=0·87 due to unit force at (0·65a, 0·51b). Loss factor h is 0·003. ×,modal analysis; . . . , method of images with 100 reflections; – · – · –, method of images with 200 reflections;——, method of images with 400 reflections.
For the imaging technique, if the number of point loads is q, the strength of each sourceis given as
F( j)=F0( j−1)aq(q−1)
, j=1 · · · q. (19)
The sum of all the point harmonic loads is
sq
j=1
F( j)=F0a/2, (20)
which is equal to the total force exerted by the distributed ramp load F(r� s ).Figure 6 presents plots of the forced harmonic response at 100 Hz due to a ramped load
of F=100 N/m, given ys=0·69b. The response is measured along the line x/a=0·87. Thenumber of reflections considered for the method of images is 40. For the method of images,this distributed load is replaced by 100 point loads. Again, the results from the methodof images and modal analysis match very well.
799
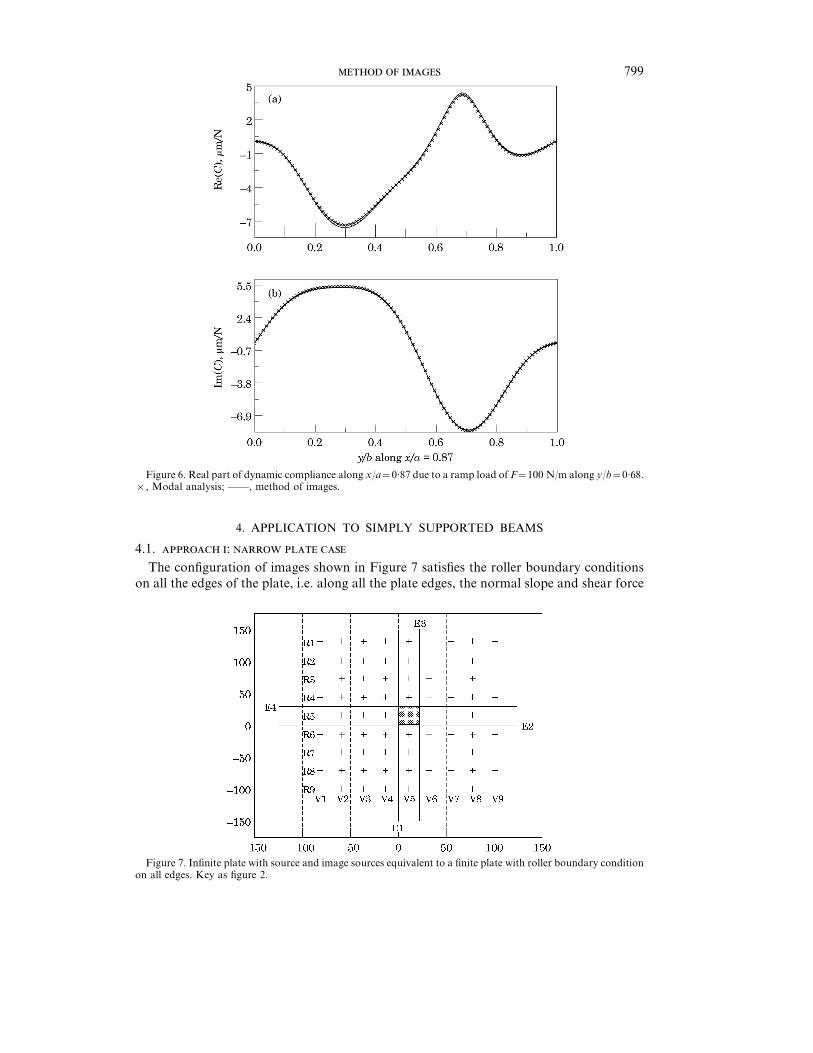
Figure 6. Real part of dynamic compliance along x/a=0·87 due to a ramp load of F=100 N/m along y/b=0·68.×, Modal analysis; ——, method of images.
4. APPLICATION TO SIMPLY SUPPORTED BEAMS
4.1. :
The configuration of images shown in Figure 7 satisfies the roller boundary conditionson all the edges of the plate, i.e. along all the plate edges, the normal slope and shear force
Figure 7. Infinite plate with source and image sources equivalent to a finite plate with roller boundary conditionon all edges. Key as figure 2.

. .800
Figure 8. Edges E1 and E3 are simply supported and roller boundary conditions are satisfied along edges E2and E4. Key as figure 2.
vanish. By choosing proper directions for the image sources, different boundary conditionscan be obtained along each edge. Figure 8 shows an example where edges E1 and E3 aresimply supported and edges E2 and E4 have roller boundary condition. This example is usedto model a simply supported slender beam when b/aW1. As in the case of a plate, we assume
Figure 9. Dynamic compliance due to a unit concentrated load at x/a=0·6. Beam A modelled as a narrow plate.×, Modal analysis; . . . , method of images with 100 reflections; ——, method of images with 400 reflections.

801
Figure 10.Acclerance spectra between 0·875a and 0·697a for beamB. – – –,method of images;×,modal analysis;r, experiment.
the beam to be lightly damped. The Poisson ratio n is taken to be zero since the governingequation for transverse vibrations of a beam assumes no variation in deflection along they-direction.
A steel beam of a=0·381 m, b=0·0381 m and h=4·762 mm, designated here as beam A,is considered. The loss factor h is 0·03. The dynamic compliance along the length of the beamdue to a unit concentrated load at x/a=0·6 is plotted in Figure 9. The frequency of excitationis 1000 Hz. From the figure, it is observed that the solution from the method of images fora plate with mixed boundary conditions converges to the exact beam solution as k increases.

. .802
4.2. :
The governing equation for the transverse vibration of a beam is given in terms ofdisplacement as
12
1x2 0EI12w1x21+rS
12w1t2 =p(x, t). (21)
If structural damping is taken into account, E in equation (21) can be replaced by E(1+ih).For the classical viscous damping case, the governing differential equation becomes
12
1x2 0EI12w1x21+c
1w1t
+rS12w1t2 =p(x, t). (22)
The following derivation of the beam fundamental solution is from Graff [14], but it has beenmodified to account for structural or viscous damping. Consider an infinite beam subjectedto a harmonically varying, unit concentrated load placed at x=xs . As in the case of aplate, the frequency parameter is given by l4=rSv2/EI(1+ih) for structural dampingand l4=(rSv2−icv)/EI for viscous damping. The four values of l are
l=g−ib, b+ig, −g+ib, −b−ig. (23)
The fundamental solution for the infinite beam is given as
U(x)=i
E(1+ih)I 6 14(g−ib)3 exp(−i(g−ib)(x−xs ))
+1
4(−b−ig)3 exp(−i(−b−ig)(x−xs ))7, xqxs , (24)
U(x)=i
E(1+ih)I 6 14(b+ig)3 exp(−i(b+ig)(x−xs ))
+1
4(−g+ib)3 exp(−i(−g+ib)(x−xs ))7; xQxs . (25)
As in the case of a plate, a simply supported condition is obtained when the strength of theimage force is equal and opposite to that of the applied force F. For a concentrated harmonicload F at the point r� s (xs ), the exact solution for deflection at the point r� 0(x) is given frommodal superposition as
u(x)= sa
m=1
Bm sin (mpx/a), (26)
where
Bm=2F sin(mpxs /a)
a[E(1+ih)I(mp/a)4−rSv2]. (27)
803
T 1
Reciprocity check for the plate example at 100 Hz
r� 0 r� s Re(C)mm/N Im(C)mm/N
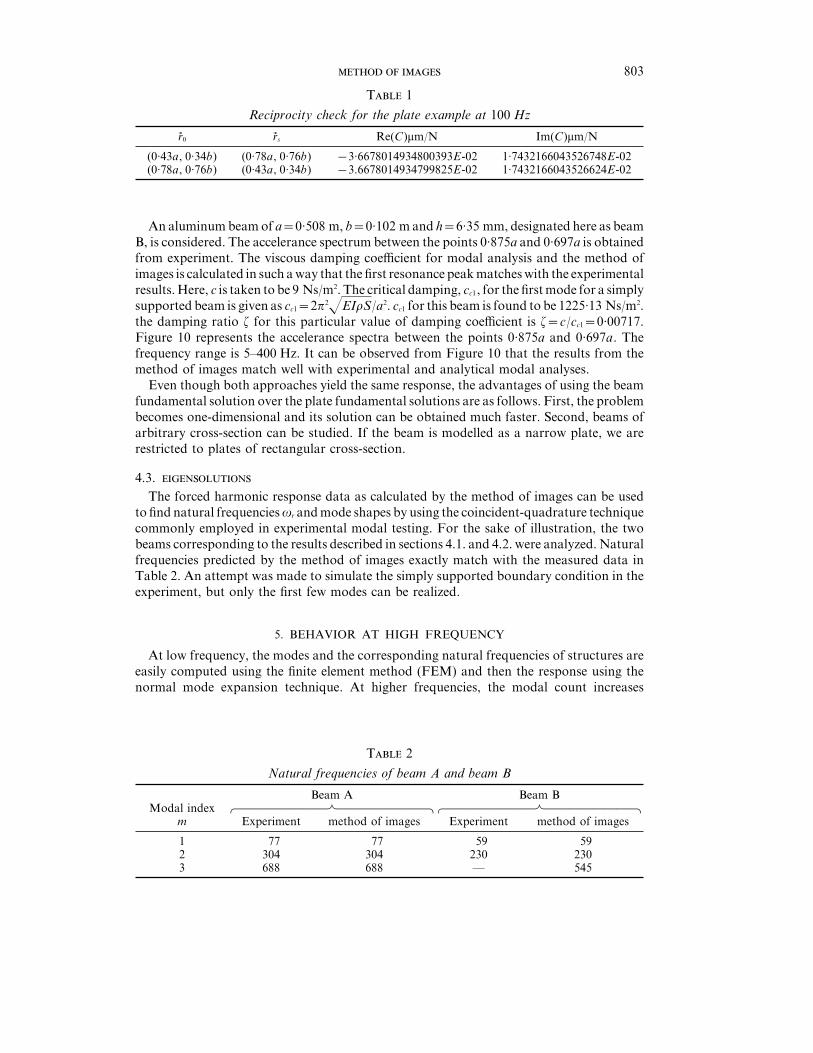
(0·43a, 0·34b) (0·78a, 0·76b) −3·6678014934800393E-02 1·7432166043526748E-02(0·78a, 0·76b) (0·43a, 0·34b) −3.6678014934799825E-02 1·7432166043526624E-02
An aluminum beam of a=0·508 m, b=0·102 m and h=6·35 mm, designated here as beamB, is considered. The accelerance spectrum between the points 0·875a and 0·697a is obtainedfrom experiment. The viscous damping coefficient for modal analysis and the method ofimages is calculated in such away that the first resonance peakmatcheswith the experimentalresults.Here, c is taken to be 9 Ns/m2. The critical damping, cc1, for the firstmode for a simplysupported beam is given as cc1=2p2zEIrS/a2. cc1 for this beam is found to be 1225·13 Ns/m2.the damping ratio z for this particular value of damping coefficient is z=c/cc1=0·00717.Figure 10 represents the accelerance spectra between the points 0·875a and 0·697a. Thefrequency range is 5–400 Hz. It can be observed from Figure 10 that the results from themethod of images match well with experimental and analytical modal analyses.
Even though both approaches yield the same response, the advantages of using the beamfundamental solution over the plate fundamental solutions are as follows. First, the problembecomes one-dimensional and its solution can be obtained much faster. Second, beams ofarbitrary cross-section can be studied. If the beam is modelled as a narrow plate, we arerestricted to plates of rectangular cross-section.
4.3.
The forced harmonic response data as calculated by the method of images can be usedto find natural frequencies vr and mode shapes by using the coincident-quadrature techniquecommonly employed in experimental modal testing. For the sake of illustration, the twobeams corresponding to the results described in sections 4.1. and 4.2. were analyzed. Naturalfrequencies predicted by the method of images exactly match with the measured data inTable 2. An attempt was made to simulate the simply supported boundary condition in theexperiment, but only the first few modes can be realized.
5. BEHAVIOR AT HIGH FREQUENCY
At low frequency, the modes and the corresponding natural frequencies of structures areeasily computed using the finite element method (FEM) and then the response using thenormal mode expansion technique. At higher frequencies, the modal count increases
T 2
Natural frequencies of beam A and beam B
Beam A Beam BModal index ZXXXXXXXCXXXXXXXV ZXXXXXXXCXXXXXXXV
m Experiment method of images Experiment method of images
1 77 77 59 592 304 304 230 2303 688 688 — 545

. .804
Figure 11. Accelerance spectra between (0·74a, 0·66b) and (0·30a, 0·38b).×, Modal analysis; ——, methodof images with five reflections.
significantly. Furthermore, to obtain accurate results, the finite element dimensions shouldbe smaller than the wavelength of elastic waves at these frequencies. Thus, a very large finiteelement model is required which is not always practical or justifiable in terms of thecomputational expense involved and accuracy obtained. In contrast, the statistical energyanalysis (SEA) method is more suitable at very high frequencies, but only spatially averagedband limited information is obtained. This approach also involves several simplifyingassumptions and modelling criteria which are still being debated [15–17]. Asymptotic modalanalysis has also been proposed as a viable analysis approach [17].
Using the method of images, we have observed that fewer reflections are needed toobtain the same accuracy at higher frequencies. In other words, for the same number ofreflections, the accuracy increases with frequency. This behavior is a departure from that

805
Figure 12. Accelerance spectra between (0·74a, 0·66b) and (0·30a, 0·38b). ×, Modal analysis; ——, methodof images with five reflections; r, FEM.
of the conventional methods such as the FEM whose accuracy reduces at higher frequencies.For the sake of illustration, again consider the rectangular plate example with simplysupported boundary conditions, under a point harmonic load F at r� s (0·03a, 0·38b). Theresponse point is fixed at r� o (0·74a, 0·66b) for all the calculations. For our method of images,the solution is calculated using only k=5 reflections, i.e. the deflection at any point isobtained by simply adding the contributions due to (2×5+1)2=121 sources. A finiteelement model is constructed using 400 elastic shell elements [18]. Both predictions arecompared with the exact modal analysis solutions over almost four decades of frequencyfrom 1–10000 Hz. Over this range of frequencies, the natural frequencies are distributedas follows: 13 modes in the frequency range 0–100 Hz, 151 modes over 100–1000 Hz and1595 modes over 1000–10 000 Hz. Two arbitrary frequency ranges, first at the low end from5 to 2000 Hz and the second at the high end from 9000 to 9100 Hz are selected to comparethe results. Given the wide range of frequencies, it is appropriate to choose the acceleranceA(w)=−uv2/F as the sinusoidal transfer function in place of C(w), where −uv2 is thetransverse acceleration of the plate.
Figure 11 shows the typical frequency response curves from 5 to 2000 Hz. InFigure 11, only the method of images is compared to the exact solution. Both are almostindistinguishable. Figure 12 shows the typical comparison at very high frequencies where400 spectral points are distributed over 9000 to 9100 Hz. The method of images is again inexcellent agreement with the exact solution but FEM fails to predict the response. Further,no clear cut resonances are seen. This is because high modal damping values are observedgiven a frequency-invariant loss factor of 0·03. It suggests that the asymptotic modal analysisor SEA type methods [15–17] might be suitable to predict this type of response. However,
Figure 13. Convergence estimate e1 versus frequency. —W—, Method of images with five reflections; – –r– –,FEM with 400 elements.
. .806
no a priori assumptions or procedures are needed in our method to find the band limitedresponses.
To better understand these results, the convergence estimate e1 as given by equation (16)is plotted in Figure 13 for both methods with the exact modal solution as the benchmark.Even though either method could be made to yield improved behavior, if more reflectionsare chosen for the method of images or by decreasing the element size in FEM, certain trendsare obvious. First, the FEM predictions are based on the eigensolutions which are proneto errors at the higher frequencies. Second, the method of images seems to improve itsprediction capability as the frequency is increased. It is believed to be related to the imageplacement distance which depends on dimensions of the plate in relation to the elasticwavelength which becomes much smaller at higher frequencies. Finally, both methods showopposite trends over the spectral scale.
6. CONCLUSIONS
A new method of images has been developed for the harmonic analysis of plate and beamvibrations. Even though only a limited number of illustrative examples have been consideredto verify the proposed procedure, certain observations can be made. Unlike the finite elementmethod and other modal band methods, the solution accuracy of the method of imagesincreases with an increase in the frequency and damping. Also, one can choose to analyzethe response at just one location, unlike FEM where the solution has to be obtained at allthe nodes. This procedure is in contrast to the modal methods where all the modes mustbe known a priori before the harmonic response can be calculated. The method of imagesseems very promising as a potential analysis tool because of its computational efficiency andaccuracy in the medium and high frequency regimes. Work is proceeding along thesedirections and complicated plate shapes are being examined. However, more research isneeded before it can be applied to practical structures and machines.
ACKNOWLEDGMENTS
This work has been supported by the U.S. Army research Office (URI GrantDAAL-03-92-G-0120; Project Monitor: Dr. T. L. Doligalski).
REFERENCES
1. A. D. P 1989 Acoustics–An Introduction to its Physical Principles and Applications. NewYork: Acoustical Society of America.
2. G. L. J 1980 Geometric Theory of Diffraction for Electromagnetic Waves. London: Institutionof Electrical Engineers.
3. S. H. C and L. E. W 1972 Dynamic Response of Structures Symposium Proceedings55–71. Oxford: Pergamon.
4. S. H. C 1977 Stochastic Problems in Dynamics (B. L. Clarkson editor) 366–389. London:Pitman.
5. S. H. C 1979 Developments in Statistics Volume 2, 1–82. New York: Academic Press.Random vibration of one and two-dimensional structures.
6. S. S. L 1976 Ph.D. Dissertation, Massachusetts Institute of Technology. Lanes of intensifiedresponse in structures excited by wide-band random excitation.
7. A. J. L and P. H. T 1979 International Journal of Engineering Science 17, 1039–1047.Chladni patterns in random vibration.
8. L. C and M. H 1988 Structure-Borne Sound (Translated and revised by E. E. Unger).Berlin: Springer-Verlag.
9. A. W. L 1993 Vibration of Plates. New York: Acoustical Society of America.

807
10. D. E. B 1991 Boundary Element Analysis of Plates and Shells. Berlin: Springer-Verlag.11. Y. N, S. K and M. K 1981 Theoretical and Applied Mechanics 29, 287–367.
Eigen frequency analysis of a plate by the integral equation method.12. A. S 1964 Partial Differential Equations in Physics. New York: Academic Press.13. G. C, M. P. C and J. Z 1991 SIAM Journal on Applied Mathematics 51, 967–983.
Analysis of vibration eigen frequencies of a thin plate by the Keller-Rubinow wave method:clamped boundary conditions with rectangular or circular geometry.
14. K. F. G 1991 Wave Motion in Elastic Solids. New York: Dover.15. J. W 1981 Journal of the Acoustical Society of America 69, 1695–1709. An approach to
the theoretical background of statistical energy analysis applied to structural vibration.16. C. H. H and J. W 1986 Reports on Progress in Physics 49, 107–170. Theories of
noise and vibration in complex structures.17. E. H. D and Y. K 1985 Journal of Applied Mechanics 52, 949–957. Asymptotic modal
analysis and statistical energy analysis of dynamical systems.18. ANSYS 1992 User’s Manual. Houston (PA): Swanson Analysis Systems, Inc.
APPENDIX A: LIST OF SYMBOLS
a lengthA dynamic acceleranceBmn contribution to the displacement from m, n modeb widthc coefficient of viscous dampingC dynamic compliancecc1 critical damping coefficient for the first modeD flexural rigidity of the plateD� complex flexural rigiditye1, e2 convergence estimatesE Young’s modulusf frequency (Hz)F strength of the sourceF' strength of the imageh thicknessH1
0 zero order Hankel function of the first kindi imaginary unitI area moment of inertiaIm imaginary part of a complex quantityk number of reflectionsm, n modal indicesMn bending momentMt twisting momentMy bending moment along the edgep applied external forceQy transverse shear force along the edgeq number of point loads replacing the distributed forcera a point on the edge of the semi-infinite plater� o (x, y) position vector of the response pointr� s (xs , ys ) position vector of the excitation pointrsa distance between the source and observation pointsria distance between the image and observation pointsRe real part of a complex quantityS cross-sectional areat timeu displacement amplitudeuk deflection amplitude from method of Imagesuk0 deflection amplitude due to a single source aloneum deflection amplitude from modal summation methodU fundamental solution for an infinite plate or beamVn shear force

. .808
w transverse displacementx, y co-ordinates axesa angle between the x-axis and the outer normald Dirac delta function1V boundary of the domainh loss factor for structural dampingl frequency parameter92 Laplacian operator94 biharmonic operatorn Poisson ratiov angular frequencyV− interior of the domainV+ exterior of the domainr densityu normal slope
Superscripts− complex conjugate: vector
Subscriptsbg boundary grid point on convergence gridg grid point on the convergence grid