method 1313 liquid-solid partitioning as a function … · liquid-solid partitioning as a function...
TRANSCRIPT

1313 - 1 Revision 1 July 2017
METHOD 13131
LIQUID-SOLID PARTITIONING AS A FUNCTION OF EXTRACT pH USING A PARALLEL BATCH EXTRACTION PROCEDURE
SW-846 is not intended to be an analytical training manual. Therefore, method procedures are written based on the assumption that they will be performed by analysts who are formally trained in at least the basic principles of chemical analysis and in the use of the subject technology.
In addition, SW-846 methods, with the exception of required method use for the analysis of method-defined parameters, are intended to be guidance methods which contain general information on how to perform an analytical procedure or technique which a laboratory can use as a basic starting point for generating its own detailed standard operating procedure (SOP), either for its own general use or for a specific project application. Performance data included in this method are for guidance purposes only, and must not be used as absolute quality control (QC) acceptance criteria for purposes of laboratory QC or accreditation.
TABLE OF CONTENTS
1.0 SCOPE AND APPLICATION ............................................................................................ 2
2.0 SUMMARY OF METHOD ................................................................................................. 4
3.0 DEFINITIONS ................................................................................................................... 4
4.0 INTERFERENCES ........................................................................................................... 5
5.0 SAFETY ........................................................................................................................... 5
6.0 EQUIPMENT AND SUPPLIES ......................................................................................... 6
7.0 REAGENTS AND STANDARDS....................................................................................... 7
8.0 SAMPLE COLLECTION, PRESERVATION, AND STORAGE .......................................... 8
9.0 QUALITY CONTROL ........................................................................................................ 8
10.0 CALIBRATION AND STANDARDIZATION ....................................................................... 9
11.0 PROCEDURE................................................................................................................... 9
12.0 DATA ANALYSIS AND CALCULATIONS ....................................................................... 16
13.0 METHOD PERFORMANCE ........................................................................................... 18
14.0 POLLUTION PREVENTION ........................................................................................... 18
15.0 WASTE MANAGEMENT ................................................................................................ 18
16.0 REFERENCES ............................................................................................................... 19
17.0 TABLES, DIAGRAMS, FLOWCHARTS, AND VALIDATION DATA ................................ 19
1 This method has been derived from the SR002 procedure (Ref. 4) using EPA-reviewed and accepted
methodologies (see Ref. 3, Ref. 7 and Ref. 8). The method is analogous to pH dependence methods CEN/TS 14429 (Ref. 5) and CEN/TS 14997 (Ref. 6) developed for the Comité Européen de Normalisation (CEN).
1313 - 2 Revision 1 July 2017
1.0 SCOPE AND APPLICATION
1.1 This method is designed to provide aqueous extracts representing the liquid-solid partitioning (LSP) curve as a function of pH for inorganic constituents (e.g., metals and radionuclides), semi-volatile organic constituents (e.g., polycyclic aromatic hydrocarbons (PAHs)) and non-volatile organic constituents (e.g., dissolved organic carbon) in solid materials. The LSP curve is evaluated as a function of final extract pH at a liquid-to-solid ratio (L/S) of 10 mL extractant/g dry sample (g-dry) and conditions that approach liquid-solid chemical equilibrium. This method also yields the acid/base titration and buffering capacity of the tested material at an L/S of 10 mL extractant/g-dry sample. The analysis of extracts for dissolved organic carbon and the solid phase for total organic carbon allow for the evaluation of the impact of organic carbon release and the influence of dissolved organic carbon on the LSP of inorganic constituents.
1.2 This method is intended to be used as part of an environmental leaching assessment for the evaluation of disposal, beneficial use, treatment effectiveness, and site remediation options. The method is not required by federal regulations to determine whether waste passes or fails the toxicity characteristic as defined at 40 CFR 261.24.
1.3 This method is suitable for assessing the leaching potential of a wide range of solid materials. Examples of solid materials include: industrial wastes, soils, sludges, combustion residues, sediments, stabilized materials, construction materials, and mining wastes.
1.4 This method is a leaching characterization method that is used to provide values for intrinsic material parameters that control leaching of inorganic and some organic species under equilibrium conditions. This test method is intended as a means for obtaining a series of extracts of a solid material (i.e., the eluates), which may be used to estimate the LSP (e.g., solubility and release) of constituents as a function of pH under the laboratory conditions described in the method. Eluate constituent concentrations may be used in conjunction with information regarding environmental management scenarios to estimate the anticipated leaching concentrations, and release rate and extent for individual material constituents under the management conditions evaluated. Eluate constituent concentrations generated by this method may also be used along with geochemical speciation modeling to infer the mineral phases that control the LSP in the pore structure of the solid material.
1.5 This method is not applicable for characterizing the release of volatile organic analytes (e.g., benzene, toluene and xylenes).
1.6 The relationships between eluate concentrations observed from this method and field leachate must be considered in the context of the material being tested and the field scenario being evaluated. This method provides solutions with concentrations considered indicative of leachates under field conditions at comparable ranges of pH for the case when the LSP is controlled by aqueous phase saturation of the constituent of interest. When LSP is controlled by the amount of the constituent present in the solid that may dissolve (i.e., for highly soluble species), the mass released (mg/kg), rather than the concentration, is indicative of field conditions.2
2 The concentrations of soluble species (e.g., Na, K, Cl, B) may not be controlled by aqueous phase saturation,
but by the liquid-to-solid ratio. In such cases, the mass released is consistent with field conditions and the field

1313 - 3 Revision 1 July 2017
1.7 The maximum mass of constituent released over the range of method pH conditions (2 ≤ pH ≤ 13) may be considered an estimate of the maximum possible mass of the constituent that is leachable under field leaching conditions for intermediate time frames (because the method pH range will encompass and typically exceed the field pH range, using pH values both greater than and less than the field pH range).
1.8 The solvents used in this method include dilute solutions of nitric acid (HNO3) and potassium hydroxide (KOH) in reagent water.
1.9 Analysts are advised to take reasonable measures to ensure that the sample is homogenized to the extent practical, prior to employment of this method. Particle size reduction may provide additional assurance of sample homogenization and also facilitate achievement of equilibrium during the test procedure. Table 1 of this method designates a recommended minimum dry mass of sample to be added to each extraction vessel and the associated extraction contact time as a function of particle diameter. If the heterogeneity of the sample is suspected as the cause of unacceptable precision in replicate test results or is considered significant based on professional judgment, the sample mass used in the test procedure may be increased to a greater minimum dry mass than that shown in Table 1 with the amount of extractant increased proportionately to maintain the designated L/S.
1.10 In the preparation of solid materials for use in this method, particle size reduction of samples with a large grain size is performed in order to enhance the approach towards equilibrium under the designated contact time interval of the extraction process. The extract contact time for samples reduced to a finer maximum particle size will consequently be shorter (see Table 1).
1.11 Prior to employing this method, analysts are advised to consult the base method for each type of procedure that may be employed in the overall analysis (e.g., Methods 9040, 9045, and 9050, and the determinative methods for the target analytes) for additional information on QC procedures, development of QC acceptance criteria, calculations, and general guidance. Analysts also should consult the disclaimer statement at the front of the manual and the information in Chapter Two for: 1) guidance on the intended flexibility in the choice of methods, apparatus, materials, reagents, and supplies, and 2) the responsibilities of the analyst for demonstrating that the techniques employed are appropriate for the analytes of interest, in the matrix of interest, and at the levels of concern.
In addition, analysts and data users are advised that, except where explicitly specified in a regulation, the use of SW-846 methods is not mandatory in response to federal testing requirements. The information contained in this method is provided by the Environmental Protection Agency (EPA or the Agency) as guidance to be used by the analyst and the regulated community in making judgments necessary to generate results that meet the data quality objectives (DQOs) for the intended application. Guidance on defining DQOs can be obtained at https://www.epa.gov/quality/guidance-systematic-planning-using-data-quality-objectives-process-epa-qag-4.
leachate concentrations (mg/L) could be estimated by adjusting the mass release (mg/kg) for the field L/S (L/kg). Alternatively for these cases, leachate concentrations may be more consistent with L/S-dependent testing using Method 1314 or Method 1313.

1313 - 4 Revision 1 July 2017
1.12 This method is restricted to use by, or under supervision of, properly experienced and trained personnel. Each analyst must demonstrate the ability to generate acceptable results with this method.
2.0 SUMMARY OF METHOD
This method consists of nine parallel extractions of a particle-size-reduced solid material in dilute acid or base and reagent water. A flowchart for performing this method is shown in Figure 1. Particle size reduction of the material to be tested is performed according to Table 1. A schedule of acid and base additions is formulated from a pre-test titration curve or prior knowledge indicating the required equivalents/g acid or base to be added to the series of extraction vessels so as to yield a series of eluates having specified pH values in the range of 2 -13. In addition to the nine test extractions, three method blanks without solid samples are carried through the procedure in order to verify that analyte interferences are not introduced as a consequence of reagent impurities or equipment contamination. The 12 bottles (i.e., nine test positions and three method blanks) are tumbled in an end-over-end fashion for a specified contact time, which depends on the particle size of the sample (see Table 1). At the end of the specified contact interval, the liquid and solid phases are roughly separated via settling or centrifugation. Extract pH and specific conductivity measurements are then made on an aliquot of the liquid phase and the remaining bulk of the eluate is clarified by either pressure or vacuum filtration. Analytical samples of the filtered eluate are collected and preserved as appropriate for the desired chemical analyses. The eluate concentrations of constituents of potential concern (COPCs) are determined and reported. In addition, COPC concentrations may be plotted as a function of eluate pH and compared to QC and assessment limits for the interpretation of method results.
3.0 DEFINITIONS
3.1 Constituent of potential concern (COPC) – A chemical species of interest, which may or may not be regulated, but may be characteristic of release-controlling properties of the sample geochemistry.
3.2 Release – The dissolution or partitioning of a COPC from the solid phase to the aqueous phase during laboratory testing (or under field conditions). In this method, mass release is expressed in units of mg COPC/kg dry solid material.
3.3 Liquid-solid partitioning (LSP) – The distribution of COPCs between the solid and liquid phases at the conclusion of the extraction.
3.4 Liquid-to-solid ratio (L/S) – The fraction of the total liquid volume (including the moisture contained in the "as used" solid sample) to the dry mass equivalent of the solid material. L/S is typically expressed in volume units of liquid per dry mass of solid material (mL/g-dry).
3.5 "As-tested" sample – The solid sample at the conditions (e.g., moisture content and particle-size distribution) present at the time of the start of the test procedure. The "as-tested" conditions will differ from the "as-received" sample conditions if particle size reduction and drying were necessarily performed.

1313 - 5 Revision 1 July 2017
3.6 Dry-mass equivalent – The mass of "as-tested" (i.e., "wet") sample that equates to the mass of dry solids plus associated moisture, based on the moisture content of the "as-tested" material. The dry-mass equivalent is typically expressed in mass units of the "as-tested" sample (g).
3.7 Eluent – The solution used to contact the solid material in a leaching test. The eluent is usually free of COPCs but may contain other species used to control the test conditions of the extraction.
3.8 Eluate – The solution collected as an extract from a leaching test that contains the eluent plus constituents leached from the solid phase.3
3.9 Refer to Chapter One, Chapter Three, and the manufacturers' instructions for definitions that may be relevant to this procedure.
4.0 INTERFERENCES
4.1 Solvents, reagents, glassware, and other sample processing hardware may yield artifacts and/or interferences to sample analysis. All of these materials must be demonstrated to be free from interferences under the conditions of the analysis by analyzing method blanks. Specific selection of reagents may be necessary. Refer to each method to be used for specific guidance on QC procedures and to Chapters Three and Four for general guidance on glassware cleaning. Also refer to Methods 9040, 9045, and 9050 and the determinative methods to be used for information regarding potential interferences.
4.2 If potassium is a COPC, the use of KOH as a base reagent will interfere with the determination of actual potassium release. In this case, sodium hydroxide (NaOH) of the same grade and normality may be used as a substitute.
5.0 SAFETY
5.1 This method does not address all safety issues associated with its use. The laboratory is responsible for maintaining a safe work environment and a current awareness file of Occupational Safety and Health Administration (OSHA) regulations regarding the safe handling of the chemicals specified in this method. A reference file of safety data sheets (SDSs) should be available to all personnel involved in these analyses.
5.2 During preparation and processing of extracts and/or eluents/eluates, some waste materials may generate heat or evolve potentially harmful gases when contacted with acids and bases. Adequate prior knowledge of the material being tested should be used to establish appropriate personal protection and workspace ventilation.
3 The definition of "eluate" is used in this method to differentiate from the output solution of a
leaching test from the “leachate” solution collected from, or measured in, the field. The distinction between terms is made to minimize confusion when comparing laboratory results to field data (Ref. 2).

1313 - 6 Revision 1 July 2017
6.0 EQUIPMENT AND SUPPLIES
The mention of trade names or commercial products in this manual is for illustrative purposes only, and does not constitute an EPA endorsement or exclusive recommendation for use. The products and instrument settings cited in SW-846 methods represent those products and settings used during the method development or subsequently evaluated by the Agency. Glassware, reagents, supplies, equipment, and settings other than those listed in this manual may be employed provided that method performance appropriate for the intended application has been demonstrated and documented.
This section does not list common laboratory glassware (e.g., beakers and flasks) that might be used.
6.1 Extraction vessels
6.1.1 Twelve wide-mouth bottles (i.e., nine for test positions plus three for method blanks) constructed of inert material, resistant to high and low pHs and interaction with COPCs as described in the following sections.
6.1.1.1 For the evaluation of inorganic COPCs, bottles made of high density polyethylene (HDPE) (e.g., Nalgene #3140-0250 or equivalent), polypropylene (PP), or polyvinyl chloride (PVC) are recommended.
6.1.1.2 For the evaluation of non-volatile organic and mixed organic/inorganic COPCs, bottles made of glass or Type 316 stainless steel are recommended. Polytetrafluoroethylene (PTFE) is not recommended for non-volatile organics due to the sorption of species with high hydrophobicity (e.g., PAHs). Borosilicate glass is recommended over other types of glass, especially when inorganic analytes are of concern.
6.1.2 The extraction vessels must be of sufficient volume to accommodate both the solid sample and an extractant volume, based on an L/S of 10 ± 0.5 mL extractant/g-dry. The headspace in the bottle should be minimized to the extent possible when semivolatile organics are COPCs. For example, Table 1 indicates that 250-mL volume bottles are recommended when the minimum 20 g-dry mass equivalent is contacted with 200 mL of extractant.
6.1.3 The vessel must have a leak-proof seal that can sustain end-over-end tumbling for the duration of the designated contact time.
6.1.4 If centrifugation is anticipated to be beneficial for initial phase separation, the extraction vessels should be capable of withstanding centrifugation at 4000 ± 100 rpm for a minimum of 10 ± 2 min. Alternately, samples may be extracted in bottles that do not meet this centrifugation specification (e.g., Nalgene I-Chem #311-0250 or equivalent) and the solid-liquid slurries transferred into appropriate centrifugation vessels for phase separation as needed.
6.2 Balance – Capable of 0.01 g resolution for masses less than 500 g
6.3 Rotary tumbler – Capable of rotating the extraction vessels end-over-end at a constant speed of 28 ± 2 rpm (e.g., Environmental Express, Charleston, SC or equivalent)

1313 - 7 Revision 1 July 2017
NOTE: The holding capacity of tumblers may vary and modifications (e.g., packing or bottle-holding inserts) may be necessary to accommodate the extraction vessels.
6.4 Filtration apparatus – Pressure or vacuum filtration apparatus composed of appropriate materials to maximize collection of extracts and minimize loss of COPCs (e.g., Nalgene #300-4000 or equivalent) (see Sec. 6.1)
6.5 Filtration membranes – Composed of PP or equivalent material with an effective pore size of 0.45 µm (e.g., Gelman Sciences GH Polypro #66548 from Fisher Scientific or equivalent)
6.6 pH meter – Laboratory model capable of temperature compensation (e.g., Accumet 20, Fisher Scientific or equivalent) with a minimum resolution of 0.1 pH units
6.7 pH combination electrode – Composed of chemically resistant materials
6.8 Conductivity meter – Laboratory model (e.g., Accumet 20, Fisher Scientific or equivalent), with a minimum resolution of 5% of the measured value
6.9 Conductivity electrodes – Composed of chemically resistant materials
6.10 Adjustable-volume pipettor – Oxford Benchmate series or equivalent.
The necessary delivery range depends on the buffering capacity of the solid material and acid/base strength used in the test.
6.11 Disposable pipettor tips
6.12 Centrifuge (recommended) – Capable of centrifuging the extraction vessels at a rate of 4000 ± 100 rpm for 10 ± 2 min
7.0 REAGENTS AND STANDARDS
7.1 Reagent-grade chemicals, at a minimum, should be used in all tests. Unless otherwise indicated, all reagents should conform to the specifications of the Committee on Analytical Reagents of the American Chemical Society (ACS), where such specifications are available. Other grades may be used, provided the reagents are of sufficiently high purity to permit use without lessening the accuracy of the determination. Inorganic reagents and extracts should be stored in plastic to prevent interaction of constituents from glass containers. Organic reagents should be stored in glass to prevent leaching of contaminants from plastic containers.
7.2 Reagent water – Reagent water must be interference free. All references to water in this method refer to reagent water unless otherwise specified.
7.3 2.0 N HNO3 – Trace-metal grade or better, purchased at strength or prepared by diluting concentrated HNO3 with reagent water. Alternate solution normalities may be used as necessary. In such cases, the amounts of HNO3 solution added to samples should be adjusted based on the equivalents required in the schedule of acid/base additions (see Sec. 11.3).

1313 - 8 Revision 1 July 2017
7.4 1.0 N KOH – ACS grade, purchased at strength or prepared by diluting concentrated KOH solution with reagent water, or otherwise by dissolving 56.11 g of solid KOH in 1 L of reagent water. Alternate solution normalities may be used as necessary. In such cases, the amounts of KOH solution added to samples should be adjusted based on the equivalents required in the schedule of acid/base additions (see Sec. 11.3).
7.5 Consult Methods 9040 and 9050 for additional information regarding the preparation of reagents required for pH and specific conductance measurements.
8.0 SAMPLE COLLECTION, PRESERVATION, AND STORAGE
8.1 See Chapter Three, "Inorganic Analytes" and Chapter Four, "Organic Analytes" for sample collection and preservation instructions.
8.2 All solid samples should be collected using an appropriate sampling plan.
8.3 All containers should be composed of materials that minimize interaction with COPCs. For further information, see Chapters Three and Four.
8.4 Preservatives should not be added to samples before extraction.
8.5 Samples can be refrigerated, unless refrigeration results in an irreversible physical change to the sample.
8.6 Analytical extracts or leachates should be preserved according to the guidance given in the individual determinative methods for the COPCs.
8.7 Extract holding times should be consistent with the holding times specified in the individual determinative methods for the COPCs.
9.0 QUALITY CONTROL
9.1 Refer to Chapter One for guidance on quality assurance (QA) and quality control (QC) protocols. When inconsistencies exist between QC guidelines, method-specific QC criteria take precedence over both technique-specific criteria and Chapter One criteria, and technique-specific QC criteria take precedence over Chapter One criteria. Any effort involving the collection of analytical data should include development of a structured and systematic planning document, such as a quality assurance project plan (QAPP) or a sampling and analysis plan (SAP), which translates project objectives and specifications into directions for those who will implement the project and assess the results.
Each laboratory should maintain a formal QA program. The laboratory should also maintain records to document the quality of the data generated. Development of in-house QC limits for each method is encouraged. Use of instrument-specific QC limits is encouraged, provided such limits will generate data appropriate for use in the intended application. All data sheets and QC data should be maintained for reference or inspection.
1313 - 9 Revision 1 July 2017
9.2 In order to demonstrate the purity of reagents and sample contact surfaces, method blanks should be tested at the extremes of the acid and base additions, as well as when only reagent water (no acid or base addition) is used for extraction.
9.3 The analysis of extracts should follow appropriate QC procedures, as specified in the determinative methods for the COPCs. Refer to Chapter One for specific QC procedures.
9.4 Unless the "as-received" samples are part of a time-dependent (e.g., aging) study, solid materials should be processed and tested within one month of their receipt.
9.5 Initial demonstration of proficiency (IDP)
Leachate methods are not amenable to typical IDPs when reference materials with known values are not available. However, prior to using this method an analyst should have documented proficiency in the skills required for successful implementation of the method. For example, skill should be demonstrated in the use of an analytical balance, the determination of pH using Methods 9040 and 9045, and the determination of conductance using Method 9050.
10.0 CALIBRATION AND STANDARDIZATION
10.1 The balance should be calibrated and certified, at a minimum, annually or in accordance with laboratory policy.
10.2 Prior to measurement of eluate pH, the pH meter should be calibrated using a minimum of two standards that bracket the range of pH measurements. Refer to Methods 9040 and 9045 for additional guidance.
10.3 Prior to measurement of eluate conductivity, the meter should be calibrated using at least one standard at a value greater than the range of conductivity measurements. Refer to Method 9050 for additional guidance.
11.0 PROCEDURE
A flowchart for the method procedure is presented in Figure 1. Microsoft Excel® data templates are available to aid in collecting and archiving of laboratory and analytical data.4
11.1 Particle size reduction (if required)
11.1.1 In this method, particle size reduction is used for sample homogenization and to prepare large-grained samples for extraction so that the approach toward liquid-solid equilibrium is enhanced and mass transport through large particles is minimized. A longer extract contact time is required for larger maximum particle size designations. This method designates three maximum particle sizes and associated contact times (see Table 1). The selection of an
4 These Excel® templates form the basis for uploading method data into the data management program,
LeachXS Lite™. Both the data templates and LeachXS Lite™ are available at http://vanderbilt.edu/leaching.

1313 - 10 Revision 1 July 2017
appropriate maximum particle size from this table should be based on professional judgment regarding the practical effort required to size-reduce the solid material.
11.1.2 Particle size reduction of "as received" samples may be achieved through crushing, milling or grinding with equipment made from chemically inert materials. During the reduction process, care should be taken to minimize the loss of sample and potentially volatile constituents in the sample.
11.1.3 If the moisture content of the "as received" material is greater than 15% (wet basis), air drying or desiccation may be necessary. Oven drying is not recommended for the preparation of test samples due to the potential for mineral alteration and volatility loss. In all cases, the moisture content of the "as received" material should be recorded.
NOTE: If the solid material is susceptible to interaction with the atmosphere (e.g., carbonation, oxidation), drying should be conducted in an inert environment.
11.1.4 When the material appears to be of a relatively uniform particle size, calculate the percentage less than the sieve size as follows:
%100Passing% ×=total
sieved
MM
Where: Msieved = mass of sample passing the sieve (g) Mtotal = mass of total sample (g) (e.g., Msieved + mass not passing sieve)
11.1.5 The fraction retained by the sieve should be recycled for further particle size reduction until at least 85% of the initial mass has been reduced below the designated maximum particle size. Calculate and record the final percentage passing the sieve and the designated maximum particle size. For the uncrushable fraction of the "as received" material, record the fraction mass and nature (e.g., rock, metal or glass shards, etc.).
11.1.6 Store the size-reduced material in an airtight container in order to prevent contamination via gas exchange with the atmosphere. Store the container in a cool, dark, and dry place prior to use.
11.2 Determination of solids and moisture content
11.2.1 In order to provide the dry mass equivalent of the "as-tested" material, the solids content of the subject material should be determined. Often, the moisture content of the solid sample is recorded. In this method, the moisture content is determined and recorded on the basis of the "wet" or "as-tested" sample.
WARNING: The drying oven should be contained in a hood or otherwise properly ventilated. Significant laboratory contamination or inhalation hazards may result when drying heavily contaminated samples. Consult the laboratory safety officer for proper handling procedures prior to drying samples that may contain volatile, hazardous, flammable or explosive materials.
1313 - 11 Revision 1 July 2017
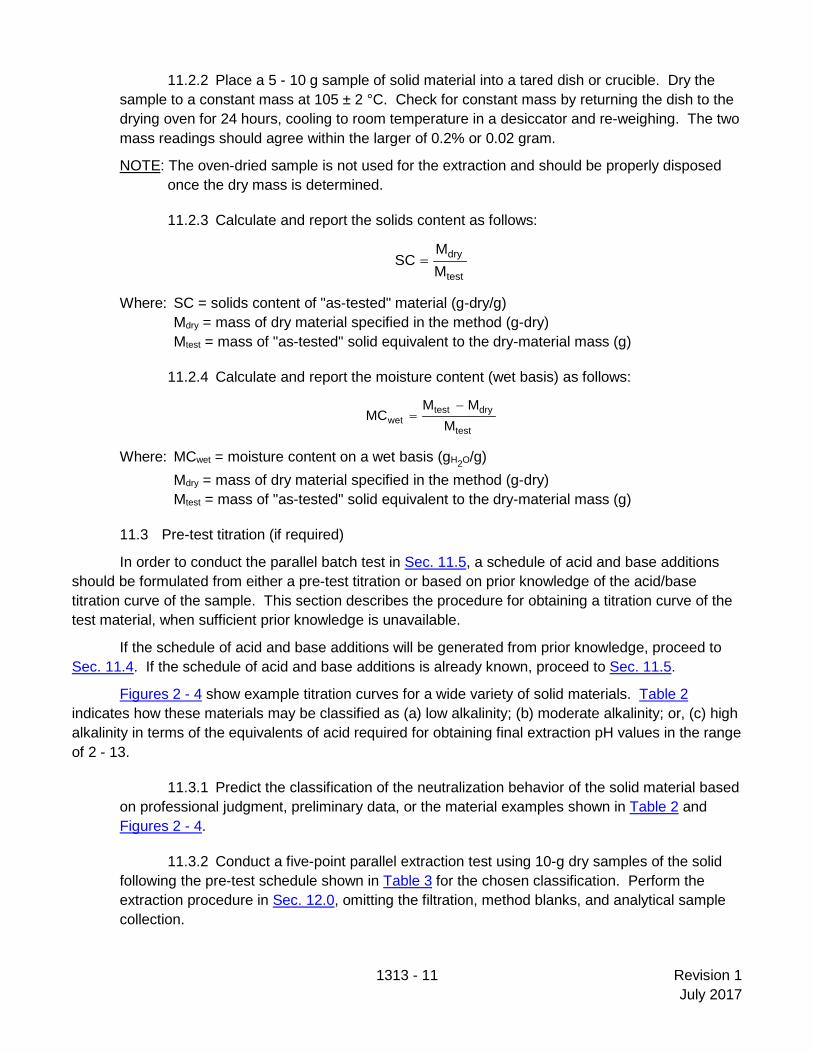
11.2.2 Place a 5 - 10 g sample of solid material into a tared dish or crucible. Dry the sample to a constant mass at 105 ± 2 °C. Check for constant mass by returning the dish to the drying oven for 24 hours, cooling to room temperature in a desiccator and re-weighing. The two mass readings should agree within the larger of 0.2% or 0.02 gram.
NOTE: The oven-dried sample is not used for the extraction and should be properly disposed once the dry mass is determined.
11.2.3 Calculate and report the solids content as follows:
test
dry
MM
SC =
Where: SC = solids content of "as-tested" material (g-dry/g) Mdry = mass of dry material specified in the method (g-dry) Mtest = mass of "as-tested" solid equivalent to the dry-material mass (g)
11.2.4 Calculate and report the moisture content (wet basis) as follows:
test
drytestwet M
MMMC
−=
Where: MCwet = moisture content on a wet basis (gH2O/g) Mdry = mass of dry material specified in the method (g-dry) Mtest = mass of "as-tested" solid equivalent to the dry-material mass (g)
11.3 Pre-test titration (if required)
In order to conduct the parallel batch test in Sec. 11.5, a schedule of acid and base additions should be formulated from either a pre-test titration or based on prior knowledge of the acid/base titration curve of the sample. This section describes the procedure for obtaining a titration curve of the test material, when sufficient prior knowledge is unavailable.
If the schedule of acid and base additions will be generated from prior knowledge, proceed to Sec. 11.4. If the schedule of acid and base additions is already known, proceed to Sec. 11.5.
Figures 2 - 4 show example titration curves for a wide variety of solid materials. Table 2 indicates how these materials may be classified as (a) low alkalinity; (b) moderate alkalinity; or, (c) high alkalinity in terms of the equivalents of acid required for obtaining final extraction pH values in the range of 2 - 13.
11.3.1 Predict the classification of the neutralization behavior of the solid material based on professional judgment, preliminary data, or the material examples shown in Table 2 and Figures 2 - 4.
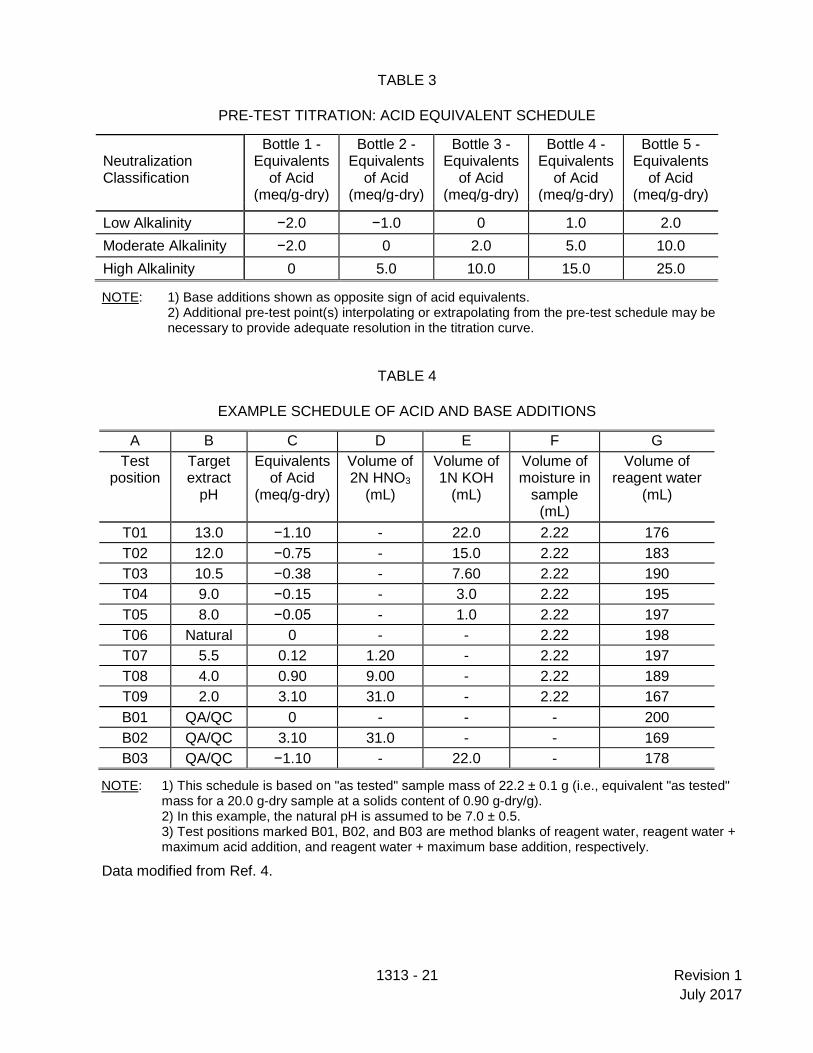
11.3.2 Conduct a five-point parallel extraction test using 10-g dry samples of the solid following the pre-test schedule shown in Table 3 for the chosen classification. Perform the extraction procedure in Sec. 12.0, omitting the filtration, method blanks, and analytical sample collection.

1313 - 12 Revision 1 July 2017
11.3.3 Plot the pre-test titration curve (e.g., the extract pH as a function of the equivalents of acid added) considering base equivalents as the negative sign of acid equivalents.
11.3.4 Reiterate the pre-test extraction, if necessary to expand or contract the pre-test titration until the 2 - 13 pH range can be resolved.
NOTE: Additional pre-test point(s) interpolating or extrapolating from the pre-test schedule may be necessary to provide adequate resolution in the titration curve.
11.3.5 Pre-test titration using provided Microsoft Excel® template
The "Pre-Test" worksheet in the accompanying Excel® template may be used to calculate pre-test extraction formulations and plot the pre-test titration curve. Mandatory input data for the template includes:
a) particle size of the "as tested" material (see Sec. 11.1)
b) solids content of the "as tested" material (see Sec. 11.2)
c) five acid/base additions based on the predicted response classification of the solid material (see Sec. 11.3)
Enter the eluate pH and plot the pre-test titration curve. Compare the resulting titration curve to the target pH values as designated in Table 4.
11.4 Formulation of acid and base additions schedule
A schedule of acid and base additions is used in the main extraction procedure (Sec. 11.5) to set up nine extractions of the test material plus three method blanks. Based on either prior knowledge of the acid/base titration curve of the sample or the results of the pre-test titration procedure in Sec. 11.3, formulate a schedule of test extractions using the example in Table 4 and the following steps.
11.4.1 Using the extraction parameters in Table 1, identify the recommended minimum dry-mass equivalent associated with the particle size of the "as-tested" sample. Calculate and record the amount of "as tested" material equivalent to the dry-material mass from Table 1 as follows:
SCM
M drytest =
Where: Mtest = mass of "as-tested" solid equivalent to the dry-material mass (g) Mdry = mass of dry material specified in the method (g-dry) SC = solids content of "as-tested" material (g-dry/g)
11.4.2 Label Column A of the schedule table with consecutive numbers for the nine test positions (shown in Table 4 as "TXX" labels) and three method blanks (shown in Table 4 as "BXX" labels).
11.4.3 Select the nine target pH points as shown in Table 5 and enter this data into Column B of the schedule table. One of the nine target pH values should be with no acid or base addition in order to record the natural pH of the material. The target pH points shown in

1313 - 13 Revision 1 July 2017
Table 5 allow for substitution of one optional target point if the natural pH of the solid material falls within the tolerance of another designated target pH. For example, if the natural pH is 11.8 and would satisfy the target pH of 12.0 ± 0.5, the optional target point of 10.5 ± 0.5 should be included.
11.4.4 For each test position, determine the equivalents of acid or base required to meet the target pH from the pre-test titration curve (see Sec. 11.3). Enter this data into Column C of the schedule table. Interpolate intermediate acid additions on the pre-test titration curve using linear interpolation or other regression techniques.
NOTE: Linear interpolation will have some inherent error, which may result in an extract pH that falls outside of the target pH tolerance. Additional pre-test points interpolating or extrapolating from the pre-test schedule in Table 3 may be necessary to provide adequate resolution of the titration curve.
11.4.5 Enter the acid volumes in Column D and base volumes in Column E of the schedule after converting the equivalents of acid and base to volume as follows:
b/a
b/ab/a N
EqV =
Where: Va/b = volume of acid or base to be entered in the schedule table (mL) Eqa/b = equivalents of acid or base selected for the target pH as determined from the
pre-test titration curve (meq/g) Na/b = normality of the acid or base solution (meq/mL)
11.4.6 In Column F of the schedule table, calculate the volume of moisture contained in the "as tested" sample as follows:
( )w
testsampleW
SCMVρ
−×=
1,
Where: VW,sample = volume of water in the "as tested" sample (mL) Mtest = mass of "as-tested" solid equivalent to the dry-material mass (g) SC = solids content of "as-tested" material (g-dry/g) ρw = density of water (1.0 g/mL at room temperature)
11.4.7 In Column G of the schedule table, calculate the volume of reagent water required to bring each extraction to a L/S of 10 mL/g-dry solid as follows:
b/asample,WdryRW VVLSMV −−×=
Where: VRW = volume of reagent water required to complete L/S (mL) Mdry = mass of dry material specified in the method (g-dry) LS = liquid-to-dry-solid ratio (10 mL/g) VW,sample = volume of water in "as tested" sample (mL) Va/b = volume of acid or base for the extraction recipe (mL)
11.4.8 Method Blanks

1313 - 14 Revision 1 July 2017
In the schedule table, include three additional extractions for processing method blanks. Method blank extractions are performed using the same equipment, reagents, and extraction process as the test positions, but without solid sample. The three method blanks should include:
a) reagent water (B01 in Table 4);
b) reagent water + maximum volume of acid in the schedule (B02 in Table 4); and,
c) reagent water + maximum volume of base in the schedule (B03 in Table 4).
NOTE: If multiple materials or replicate tests are carried out in parallel, only one set of method blanks is necessary.
11.4.9 Schedule formulation using Excel® template
The "Test Data" Microsoft Excel® spreadsheet template available at http://www.vanderbilt.edu/leaching/downloads/test-methods/ may be used to automatically calculate a schedule of acid and base additions, as well as to plot the response eluate pH and conductivity as a function of acid addition. Mandatory input data for the template includes:
a) particle size of the "as tested" material (see Sec. 11.1)
b) solid content of the "as tested" material (see Sec. 11.2)
c) nine acid/base additions determined from the pre-test titration curve with respect to target pH values designated in Table 5
Subsequent to the extraction procedure, eluate pH, conductivity, and oxidation/reduction potential (ORP) (optional) for up to three replicates may be entered and plotted as a function of acid added.
11.5 Extraction procedure – Use the schedule of acid and base additions (Sec. 11.4) as a guide to set up nine test extractions and three method blanks as follows:
11.5.1 Label nine bottles with test position numbers and three bottles with method blank labels according to the schedule of acid and base additions (see Column A in Table 4).
11.5.2 Use the extraction parameters in Table 1 to identify the recommended dry-mass equivalent associated with the particle size of the “as tested“ sample. Calculate and record the amount of “as tested“ material equivalent to the identified dry mass from Table 1 as follows:
SCM
M drytest =
Where: Mtest = mass of "as-tested" solid equivalent to the dry-material mass (g) Mdry = mass of dry material specified in the method (g-dry) SC = solids content of "as-tested" material (g-dry/g)
11.5.3 Place the dry equivalent mass (± 0.1 g) of the "as tested" sample, calculated above, into each of the nine test position extraction vessels.
NOTE: Do NOT put solid material in the method blank extraction vessels.

1313 - 15 Revision 1 July 2017
11.5.4 Add the appropriate volume of reagent water (± 5% of target value) to both the test position and method blank extraction vessels, as specified in the schedule for the L/S makeup (see Column G in Table 4).
11.5.5 Add the appropriate volume of acid or base (± 1% of target value) to each vessel, using a continuously adjustable pipettor, as designated in the schedule for acid/base addition (see Column D and Column E in Table 4).
11.5.6 Tighten the leak-proof lid on each bottle and tumble all extractions (i.e., test positions and method blanks) in an end-over-end fashion at a speed of 28 ± 2 rpm at room temperature (20 ± 2 °C). The contact time for this method will vary depending on the sample particle size as shown in Table 1.
NOTE: The length of the contact time is designed to enhance the approach toward liquid-solid equilibrium. Longer contact times are required for larger particles to compensate for the effects of intra-particle diffusion. See Table 1 for recommended contact times based on particle size.
11.5.7 Remove the extraction vessels from the rotary tumbler and clarify the extractants by allowing the bottles to stand for 15 ± 5 min. Alternately, centrifuge the extraction vessels at 4000 ± 100 rpm for 10 ± 2 min.
11.5.8 For each extract vessel, decant a minimum volume (~ 5 mL) of clear, unpreserved supernatant into a clean container.
11.5.9 Measure and record the pH, specific conductivity, and ORP of the extracts (see Methods 9040, 9045, and 9050).
NOTE: Measurement of pH, conductivity and ORP should be taken within 15 minutes of eluate processing (Sec. 11.5.10) to avoid neutralization of the solution due to exposure to carbon dioxide, especially when alkaline materials are tested.
NOTE: The measurement of ORP is optional, but strongly recommended, especially when testing materials where oxidation is likely to change the LSP of COPCs.
11.5.10 Separate the solid from the remaining liquid in each extraction vessel by pressure or vacuum filtration through a clean 0.45 µm pore-size membrane (Sec. 6.5). The filtration apparatus may be exchanged for a clean apparatus as often as necessary until all liquid has been filtered.
NOTE: If COPCs which might be lost under vacuum (e.g., mercury) are suspected, the samples should be pressure-filtered using an inert gas (e.g., nitrogen or argon).
11.5.11 Immediately preserve and store the volume(s) of eluate required for chemical analysis. Preserve all analytical samples in a manner that is consistent with the determinative chemical analyses to be performed.

1313 - 16 Revision 1 July 2017
12.0 DATA ANALYSIS AND CALCULATIONS
12.1 Data reporting
12.1.1 Figure 5 shows an example of a data sheet that may be used to report the concentration results of this method. At a minimum, the basic test report should include:
a) Name of the laboratory
b) Laboratory technical contact information
c) Date and time at the start of the test
d) Name or code of the solid material
e) Particle size (85 wt% less than designated particle size)
f) Type of acid and/or base used in test
g) Extraction contact time (h)
h) Ambient temperature during extraction (°C)
i) Eluate specific information (see Sec. 12.1.2 below)
12.1.2 The minimum set of data that should be reported for each eluate includes:
a) Eluate sample ID
b) Mass of "as tested" solid material used (g)
c) Moisture content of material used (gH2O/g)
d) Volume (mL) and normality (N) of acid and/or base used
e) Volume of water added (mL)
f) Target pH
g) Measured final eluate pH
h) Measured eluate conductivity (mS/cm)
i) Measured ORP (mV) (optional)
j) Concentrations of all COPCs
k) Analytical QC qualifiers as appropriate
12.2 Data interpretation (optional)
12.2.1 Acid/base neutralization curve
Plot the pH of each extract as a function of the equivalents of acid or base added per dry gram of material to generate an acid/base neutralization curve.
NOTE: For materials in which both acid and base were used, equivalents of base can be presented as the opposite sign of acid equivalents (i.e., 5 meq/g-dry of base would correspond to −5 meq/g-dry of acid).
The titration curve can be interpreted as showing the amount of acid or base that is needed to shift the pH of the subject material. This is helpful when evaluating field scenarios where the pH of leachates is not buffered by the acidity or alkalinity of the solid material.

1313 - 17 Revision 1 July 2017
12.2.2 LSP curve
An LSP curve can be generated for each COPC following chemical analyses of all extracts by plotting the target analyte concentration in the liquid phase as a function of the measured extract pH for each extract. As an example, Figure 6 illustrates the LSP curves for arsenic and selenium from a coal combustion fly ash and indicates the limits of quantitation and the natural concentration response.
12.2.2.1 The lower limit of quantitation (LLOQ) of the determinative method for each COPC may be shown as a horizontal line. COPC concentrations below this line indicate negligible or non-quantitative concentrations.
NOTE: This method is for the generation of extract solution and does not specify any particular analytical method. Since the LLOQ is highly dependent on both the chosen analytical method and the solution matrix, it should be determined as part of an analytical QA/QC plan.
12.2.2.2 Natural response is defined as the eluate pH and COPC concentration measured when the solid material is extracted with reagent water at an L/S of 10 mL/g-dry. The natural response values can be shown on the LSP curve as a vertical line from the x-axis (at the replicate average natural pH) intersected with a horizontal line (at the replicate average COPC concentration). Alternatively, the natural response can be indicated in results using a different symbol from other results.
12.2.2.3 The values on the curve indicate the eluate concentration of the constituent of interest at an L/S of 10 mL/g-dry over a pH range. The shape of the LSP curve is indicative of the speciation of the COPC in the solid phase with four characteristic LSP curve shapes (i.e., relative locations of maxima and minima) presented schematically in Figure 7.
Cationic Species (e.g., Cd) – The LSP curve of cationic species typically has a maximum concentration in the acidic pH range that decreases to lower values at alkaline pH.
Amphoteric Species (e.g., Pb, Cr(III), Cu) – The LSP curves tend to be similar in shape to cationic LSP curves with greater concentrations in the acidic pH range. However, the concentrations pass through a minimum in the near neutral to slightly acid pH range only to increase again for alkaline pH values. Typically, the increase at high pH is due to the solubility of hydroxide complexes (e.g., [Pb(OH3)]−).
Oxyanionic Species (e.g., [AsO4]−, [SeO4]−, [MnO4]−) – The LSP curves often show maxima in the neutral to slightly alkaline range.
Highly Soluble Species (e.g., Na+, K+, Cl−) – The LSP curve is only a weak function of pH.
The idealized LSP curves in Figure 7 can be compared with the general shape of the test data to infer the speciation of the COPC in the solid matrix. Concentration results from this method may be simulated with geochemical speciation models to infer the mineral phases, adsorption reactions, and soluble complexes that control the release of the COPC (see Ref. 9).

1313 - 18 Revision 1 July 2017
13.0 METHOD PERFORMANCE
13.1 Performance data and related information are provided in SW-846 methods only as examples and guidance. The data do not represent required performance criteria for users of the methods. Instead, performance criteria should be developed on a project-specific basis, and the laboratory should establish in-house QC performance criteria for the application of this method. Performance data must not be used as absolute QC acceptance criteria for purposes of laboratory QC or accreditation.
13.2 Interlaboratory validation of this method was conducted using a coal combustion fly ash (material code EaFA), a contaminated smelter site soil (material code CFS) and a solidified waste analog (material code SWA). The median values and inner quartile ranges (IQRs) for repeatability and reproducibility were determined for eluate concentration results across all study materials and pH target values (see Table 3). More details on the interlaboratory validation may be found in Ref. 2.
13.3 Ref. 1 and Ref. 4 may provide additional guidance and insight on the use, performance, and application of this method.
14.0 POLLUTION PREVENTION
14.1 Pollution prevention encompasses any technique that reduces or eliminates the quantity and/or toxicity of waste at the point of generation. Numerous opportunities for pollution prevention exist in laboratory operations. The EPA has established a preferred hierarchy of environmental management techniques that places pollution prevention as the management option of first choice. Whenever feasible, laboratory personnel should use pollution prevention techniques to address their waste generation. When wastes cannot be feasibly reduced at the source, the Agency recommends recycling as the next best option.
14.2 For information about pollution prevention that may be applicable to laboratories and research institutions consult Less is Better: Laboratory Chemical Management for Waste Reduction, a free publication available from the ACS, Committee on Chemical Safety, https://www.acs.org/content/dam/acsorg/about/governance/committees/chemicalsafety/publications/less-is-better.pdf.
15.0 WASTE MANAGEMENT
The EPA requires that laboratory waste management practices be conducted consistent with all applicable rules and regulations. Laboratories are urged to protect the air, water, and land by minimizing and controlling all releases from hoods and bench operations, complying with the letter and spirit of any sewer discharge permits and regulations, and by complying with all solid and hazardous waste regulations, particularly the hazardous waste identification rules and land disposal restrictions. For further information on waste management, consult The Waste Management Manual for Laboratory Personnel available at: http://www.labsafetyinstitute.org/FreeDocs/WasteMgmt.pdf.

1313 - 19 Revision 1 July 2017
16.0 REFERENCES
1. A.C. Garrabrants, D.S. Kosson, H.A. van der Sloot, F. Sanchez, and O. Hjelmar, "Background Information for the Leaching Environmental Assessment Framework (LEAF) Test Methods," EPA/600/R-10-170, U.S. Environmental Protection Agency, Washington, DC, 2010.
2. A.C. Garrabrants, D.S. Kosson, L. Stefanski, R. DeLapp, P.F.A.B. Seignette, H.A. van der Sloot, P. Kariher, and M. Baldwin, "Interlaboratory Validation of the Leaching Environmental Assessment (LEAF) Method 1313 and Method 1316," EPA 600/R-12/623, U.S. Environmental Protection Agency, Washington, DC, 2012.
3. D.S. Kosson, F. Sanchez, P. Kariher, L.H. Turner, R. DeLapp, and P. Seignette, "Characterization of Coal Combustion Residues from Electric Utilities – Leaching and Characterization Data," EPA-600/R-09/151, U.S. Environmental Protection Agency, Washington, DC, 2009.
4. D.S. Kosson, H.A. van der Sloot, F. Sanchez, and A.C. Garrabrants, "An Integrated Framework for Evaluating Leaching in Waste Management and Utilization of Secondary Materials," Environmental Engineering Science,, 19(3) 159-204, 2002.
5. CEN/TS 14429, "Characterization of Waste – Leaching Behaviour Tests – Influence of pH on Leaching with Continuous pH Control," Comité Européen de Normalisation, Brussels, Belgium, 2005.
6. CEN/TS 14429, "Characterization of Waste – Leaching Behaviour Tests – Influence of pH on Leaching with Initial Acid/base Addition," Comité Européen de Normalisation, Brussels, Belgium, 2005.
7. F. Sanchez, R. Keeney, D.S. Kosson, and R. DeLapp, "Characterization of Mercury-Enriched Coal Combustion Residues from Electric Utilities Using Enhanced Sorbents for Mercury Control," EPA-600/R-06/008, U.S. Environmental Protection Agency, Washington, DC, 2006.
8. F. Sanchez, D.S. Kosson, R. Keeney, R. DeLapp, L. Turner, and P. Kariher, "Characterization of Coal Combustion Residues from Electric Utilities Using Wet Scrubbers for Multi-Pollutant Control," EPA-600/R-08/077, U.S. Environmental Protection Agency, Washington, DC, 2008.
9. H.A. van der Sloot, P.F.A.B. Seignette, J.C.L. Meeussen, O. Hjelmar, and D.S. Kosson, (2008), "A Database, Speciation Modeling and Decision Support Tool for Soil, Sludge, Sediments, Wastes and Construction Products: LeachXS™- ORCHESTRA," Second International Symposium on Energy from Biomass and Waste, Venice, Italy, (also see www.leaching.com).
17.0 TABLES, DIAGRAMS, FLOWCHARTS, AND VALIDATION DATA
The following pages contain the tables and figures referenced by this method.

1313 - 20 Revision 1 July 2017
TABLE 1
EXTRACTION PARAMETERS AS FUNCTION OF MAXIMUM PARTICLE SIZE
Particle Size (85 wt% less than)
US Sieve Size
Minimum Dry Mass
Contact Time
Suggested Vessel Size (mm) (g-dry) (h) (mL)
0.3 50 20 ± 0.02 24 ± 2 250 2.0 10 40 ± 0.02 48 ± 2 500 5.0 4 80 ± 0.02 72 ± 2 1000
TABLE 2
MATERIAL NEUTRALIZATION CLASSIFICATIONS
Neutralization Classification
Material Types
Low Alkalinity soils; sediments; CCR fly ash; CCR bottom ash; coal milling rejects; MSWI fly ash; MSWI bottom ash; sewage sludge-amended soil
Moderate Alkalinity soils; wood preserving waste; MSWI bottom ash; steel slag; electric arc furnace dust; MSW compost; nickel sludge; Portland cement mortar
High Alkalinity Portland cement clinker; steel blast furnace slag; solidified waste (fly ash, blast furnace slag, Portland cement)
NOTE: CCR = coal combustion residue
MSWI = municipal solid waste incinerator
1313 - 21 Revision 1 July 2017
TABLE 3
PRE-TEST TITRATION: ACID EQUIVALENT SCHEDULE
Neutralization Classification
Bottle 1 - Equivalents
of Acid (meq/g-dry)
Bottle 2 - Equivalents
of Acid (meq/g-dry)
Bottle 3 - Equivalents
of Acid (meq/g-dry)
Bottle 4 - Equivalents
of Acid (meq/g-dry)
Bottle 5 - Equivalents
of Acid (meq/g-dry)
Low Alkalinity −2.0 −1.0 0 1.0 2.0 Moderate Alkalinity −2.0 0 2.0 5.0 10.0 High Alkalinity 0 5.0 10.0 15.0 25.0
NOTE: 1) Base additions shown as opposite sign of acid equivalents. 2) Additional pre-test point(s) interpolating or extrapolating from the pre-test schedule may be necessary to provide adequate resolution in the titration curve.
TABLE 4
EXAMPLE SCHEDULE OF ACID AND BASE ADDITIONS
A B C D E F G Test
position Target extract
pH
Equivalents of Acid
(meq/g-dry)
Volume of 2N HNO3
(mL)
Volume of 1N KOH
(mL)
Volume of moisture in
sample (mL)
Volume of reagent water
(mL)
T01 13.0 −1.10 - 22.0 2.22 176 T02 12.0 −0.75 - 15.0 2.22 183 T03 10.5 −0.38 - 7.60 2.22 190 T04 9.0 −0.15 - 3.0 2.22 195 T05 8.0 −0.05 - 1.0 2.22 197 T06 Natural 0 - - 2.22 198 T07 5.5 0.12 1.20 - 2.22 197 T08 4.0 0.90 9.00 - 2.22 189 T09 2.0 3.10 31.0 - 2.22 167 B01 QA/QC 0 - - - 200 B02 QA/QC 3.10 31.0 - - 169 B03 QA/QC −1.10 - 22.0 - 178
NOTE: 1) This schedule is based on "as tested" sample mass of 22.2 ± 0.1 g (i.e., equivalent "as tested" mass for a 20.0 g-dry sample at a solids content of 0.90 g-dry/g). 2) In this example, the natural pH is assumed to be 7.0 ± 0.5. 3) Test positions marked B01, B02, and B03 are method blanks of reagent water, reagent water + maximum acid addition, and reagent water + maximum base addition, respectively.
Data modified from Ref. 4.

1313 - 22 Revision 1 July 2017
TABLE 5
FINAL EXTRACT PH TARGETS
pH Target Rationale
? Natural pH at L/S 10 mL/g-dry (no acid/base addition)
2.0 ± 0.5 Provides estimates of total or available COPC content
4.0 ± 0.5 Lower pH limit of typical management scenario
5.5 ± 0.5 Typical lower range of industrial waste landfills
7.0 ± 0.5 Neutral pH region; high release of oxyanions
8.0 ± 0.5 Endpoint pH of carbonated alkaline materials
9.0 ± 0.5 Minimum of LSP curve for many cationic and amphoteric COPCs
12.0 ± 0.5 Maximum in alkaline range for LSP curves of amphoteric COPCs
13.0 ± 0.5 Upper bound (field conditions) for amphoteric COPCs
10.5 ± 0.5 Substitution if natural pH falls within range of a mandatory target

1313 - 23 Revision 1 July 2017
TABLE 6
MEDIAN METHOD PRECISION ACROSS STUDY MATERIALS
Analyte Symbol Repeatability – Median %RSDr
Repeatability – IQR %RSDr
Reproducibility – Median %RSDR
Reproducibility – IQR %RSDR
Antimony Sb 16% 12-25% 33% 24-45% Arsenic As 19% 13-24% 47% 37-61% Barium Ba 10% 7-15% 22% 18-36% Boron B 7% 5-9% 12% 8-21% Calcium Ca 5% 4-11% 9% 6-28% Molybdenum Mo 15% 6-23% 30% 18-46% Selenium Se 9% 6-13% 21% 18-31% Vanadium V 10% 6-12% 27% 23-41% Median of Medians
― 10% 4-25% 26% 6-61%
Data taken from Ref. 2.

1313 - 24 Revision 1 July 2017
FIGURE 1
METHOD FLOWCHART

1313 - 25 Revision 1 July 2017
FIGURE 2
EXAMPLE TITRATION CURVES FOR SELECTED "LOW ALKALINITY" WASTES
Some data taken LeachXS™ database (Ref. 9).

1313 - 26 Revision 1 July 2017
FIGURE 3
EXAMPLE TITRATION CURVES FOR SELECTED "MODERATE ALKALINITY" WASTES
Some data taken from LeachXS™ database (Ref. 9).

1313 - 27 Revision 1 July 2017
FIGURE 4
EXAMPLE TITRATION CURVES FOR SELECTED "HIGH ALKALINITY" WASTES
Some data taken from LeachXS™ database (Ref. 9).

1313 - 28 Revision 1 July 2017
FIGURE 5
EXAMPLE DATA REPORT FORMAT

1313 - 29 Revision 1 July 2017
FIGURE 6
EXAMPLE LSP CURVES FROM A COAL COMBUSTION FLY ASH SHOWING ASSESSMENT ZONES FOR A LANDFILL SCENARIO
Figure taken from Ref. 7.

1313 - 30 Revision 1 July 2017
FIGURE 7
SCHEMATIC LSP CURVES OF CATIONIC, AMPHOTERIC, AND OXYANIONIC SPECIES
Figure taken from Ref. 4.